Life Expectancy - oicstatcom.org · Example of Complete Life Table Sumber: Depertment Statistics of...
52
BPS-Statistics Indonesia Life Expectancy Islamabad, Pakistan 18-20 September, 2017
Transcript of Life Expectancy - oicstatcom.org · Example of Complete Life Table Sumber: Depertment Statistics of...
BPS-Statistics Indonesia
Life Expectancy
Islamabad, Pakistan 18-20 September, 2017
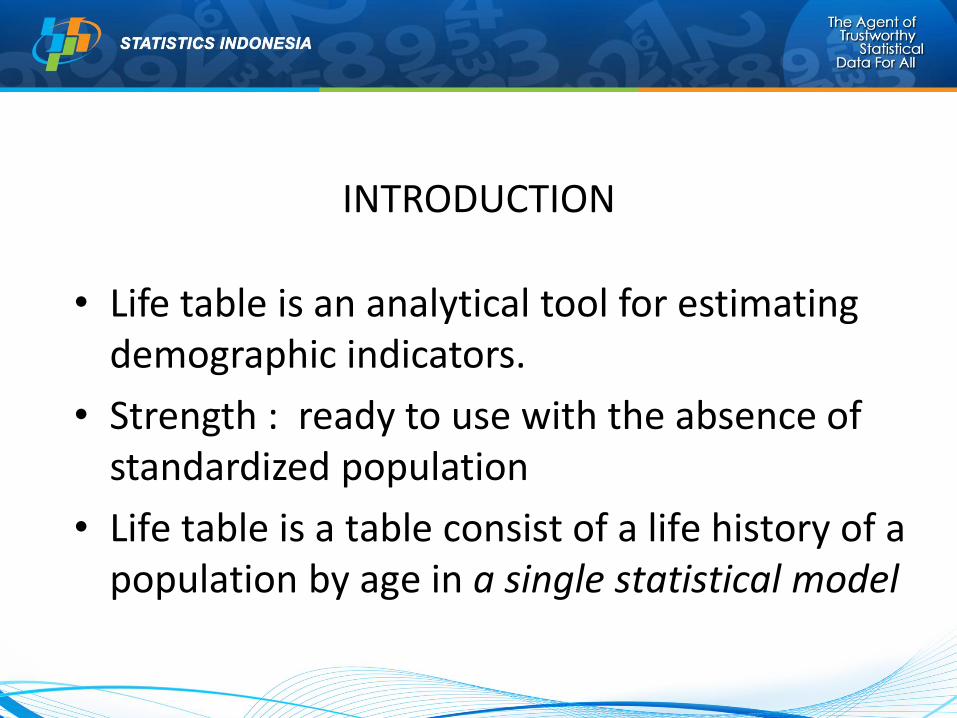
INTRODUCTION
• Life table is an analytical tool for estimating demographic indicators.
• Strength : ready to use with the absence of standardized population
• Life table is a table consist of a life history of a population by age in a single statistical model
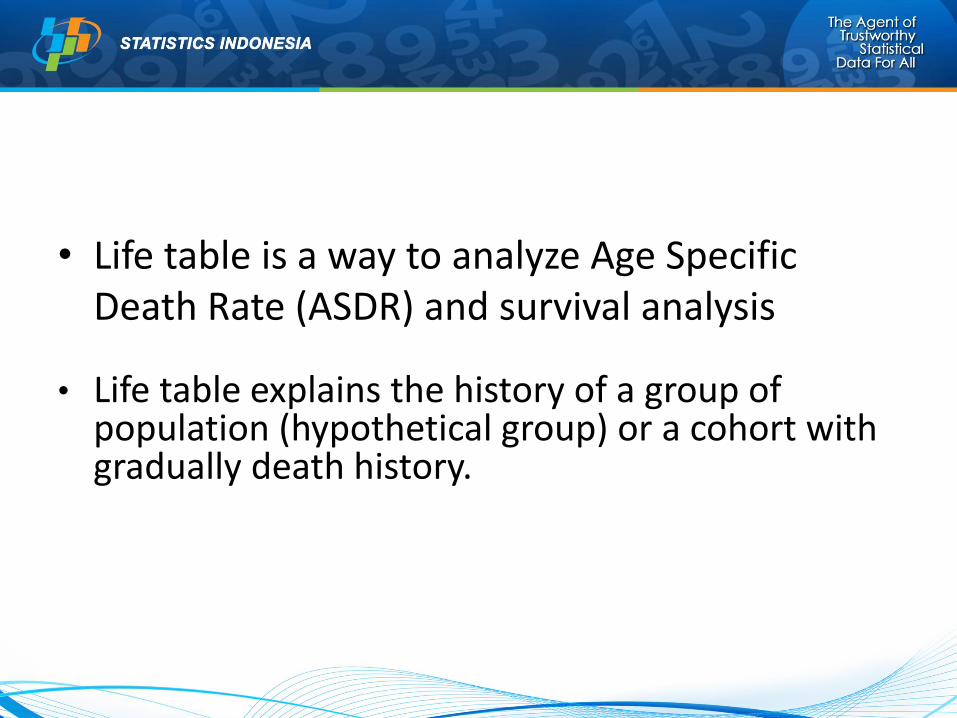
• Life table is a way to analyze Age Specific Death Rate (ASDR) and survival analysis
• Life table explains the history of a group of population (hypothetical group) or a cohort with gradually death history.
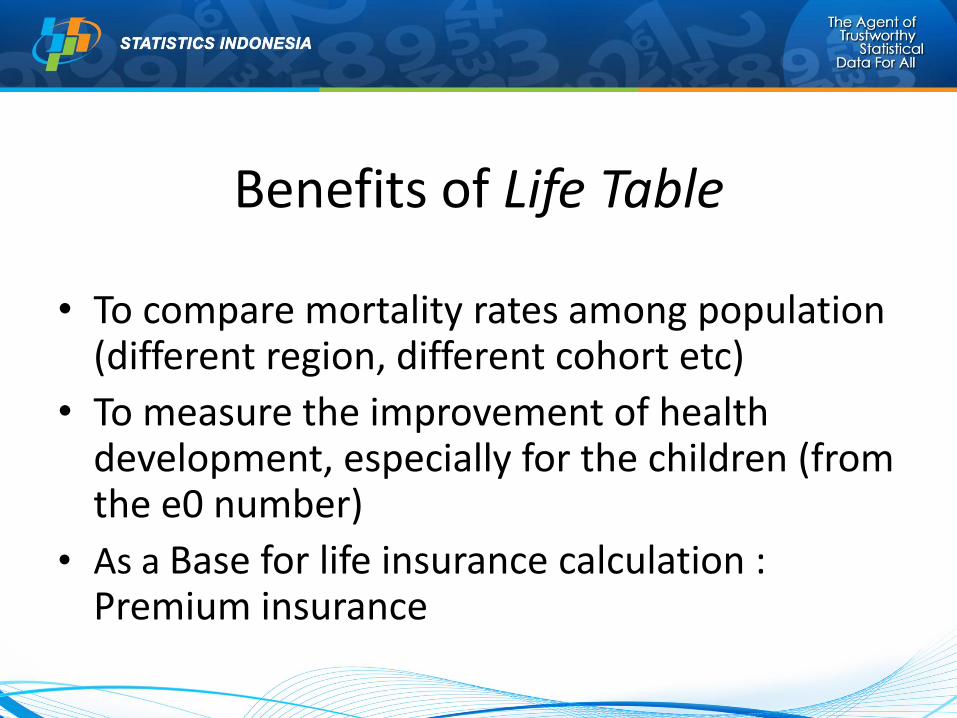
Benefits of Life Table
• To compare mortality rates among population (different region, different cohort etc)
• To measure the improvement of health development, especially for the children (from the e0 number)
• As a Base for life insurance calculation : Premium insurance
• The World Health Organization (WHO) began producing annual life tables for all Member States in 1999.
• These life tables are a basic input to all WHO estimates of global, regional and country-level patterns and trends in all-cause and cause-specific mortality.
Types of Life Table
1.Complete life table
2. Abridged life table
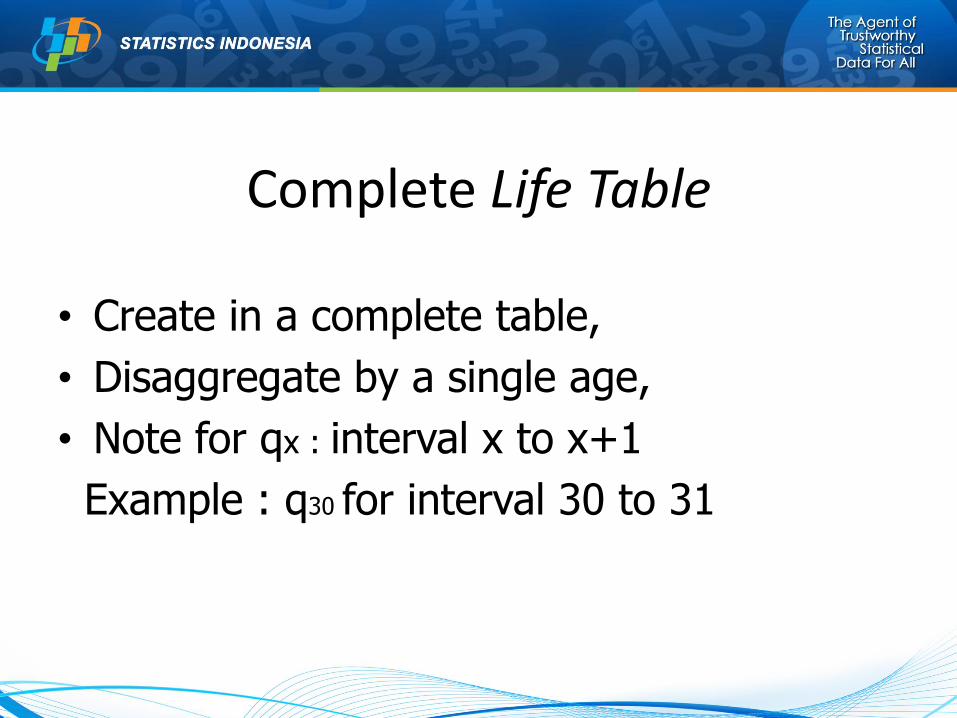
Complete Life Table
• Create in a complete table,
• Disaggregate by a single age,
• Note for qx : interval x to x+1
Example : q30 for interval 30 to 31
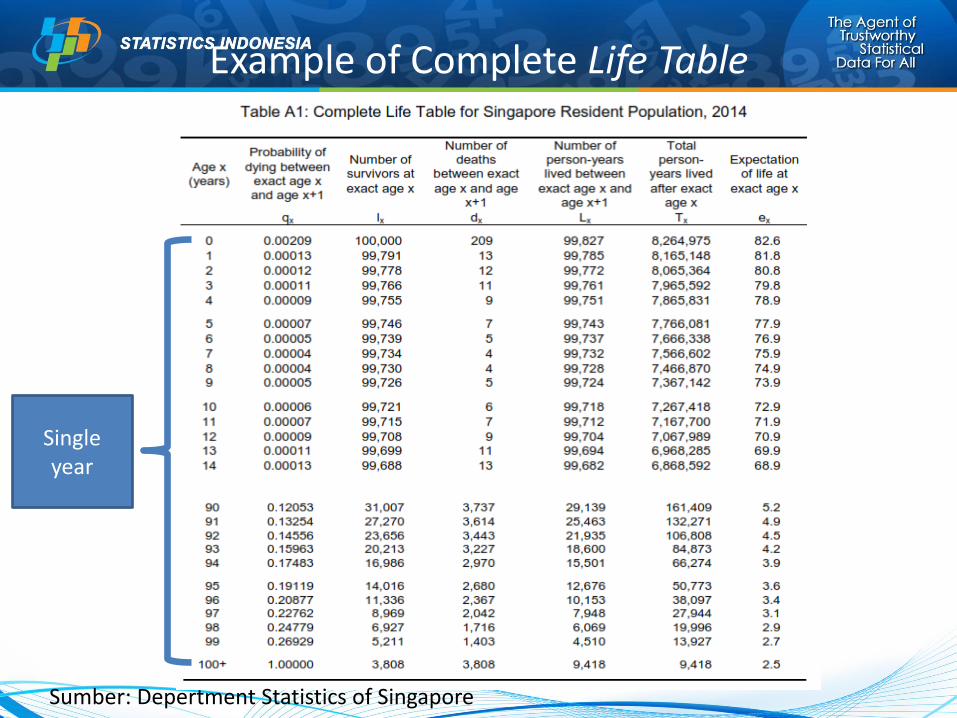
Example of Complete Life Table
Sumber: Depertment Statistics of Singapore
Single year
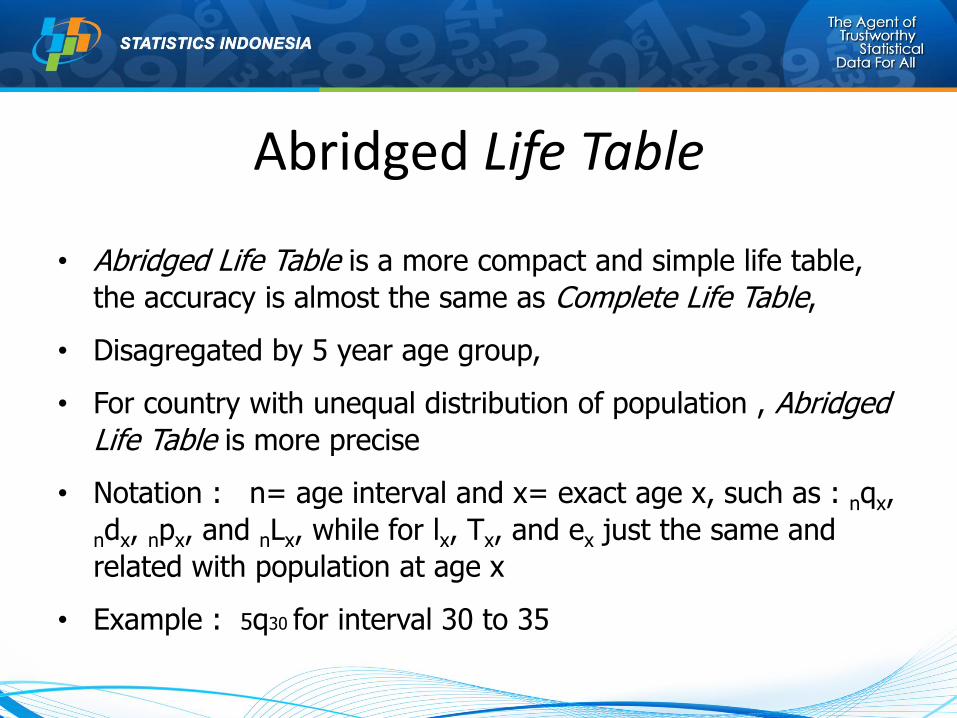
Abridged Life Table
• Abridged Life Table is a more compact and simple life table,
the accuracy is almost the same as Complete Life Table,
• Disagregated by 5 year age group,
• For country with unequal distribution of population , Abridged Life Table is more precise
• Notation : n= age interval and x= exact age x, such as : nqx,
ndx, npx, and nLx, while for lx, Tx, and ex just the same and
related with population at age x
• Example : 5q30 for interval 30 to 35
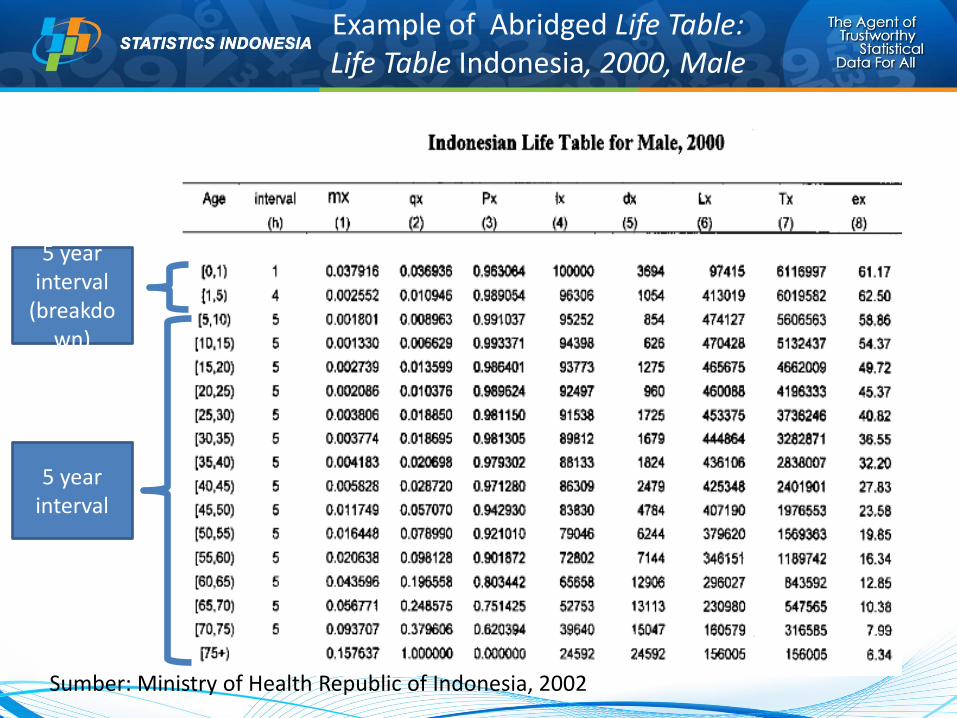
Example of Abridged Life Table: Life Table Indonesia, 2000, Male
Sumber: Ministry of Health Republic of Indonesia, 2002
5 year interval
5 year interval
(breakdown)
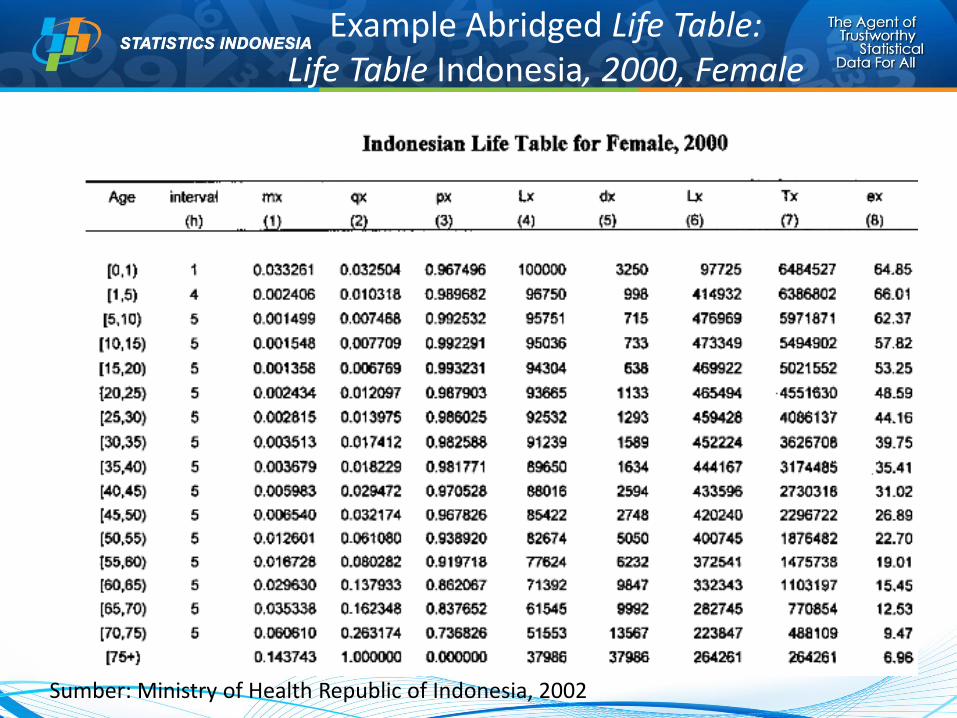
Example Abridged Life Table: Life Table Indonesia, 2000, Female
Sumber: Ministry of Health Republic of Indonesia, 2002
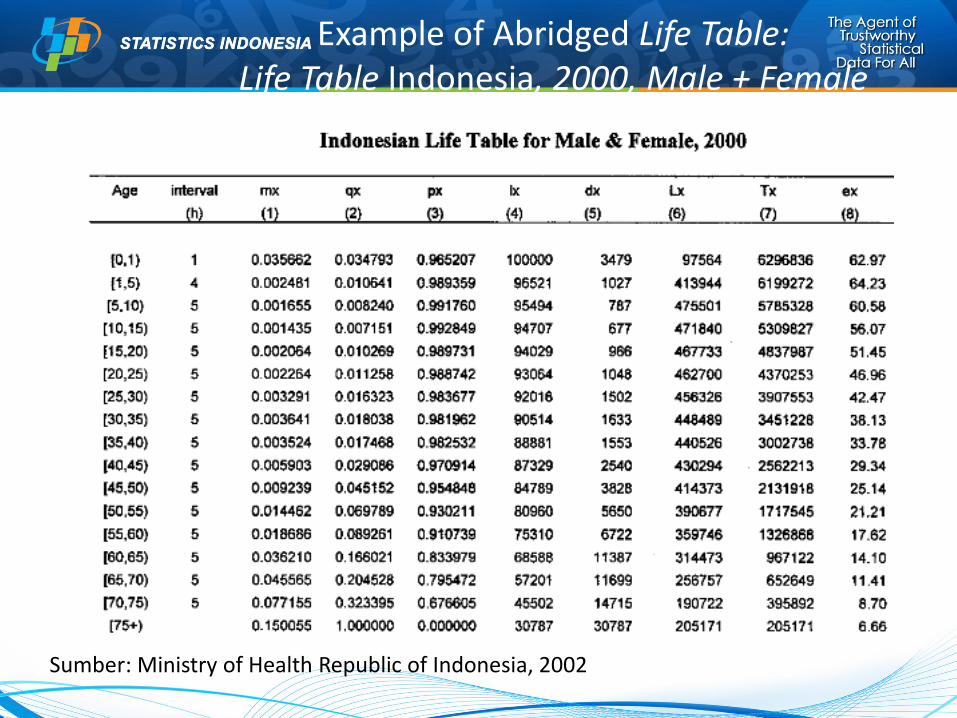
Example of Abridged Life Table: Life Table Indonesia, 2000, Male + Female
Sumber: Ministry of Health Republic of Indonesia, 2002
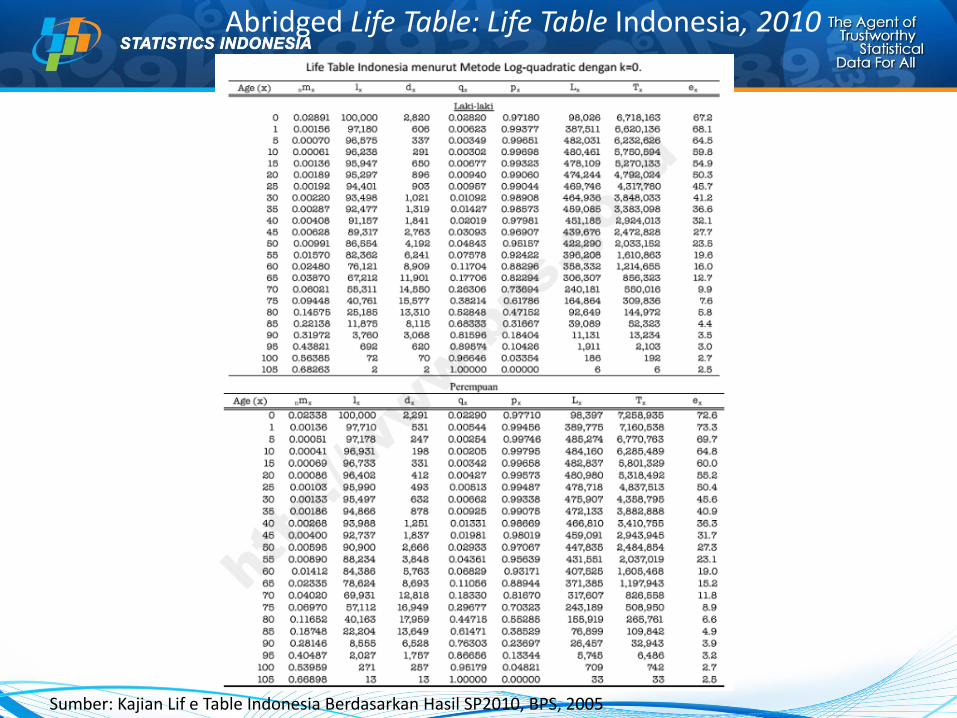
Abridged Life Table: Life Table Indonesia, 2010
Sumber: Kajian Lif e Table Indonesia Berdasarkan Hasil SP2010, BPS, 2005
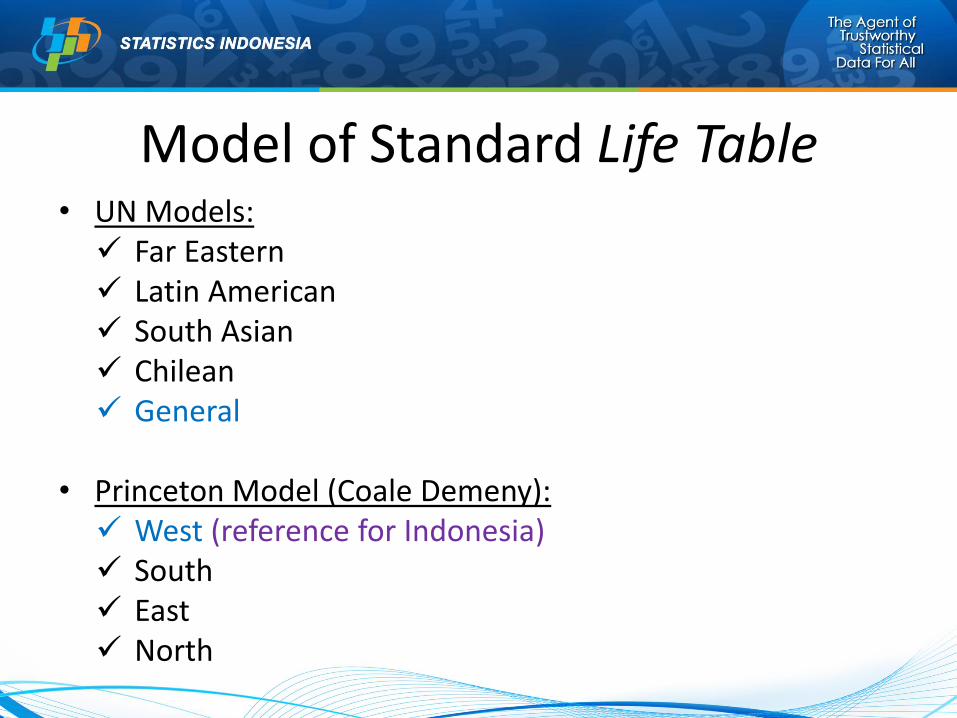
Model of Standard Life Table • UN Models: Far Eastern Latin American South Asian Chilean General
• Princeton Model (Coale Demeny): West (reference for Indonesia) South East North
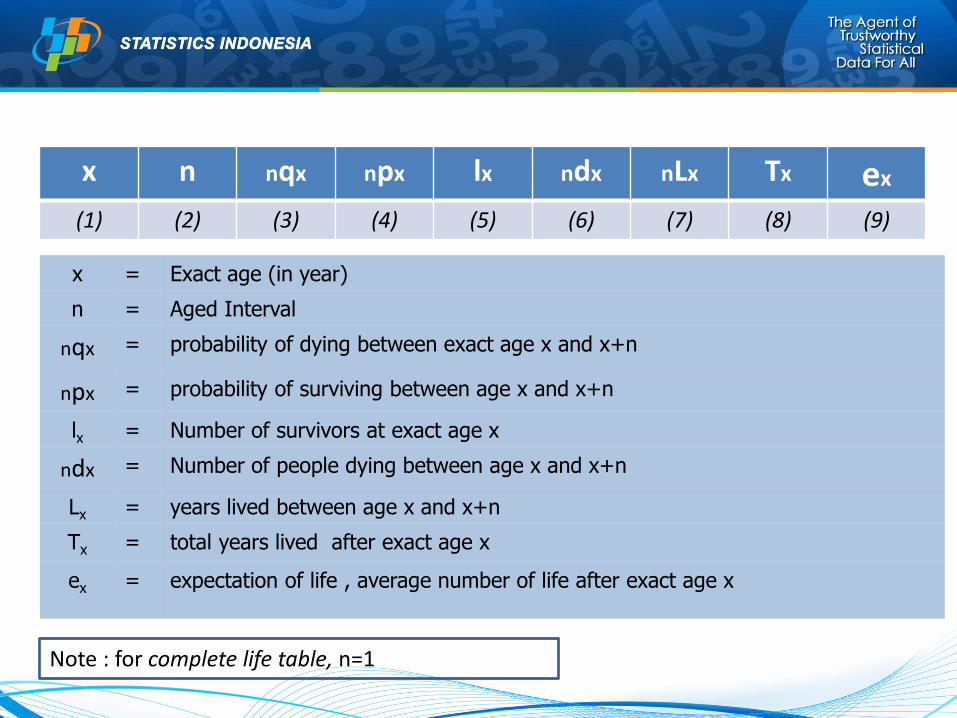
Kolom-kolom Life Table (Abridged) x n nqx npx lx ndx nLx Tx ex
(1) (2) (3) (4) (5) (6) (7) (8) (9)
x = Exact age (in year)
n = Aged Interval
nqx = probability of dying between exact age x and x+n
npx = probability of surviving between age x and x+n
lx = Number of survivors at exact age x
ndx = Number of people dying between age x and x+n
Lx = years lived between age x and x+n
Tx = total years lived after exact age x
ex = expectation of life , average number of life after exact age x
Note : for complete life table, n=1
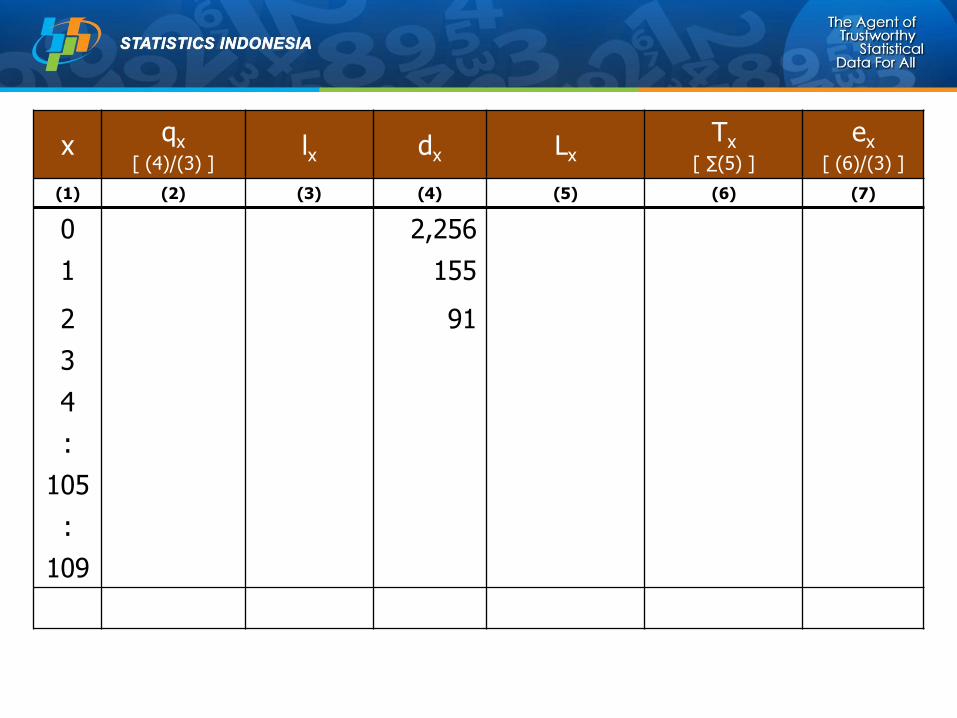
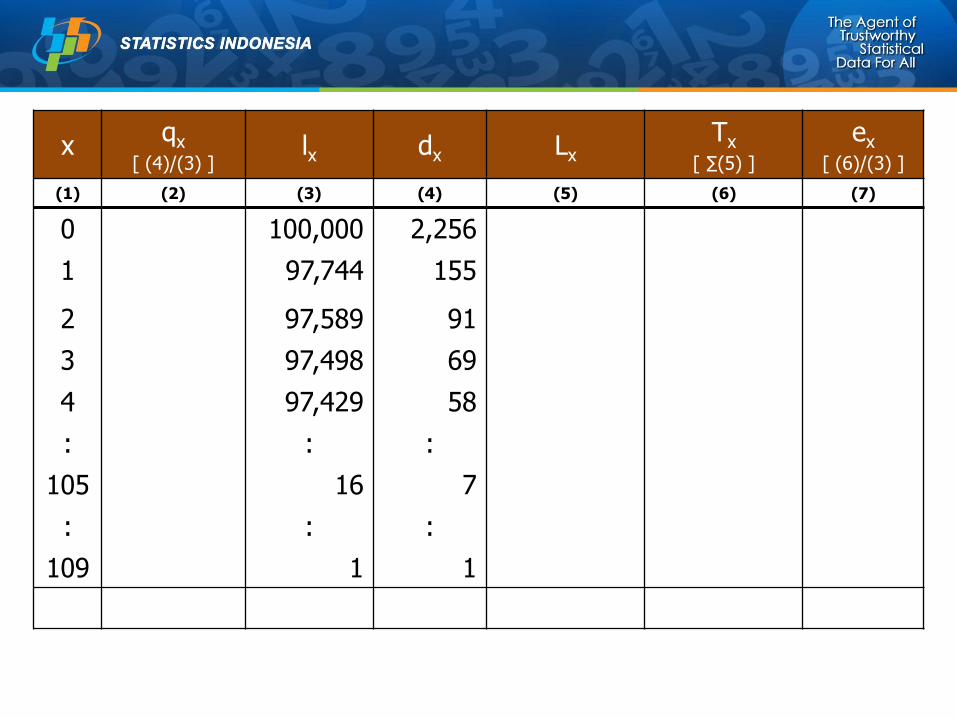
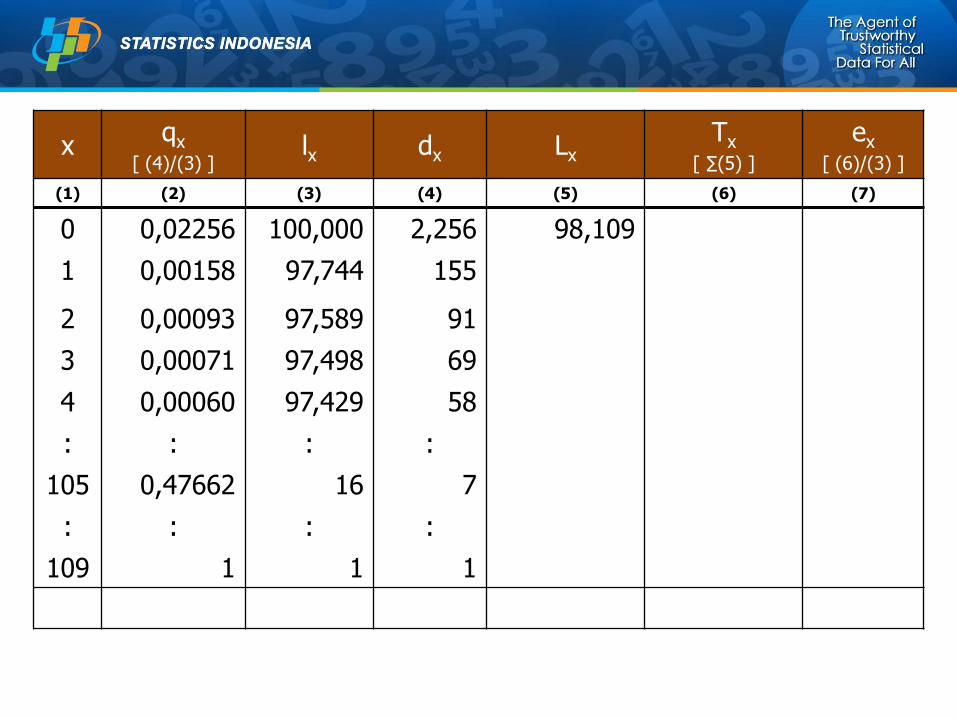
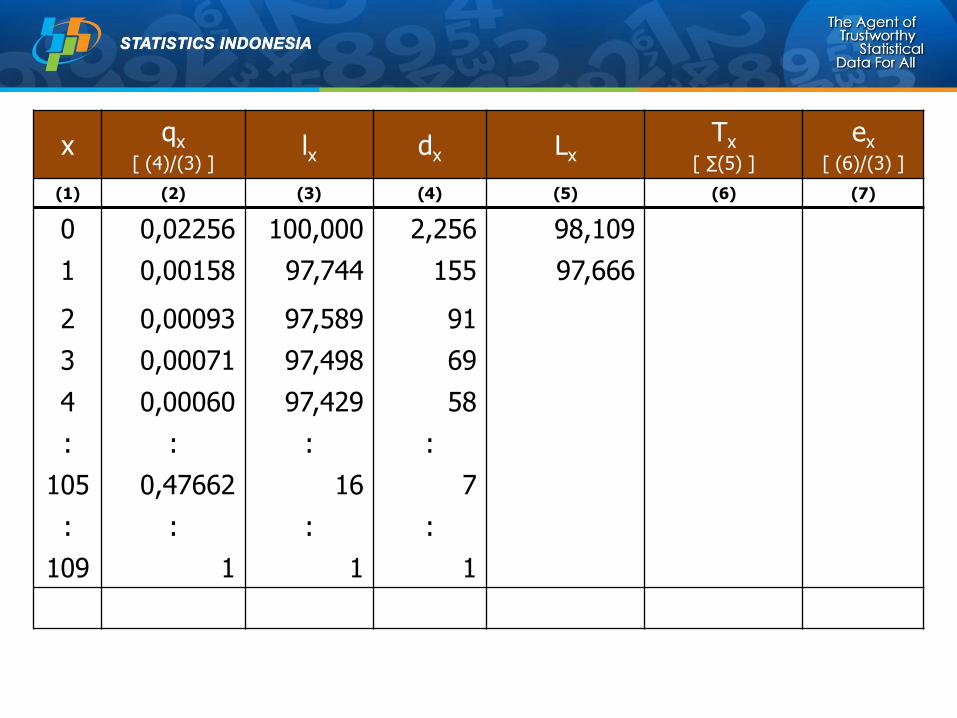
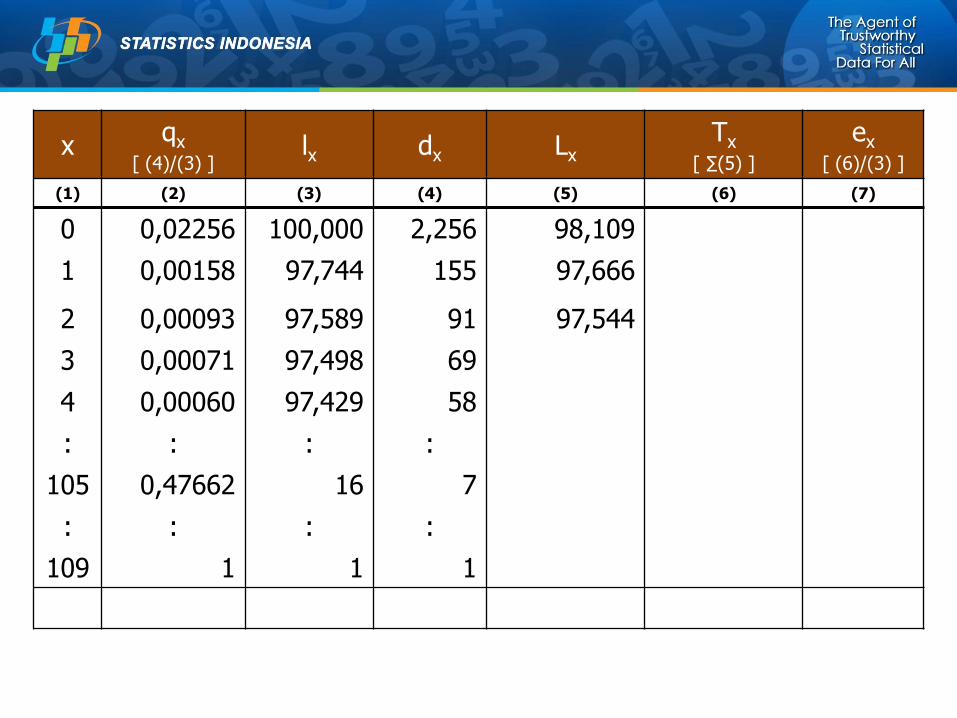
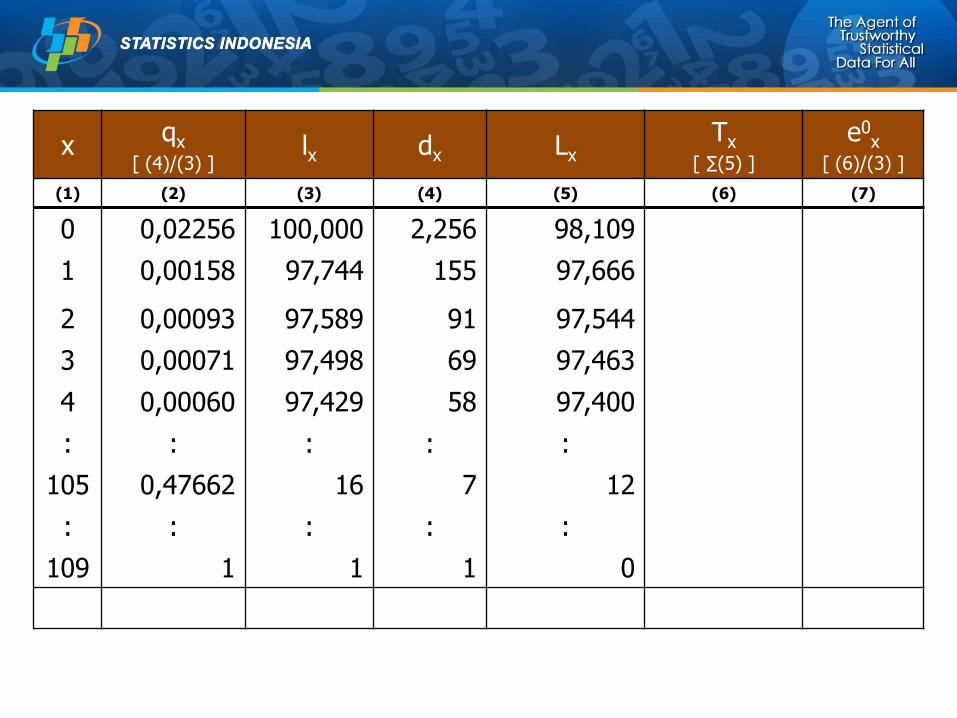
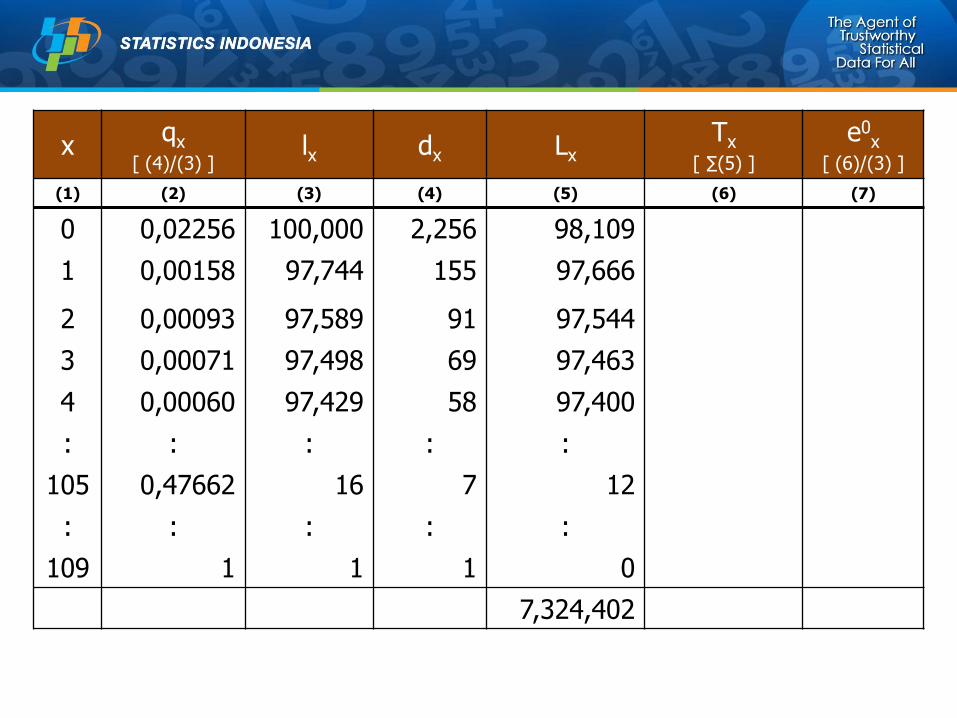
Calculation of
Complete Life Table
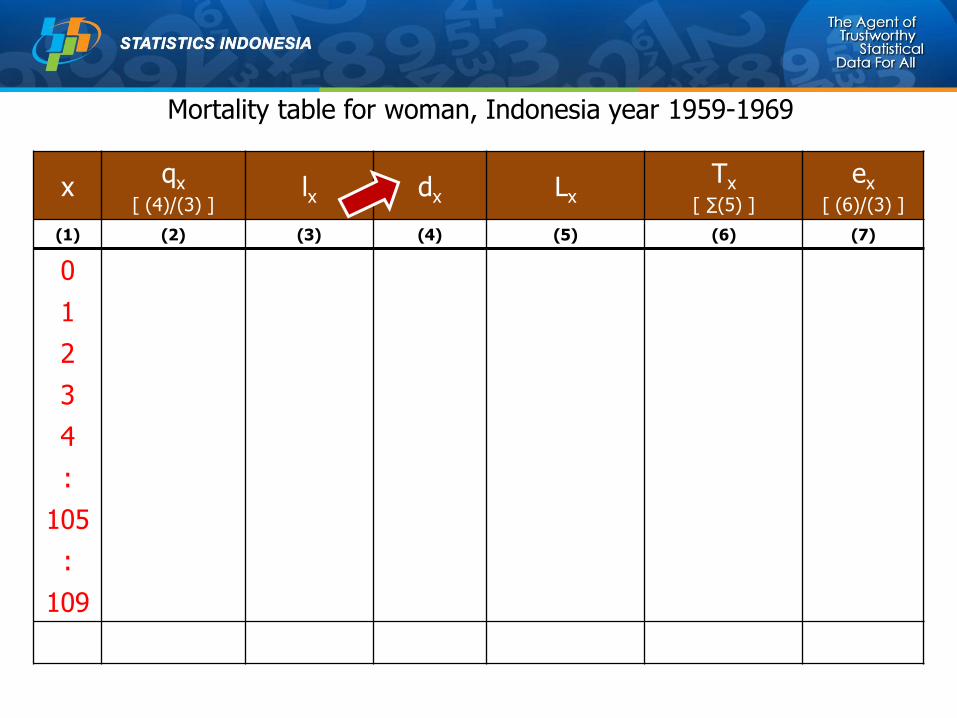
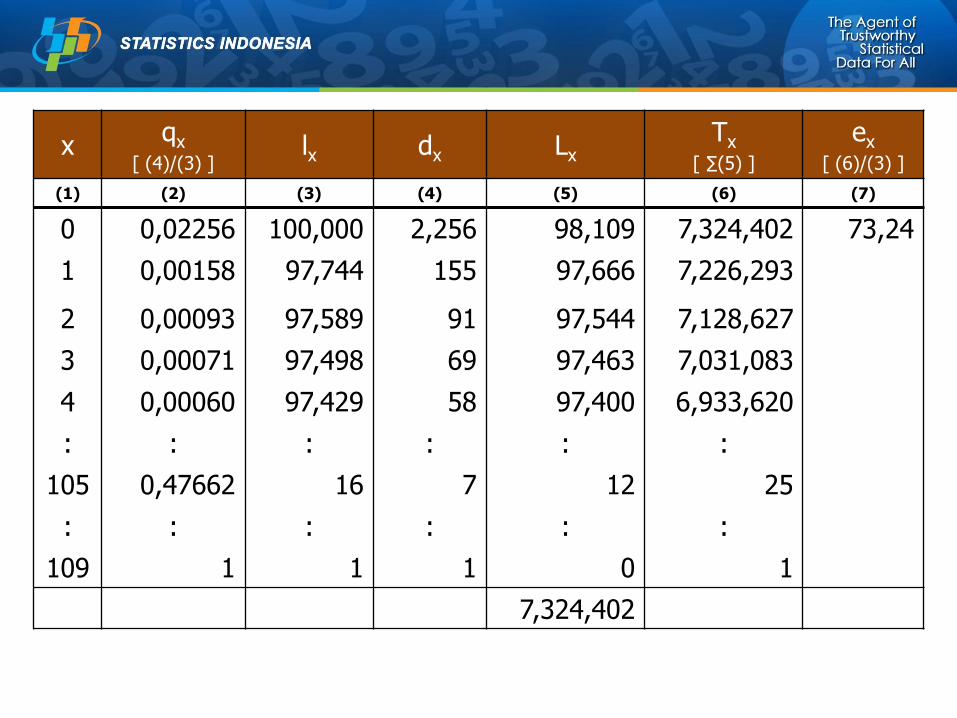
Mortality table for woman, Indonesia year 1959-1969
x qx
[ (4)/(3) ] lx dx Lx
Tx
[ ∑(5) ]
ex
[ (6)/(3) ]
(1) (2) (3) (4) (5) (6) (7)
0
1
2
3
4
:
105
:
109
x qx
[ (4)/(3) ] lx dx Lx
Tx
[ ∑(5) ]
ex
[ (6)/(3) ]
(1) (2) (3) (4) (5) (6) (7)
0 2,256
1
2
3
4
:
105
:
109
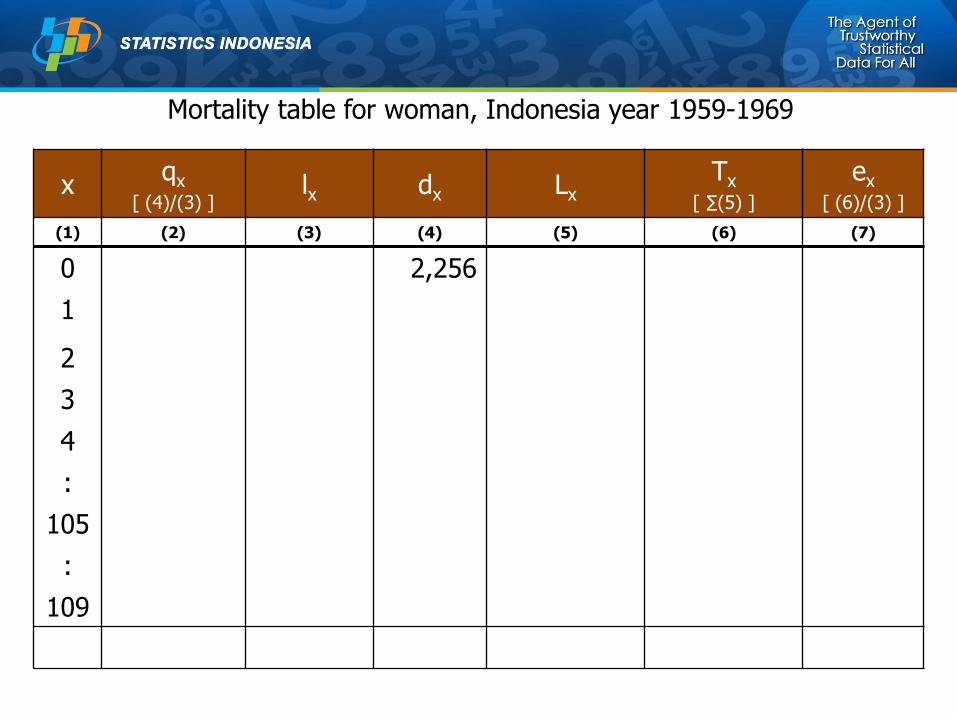
Mortality table for woman, Indonesia year 1959-1969
x qx
[ (4)/(3) ] lx dx Lx
Tx
[ ∑(5) ]
ex
[ (6)/(3) ]
(1) (2) (3) (4) (5) (6) (7)
0 2,256
1 155
2
3
4
:
105
:
109
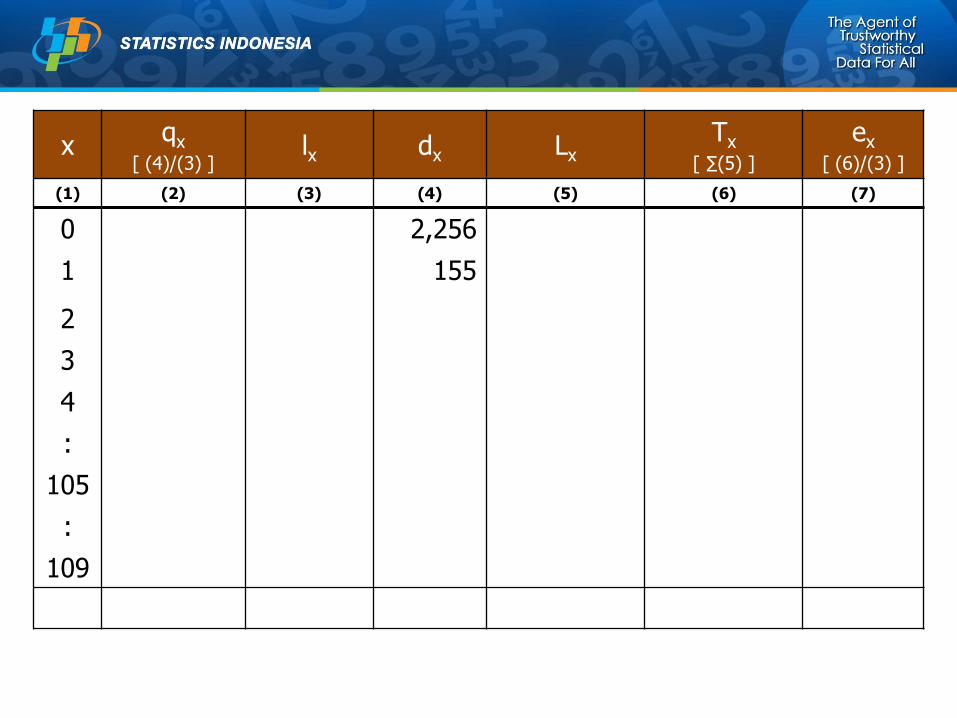
x qx
[ (4)/(3) ] lx dx Lx
Tx
[ ∑(5) ]
ex
[ (6)/(3) ]
(1) (2) (3) (4) (5) (6) (7)
0 2,256
1 155
2 91
3
4
:
105
:
109
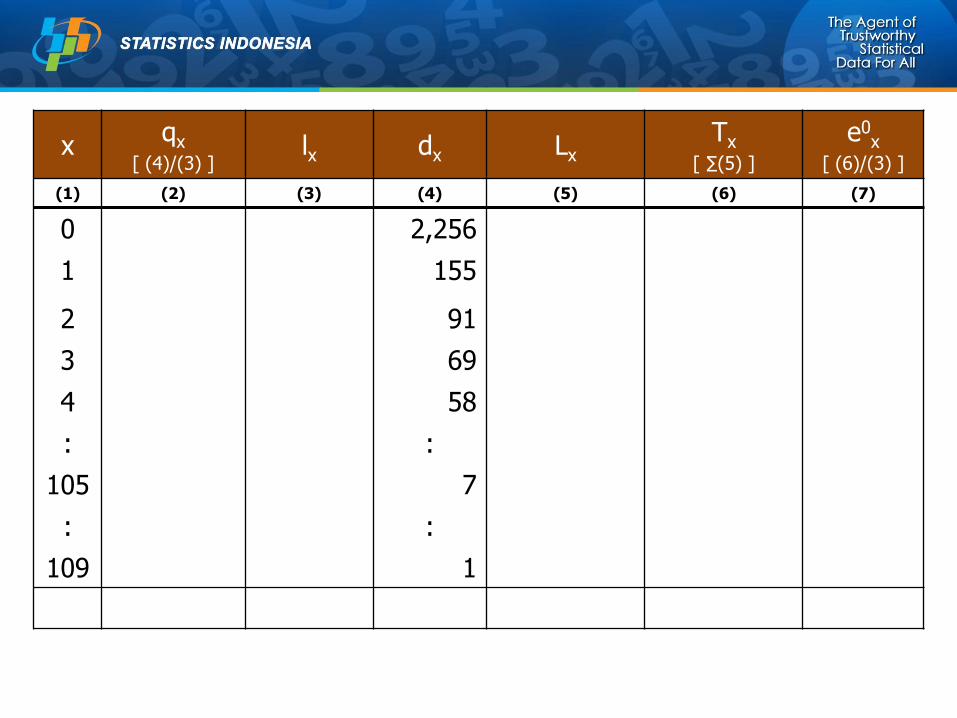
x qx
[ (4)/(3) ] lx dx Lx
Tx
[ ∑(5) ]
e0x
[ (6)/(3) ]
(1) (2) (3) (4) (5) (6) (7)
0 2,256
1 155
2 91
3 69
4 58
: :
105 7
: :
109 1
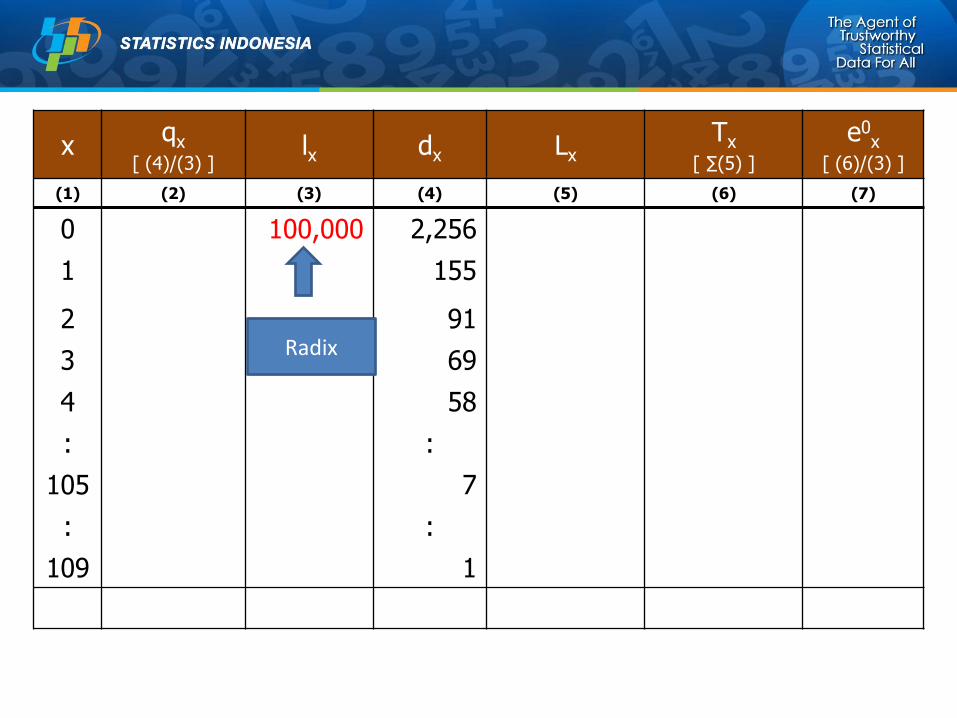
x qx
[ (4)/(3) ] lx dx Lx
Tx
[ ∑(5) ]
e0x
[ (6)/(3) ]
(1) (2) (3) (4) (5) (6) (7)
0 100,000 2,256
1 155
2 91
3 69
4 58
: :
105 7
: :
109 1
Radix
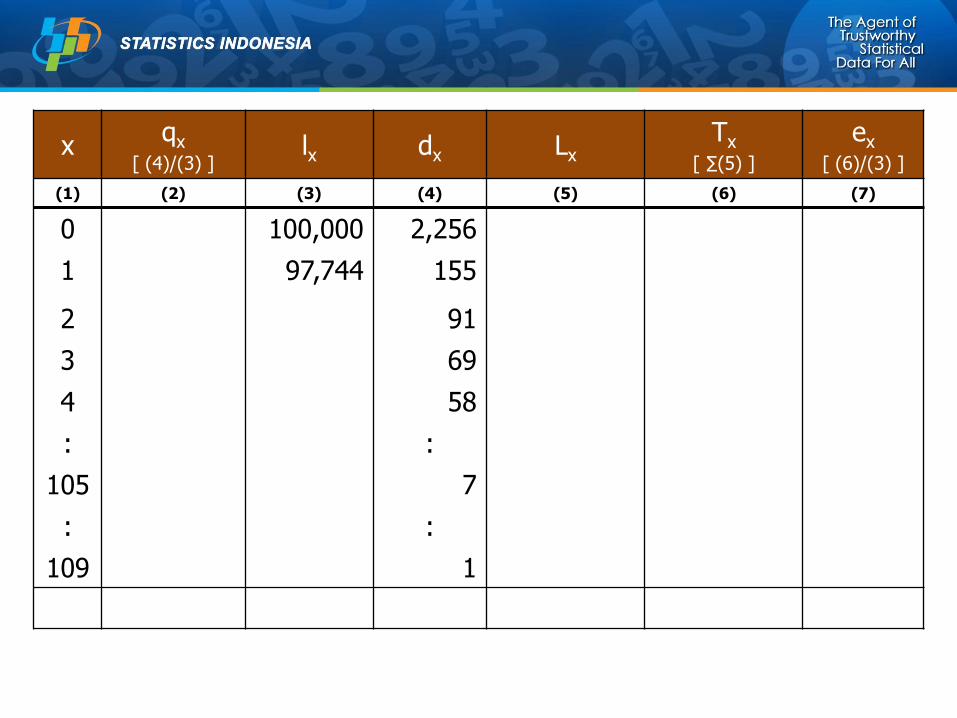
x qx
[ (4)/(3) ] lx dx Lx
Tx
[ ∑(5) ]
ex
[ (6)/(3) ]
(1) (2) (3) (4) (5) (6) (7)
0 100,000 2,256
1 97,744 155
2 91
3 69
4 58
: :
105 7
: :
109 1
x qx
[ (4)/(3) ] lx dx Lx
Tx
[ ∑(5) ]
ex
[ (6)/(3) ]
(1) (2) (3) (4) (5) (6) (7)
0 100,000 2,256
1 97,744 155
2 97,589 91
3 97,498 69
4 97,429 58
: : :
105 16 7
: : :
109 1 1
x qx
[ (4)/(3) ] lx dx Lx
Tx
[ ∑(5) ]
ex
[ (6)/(3) ]
(1) (2) (3) (4) (5) (6) (7)
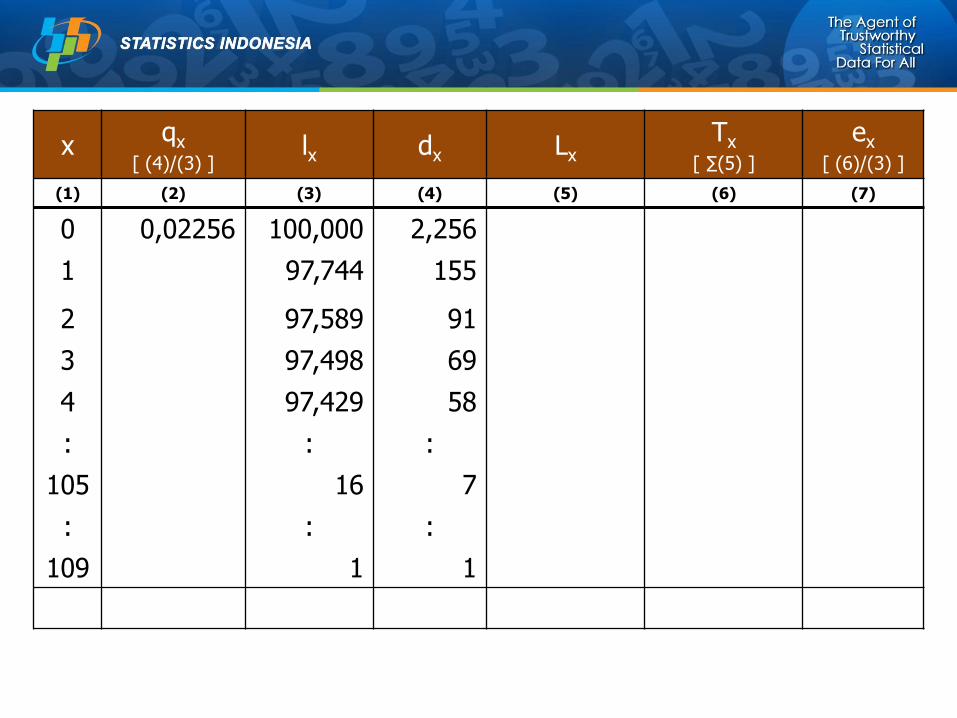
0 0,02256 100,000 2,256
1 97,744 155
2 97,589 91
3 97,498 69
4 97,429 58
: : :
105 16 7
: : :
109 1 1
x qx
[ (4)/(3) ] lx dx Lx
Tx
[ ∑(5) ]
ex
[ (6)/(3) ]
(1) (2) (3) (4) (5) (6) (7)
0 0,02256 100,000 2,256
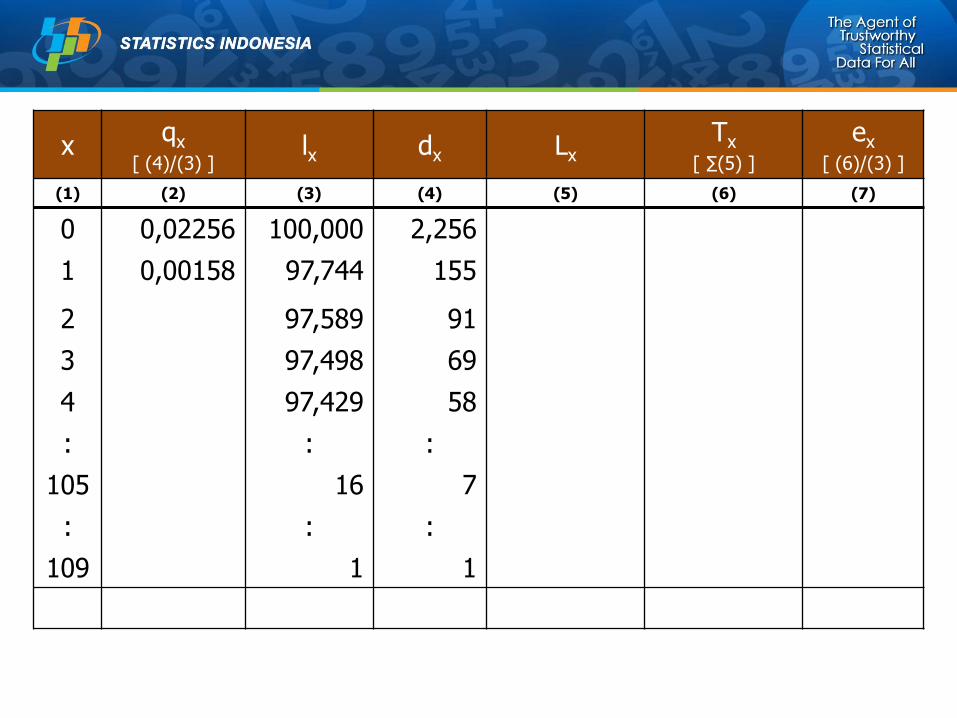
1 0,00158 97,744 155
2 97,589 91
3 97,498 69
4 97,429 58
: : :
105 16 7
: : :
109 1 1
x qx
[ (4)/(3) ] lx dx Lx
Tx
[ ∑(5) ]
ex
[ (6)/(3) ]
(1) (2) (3) (4) (5) (6) (7)
0 0,02256 100,000 2,256
1 0,00158 97,744 155
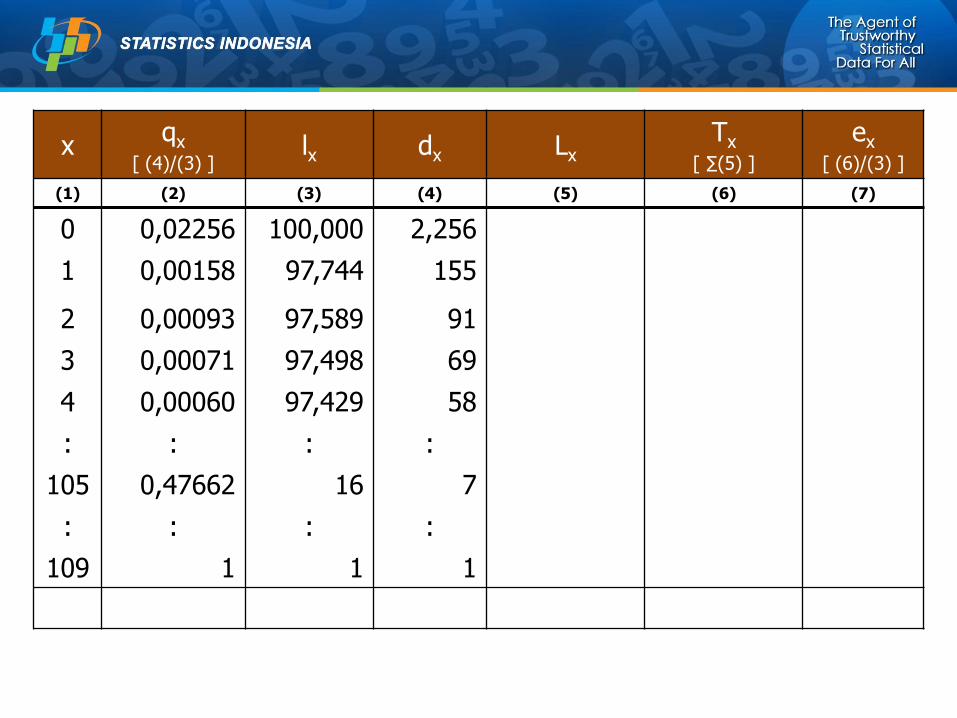
2 0,00093 97,589 91
3 0,00071 97,498 69
4 0,00060 97,429 58
: : : :
105 0,47662 16 7
: : : :
109 1 1 1
x qx
[ (4)/(3) ] lx dx Lx
Tx
[ ∑(5) ]
ex
[ (6)/(3) ]
(1) (2) (3) (4) (5) (6) (7)
0 0,02256 100,000 2,256 98,109
1 0,00158 97,744 155
2 0,00093 97,589 91
3 0,00071 97,498 69
4 0,00060 97,429 58
: : : :
105 0,47662 16 7
: : : :
109 1 1 1
x qx
[ (4)/(3) ] lx dx Lx
Tx
[ ∑(5) ]
ex
[ (6)/(3) ]
(1) (2) (3) (4) (5) (6) (7)
0 0,02256 100,000 2,256 98,109
1 0,00158 97,744 155 97,666
2 0,00093 97,589 91
3 0,00071 97,498 69
4 0,00060 97,429 58
: : : :
105 0,47662 16 7
: : : :
109 1 1 1
x qx
[ (4)/(3) ] lx dx Lx
Tx
[ ∑(5) ]
ex
[ (6)/(3) ]
(1) (2) (3) (4) (5) (6) (7)
0 0,02256 100,000 2,256 98,109
1 0,00158 97,744 155 97,666
2 0,00093 97,589 91 97,544
3 0,00071 97,498 69
4 0,00060 97,429 58
: : : :
105 0,47662 16 7
: : : :
109 1 1 1
x qx
[ (4)/(3) ] lx dx Lx
Tx
[ ∑(5) ]
e0x
[ (6)/(3) ]
(1) (2) (3) (4) (5) (6) (7)
0 0,02256 100,000 2,256 98,109
1 0,00158 97,744 155 97,666
2 0,00093 97,589 91 97,544
3 0,00071 97,498 69 97,463
4 0,00060 97,429 58 97,400
: : : : :
105 0,47662 16 7 12
: : : : :
109 1 1 1 0
x qx
[ (4)/(3) ] lx dx Lx
Tx
[ ∑(5) ]
e0x
[ (6)/(3) ]
(1) (2) (3) (4) (5) (6) (7)
0 0,02256 100,000 2,256 98,109
1 0,00158 97,744 155 97,666
2 0,00093 97,589 91 97,544
3 0,00071 97,498 69 97,463
4 0,00060 97,429 58 97,400
: : : : :
105 0,47662 16 7 12
: : : : :
109 1 1 1 0
7,324,402
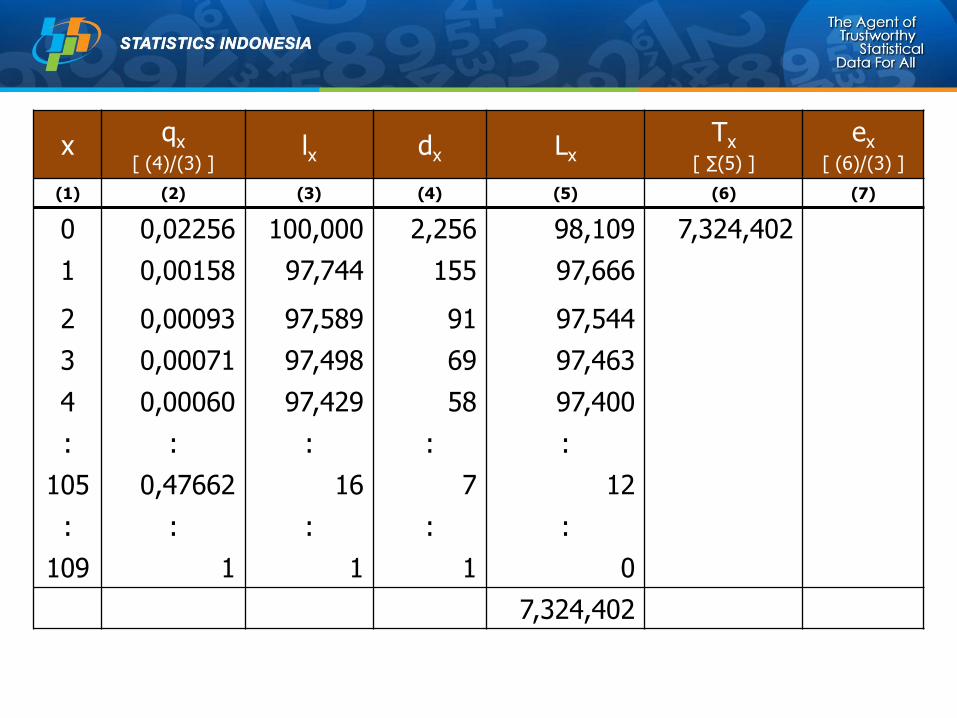
x qx
[ (4)/(3) ] lx dx Lx
Tx
[ ∑(5) ]
ex
[ (6)/(3) ]
(1) (2) (3) (4) (5) (6) (7)
0 0,02256 100,000 2,256 98,109 7,324,402
1 0,00158 97,744 155 97,666
2 0,00093 97,589 91 97,544
3 0,00071 97,498 69 97,463
4 0,00060 97,429 58 97,400
: : : : :
105 0,47662 16 7 12
: : : : :
109 1 1 1 0
7,324,402
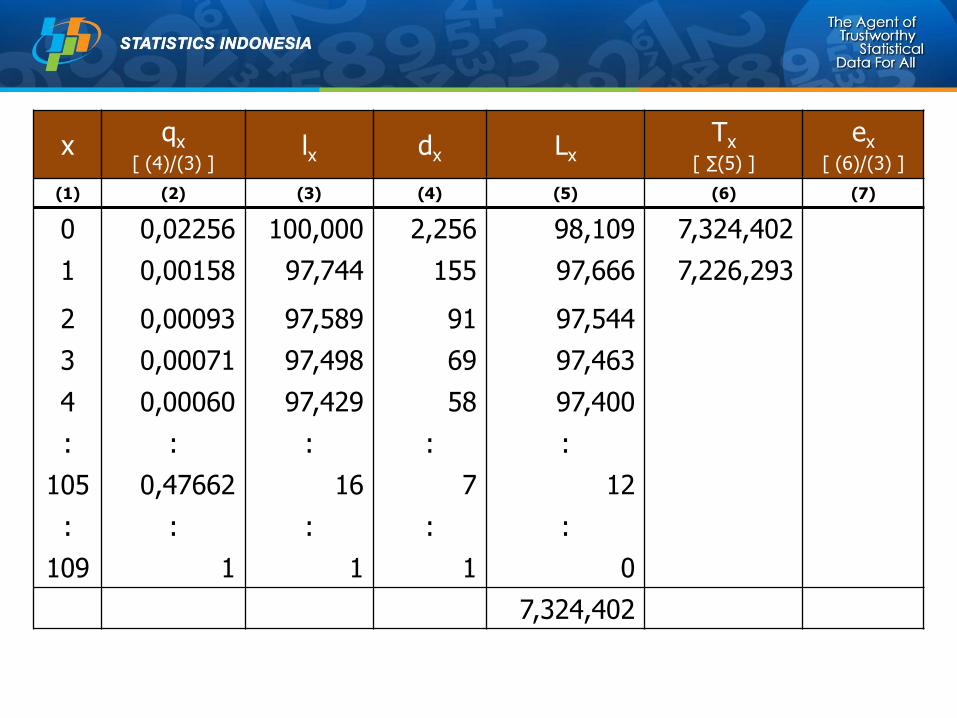
x qx
[ (4)/(3) ] lx dx Lx
Tx
[ ∑(5) ]
ex
[ (6)/(3) ]
(1) (2) (3) (4) (5) (6) (7)
0 0,02256 100,000 2,256 98,109 7,324,402
1 0,00158 97,744 155 97,666 7,226,293
2 0,00093 97,589 91 97,544
3 0,00071 97,498 69 97,463
4 0,00060 97,429 58 97,400
: : : : :
105 0,47662 16 7 12
: : : : :
109 1 1 1 0
7,324,402
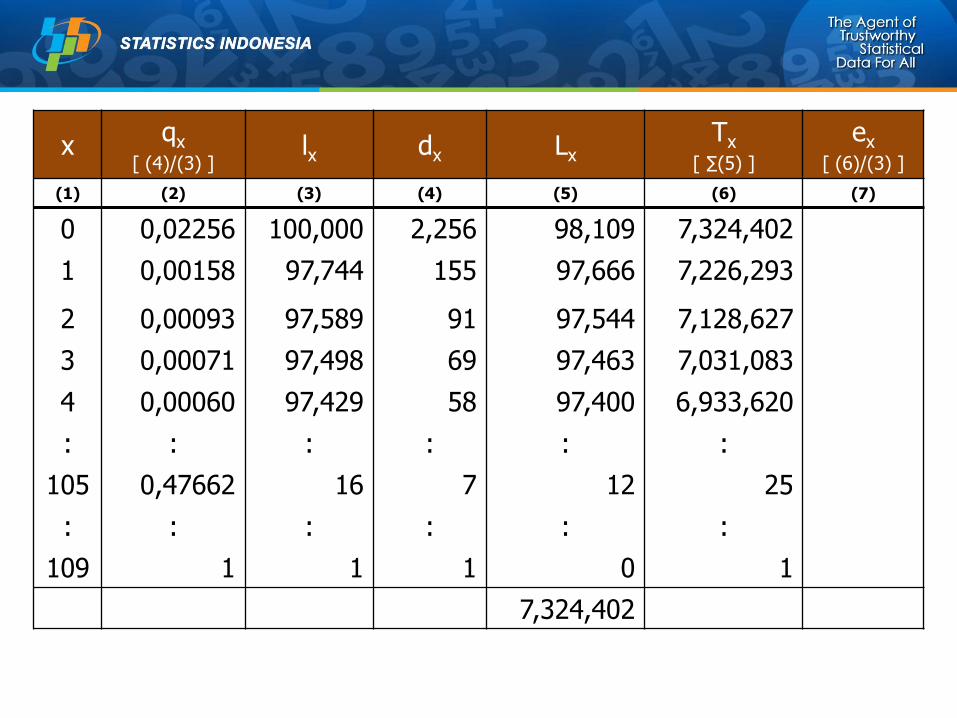
x qx
[ (4)/(3) ] lx dx Lx
Tx
[ ∑(5) ]
ex
[ (6)/(3) ]
(1) (2) (3) (4) (5) (6) (7)
0 0,02256 100,000 2,256 98,109 7,324,402
1 0,00158 97,744 155 97,666 7,226,293
2 0,00093 97,589 91 97,544 7,128,627
3 0,00071 97,498 69 97,463 7,031,083
4 0,00060 97,429 58 97,400 6,933,620
: : : : : :
105 0,47662 16 7 12 25
: : : : : :
109 1 1 1 0 1
7,324,402
x qx
[ (4)/(3) ] lx dx Lx
Tx
[ ∑(5) ]
ex
[ (6)/(3) ]
(1) (2) (3) (4) (5) (6) (7)
0 0,02256 100,000 2,256 98,109 7,324,402 73,24
1 0,00158 97,744 155 97,666 7,226,293
2 0,00093 97,589 91 97,544 7,128,627
3 0,00071 97,498 69 97,463 7,031,083
4 0,00060 97,429 58 97,400 6,933,620
: : : : : :
105 0,47662 16 7 12 25
: : : : : :
109 1 1 1 0 1
7,324,402

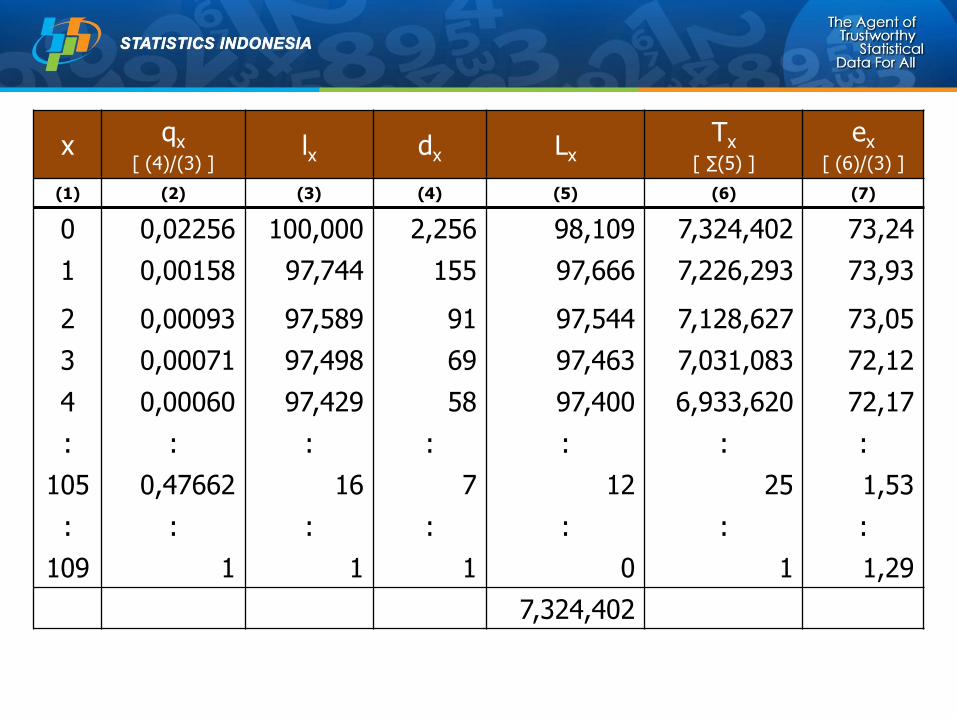
x qx
[ (4)/(3) ] lx dx Lx
Tx
[ ∑(5) ]
ex
[ (6)/(3) ]
(1) (2) (3) (4) (5) (6) (7)
0 0,02256 100,000 2,256 98,109 7,324,402 73,24
1 0,00158 97,744 155 97,666 7,226,293 73,93
2 0,00093 97,589 91 97,544 7,128,627
3 0,00071 97,498 69 97,463 7,031,083
4 0,00060 97,429 58 97,400 6,933,620
: : : : : :
105 0,47662 16 7 12 25
: : : : : :
109 1 1 1 0 1
7,324,402
x qx
[ (4)/(3) ] lx dx Lx
Tx
[ ∑(5) ]
ex
[ (6)/(3) ]
(1) (2) (3) (4) (5) (6) (7)
0 0,02256 100,000 2,256 98,109 7,324,402 73,24
1 0,00158 97,744 155 97,666 7,226,293 73,93
2 0,00093 97,589 91 97,544 7,128,627 73,05
3 0,00071 97,498 69 97,463 7,031,083 72,12
4 0,00060 97,429 58 97,400 6,933,620 72,17
: : : : : : :
105 0,47662 16 7 12 25 1,53
: : : : : : :
109 1 1 1 0 1 1,29
7,324,402
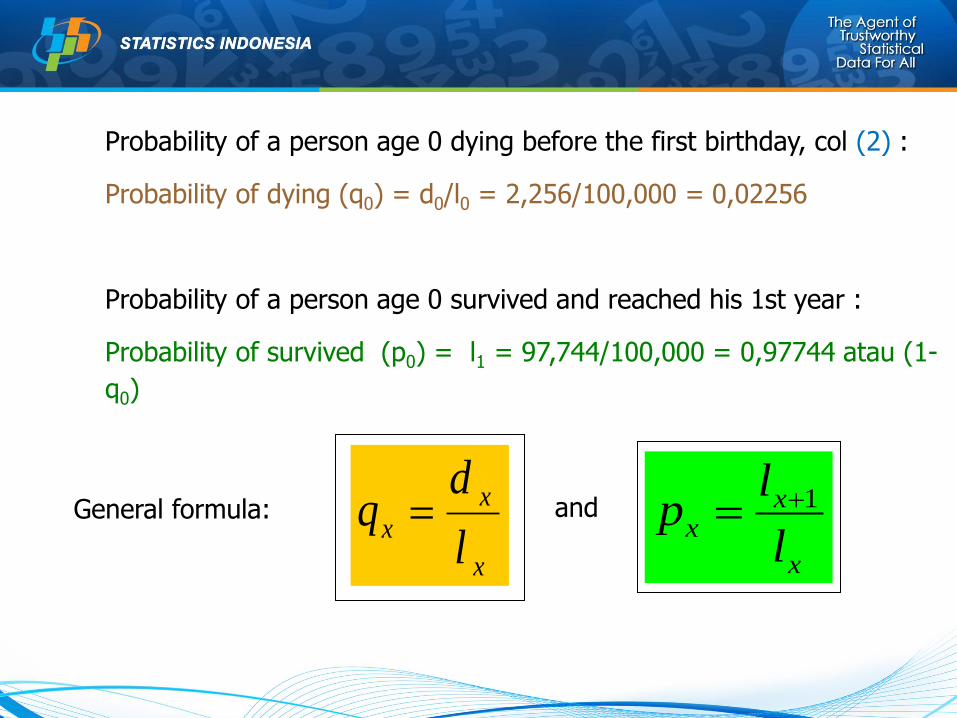
Probability of a person age 0 dying before the first birthday, col (2) :
Probability of dying (q0) = d0/l0 = 2,256/100,000 = 0,02256
Probability of a person age 0 survived and reached his 1st year :
Probability of survived (p0) = l1 = 97,744/100,000 = 0,97744 atau (1-
q0)
General formula:
x
x
xl
dq
x
xx
l
lp 1and
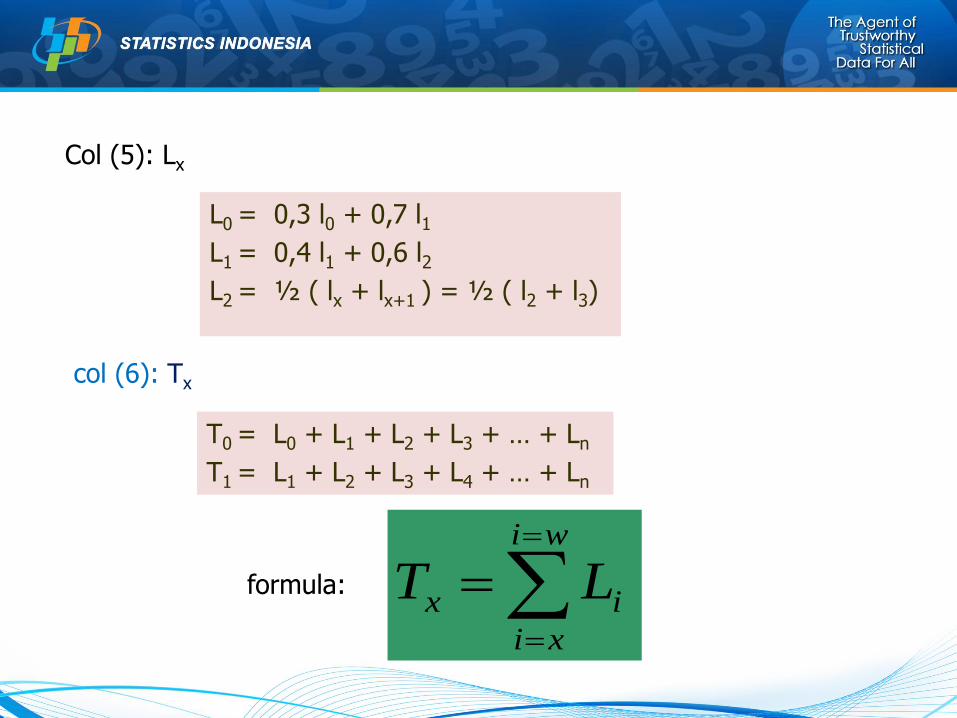
Col (5): Lx
L0 = 0,3 l0 + 0,7 l1
L1 = 0,4 l1 + 0,6 l2
L2 = ½ ( lx + lx+1 ) = ½ ( l2 + l3)
col (6): Tx
T0 = L0 + L1 + L2 + L3 + … + Ln
T1 = L1 + L2 + L3 + L4 + … + Ln
formula:
wi
xi
ix LT
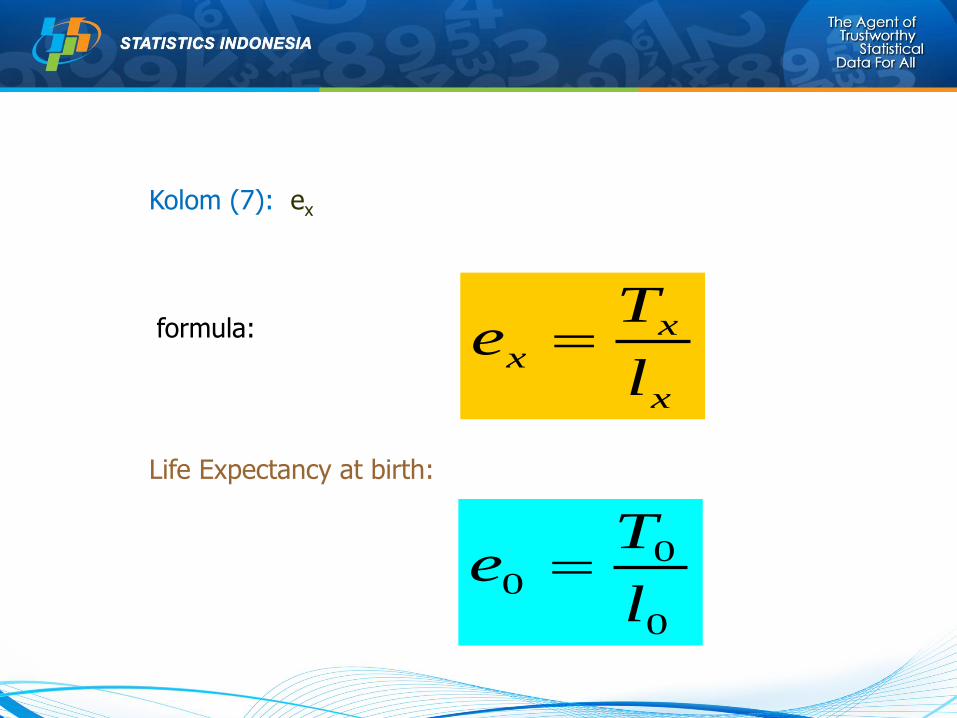
Kolom (7): ex
Life Expectancy at birth:
formula:
x
xx
l
Te
0
00
l
Te
The life table is called longitudinal life table.
Weakness : difficult to have mortality data by single
age
cross section Life Table is more practical and simple .
This table describe mortality for synthetic cohort dying
follow the mortality trend by age that exist for a
group of population in the particular time period.
Calculation of Abridged Life Table
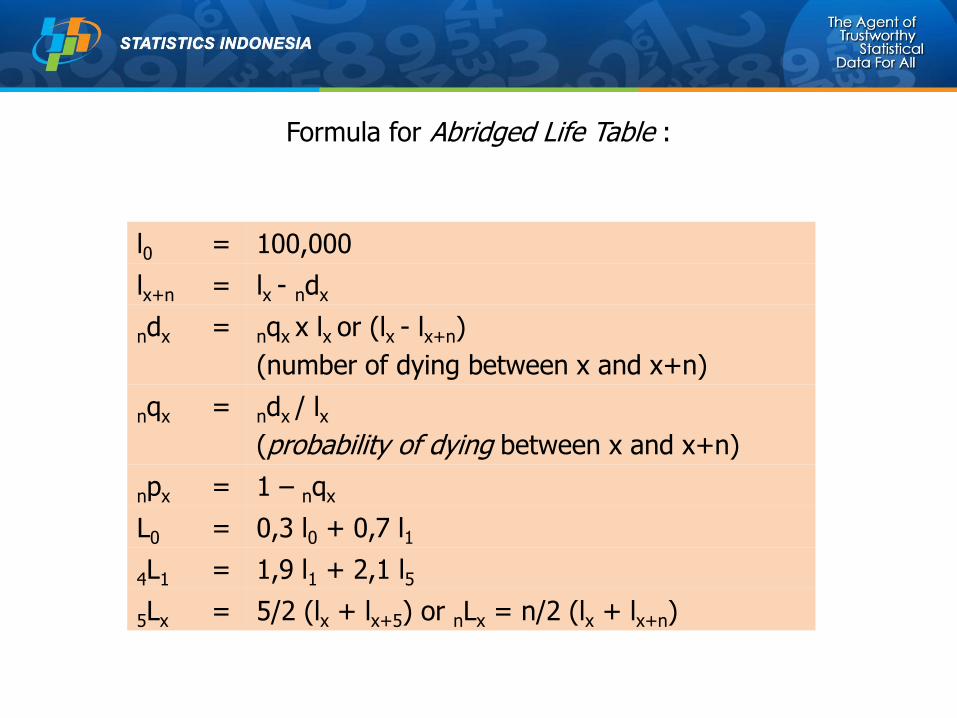
Formula for Abridged Life Table :
l0 = 100,000
lx+n = lx - ndx
ndx = nqx x lx or (lx - lx+n)
(number of dying between x and x+n)
nqx = ndx / lx
(probability of dying between x and x+n)
npx = 1 – nqx
L0 = 0,3 l0 + 0,7 l1
4L1 = 1,9 l1 + 2,1 l5
5Lx = 5/2 (lx + lx+5) or nLx = n/2 (lx + lx+n)
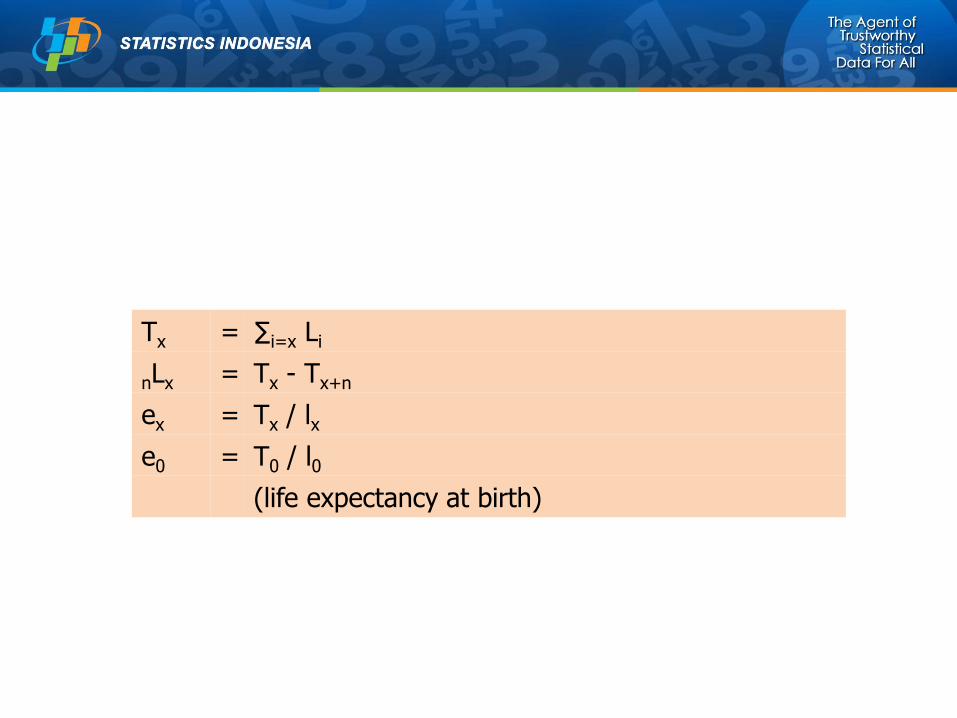
Tx = ∑i=x Li
nLx = Tx - Tx+n
ex = Tx / lx
e0 = T0 / l0
(life expectancy at birth)
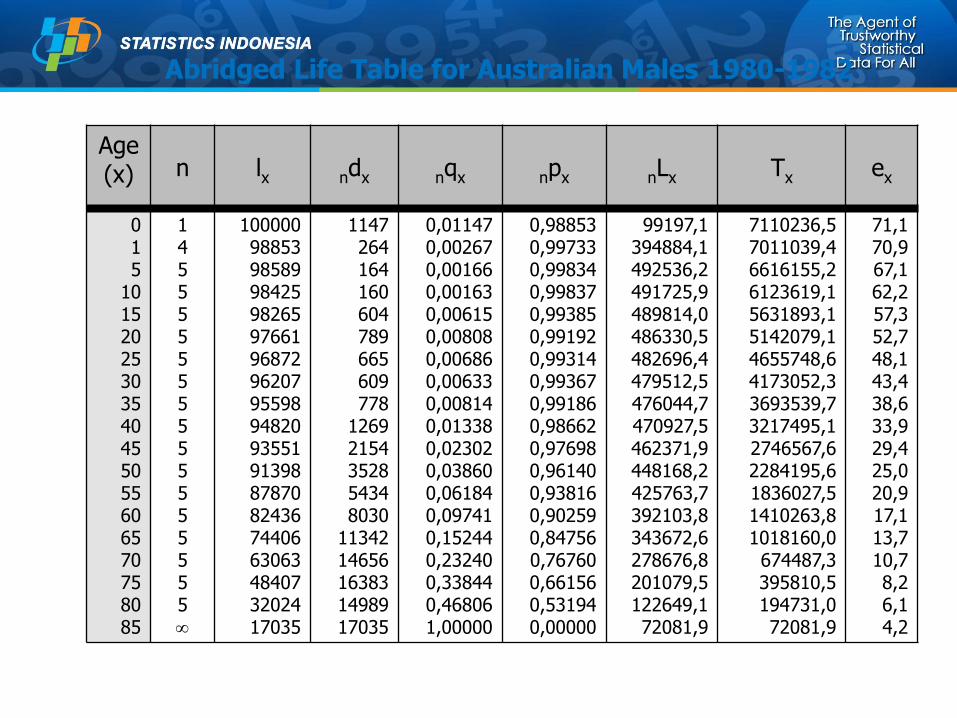
Abridged Life Table for Australian Males 1980-1982
Age (x) n lx ndx nqx npx nLx Tx ex
0 1 5
10 15 20 25 30 35 40 45 50 55 60 65 70 75 80 85
1 4 5 5 5 5 5 5 5 5 5 5 5 5 5 5 5 5
100000 98853 98589 98425 98265 97661 96872 96207 95598 94820 93551 91398 87870 82436 74406 63063 48407 32024 17035
1147 264 164 160 604 789 665 609 778
1269 2154 3528 5434 8030
11342 14656 16383 14989 17035
0,01147 0,00267 0,00166 0,00163 0,00615 0,00808 0,00686 0,00633 0,00814 0,01338 0,02302 0,03860 0,06184 0,09741 0,15244 0,23240 0,33844 0,46806 1,00000
0,98853 0,99733 0,99834 0,99837 0,99385 0,99192 0,99314 0,99367 0,99186 0,98662 0,97698 0,96140 0,93816 0,90259 0,84756 0,76760 0,66156 0,53194 0,00000
99197,1 394884,1 492536,2 491725,9 489814,0 486330,5 482696,4 479512,5 476044,7 470927,5 462371,9 448168,2 425763,7 392103,8 343672,6 278676,8 201079,5 122649,1 72081,9
7110236,5 7011039,4 6616155,2 6123619,1 5631893,1 5142079,1 4655748,6 4173052,3 3693539,7 3217495,1 2746567,6 2284195,6 1836027,5 1410263,8 1018160,0 674487,3 395810,5 194731,0 72081,9
71,1 70,9 67,1 62,2 57,3 52,7 48,1 43,4 38,6 33,9 29,4 25,0 20,9 17,1 13,7 10,7 8,2 6,1 4,2
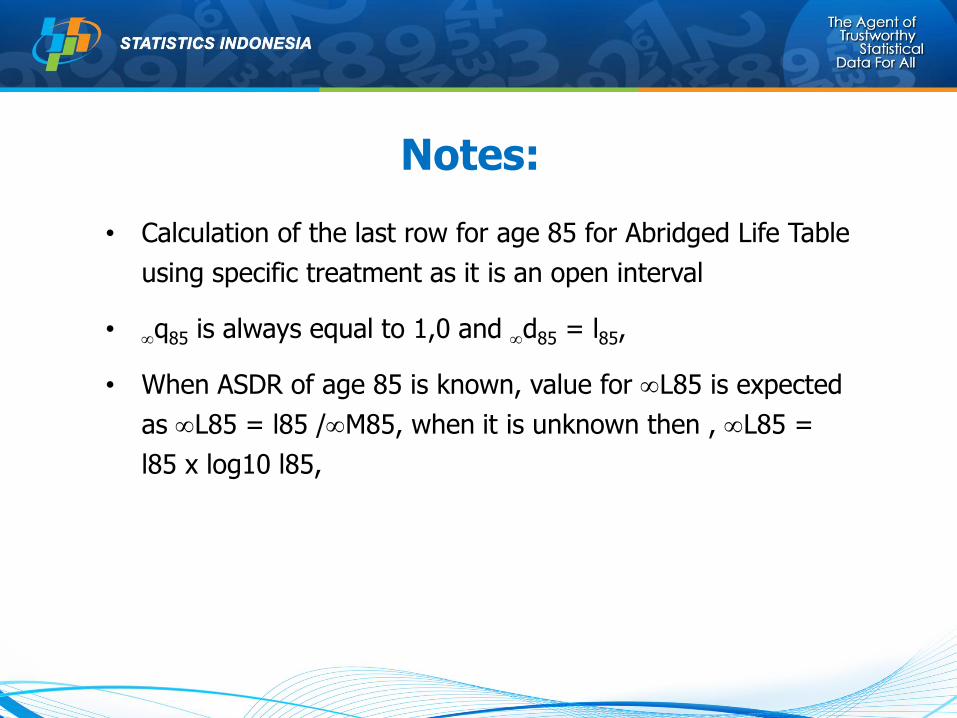
• Calculation of the last row for age 85 for Abridged Life Table
using specific treatment as it is an open interval
• q85 is always equal to 1,0 and d85 = l85,
• When ASDR of age 85 is known, value for L85 is expected
as L85 = l85 /M85, when it is unknown then , L85 =
l85 x log10 l85,
Notes:
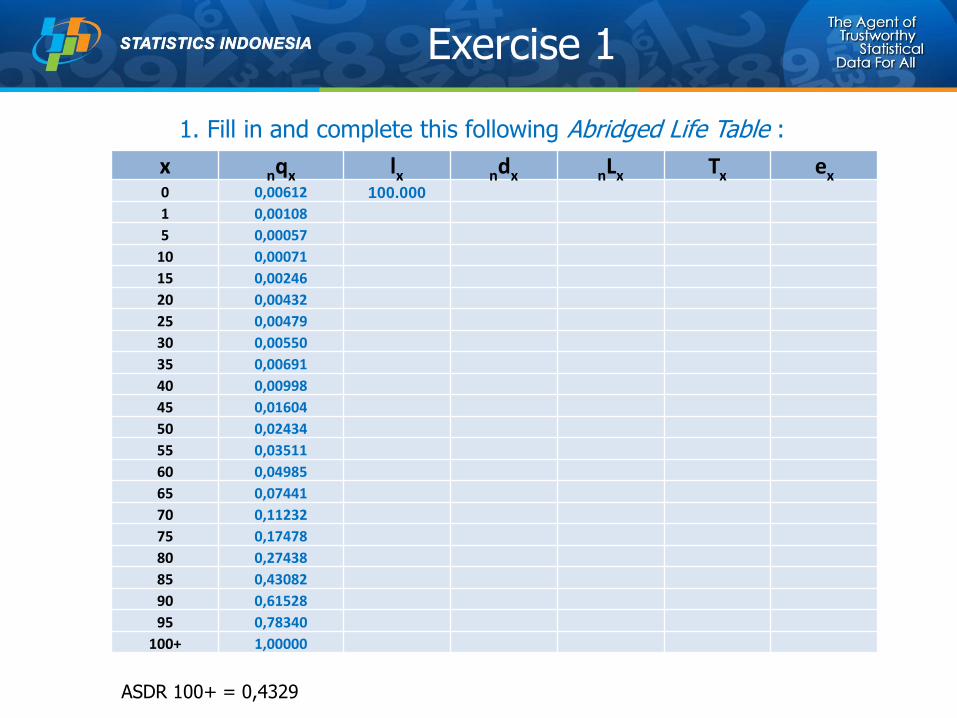
Exercise 1
ASDR 100+ = 0,4329
x nqx lx ndx nLx Tx ex 0 0,00612 100.000
1 0,00108
5 0,00057
10 0,00071
15 0,00246
20 0,00432
25 0,00479
30 0,00550
35 0,00691
40 0,00998
45 0,01604
50 0,02434
55 0,03511
60 0,04985
65 0,07441
70 0,11232
75 0,17478
80 0,27438
85 0,43082
90 0,61528
95 0,78340
100+ 1,00000
1. Fill in and complete this following Abridged Life Table :
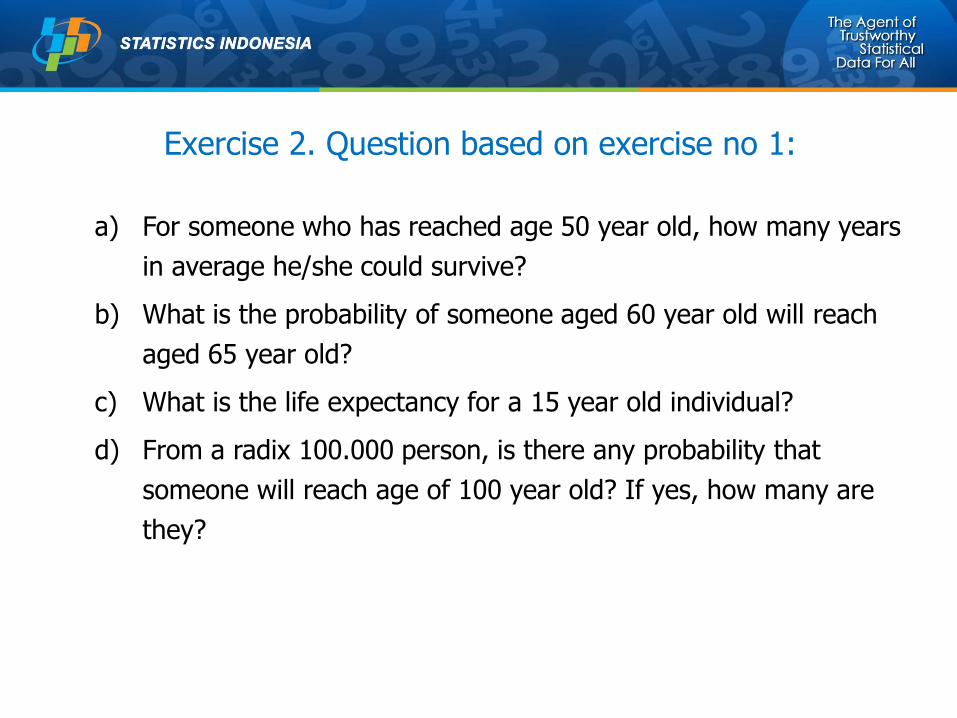
Exercise 2. Question based on exercise no 1:
a) For someone who has reached age 50 year old, how many years
in average he/she could survive?
b) What is the probability of someone aged 60 year old will reach
aged 65 year old?
c) What is the life expectancy for a 15 year old individual?
d) From a radix 100.000 person, is there any probability that
someone will reach age of 100 year old? If yes, how many are
they?
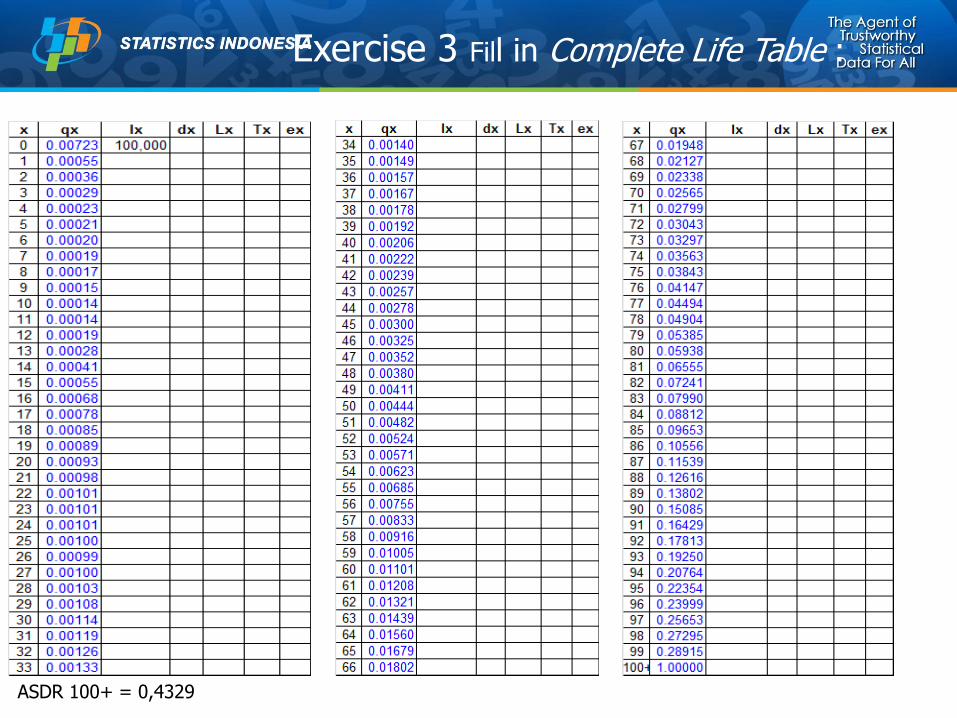
Exercise 3 Fill in Complete Life Table :
ASDR 100+ = 0,4329
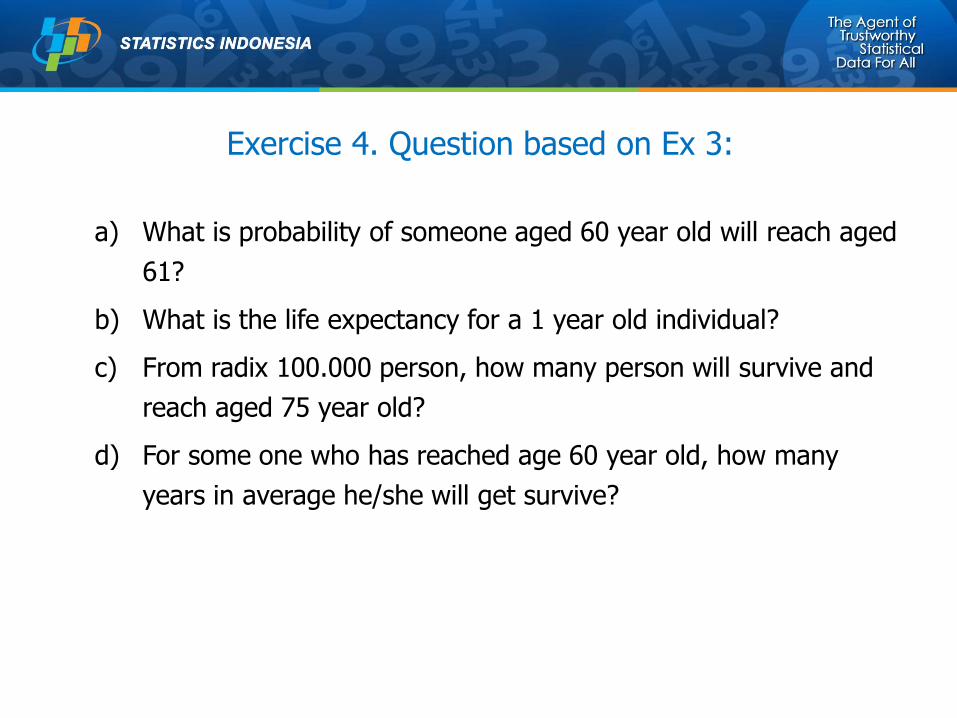
Exercise 4. Question based on Ex 3:
a) What is probability of someone aged 60 year old will reach aged
61?
b) What is the life expectancy for a 1 year old individual?
c) From radix 100.000 person, how many person will survive and
reach aged 75 year old?
d) For some one who has reached age 60 year old, how many
years in average he/she will get survive?
Terima Kasih
Thank you