LIFE CYCLE INVENTORY OF FOAM POLYSTYRENE, · life cycle inventory of foam polystyrene, paper-based,...
149
LIFE CYCLE INVENTORY OF FOAM POLYSTYRENE, PAPER-BASED, AND PLA FOODSERVICE PRODUCTS Prepared for THE PLASTIC FOODSERVICE PACKAGING GROUP by FRANKLIN ASSOCIATES, A DIVISION OF ERG Prairie Village, Kansas February 4, 2011
Transcript of LIFE CYCLE INVENTORY OF FOAM POLYSTYRENE, · life cycle inventory of foam polystyrene, paper-based,...
LIFE CYCLE INVENTORY OF FOAM POLYSTYRENE,
PAPER-BASED, AND PLA FOODSERVICE PRODUCTS
Prepared for
THE PLASTIC FOODSERVICE PACKAGING GROUP
by
FRANKLIN ASSOCIATES, A DIVISION OF ERG
Prairie Village, Kansas
February 4, 2011
CLIENTS\PFPG\KC112313.doc
02.04.11 3666.00.003.001 iii
Table of Contents
EXECUTIVE SUMMARY .................................................................................................................... ES-1
INTRODUCTION ................................................................................................................................ ES-1
STUDY GOAL AND INTENDED USE .............................................................................................. ES-1
SYSTEMS STUDIED .......................................................................................................................... ES-2
SCOPE AND BOUNDARIES ............................................................................................................. ES-3
FUNCTIONAL UNIT .......................................................................................................................... ES-5
RESULTS ............................................................................................................................................. ES-6
Energy Results .................................................................................................................................ES-6
Solid Waste Results .........................................................................................................................ES-9
Greenhouse Gas Results ................................................................................................................ ES-14
Water Use ...................................................................................................................................... ES-19
KEY OBSERVATIONS AND CONCLUSIONS .............................................................................. ES-22
CHAPTER 1 – LIFE CYCLE METHODOLOGY ................................................................................ 1-1
OVERVIEW ........................................................................................................................................... 1-1
LIFE CYCLE INVENTORY METHODOLOGY .................................................................................. 1-2
Material Requirements ....................................................................................................................... 1-3
Energy Requirements ......................................................................................................................... 1-3
Environmental Emissions .................................................................................................................. 1-4
LCI PRACTITIONER METHODOLOGY VARIATION ..................................................................... 1-5
Co-product Credit .............................................................................................................................. 1-6
Energy of Material Resource ............................................................................................................. 1-7
Postconsumer Recycling Methodology .............................................................................................. 1-9
DATA ..................................................................................................................................................... 1-9
Process Data ....................................................................................................................................... 1-9
Fuel Data .......................................................................................................................................... 1-11
Data Quality Goals for This Study ................................................................................................... 1-11
Data Accuracy .................................................................................................................................. 1-12
METHODOLOGY ISSUES ................................................................................................................. 1-13
Precombustion Energy and Emissions ............................................................................................. 1-13
Electricity Grid Fuel Profile ............................................................................................................. 1-13
METHODOLOGICAL DECISIONS ................................................................................................... 1-14
Geographic Scope ............................................................................................................................ 1-14
End of Life Management ................................................................................................................. 1-14
Water Use ........................................................................................................................................ 1-19
System Components Not Included ................................................................................................... 1-19
CHAPTER 2 – LIFE CYCLE INVENTORY RESULTS FOR DISPOSABLE FOODSERVICE
PRODUCTS ............................................................................................................................................... 2-1
INTRODUCTION .................................................................................................................................. 2-1
STUDY GOAL AND INTENDED USE ................................................................................................ 2-1
SCOPE AND BOUNDARIES ............................................................................................................... 2-2
FUNCTIONAL UNIT ............................................................................................................................ 2-3
SYSTEMS STUDIED ............................................................................................................................ 2-4
CLIENTS\PFPG\KC112313.doc
02.04.11 3666.00.003.001 iv
DATA SOURCES .................................................................................................................................. 2-5
RESULTS ............................................................................................................................................... 2-7
Energy Results ................................................................................................................................... 2-7
Solid Waste ...................................................................................................................................... 2-27
Environmental Emissions ................................................................................................................ 2-42
Water Use ........................................................................................................................................ 2-59
KEY OBSERVATIONS AND CONCLUSIONS ................................................................................ 2-65
CHAPTER 3 – SENSITIVITY ANALYSIS ON END-OF-LIFE DECOMPOSITION OF
PAPERBOARD PRODUCTS .................................................................................................................. 3-1
BACKGROUND .................................................................................................................................... 3-1
SCENARIO RESULTS .......................................................................................................................... 3-1
APPENDIX A – WATER USE ................................................................................................................ A-1
INTRODUCTION ................................................................................................................................. A-1
SOURCES OF WATER ........................................................................................................................ A-2
Surface Water ................................................................................................................................... A-2
Groundwater ..................................................................................................................................... A-2
TYPES OF WATER USE ..................................................................................................................... A-3
Cooling Water ................................................................................................................................... A-3
Process Water ................................................................................................................................... A-3
WATER USE DATA SOURCES ......................................................................................................... A-4
Electricity .......................................................................................................................................... A-5
Produced Water ................................................................................................................................. A-6
Water Use in Polystyrene Foam Production ..................................................................................... A-6
Water Use in PLA Production .......................................................................................................... A-7
Water Use in Paperboard Production ................................................................................................ A-7
APPENDIX B – PEER REVIEW .............................................................................................................B-1
List of Tables
Table ES-1 Products Modeled ................................................................................................................ ES-4
Table 2-1 Products Modeled .................................................................................................................. 2-6
Table 2-2 Energy Results by Category for Average Weight 16-oz Hot Cups ........................................ 2-9
Table 2-3 Energy Results by Category for Average Weight 32-oz Cold Cups .................................... 2-10
Table 2-4 Energy Results by Category for Average Weight Heavy Duty 9-inch Plates ...................... 2-11
Table 2-5 Energy Results by Category for Average Weight Sandwich-size Clamshells ..................... 2-12
Table 2-6 Higher Heating Value for Materials in Foodservice Products ............................................. 2-15
Table 2-7 Net Energy Results for Average Weight 16-oz Hot Cups .................................................... 2-16
Table 2-8 Net Energy Results for Average Weight 32-oz Cold Cups .................................................. 2-17
Table 2-9 Net Energy Results for Average Weight Heavy Duty 9-inch Plates .................................... 2-18
Table 2-10 Net Energy Results for Average Weight Sandwich-size Clamshells ................................... 2-19
Table 2-11 Fossil and Non-fossil Energy Results for Average Weight 16-oz Hot Cups ....................... 2-23
Table 2-12 Fossil and Non-fossil Energy Results for Average Weight 32-oz Cold Cups ...................... 2-24
Table 2-13 Fossil and Non-fossil Energy Results for Average Weight Heavy Duty 9-inch Plates ........ 2-25
Table 2-14 Fossil and Non-fossil Energy Results for Average Weight Sandwich-size Clamshells ....... 2-26
Table 2-15 Solid Waste by Weight for Average Weight 16-oz Hot Cups .............................................. 2-28
Table 2-16 Solid Waste by Weight for Average Weight 32-oz Cold Cups ............................................ 2-29
Table 2-17 Solid Waste by Weight for Average Weight Heavy Duty 9-inch Plates .............................. 2-30
CLIENTS\PFPG\KC112313.doc
02.04.11 3666.00.003.001 v
Table 2-18 Solid Waste by Weight for Average Weight Sandwich-size Clamshells ............................. 2-31
Table 2-19 Solid Waste by Volume for Average Weight 16-oz Hot Cups............................................. 2-35
Table 2-20 Solid Waste by Volume for Average Weight 32-oz Cold Cups ........................................... 2-36
Table 2-21 Solid Waste by Volume for Average Weight Heavy Duty 9-inch Plates ............................. 2-37
Table 2-22 Solid Waste by Volume for Average Weight Sandwich-size Clamshells ............................ 2-38
Table 2-23 Landfill Densities for Foodservice Products ........................................................................ 2-41
Table 2-24 Greenhouse Gas Emissions for Average Weight 16-oz Hot Cups ....................................... 2-44
Table 2-25 Greenhouse Gas Emissions for Average Weight 32-oz Cold Cups ..................................... 2-45
Table 2-26 Greenhouse Gas Emissions for Average Weight Heavy Duty 9-inch Plates ....................... 2-46
Table 2-27 Greenhouse Gas Emissions for Average Weight Sandwich-size Clamshells ...................... 2-47
Table 2-28 Process and Fuel-Related Greenhouse Gas Contributions by Substance for
Average Weight 16-oz Hot Cups ......................................................................................... 2-55
Table 2-29 Process and Fuel-Related Greenhouse Gas Contributions by Substance for
Average Weight 32-oz Cold Cups ....................................................................................... 2-56
Table 2-30 Process and Fuel-Related Greenhouse Gas Contributions by Substance for
Average Weight Heavy Duty 9-inch Plates ......................................................................... 2-57
Table 2-31 Process and Fuel-Related Greenhouse Gas Contributions by Substance for
Average Weight Sandwich-size Clamshells......................................................................... 2-58
Table 2-32 Water Use for Average Weight 16-oz Hot Cups .................................................................. 2-61
Table 2-33 Water Use for Average Weight 32-oz Cold Cups ................................................................ 2-62
Table 2-34 Water Use for Average Weight Heavy Duty 9-inch Plates .................................................. 2-62
Table 2-35 Water Use for Average Weight Sandwich-size Clamshells ................................................. 2-62
List of Figures
Figure ES-1 Energy for 16-oz Hot Cups ............................................................................................... ES-7
Figure ES-2 Energy for 32-oz Cold Cups ............................................................................................. ES-8
Figure ES-3 Energy for 9-inch Plates ................................................................................................... ES-8
Figure ES-4 Energy for Sandwich-size Clamshells .............................................................................. ES-9
Figure ES-5 Weight of Solid Waste for 16-oz Hot Cups .................................................................... ES-10
Figure ES-6 Weight of Solid Waste for 32-oz Cold Cups .................................................................. ES-11
Figure ES-7 Weight of Solid Waste for 9-inch Plates ........................................................................ ES-11
Figure ES-8 Weight of Solid Waste for Sandwich-size Clamshells ................................................... ES-12
Figure ES-9 Volume of Solid Waste for 16-oz Hot Cups ................................................................... ES-12
Figure ES-10 Volume of Solid Waste for 32-oz Cold Cups ................................................................. ES-13
Figure ES-11 Volume of Solid Waste for 9-inch Plates ....................................................................... ES-13
Figure ES-12 Volume of Solid Waste for Sandwich-size Clamshells .................................................. ES-14
Figure ES-13 Greenhouse Gas Emissions for 16-oz Hot Cups ............................................................. ES-15
Figure ES-14 Greenhouse Gas Emissions for 32-oz Cold Cups ........................................................... ES-16
Figure ES-15 Greenhouse Gas Emissions for 9-inch Plates ................................................................. ES-16
Figure ES-16 Greenhouse Gas Emissions for Sandwich-size Clamshells ............................................ ES-17
Figure ES-17 Gallons of Water Used for 16-oz Hot Cups .................................................................... ES-20
Figure ES-18 Gallons of Water Used for 32-oz Cold Cups .................................................................. ES-20
Figure ES-19 Gallons of Water Used for 9-inch Plates ........................................................................ ES-21
Figure ES-20 Gallons of Water Used for Sandwich-size Clamshells ................................................... ES-21
Figure 1-1 General Materials Flow for “Cradle-to-Grave” Analysis of a Product System .................. 1-1
Figure 1-2 “Black Box” Concept for Developing LCI Data ................................................................ 1-2
Figure 1-3 Illustration of the Energy Pool Concept ............................................................................. 1-8
Figure 2-1a Energy for 16-oz Hot Cups ............................................................................................... 2-13
Figure 2-2a Energy for 32-oz Cold Cups ............................................................................................. 2-13
Figure 2-3a Energy for 9-inch Plates ................................................................................................... 2-14
Figure 2-4a Energy for Sandwich-size Clamshells .............................................................................. 2-14
CLIENTS\PFPG\KC112313.doc
02.04.11 3666.00.003.001 vi
Figure 2-1b Net Energy for 16-oz Hot Cups ........................................................................................ 2-20
Figure 2-2b Net Energy for 32-oz Cold Cups ...................................................................................... 2-20
Figure 2-3b Net Energy for 9-inch Plates ............................................................................................ 2-21
Figure 2-4b Net Energy for Sandwich-size Clamshells ....................................................................... 2-21
Figure 2-5 Weight of Solid Waste for 16-oz Hot Cups ...................................................................... 2-32
Figure 2-6 Weight of Solid Waste for 32-oz Cold Cups .................................................................... 2-32
Figure 2-7 Weight of Solid Waste for 9-inch Plates .......................................................................... 2-33
Figure 2-8 Weight of Solid Waste for Sandwich-size Clamshells ..................................................... 2-33
Figure 2-9 Volume of Solid Waste for 16-oz Hot Cups ..................................................................... 2-39
Figure 2-10 Volume of Solid Waste for 32-oz Cold Cups ................................................................... 2-39
Figure 2-11 Volume of Solid Waste for 9-inch Plates ......................................................................... 2-40
Figure 2-12 Volume of Solid Waste for Sandwich-size Clamshells .................................................... 2-40
Figure 2-13a Greenhouse Gas Emissions for 16-oz Hot Cups ............................................................... 2-48
Figure 2-14a Greenhouse Gas Emissions for 32-oz Hot Cups ............................................................... 2-49
Figure 2-15a Greenhouse Gas Emissions for 9-inch Plates ................................................................... 2-49
Figure 2-16a Greenhouse Gas Emissions for Sandwich-size Clamshells .............................................. 2-50
Figure 2-13b Net Greenhouse Gas Emissions for 16-oz Hot Cups ........................................................ 2-50
Figure 2-14b Net Greenhouse Gas Emissions for 32-oz Cold Cups ...................................................... 2-51
Figure 2-15b Net Greenhouse Gas Emissions for 9-inch Plates ............................................................ 2-51
Figure 2-16b Net Greenhouse Gas Emissions for Sandwich-size Clamshells ....................................... 2-52
Figure 2-17 Gallons of Water Used for 16-oz Hot Cups ...................................................................... 2-63
Figure 2-18 Gallons of Water Used for 32-oz Cold Cups .................................................................... 2-63
Figure 2-19 Gallons of Water Used for 9-inch Plates .......................................................................... 2-64
Figure 2-20 Gallons of Water Used for Sandwich-size Clamshells ..................................................... 2-64
Figure 3-1a Sensitivity Analysis on End-of-Life Greenhouse Gas for 16-oz Hot Cups ........................ 3-3
Figure 3-2a Sensitivity Analysis on End-of-Life Greenhouse Gas for 32-oz Cold Cups ...................... 3-4
Figure 3-3a Sensitivity Analysis on End-of-Life Greenhouse Gas for 9-inch Heavy-Duty Plates ........ 3-5
Figure 3-1b Net Greenhouse Gas End-of-Life Sensitivity for 16-oz Hot Cups ..................................... 3-6
Figure 3-2b Net Greenhouse Gas End-of-Life Sensitivity for 32-oz Cold Cups.................................... 3-7
Figure 3-3b Net Greenhouse Gas End-of-Life Sensitivity for 9-inch Heavy-Duty Plates ..................... 3-8
CLIENTS\PFPG\KC112313.doc
02.04.11 3666.00.003.001 vii
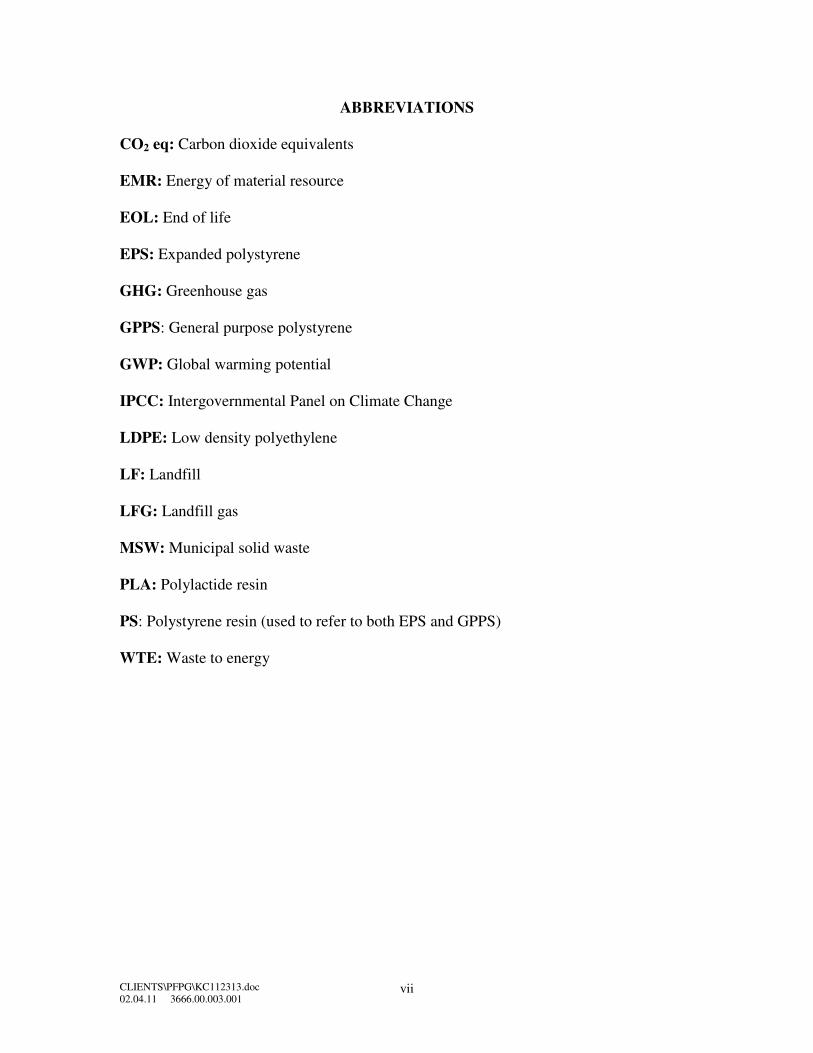
ABBREVIATIONS
CO2 eq: Carbon dioxide equivalents
EMR: Energy of material resource
EOL: End of life
EPS: Expanded polystyrene
GHG: Greenhouse gas
GPPS: General purpose polystyrene
GWP: Global warming potential
IPCC: Intergovernmental Panel on Climate Change
LDPE: Low density polyethylene
LF: Landfill
LFG: Landfill gas
MSW: Municipal solid waste
PLA: Polylactide resin
PS: Polystyrene resin (used to refer to both EPS and GPPS)
WTE: Waste to energy
Executive Summary
CLIENTS\PFPG\KC112313.doc
02.04.11 3666.00.003.001 ES-1
EXECUTIVE SUMMARY
INTRODUCTION
A life cycle inventory examines the sequence of steps in the life cycle of a
product system, beginning with raw material extraction and continuing on through
material production, product fabrication, use, reuse or recycling where applicable, and
final disposition. For each life cycle step, the inventory identifies and quantifies the
material inputs, energy consumption, and environmental emissions (atmospheric
emissions, waterborne wastes, and solid wastes). The information from this type of
analysis can be used as the basis for further study of the potential improvement of
resource use and environmental emissions associated with product systems. It can also
pinpoint areas (e.g., material components or processes) where changes would be most
beneficial in terms of reduced energy use or environmental emissions.
This study is an extension of a peer-reviewed life cycle inventory (LCI)
completed in 2006 for the Polystyrene Foodservice Packaging Council (PSPC), which is
now known as the Plastic Foodservice Packaging Group (PFPG). Although the study is
conducted as a life cycle inventory, this analysis includes the evaluation of the impact
category global warming potential (GWP) using 100-year GWP factors from the
Intergovernmental Panel on Climate Change (IPCC).
STUDY GOAL AND INTENDED USE
The goal of this study is to extend the scope of the 2006 PSPC LCI to include the
following additions:
1. Production and disposal of available PLA products corresponding as
closely as possible to the average weight foodservice products in the
original LCI,
2. Modeling of the carbon footprint implications of landfilling and waste-to-
energy (WTE) incineration of the average weight foodservice products
from the original study and the PLA products,
3. Addition of water use to the life cycle inventory results.
The primary intended use of the study results is to provide PFPG with more
complete information about the environmental burdens and greenhouse gas impacts from
the life cycle of disposable foodservice products. Because this study is based primarily on
average weight polystyrene foam and paperboard products from the original PSPC
study, plus limited availability of PLA product samples, the results of this study should
not be used to draw general conclusions about comparative results for the full range
of product weights available in each product category.
Executive Summary
CLIENTS\PFPG\KC112313.doc
02.04.11 3666.00.003.001 ES-2
Because the study will be made publicly available on the ACC website, the
completed report has been peer reviewed prior to release. The peer review report is
included as an appendix to this report.
SYSTEMS STUDIED
The following foodservice product categories are included in the analysis:
• 16-ounce hot cups (EPS foam, poly-coated paperboard with and without a
corrugated sleeve, PLA-coated paperboard with and without a corrugated
sleeve)
• 32-ounce cold cups (EPS foam, poly-coated paperboard, wax-coated
paperboard, solid PLA)
• 9-inch high-grade plates (GPPS foam, poly-coated paperboard, bleached
molded pulp, solid PLA)
• Sandwich-size clamshells (GPPS foam, corrugated paperboard, solid
PLA)
EPS and GPPS foam products have different structures because of differences in
how the blowing agent is added. For EPS products, the blowing agent is incorporated into
the resin bead. At product manufacture, the beads are expanded with steam, resulting in
products consisting of fused expanded beads. For GPPS products, the resin delivered to
the converter is solid and does not include blowing agent. The converter introduces the
blowing agent into the molten resin, producing a product with a continuous foamed
structure.
For the most part, the products modeled in this analysis are based on the average
weight products in the 2006 PSPC study. For the new category of PLA products, a
literature search was conducted for published information on weights of PLA foodservice
products, and product samples were ordered from several companies.
Although the goal of the study was to model PLA products that corresponded as
closely as possible with the PSPC study foodservice products, no PLA foam products
were found. Therefore, for the cold cup, plate, and clamshell applications, solid PLA
products are analyzed. Since the properties of PLA are not suitable for hot cups to be
made entirely from PLA, in the hot cup category a 16-ounce hot cup PLA-coated
paperboard hot cup is evaluated.
Executive Summary
CLIENTS\PFPG\KC112313.doc
02.04.11 3666.00.003.001 ES-3
For the category of plates, the 2006 PSPC study analyzed plates that were
categorized as heavy-duty plates. These were the heaviest and sturdiest plates available;
however, information on the relative strengths of these plates was not available. This
report also includes results for two lighter-weight plates from a 2009 study. The 2009
plates are in a different weight class from the heavy-duty plates from the 2006 study and
should not be directly compared to the 2006 heavy-duty plates. Results for the two lighter
class plates are provided for two reasons: (1) to illustrate how LCI results can vary based
on the weight of the product, and (2) to present a comparison based on actual equivalent
strength (since strength information was not available for the heavy-duty plates).
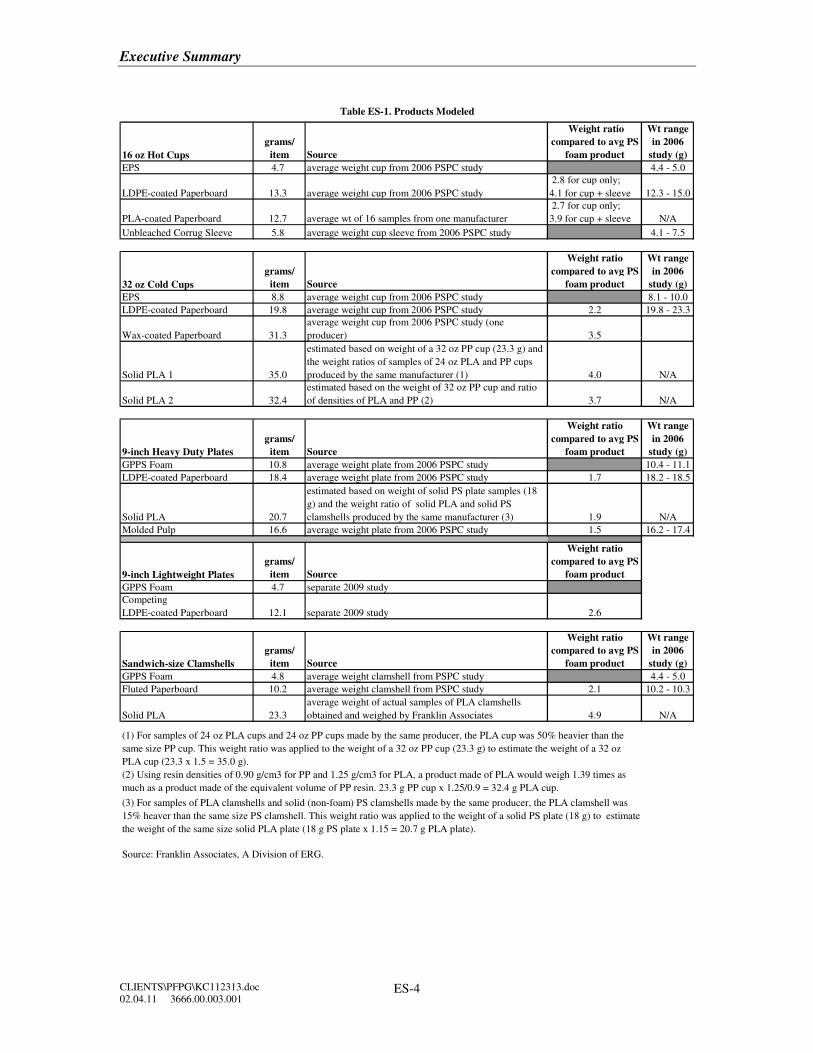
The product weights analyzed in this study are listed in Table ES-1, together with
a brief description of the source of the weight data.
SCOPE AND BOUNDARIES
The PSPC LCI included all steps in the production of each foodservice item, from
extraction of raw materials through production of the finished product. In this analysis,
the evaluation of foodservice products utilizing PLA uses corresponding scope and
boundaries. The modeling for PLA production begins with corn growing and continues
through production of PLA resin and fabrication of PLA foodservice products.
This analysis builds upon the original 2006 study, using the average product
weights from that study. The scope of this study did not include updating the full range of
product weights available in the marketplace. Readers interested in results for the full
range of product weights for polystyrene foam and paperboard products are encouraged
to refer to the 2006 study.1
In the U.S., municipal solid waste (MSW) that is not recovered for recycling or
composting is managed by landfilling and waste-to-energy (WTE) incineration. The
relative percentages of MSW managed by these methods is approximately 80 percent by
weight to landfill (LF) and 20 percent by weight to waste-to-energy (WTE) incineration.2
For material that is disposed by WTE combustion, an energy credit is given based on the
amount of each material burned, its higher heating value, and the efficiency of converting
the gross heat of combustion to useful energy.
1 “Final Peer-Reviewed Report: Life Cycle Inventory of Polystyrene Foam, Bleached Paperboard, and
Corrugated Paperboard Foodservice Products.” conducted by Franklin Associates, Ltd. for PSPC in
March 2006. Available at
http://www.americanchemistry.com/s_plastics/bin.asp?CID=1211&DID=9088&DOC=FILE.PDF
2 U.S. EPA. Municipal Solid Waste Facts and Figures 2008. Accessible at
http://www.epa.gov/msw/msw99.htm.
Executive Summary
CLIENTS\PFPG\KC112313.doc
02.04.11 3666.00.003.001 ES-4
16 oz Hot Cups
grams/
item Source
Weight ratio
compared to avg PS
foam product
Wt range
in 2006
study (g)
EPS 4.7 average weight cup from 2006 PSPC study 4.4 - 5.0
LDPE-coated Paperboard 13.3 average weight cup from 2006 PSPC study
2.8 for cup only;
4.1 for cup + sleeve 12.3 - 15.0
PLA-coated Paperboard 12.7 average wt of 16 samples from one manufacturer
2.7 for cup only;
3.9 for cup + sleeve N/A
Unbleached Corrug Sleeve 5.8 average weight cup sleeve from 2006 PSPC study 4.1 - 7.5
32 oz Cold Cups
grams/
item Source
Weight ratio
compared to avg PS
foam product
Wt range
in 2006
study (g)
EPS 8.8 average weight cup from 2006 PSPC study 8.1 - 10.0
LDPE-coated Paperboard 19.8 average weight cup from 2006 PSPC study 2.2 19.8 - 23.3
Wax-coated Paperboard 31.3
average weight cup from 2006 PSPC study (one
producer) 3.5
Solid PLA 1 35.0
estimated based on weight of a 32 oz PP cup (23.3 g) and
the weight ratios of samples of 24 oz PLA and PP cups
produced by the same manufacturer (1) 4.0 N/A
Solid PLA 2 32.4
estimated based on the weight of 32 oz PP cup and ratio
of densities of PLA and PP (2) 3.7 N/A
9-inch Heavy Duty Plates
grams/
item Source
Weight ratio
compared to avg PS
foam product
Wt range
in 2006
study (g)
GPPS Foam 10.8 average weight plate from 2006 PSPC study 10.4 - 11.1
LDPE-coated Paperboard 18.4 average weight plate from 2006 PSPC study 1.7 18.2 - 18.5
Solid PLA 20.7
estimated based on weight of solid PS plate samples (18
g) and the weight ratio of solid PLA and solid PS
clamshells produced by the same manufacturer (3) 1.9 N/A
Molded Pulp 16.6 average weight plate from 2006 PSPC study 1.5 16.2 - 17.4
9-inch Lightweight Plates
grams/
item Source
Weight ratio
compared to avg PS
foam product
GPPS Foam 4.7 separate 2009 study
Competing
LDPE-coated Paperboard 12.1 separate 2009 study 2.6
Sandwich-size Clamshells
grams/
item Source
Weight ratio
compared to avg PS
foam product
Wt range
in 2006
study (g)
GPPS Foam 4.8 average weight clamshell from PSPC study 4.4 - 5.0
Fluted Paperboard 10.2 average weight clamshell from PSPC study 2.1 10.2 - 10.3
Solid PLA 23.3
average weight of actual samples of PLA clamshells
obtained and weighed by Franklin Associates 4.9 N/A
Source: Franklin Associates, A Division of ERG.
(3) For samples of PLA clamshells and solid (non-foam) PS clamshells made by the same producer, the PLA clamshell was
15% heaver than the same size PS clamshell. This weight ratio was applied to the weight of a solid PS plate (18 g) to estimate
the weight of the same size solid PLA plate (18 g PS plate x 1.15 = 20.7 g PLA plate).
(1) For samples of 24 oz PLA cups and 24 oz PP cups made by the same producer, the PLA cup was 50% heavier than the
same size PP cup. This weight ratio was applied to the weight of a 32 oz PP cup (23.3 g) to estimate the weight of a 32 oz
PLA cup (23.3 x 1.5 = 35.0 g).
(2) Using resin densities of 0.90 g/cm3 for PP and 1.25 g/cm3 for PLA, a product made of PLA would weigh 1.39 times as
much as a product made of the equivalent volume of PP resin. 23.3 g PP cup x 1.25/0.9 = 32.4 g PLA cup.
Table ES-1. Products Modeled
Executive Summary
CLIENTS\PFPG\KC112313.doc
02.04.11 3666.00.003.001 ES-5
In this analysis, the end-of-life carbon footprint for each product is extended to
include estimates of carbon dioxide from WTE combustion of materials, methane from
decomposition of degradable landfilled material, emission credits for avoided grid
electricity displaced by electricity generated from WTE energy and landfill gas
combustion, and carbon sequestration in landfilled biomass-derived material that does not
decompose. The primary sources of information for modeling the carbon footprint for
landfilling and incineration were U.S. EPA reports containing information on generation
and management of landfill methane3,4, and a published article on methane generation
from decomposition of materials in simulated landfill conditions.5 According to the
website of NatureWorks LLC, the sole commercial producer of PLA in the U.S., PLA
does not biodegrade in landfills.6
Assumptions about the decomposition of landfilled paperboard foodservice
products have a significant effect on the end-of-life global warming potential results for
paperboard products. This analysis includes end-of-life results for decomposition
scenarios ranging from no decomposition to maximum decomposition of bleached
paperboard from landfill simulation experiments. The greenhouse gas emissions are
based on anaerobic decomposition, producing an equimolar mixture of carbon dioxide
and methane. Additional sensitivity analyses are shown in Chapter 3 examining the
effects of alternative scenarios for reduced gas production and higher oxidation rates of
methane in landfill cover.
The focus of this analysis is on the differences in environmental profiles for the
products themselves. Secondary packaging is not included. The scope of this analysis
does not include recycling or composting of any of the products studied. These issues
were addressed in the 2006 PSPC study. Readers interested in the contribution of
secondary packaging or the impacts of low levels of composting and recycling of
foodservice products are encouraged to refer to the 2006 study.
FUNCTIONAL UNIT
In a life cycle study, products are compared on the basis of providing the same
defined function (called the functional unit). The function of disposable foodservice
products is to contain beverages or food for a single use. The functional unit in this
analysis is 10,000 items of each foodservice product.
3 U.S. EPA. Solid Waste Management and Greenhouse Gases: A Life-Cycle Assessment of
Emissions and Sinks. Third Edition. September 2006.
http://www.epa.gov/climatechange/wycd/waste/downloads/fullreport.pdf
4 U.S. EPA. Draft Inventory of U.S. Greenhouse Gas Emissions and Sinks: 1990-2006 (February
2008). Calculated from 2006 data in Table 8-4. Accessible at
http://www.epa.gov/climatechange/emissions/usinventoryreport.html.
5 Barlaz, Morton, et al. “Biodegradability of Municipal Solid Waste Components in Laboratory-Scale
Landfills.” Published in Environmental Science & Technology. Volume 31, Number 3, 1997.
6 NatureWorks LLC website, “Fact or Fiction?” section. http://www.natureworksllc.com/product-and-
applications/fact%20or%20fiction.aspx#meth. Accessed in March 2008.
Executive Summary
CLIENTS\PFPG\KC112313.doc
02.04.11 3666.00.003.001 ES-6
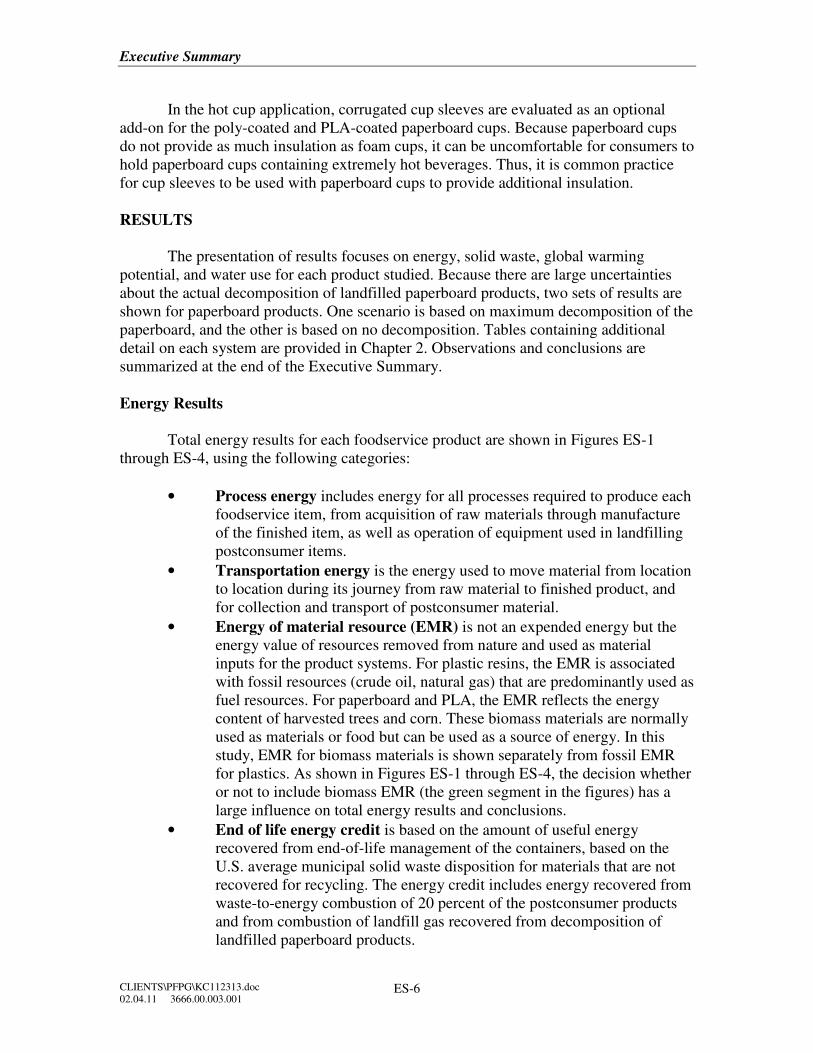
In the hot cup application, corrugated cup sleeves are evaluated as an optional
add-on for the poly-coated and PLA-coated paperboard cups. Because paperboard cups
do not provide as much insulation as foam cups, it can be uncomfortable for consumers to
hold paperboard cups containing extremely hot beverages. Thus, it is common practice
for cup sleeves to be used with paperboard cups to provide additional insulation.
RESULTS
The presentation of results focuses on energy, solid waste, global warming
potential, and water use for each product studied. Because there are large uncertainties
about the actual decomposition of landfilled paperboard products, two sets of results are
shown for paperboard products. One scenario is based on maximum decomposition of the
paperboard, and the other is based on no decomposition. Tables containing additional
detail on each system are provided in Chapter 2. Observations and conclusions are
summarized at the end of the Executive Summary.
Energy Results
Total energy results for each foodservice product are shown in Figures ES-1
through ES-4, using the following categories:
• Process energy includes energy for all processes required to produce each
foodservice item, from acquisition of raw materials through manufacture
of the finished item, as well as operation of equipment used in landfilling
postconsumer items.
• Transportation energy is the energy used to move material from location
to location during its journey from raw material to finished product, and
for collection and transport of postconsumer material.
• Energy of material resource (EMR) is not an expended energy but the
energy value of resources removed from nature and used as material
inputs for the product systems. For plastic resins, the EMR is associated
with fossil resources (crude oil, natural gas) that are predominantly used as
fuel resources. For paperboard and PLA, the EMR reflects the energy
content of harvested trees and corn. These biomass materials are normally
used as materials or food but can be used as a source of energy. In this
study, EMR for biomass materials is shown separately from fossil EMR
for plastics. As shown in Figures ES-1 through ES-4, the decision whether
or not to include biomass EMR (the green segment in the figures) has a
large influence on total energy results and conclusions.
• End of life energy credit is based on the amount of useful energy
recovered from end-of-life management of the containers, based on the
U.S. average municipal solid waste disposition for materials that are not
recovered for recycling. The energy credit includes energy recovered from
waste-to-energy combustion of 20 percent of the postconsumer products
and from combustion of landfill gas recovered from decomposition of
landfilled paperboard products.
Executive Summary
CLIENTS\PFPG\KC112313.doc
02.04.11 3666.00.003.001 ES-7
The process and transportation energy segments shown in the figures represent
energy that has been completely expended (e.g., from combustion of fuels). For the
energy reported as EMR, much of this energy remains embodied in postconsumer
products that are sent to landfills at end of life. The net expended energy for each system
is calculated as the energy content of the resources extracted as material feedstock for the
product, plus the process and transportation energy, minus the energy content in
landfilled products, minus the energy recovered at end of life from combustion of
products and combustion of recovered landfill gas from decomposition of landfilled
products. The net expended energy value is shown above each detailed energy bar.
Figure ES-1. Energy for 16-oz Hot Cups
(10,000 average weight cups)
-1
0
1
2
3
4
5
6
7
8
9
10
11
12
13
EPS
4.7g
LDPE Ppbd
13.3g
max decomp
LDPE Ppbd
13.3g
0% decomp
LDPE Ppbd
+ 4.1g sleeve
max decomp
LDPE Ppbd
+ 4.1g sleeve
0% decomp
PLA Ppbd
12.7g
max decomp
PLA Ppbd
12.7g
0% decomp
PLA Ppbd
+ 4.1g sleeve
max decomp
PLA Ppbd
+ 4.1g sleeve
0% decomp
Millio
n B
tu
EOL WTE Credit
Biomass EMR
Fossil EMR
Transp
Process
net
5.4
net
8.6
net
8.3
net
6.8
net
6.5
net
8.3
net
7.9
net
6.5
net
6.2
Net expended energy = total energy requirements - energy recovery - energy content of landfilled material
Executive Summary
CLIENTS\PFPG\KC112313.doc
02.04.11 3666.00.003.001 ES-8
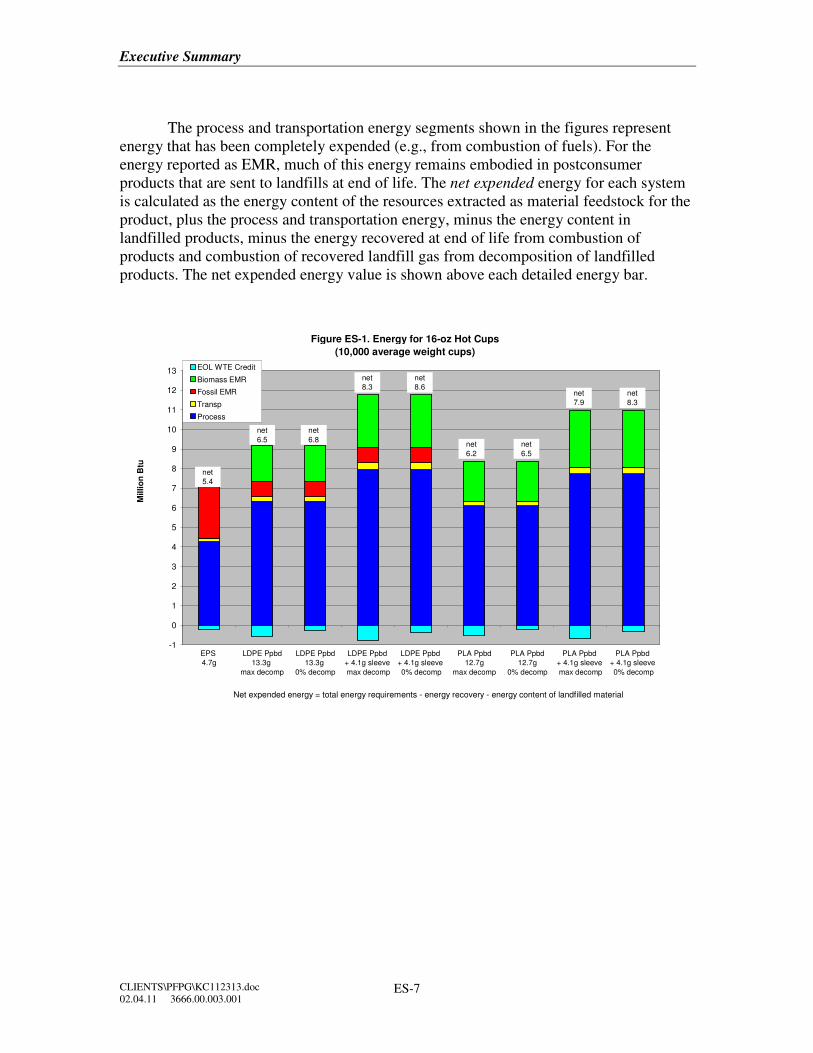
Figure ES-2. Energy for 32-oz Cold Cups
(10,000 average weight cups)
-2
0
2
4
6
8
10
12
14
16
18
20
22
24
26
28
EPS
8.8g
LDPE Ppbd
19.8g
max decomp
LDPE Ppbd
19.8g
0% decomp
Wax Ppbd
31.3g
max decomp
Wax Ppbd
31.3g
0% decomp
PLA
35g
50% heavier
than 32oz PP
PLA
32.6g
39% heavier
than 32oz PP
Millio
n B
tu
EOL WTE Credit
Biomass EMR
Fossil EMR
Transp
Process
net
9.6
net
16.2
net
17.5
net
19.5
net
18.6
net
10.8
net
10.3
Net expended energy = total energy requirements - energy recovery - energy content of landfilled material
Figure ES-3. Energy for 9-inch Plates
(10,000 average weight plates)
-2
0
2
4
6
8
10
12
14
16
GPPS
10.8g
LDPE Ppbd
18.4g
max decomp
LDPE Ppbd
18.4g
0% decomp
Mold Pulp
16.6g
max decomp
Mold Pulp
16.6g
0% decomp
PLA
20.7g
2009
GPPS
4.7g
2009
LDPE Ppbd
12.1g
max decomp
HEAVY-DUTY PLATES LIGHTWEIGHT PLATES
Mill
ion B
tu
EOL WTE Credit
Biomass EMR
Fossil EMR
Transp
Process
net
8.4
net
10.3
net
9.7
net
10.9
net
11.3
net
10.4
net
3.6
net
6.1
Net expended energy = total energy requirements - energy recovery - energy content of landfilled material
Executive Summary
CLIENTS\PFPG\KC112313.doc
02.04.11 3666.00.003.001 ES-9
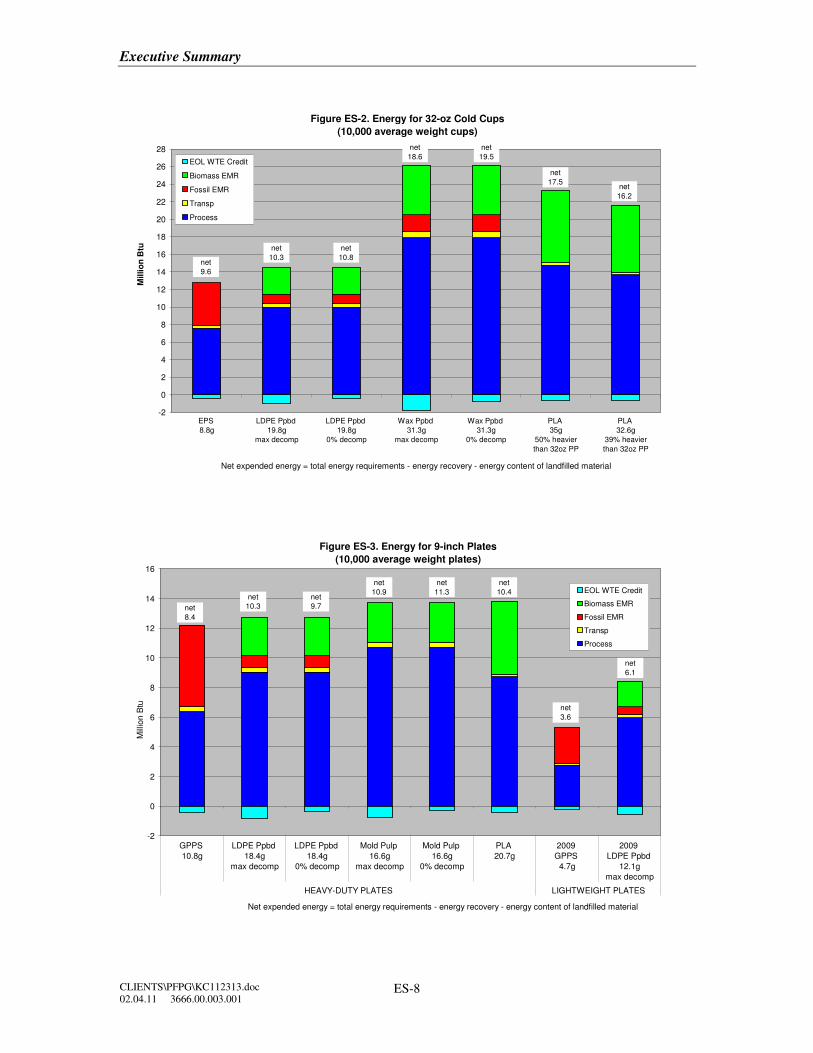
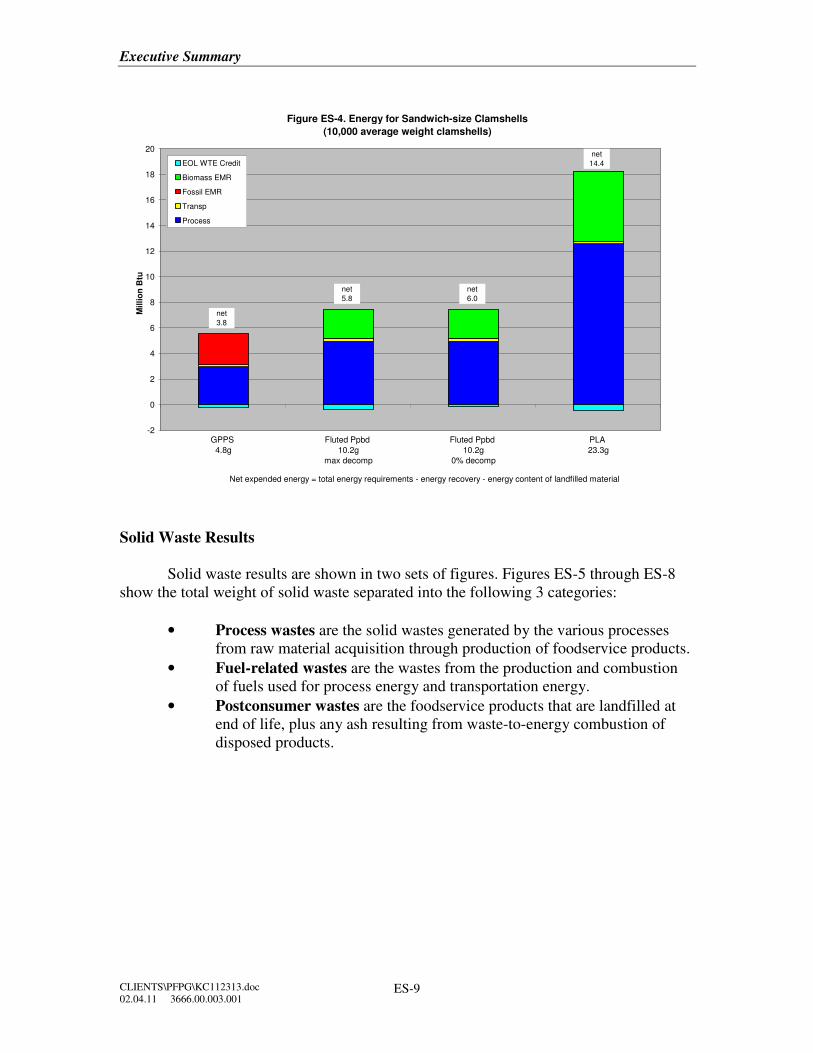
Figure ES-4. Energy for Sandwich-size Clamshells
(10,000 average weight clamshells)
-2
0
2
4
6
8
10
12
14
16
18
20
GPPS
4.8g
Fluted Ppbd
10.2g
max decomp
Fluted Ppbd
10.2g
0% decomp
PLA
23.3g
Millio
n B
tu
EOL WTE Credit
Biomass EMR
Fossil EMR
Transp
Process
net
3.8
net
14.4
net
6.0
net
5.8
Net expended energy = total energy requirements - energy recovery - energy content of landfilled material
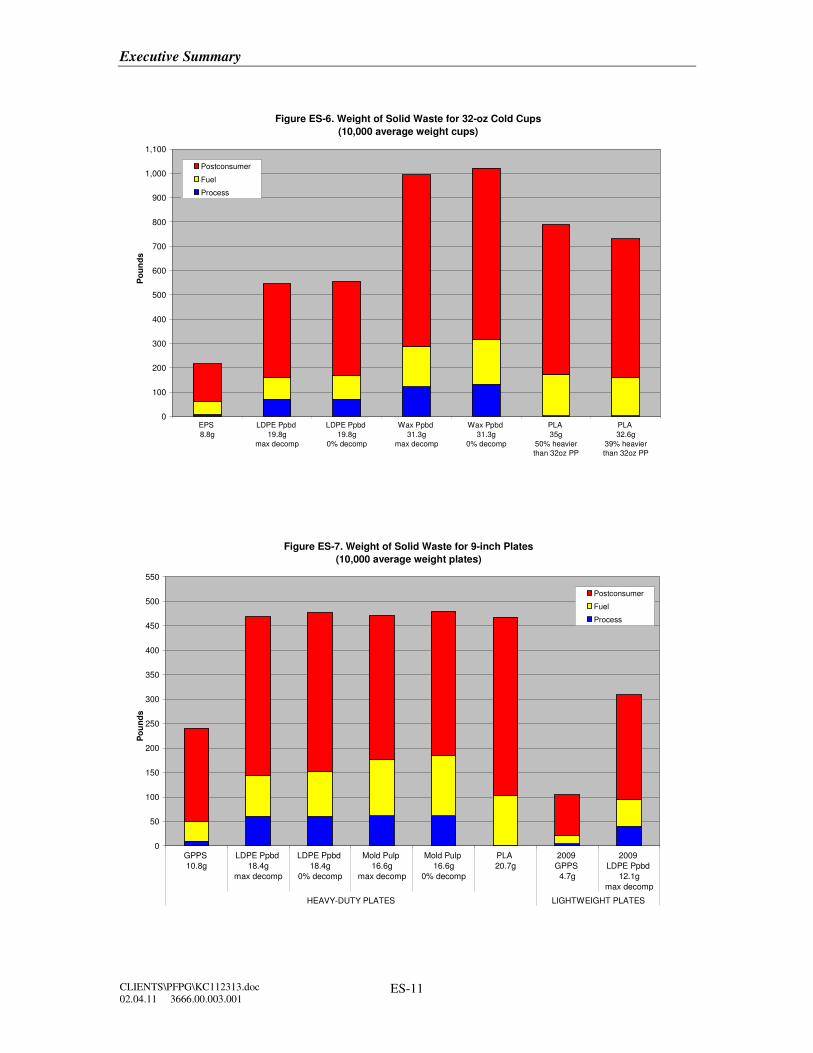
Solid Waste Results
Solid waste results are shown in two sets of figures. Figures ES-5 through ES-8
show the total weight of solid waste separated into the following 3 categories:
• Process wastes are the solid wastes generated by the various processes
from raw material acquisition through production of foodservice products.
• Fuel-related wastes are the wastes from the production and combustion
of fuels used for process energy and transportation energy.
• Postconsumer wastes are the foodservice products that are landfilled at
end of life, plus any ash resulting from waste-to-energy combustion of
disposed products.

Executive Summary
CLIENTS\PFPG\KC112313.doc
02.04.11 3666.00.003.001 ES-10
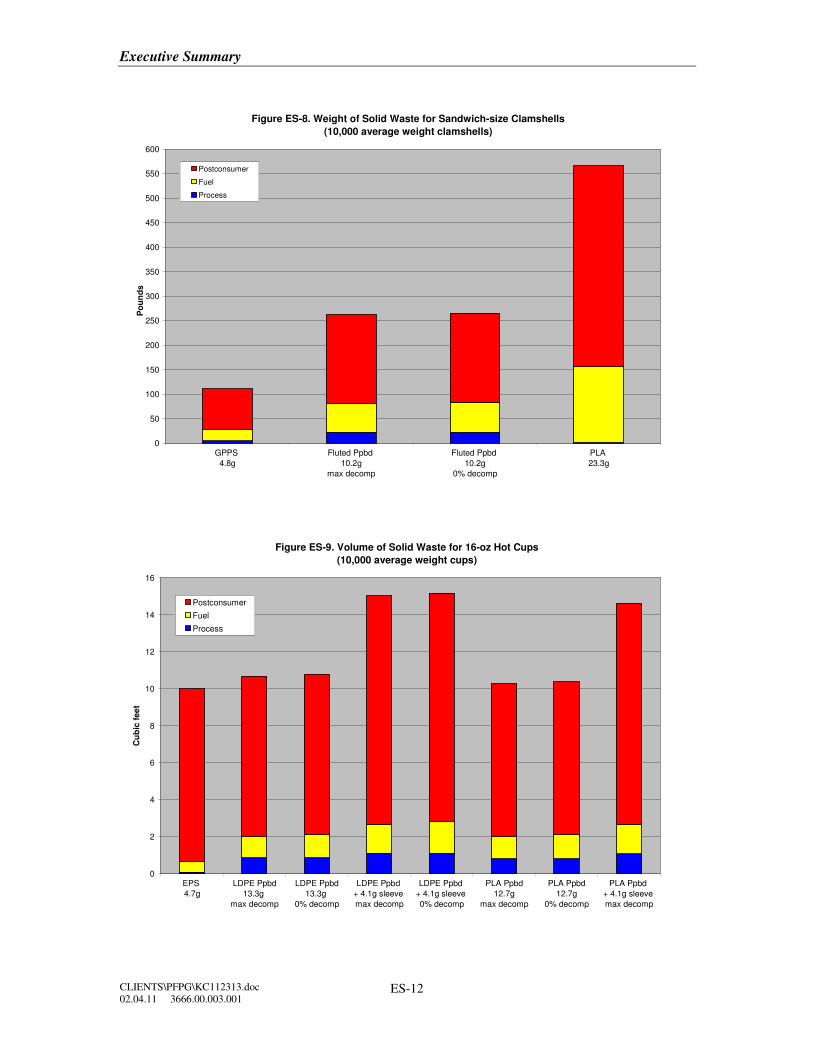
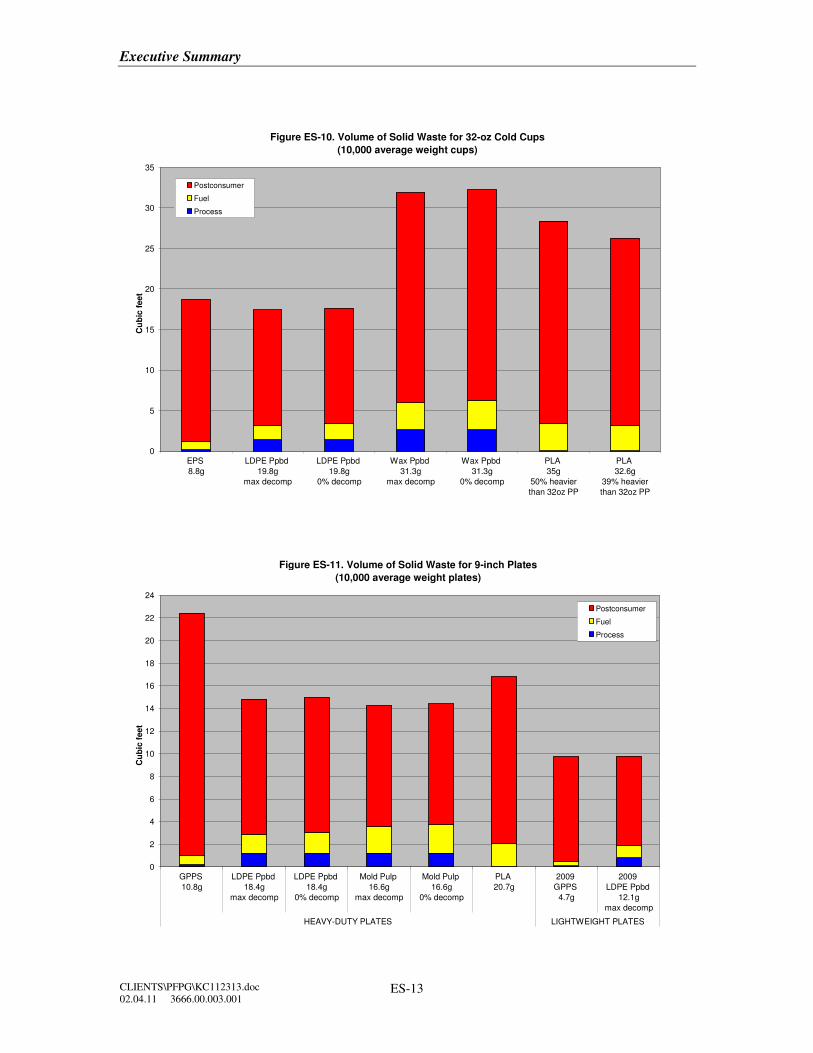
Figures ES-9 through ES-12 show the same results converted to a volume basis
using landfill densities that take into account not only the density of the material as put
into the landfill but also the degree to which the material compacts in the landfill.
Comparing the weight-based and volume-based figures, it can be seen that different
comparative conclusions can be reached about solid waste depending on whether a
weight or volume basis is used.
Both solid waste figures show that the majority of solid waste, whether reported
by weight or by volume, is associated with postconsumer products.
The lower the landfill density, the more space the component takes up. For
example, foam plates have a lower landfill density than paperboard plates, so a pound of
foam plates takes up more landfill space than a pound of paperboard plates.
Figure ES-5. Weight of Solid Waste for 16-oz Hot Cups
(10,000 average weight cups)
0
50
100
150
200
250
300
350
400
450
500
550
EPS
4.7g
LDPE Ppbd
13.3g
max decomp
LDPE Ppbd
13.3g
0% decomp
LDPE Ppbd
+ 4.1g sleeve
max decomp
LDPE Ppbd
+ 4.1g sleeve
0% decomp
PLA Ppbd
12.7g
max decomp
PLA Ppbd
12.7g
0% decomp
PLA Ppbd
+ 4.1g sleeve
max decomp
Po
un
ds
Postconsumer
Fuel
Process
Executive Summary
CLIENTS\PFPG\KC112313.doc
02.04.11 3666.00.003.001 ES-11
Figure ES-6. Weight of Solid Waste for 32-oz Cold Cups
(10,000 average weight cups)
0
100
200
300
400
500
600
700
800
900
1,000
1,100
EPS
8.8g
LDPE Ppbd
19.8g
max decomp
LDPE Ppbd
19.8g
0% decomp
Wax Ppbd
31.3g
max decomp
Wax Ppbd
31.3g
0% decomp
PLA
35g
50% heavier
than 32oz PP
PLA
32.6g
39% heavier
than 32oz PP
Po
un
ds
Postconsumer
Fuel
Process
Figure ES-7. Weight of Solid Waste for 9-inch Plates
(10,000 average weight plates)
0
50
100
150
200
250
300
350
400
450
500
550
GPPS
10.8g
LDPE Ppbd
18.4g
max decomp
LDPE Ppbd
18.4g
0% decomp
Mold Pulp
16.6g
max decomp
Mold Pulp
16.6g
0% decomp
PLA
20.7g
2009
GPPS
4.7g
2009
LDPE Ppbd
12.1g
max decomp
HEAVY-DUTY PLATES LIGHTWEIGHT PLATES
Po
un
ds
Postconsumer
Fuel
Process
Executive Summary
CLIENTS\PFPG\KC112313.doc
02.04.11 3666.00.003.001 ES-12
Figure ES-8. Weight of Solid Waste for Sandwich-size Clamshells
(10,000 average weight clamshells)
0
50
100
150
200
250
300
350
400
450
500
550
600
GPPS
4.8g
Fluted Ppbd
10.2g
max decomp
Fluted Ppbd
10.2g
0% decomp
PLA
23.3g
Po
un
ds
Postconsumer
Fuel
Process
Figure ES-9. Volume of Solid Waste for 16-oz Hot Cups
(10,000 average weight cups)
0
2
4
6
8
10
12
14
16
EPS
4.7g
LDPE Ppbd
13.3g
max decomp
LDPE Ppbd
13.3g
0% decomp
LDPE Ppbd
+ 4.1g sleeve
max decomp
LDPE Ppbd
+ 4.1g sleeve
0% decomp
PLA Ppbd
12.7g
max decomp
PLA Ppbd
12.7g
0% decomp
PLA Ppbd
+ 4.1g sleeve
max decomp
Cu
bic
fee
t
Postconsumer
Fuel
Process
Executive Summary
CLIENTS\PFPG\KC112313.doc
02.04.11 3666.00.003.001 ES-13
Figure ES-10. Volume of Solid Waste for 32-oz Cold Cups
(10,000 average weight cups)
0
5
10
15
20
25
30
35
EPS
8.8g
LDPE Ppbd
19.8g
max decomp
LDPE Ppbd
19.8g
0% decomp
Wax Ppbd
31.3g
max decomp
Wax Ppbd
31.3g
0% decomp
PLA
35g
50% heavier
than 32oz PP
PLA
32.6g
39% heavier
than 32oz PP
Cu
bic
feet
Postconsumer
Fuel
Process
Figure ES-11. Volume of Solid Waste for 9-inch Plates
(10,000 average weight plates)
0
2
4
6
8
10
12
14
16
18
20
22
24
GPPS
10.8g
LDPE Ppbd
18.4g
max decomp
LDPE Ppbd
18.4g
0% decomp
Mold Pulp
16.6g
max decomp
Mold Pulp
16.6g
0% decomp
PLA
20.7g
2009
GPPS
4.7g
2009
LDPE Ppbd
12.1g
max decomp
HEAVY-DUTY PLATES LIGHTWEIGHT PLATES
Cu
bic
feet
Postconsumer
Fuel
Process
Executive Summary
CLIENTS\PFPG\KC112313.doc
02.04.11 3666.00.003.001 ES-14
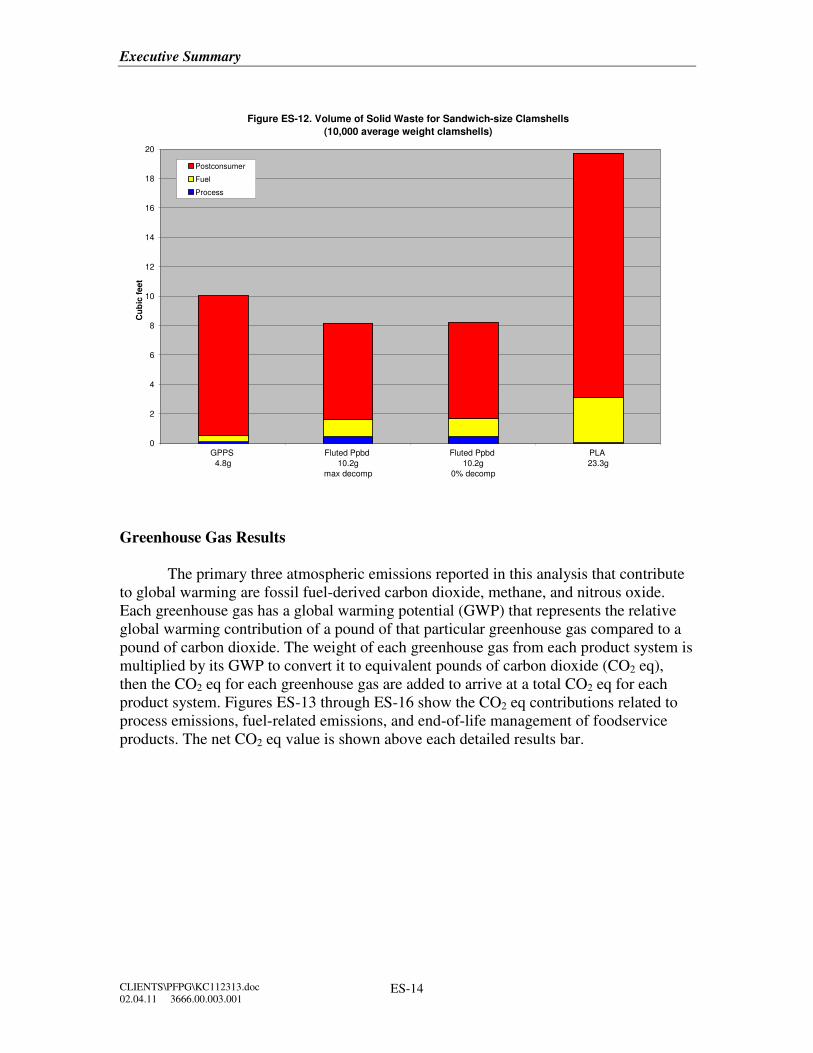
Figure ES-12. Volume of Solid Waste for Sandwich-size Clamshells
(10,000 average weight clamshells)
0
2
4
6
8
10
12
14
16
18
20
GPPS
4.8g
Fluted Ppbd
10.2g
max decomp
Fluted Ppbd
10.2g
0% decomp
PLA
23.3g
Cu
bic
feet
Postconsumer
Fuel
Process
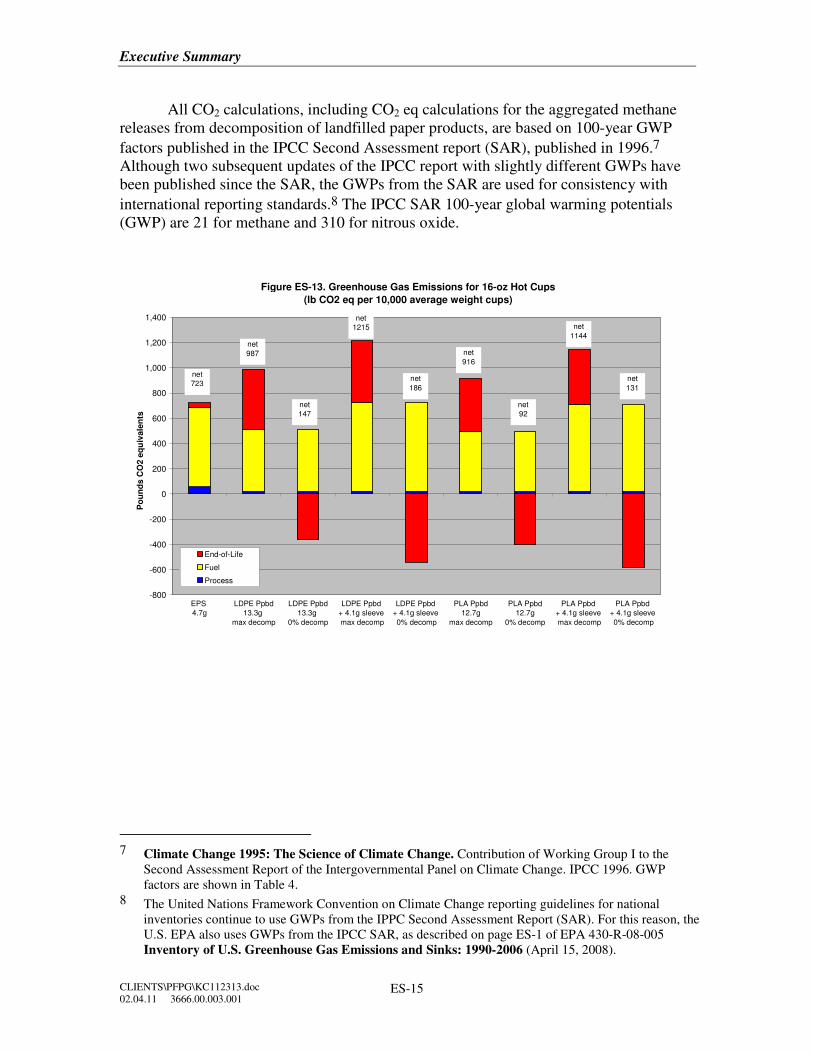
Greenhouse Gas Results
The primary three atmospheric emissions reported in this analysis that contribute
to global warming are fossil fuel-derived carbon dioxide, methane, and nitrous oxide.
Each greenhouse gas has a global warming potential (GWP) that represents the relative
global warming contribution of a pound of that particular greenhouse gas compared to a
pound of carbon dioxide. The weight of each greenhouse gas from each product system is
multiplied by its GWP to convert it to equivalent pounds of carbon dioxide (CO2 eq),
then the CO2 eq for each greenhouse gas are added to arrive at a total CO2 eq for each
product system. Figures ES-13 through ES-16 show the CO2 eq contributions related to
process emissions, fuel-related emissions, and end-of-life management of foodservice
products. The net CO2 eq value is shown above each detailed results bar.
Executive Summary
CLIENTS\PFPG\KC112313.doc
02.04.11 3666.00.003.001 ES-15
All CO2 calculations, including CO2 eq calculations for the aggregated methane
releases from decomposition of landfilled paper products, are based on 100-year GWP
factors published in the IPCC Second Assessment report (SAR), published in 1996.7
Although two subsequent updates of the IPCC report with slightly different GWPs have
been published since the SAR, the GWPs from the SAR are used for consistency with
international reporting standards.8 The IPCC SAR 100-year global warming potentials
(GWP) are 21 for methane and 310 for nitrous oxide.
Figure ES-13. Greenhouse Gas Emissions for 16-oz Hot Cups
(lb CO2 eq per 10,000 average weight cups)
-800
-600
-400
-200
0
200
400
600
800
1,000
1,200
1,400
EPS
4.7g
LDPE Ppbd
13.3g
max decomp
LDPE Ppbd
13.3g
0% decomp
LDPE Ppbd
+ 4.1g sleeve
max decomp
LDPE Ppbd
+ 4.1g sleeve
0% decomp
PLA Ppbd
12.7g
max decomp
PLA Ppbd
12.7g
0% decomp
PLA Ppbd
+ 4.1g sleeve
max decomp
PLA Ppbd
+ 4.1g sleeve
0% decomp
Po
un
ds C
O2 e
qu
ivale
nts
End-of-Life
Fuel
Process
net
723
net
92
net
916
net
186
net
1215
net
147
net
987
net
1144
net
131
7 Climate Change 1995: The Science of Climate Change. Contribution of Working Group I to the
Second Assessment Report of the Intergovernmental Panel on Climate Change. IPCC 1996. GWP
factors are shown in Table 4.
8 The United Nations Framework Convention on Climate Change reporting guidelines for national
inventories continue to use GWPs from the IPPC Second Assessment Report (SAR). For this reason, the
U.S. EPA also uses GWPs from the IPCC SAR, as described on page ES-1 of EPA 430-R-08-005
Inventory of U.S. Greenhouse Gas Emissions and Sinks: 1990-2006 (April 15, 2008).
Executive Summary
CLIENTS\PFPG\KC112313.doc
02.04.11 3666.00.003.001 ES-16
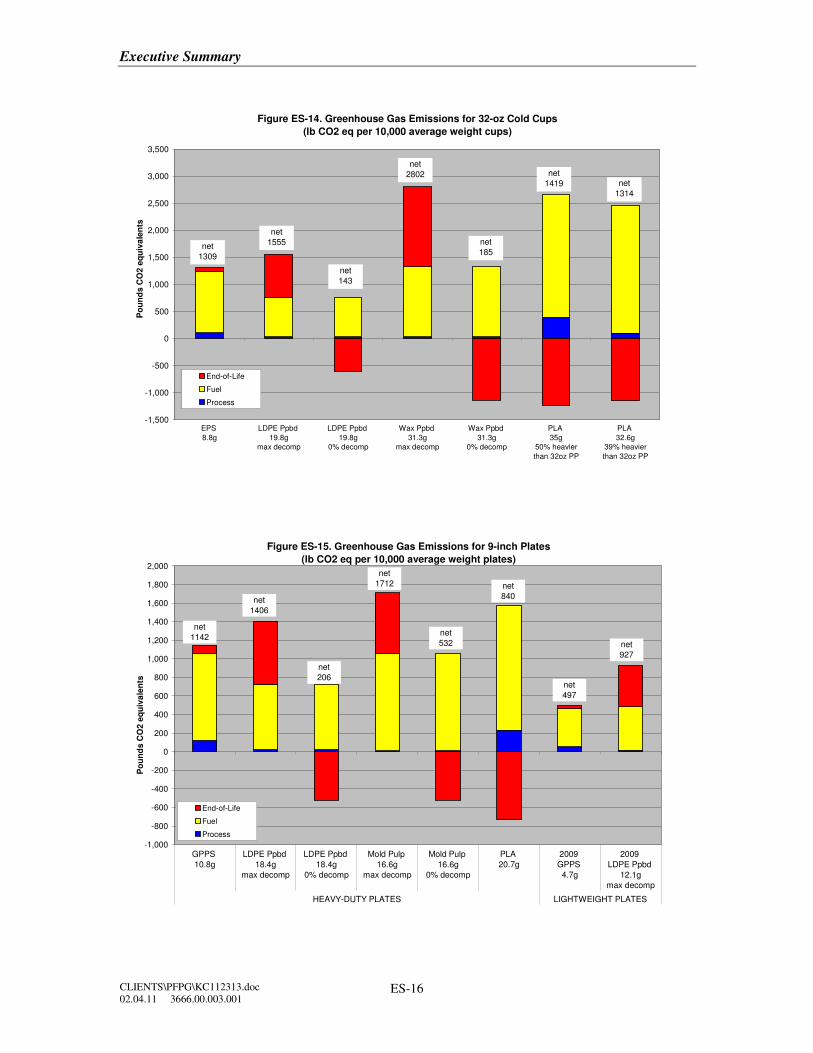
Figure ES-14. Greenhouse Gas Emissions for 32-oz Cold Cups
(lb CO2 eq per 10,000 average weight cups)
-1,500
-1,000
-500
0
500
1,000
1,500
2,000
2,500
3,000
3,500
EPS
8.8g
LDPE Ppbd
19.8g
max decomp
LDPE Ppbd
19.8g
0% decomp
Wax Ppbd
31.3g
max decomp
Wax Ppbd
31.3g
0% decomp
PLA
35g
50% heavier
than 32oz PP
PLA
32.6g
39% heavier
than 32oz PP
Po
un
ds C
O2 e
qu
iva
len
ts
End-of-Life
Fuel
Process
net
1309
net
1419
net
185
net
2802
net
143
net
1555
net
1314
Figure ES-15. Greenhouse Gas Emissions for 9-inch Plates
(lb CO2 eq per 10,000 average weight plates)
-1,000
-800
-600
-400
-200
0
200
400
600
800
1,000
1,200
1,400
1,600
1,800
2,000
GPPS
10.8g
LDPE Ppbd
18.4g
max decomp
LDPE Ppbd
18.4g
0% decomp
Mold Pulp
16.6g
max decomp
Mold Pulp
16.6g
0% decomp
PLA
20.7g
2009
GPPS
4.7g
2009
LDPE Ppbd
12.1g
max decomp
HEAVY-DUTY PLATES LIGHTWEIGHT PLATES
Po
un
ds C
O2 e
qu
iva
len
ts
End-of-Life
Fuel
Process
net
1142
net
840
net
532
net
1712
net
206
net
1406
net
497
net
927

Executive Summary
CLIENTS\PFPG\KC112313.doc
02.04.11 3666.00.003.001 ES-17
Figure ES-16. Greenhouse Gas Emissions for Sandwich-size Clamshells
(lb CO2 eq per 10,000 average weight clamshells)
-1,000
-800
-600
-400
-200
0
200
400
600
800
1,000
1,200
1,400
1,600
1,800
2,000
2,200
2,400
2,600
GPPS
4.8g
Fluted Ppbd
10.2g
max decomp
Fluted Ppbd
10.2g
0% decomp
PLA
23.3g
Po
un
ds C
O2 e
qu
ivale
nts
End-of-Life
Fuel
Process
net
529
net
1492
net
216
net
681
The “Net End of Life” segment in Figures ES-13 through ES-16 includes
estimates for the greenhouse gas effects of end-of-life management of foodservice
products, including energy credits for useful energy that is recovered from waste-to-
energy combustion of postconsumer items and from waste-to-energy combustion of
recovered landfill gas. The methodology and data sources for these calculations are
described in detail in the End-of-Life Management section of Chapter 1. The end-of-life
GHG results should be considered to have a higher uncertainty than the process and fuel-
related GHG results. For paperboard items, the end-of-life GHG results are strongly
dependent on assumptions about decomposition in landfills and the fate of methane
produced from decomposition. However, some general observations can be made.
Executive Summary
CLIENTS\PFPG\KC112313.doc
02.04.11 3666.00.003.001 ES-18
Neither PS nor PLA decomposes to produce methane in landfills.9,10 For the
biomass-derived PLA content of the foodservice products, there is a net end-of-life CO2
eq credit for carbon sequestered in landfilled PLA products and for grid electricity
emissions that are displaced by electricity from WTE combustion of PLA products.
Polystyrene foam products show a small net increase in CO2 eq because the fossil CO2
emissions from WTE combustion of fossil resins are greater than the emission credits for
grid electricity displaced by the recovered energy. Although PS has a high carbon content
and does not decompose to produce methane in landfills, no carbon sequestration credit is
assigned to fossil-derived plastics. This is consistent with the U.S. EPA greenhouse gas
accounting methodology, which treats landfilling of plastic as a transfer from one carbon
stock (the oil field) to another carbon stock (the landfill) with no net change in the overall
amount of carbon stored.11
When paperboard foodservice products decompose anaerobically, methane is
generated. The landfill methane emissions estimated in this analysis represent the
cumulative releases of methane from decomposition, which will occur over a period of
many years. In addition to decomposition emissions, fossil CO2 is released from the resin
coatings when coated paperboard products are burned in WTE combustion facilities.
There are credits for carbon sequestration in the undecomposed paperboard and credits
for displacement of grid electricity when energy is recovered from WTE combustion of
landfill gas and from WTE combustion of disposed postconsumer paperboard products.
When paperboard foodservice products are modeled at maximum experimental
decomposition levels, the overall effect of end-of-life management activities for these
products is a net increase in CO2 eq, because the CO2 eq for the cumulative fugitive
methane emissions is much greater than the CO2 eq credits for WTE combustion and
sequestration in landfilled material that does not decompose.
When paperboard products are modeled at 0 percent decomposition, however, the
net end-of-life results are very different. At 0 percent decomposition, no methane is
produced and all the carbon content of the paperboard is sequestered in the landfilled
products, so that there is a large net CO2 eq credit for paperboard products.
9 U.S. EPA. Solid Waste Management and Greenhouse Gases: A Life-Cycle Assessment of
Emissions and Sinks. Third Edition. September 2006. Page 79 of Chapter 6 Landfilling states
“Plastics, carpet, PCs, clay bricks, concrete, fly ash, and tires do not biodegrade measurably in
anaerobic conditions, and therefore do not generate any CH4.”
10 NatureWorks LLC website, “Fact or Fiction?” section.
11 U.S. EPA. Solid Waste Management and Greenhouse Gases: A Life-Cycle Assessment of
Emissions and Sinks. Third Edition. September 2006. Page 6.
Executive Summary
CLIENTS\PFPG\KC112313.doc
02.04.11 3666.00.003.001 ES-19
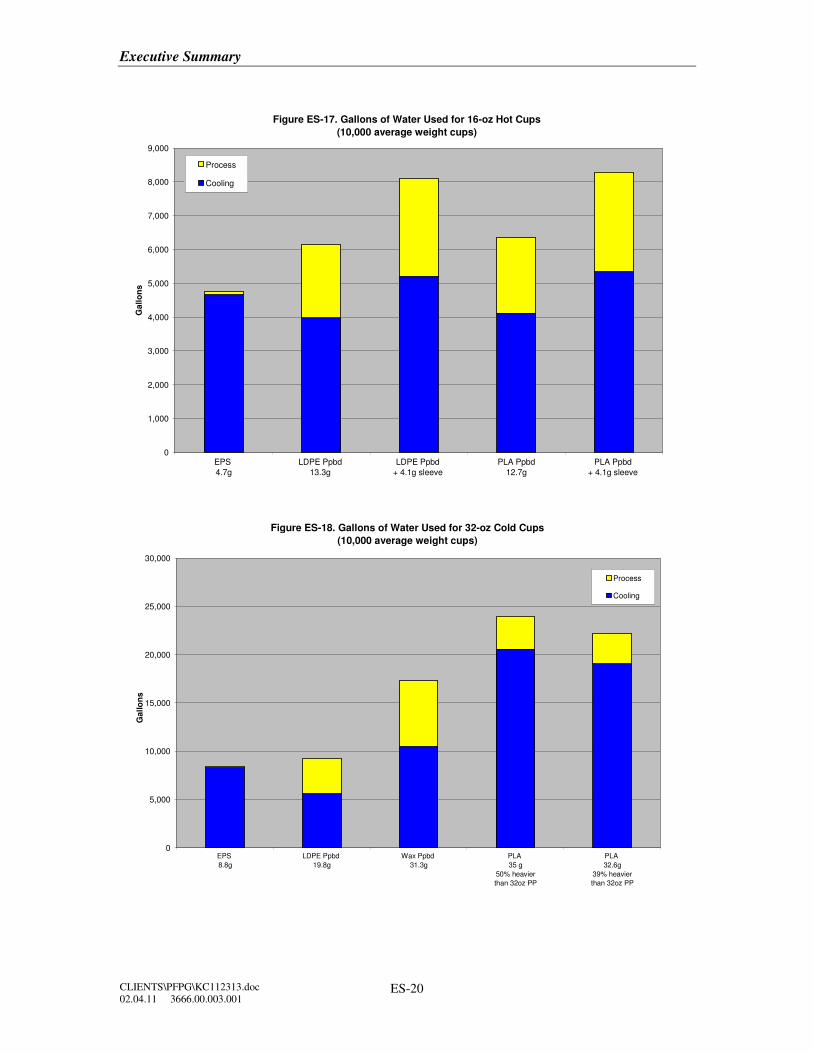
Water Use
Water use data were not available for many of the unit processes associated with
the production of the foodservice products in this analysis, resulting in data gaps when
attempting to construct models for product systems on a unit process basis. Therefore, it
was necessary to use aggregated cradle-to-material data sets for most of the materials
modeled. Furthermore, data sources did not distinguish between consumptive use of
cooling water and recirculating use of cooling water. Since it was not possible to
differentiate between consumptive and non-consumptive use of water, the water results
shown throughout this report are referred to as water use rather than water consumption.
Because of the use of aggregated cradle-to-material water use data, and the inability to
clearly differentiate between consumptive and non-consumptive uses of water, the water
use results presented here should be considered to have a high degree of uncertainty.
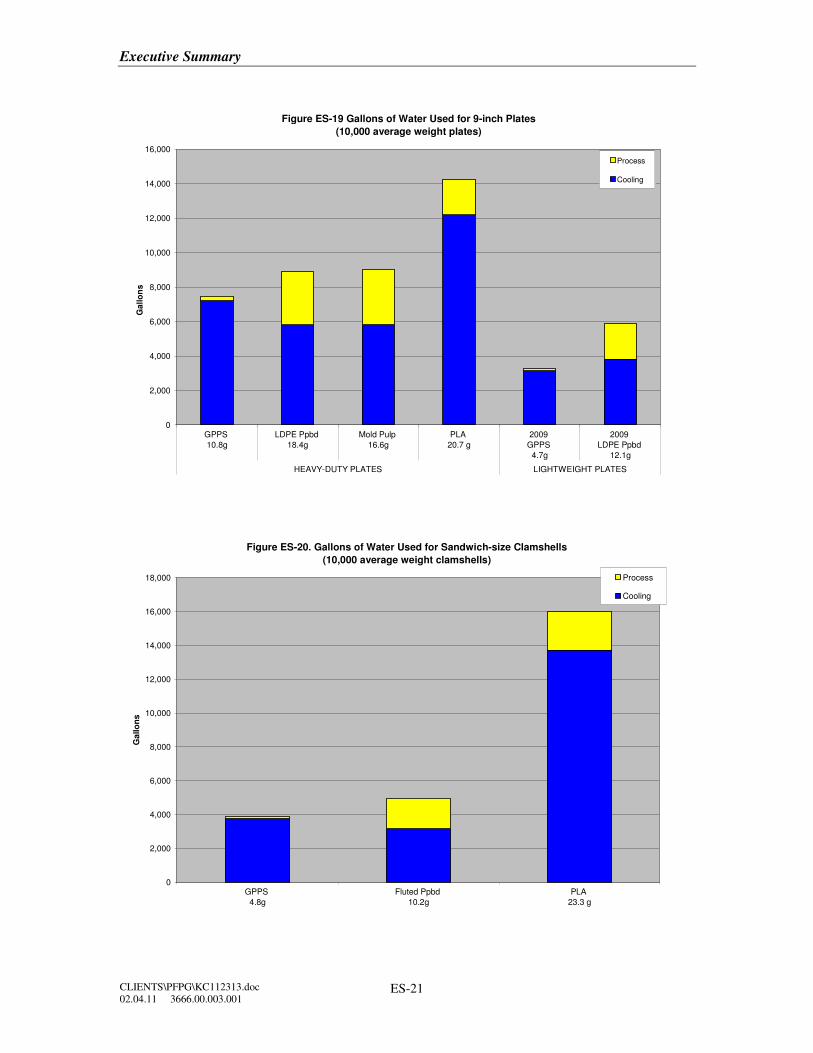
Total water use for each foodservice product system shown in Figures ES-17 through ES-
20 includes process water use and cooling water use, including cooling water associated
with electricity generation.
Polystyrene resin products requires very little process water compared to
paperboard and PLA products. Process water use for paperboard and PLA includes water
used in pulping operations, corn irrigation, corn wet mills, and other processes used to
convert corn to PLA. Cooling water use per pound is higher for production of PS foam
products and PLA products compared to paperboard products, since molding and
thermoforming of resins requires more electricity compared to the processes used to
convert paperboard into cups, plates, and clamshells.
Executive Summary
CLIENTS\PFPG\KC112313.doc
02.04.11 3666.00.003.001 ES-20
Figure ES-17. Gallons of Water Used for 16-oz Hot Cups
(10,000 average weight cups)
0
1,000
2,000
3,000
4,000
5,000
6,000
7,000
8,000
9,000
EPS
4.7g
LDPE Ppbd
13.3g
LDPE Ppbd
+ 4.1g sleeve
PLA Ppbd
12.7g
PLA Ppbd
+ 4.1g sleeve
Gallo
ns
Process
Cooling
Figure ES-18. Gallons of Water Used for 32-oz Cold Cups
(10,000 average weight cups)
0
5,000
10,000
15,000
20,000
25,000
30,000
EPS
8.8g
LDPE Ppbd
19.8g
Wax Ppbd
31.3g
PLA
35 g
50% heavier
than 32oz PP
PLA
32.6g
39% heavier
than 32oz PP
Gallo
ns
Process
Cooling
Executive Summary
CLIENTS\PFPG\KC112313.doc
02.04.11 3666.00.003.001 ES-21
Figure ES-19 Gallons of Water Used for 9-inch Plates
(10,000 average weight plates)
0
2,000
4,000
6,000
8,000
10,000
12,000
14,000
16,000
GPPS
10.8g
LDPE Ppbd
18.4g
Mold Pulp
16.6g
PLA
20.7 g
2009
GPPS
4.7g
2009
LDPE Ppbd
12.1g
HEAVY-DUTY PLATES LIGHTWEIGHT PLATES
Gallo
ns
Process
Cooling
Figure ES-20. Gallons of Water Used for Sandwich-size Clamshells
(10,000 average weight clamshells)
0
2,000
4,000
6,000
8,000
10,000
12,000
14,000
16,000
18,000
GPPS
4.8g
Fluted Ppbd
10.2g
PLA
23.3 g
Gallo
ns
Process
Cooling
Executive Summary
CLIENTS\PFPG\KC112313.doc
02.04.11 3666.00.003.001 ES-22
KEY OBSERVATIONS AND CONCLUSIONS
The observations and conclusions regarding energy, solid waste, water use and
greenhouse gases are all sensitive to the assumptions and choices made in this study
about
• Product weight
• Inclusion of bio-based EMR
• Solid waste reporting basis (by weight or by volume)
• Decomposition of products in landfills and management of methane
produced from decomposition
• Exclusion of indirect land use change
• Corn irrigation practices
• Choice of allocation method.
The following observations and conclusions are based on the assumptions made
in this study and apply to the specific product weights analyzed in this report. The results,
observations, and conclusions should not be considered representative of the full range of
product weights that may be available in the marketplace.
• Influence of Product Weight on LCI Results: The majority of the
environmental burdens for producing each type of foodservice item is
from the production of the materials used. Material production burdens for
a product are calculated as the product of the burdens per pound of
material multiplied by the pounds of material used in the product system.
Many grades and weights of disposable foodservice products are available
in the marketplace. As shown in Table ES-1, all paperboard and PLA
products analyzed in this study are heavier than the corresponding average
weight PS foam product. Comparisons of products with different weight
ratios may yield different conclusions. This can be seen in the plate tables,
where there are large differences in the results for average weight high-
grade plates and results for lighter weight plates from a 2009 LCI study.
• Energy: For the product weights modeled, the total energy requirements
for average PS foam products across the different product categories are
generally lower than total energy requirements for the equivalent number
of (heavier) PLA or paperboard products analyzed. Total energy
requirements for LDPE-coated cold cups, LDPE-coated plates, and
molded pulp plates are not significantly different from energy
requirements for the corresponding PS products.
Executive Summary
CLIENTS\PFPG\KC112313.doc
02.04.11 3666.00.003.001 ES-23
• Net Energy Consumption: A significant portion of the total energy
requirements for each product is energy of material resource. Some of the
EMR remains embodied in the postconsumer products that are sent to
landfills at end of life. Some energy is also recovered from postconsumer
materials that are managed by WTE combustion, as well as from WTE
combustion of landfill gas produced from paperboard decomposition.
• Solid Waste: Comparative conclusions about solid waste differ depending
whether the results are expressed in terms of weight or volume of waste.
Postconsumer products account for the largest share of solid waste for
each system. The plastic foam systems produce less weight of solid waste
compared to heavier paperboard and PLA products. However, because of
the low density of foam products, the differences in solid waste volume of
postconsumer foam products and corresponding paperboard or solid resin
products become relatively small for most product categories. For plates,
heavy-duty PS foam plates produce a greater volume of solid waste than
other types of heavy-duty plates; however, for the 2009 equivalent
strength plate comparison, the PS foam and paperboard plates have very
similar solid waste volumes.
• Greenhouse Gas Results: The majority of GHG emissions for most
systems studied are associated with combustion of fossil fuels for process
and transportation energy. For the PLA system, there are also significant
process GHG emissions associated with nitrous oxide emissions from
fertilizer use for corn. The end-of-life greenhouse gas results presented
here should be considered more uncertain than other emissions data. End-
of-life management results in a small net increase in GHG for PS foam
products and a net GHG credit for PLA products. End-of-life results for
paperboard products vary considerably depending on assumptions about
decomposition. At maximum experimental decomposition levels, the
overall effect of the estimated GHG additions and credits from end-of-life
management is a large net increase in GHG for paperboard products. At
lower decomposition rates, the net end-of-life GHG for paperboard
products is much smaller, since less methane is released and more carbon
is sequestered in undecomposed material. If the paperboard does not
decompose, no methane is produced and all the biomass carbon in the
paperboard product is sequestered, resulting in a large carbon
sequestration credit.
Executive Summary
CLIENTS\PFPG\KC112313.doc
02.04.11 3666.00.003.001 ES-24
• Limitations of Water Use Data: Because of a lack of unit process-level
data on water use, the water use results in this analysis are largely based
on aggregated cradle-to-material data sets and estimates based on
literature. In addition, data sources did not distinguish between
consumptive use of cooling water and recirculating use of cooling water.
Every effort was made to provide corresponding coverage of water use for
each product system; however, without access to the supporting unit
process data, and lacking distinction between consumptive and non-
consumptive uses of water, it was not possible to ensure that different
cradle-to-material data sets were derived using consistent methodologies.
Therefore, the comparative water use results in this report have a high
degree of uncertainty.
• Water Use Results: Across the different product categories, water use for
the average weight paperboard product in each category is 20 to 30
percent higher than for the corresponding average weight PS foam
product, and water use for the solid PLA product is 2 to 4 times as high as
for the corresponding PS foam product. The differences in the weights of
the solid PLA and PS foam products are a significant driver for the
comparative water use results.
Chapter 1 Life Cycle Methodology
CLIENTS\PFPG\KC112313.doc
02.04.11 3666.00.003.001 1-1
CHAPTER 1
LIFE CYCLE METHODOLOGY
OVERVIEW
The life cycle inventory (LCI) presented in this study quantifies the total energy
requirements, energy sources, atmospheric pollutants, waterborne pollutants, and solid
waste resulting from the production and end-of-life management of several types of
disposable foodservice products.
This analysis does not include impact assessment. It does not attempt to determine
the fate of emissions, or the relative risk to humans or to the environment due to
emissions from the systems. (An exception is made in the case of global warming
potential impacts, which are calculated based on internationally accepted factors for
various greenhouse gases’ global warming potentials relative to carbon dioxide.) No
judgments are made as to the merit of obtaining natural resources from various sources,
for example, whether it is preferable to produce foodservice products from fuel resources
(petroleum-derived plastics) or renewable resources (PLA derived from corn, or
paperboard produced from trees).
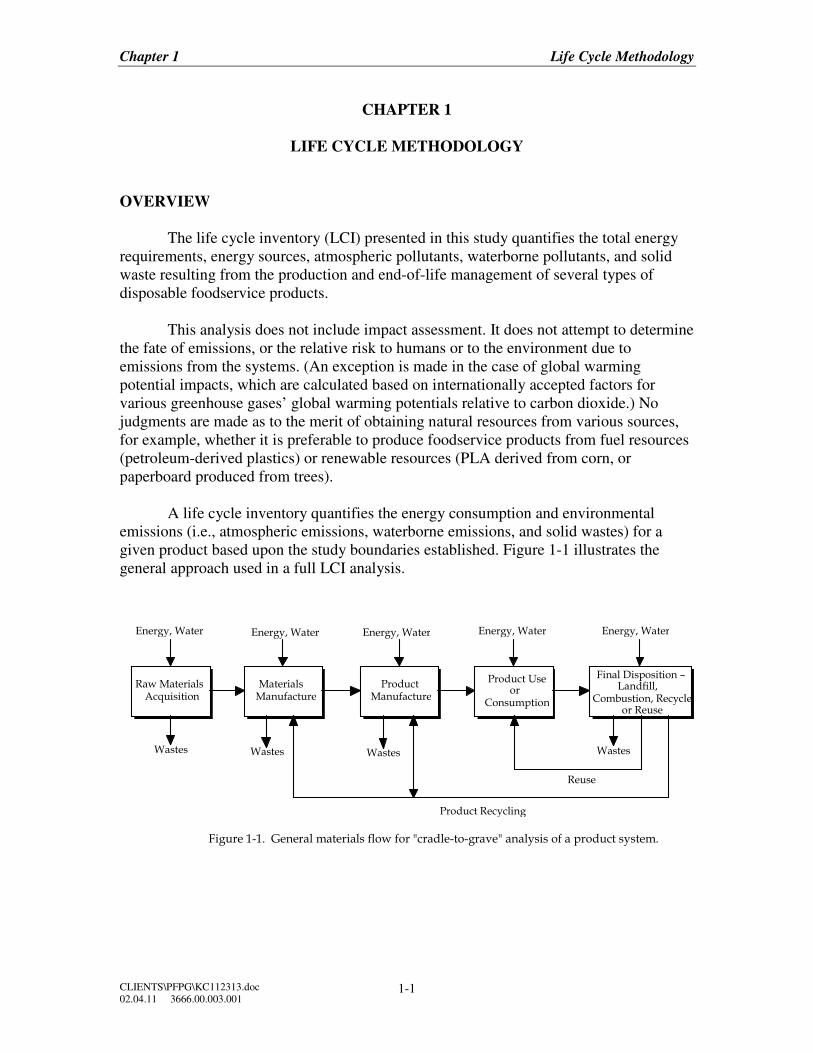
A life cycle inventory quantifies the energy consumption and environmental
emissions (i.e., atmospheric emissions, waterborne emissions, and solid wastes) for a
given product based upon the study boundaries established. Figure 1-1 illustrates the
general approach used in a full LCI analysis.
Final Disposition – Landfill,
Combustion, Recycle, or Reuse
Raw Materials Acquisition
Materials Manufacture
Product Manufacture
Product Use or
Consumption
Energy, Water Energy, Water Energy, Water Energy, Water Energy, Water
Wastes Wastes Wastes Wastes
Reuse
Product Recycling
Figure 1-1. General materials flow for "cradle-to-grave" analysis of a product system.
Chapter 1 Life Cycle Methodology
CLIENTS\PFPG\KC112313.doc
02.04.11 3666.00.003.001 1-2
LIFE CYCLE INVENTORY METHODOLOGY
Key elements of the LCI methodology include the study boundaries, resource
inventory (raw materials and energy), emissions inventory (atmospheric, waterborne, and
solid waste), and disposal practices.
Franklin Associates developed a methodology for performing resource and
environmental profile analyses (REPA), commonly called life cycle inventories. This
methodology has been documented for the United States Environmental Protection
Agency and is incorporated in the EPA report Product Life-Cycle Assessment
Inventory Guidelines and Principles. The data presented in this report were developed
using this methodology, which has been in use for over 30 years.
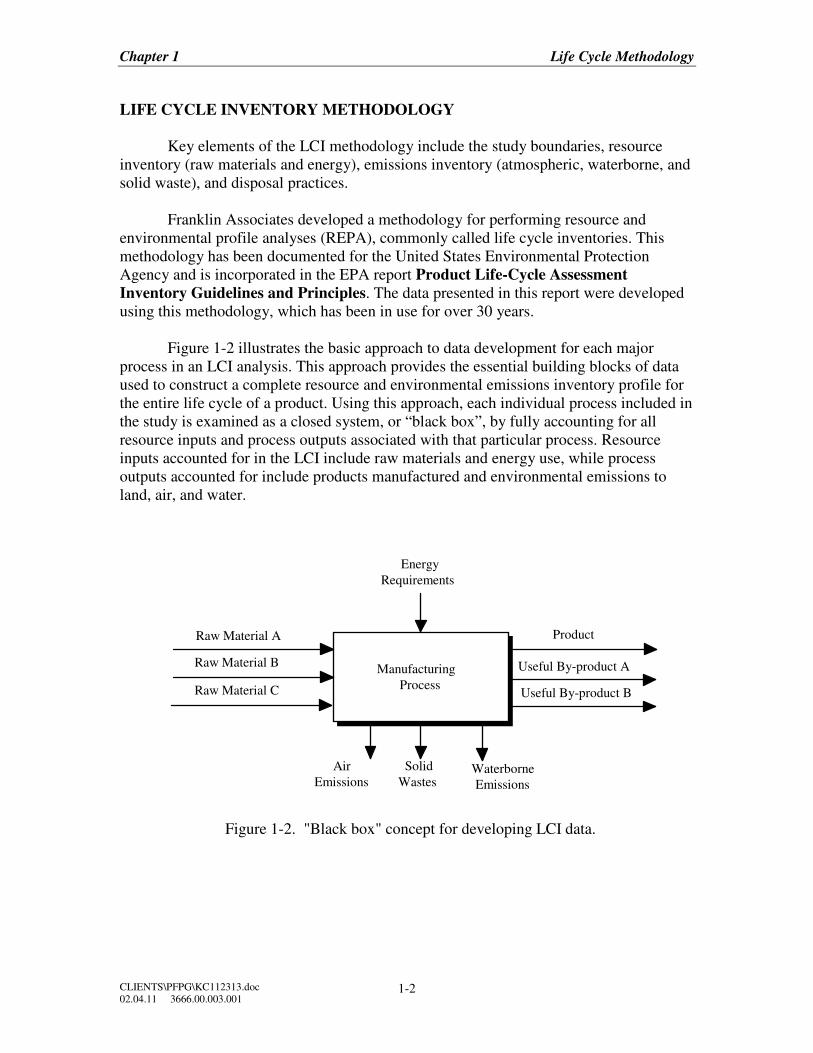
Figure 1-2 illustrates the basic approach to data development for each major
process in an LCI analysis. This approach provides the essential building blocks of data
used to construct a complete resource and environmental emissions inventory profile for
the entire life cycle of a product. Using this approach, each individual process included in
the study is examined as a closed system, or “black box”, by fully accounting for all
resource inputs and process outputs associated with that particular process. Resource
inputs accounted for in the LCI include raw materials and energy use, while process
outputs accounted for include products manufactured and environmental emissions to
land, air, and water.
Manufacturing
Process
Energy
Requirements
Air
Emissions Waterborne
Emissions
Solid
Wastes
Raw Material A
Raw Material B
Raw Material C
Product
Useful By-product A
Useful By-product B
Figure 1-2. "Black box" concept for developing LCI data.
Chapter 1 Life Cycle Methodology
CLIENTS\PFPG\KC112313.doc
02.04.11 3666.00.003.001 1-3
For each process included in the study, resource requirements and environmental
emissions are determined and expressed in terms of a standard unit of output. A standard
unit of output is used as the basis for determining the total life cycle resource
requirements and environmental emissions of a product.
Material Requirements
Once the LCI study boundaries have been defined and the individual processes
identified, a material balance is performed for each individual process. This analysis
identifies and quantifies the input raw materials required per standard unit of output, such
as 1,000 pounds, for each individual process included in the LCI. The purpose of the
material balance is to determine the appropriate weight factors used in calculating the
total energy requirements and environmental emissions associated with each process
studied. Energy requirements and environmental emissions are determined for each
process and expressed in terms of the standard unit of output.
Once the detailed material balance has been established for a standard unit of
output for each process included in the LCI, a comprehensive material balance for the
entire life cycle of each product system is constructed. This analysis determines the
quantity of materials required from each process to produce and dispose of the required
quantity of each system component and is typically illustrated as a flow chart. Data must
be gathered for each process shown in the flow diagram, and the weight relationships of
inputs and outputs for the various processes must be developed.
Energy Requirements
The average energy requirements for each process identified in the LCI are first
quantified in terms of fuel or electricity units, such as cubic feet of natural gas, gallons of
diesel fuel, or kilowatt-hours (kWh) of electricity. The fuel used to transport raw
materials to each process is included as a part of the LCI energy requirements.
Transportation energy requirements for each step in the life cycle are developed in the
conventional units of ton-miles by each transport mode (e.g. truck, rail, barge, etc.).
Government statistical data for the average efficiency of each transportation mode are
used to convert from ton-miles to fuel consumption.
Once the fuel consumption for each industrial process and transportation step is
quantified, the fuel units are converted from their original units to an equivalent Btu
value based on standard conversion factors.
The conversion factors have been developed to account for the energy required to
extract, transport, and process the fuels and to account for the energy content of the fuels.
The energy to extract, transport, and process fuels into a usable form is labeled
precombustion energy. For electricity, precombustion energy calculations include
adjustments for the average efficiency of conversion of fuel to electricity and for
transmission losses in power lines based on national averages.
Chapter 1 Life Cycle Methodology
CLIENTS\PFPG\KC112313.doc
02.04.11 3666.00.003.001 1-4
The LCI methodology also assigns a fuel-energy equivalent to raw materials that
are used as material feedstocks for the product systems analyzed. The energy value of the
raw material is called energy of material resource (EMR) or inherent energy. In this
study, the EMR of material feedstocks derived from fossil fuel resources (e.g., crude oil
and natural gas used to produce plastic resins) is tracked separately from EMR of
renewable biomass feedstocks that are not major fuel sources in North America.
The Btu values for fuels and electricity consumed in each industrial process are
summed and categorized into an energy profile according to the six basic energy sources
listed below:
• Natural gas
• Petroleum
• Coal
• Nuclear
• Hydropower
• Other
The “other” category includes sources such as solar, biomass and geothermal
energy. Also included in the LCI energy profile are the Btu values for all transportation
steps and all fossil fuel-derived raw materials. Energy results for the product systems
studied in this analysis are provided in Chapter 2.
Environmental Emissions
Environmental emissions are categorized as atmospheric emissions, waterborne
emissions, and solid wastes and represent discharges into the environment after the
effluents pass through existing emission control devices. Similar to energy,
environmental emissions associated with processing fuels into usable forms are also
included in the inventory. When it is not possible to obtain actual industry emissions data,
published emissions standards are used as the basis for determining environmental
emissions.
The different categories of atmospheric and waterborne emissions are not totaled
in this LCI because it is widely recognized that various substances emitted to the air and
water differ greatly in their effect on the environment.

Chapter 1 Life Cycle Methodology
CLIENTS\PFPG\KC112313.doc
02.04.11 3666.00.003.001 1-5
Atmospheric Emissions. These emissions include substances classified by
regulatory agencies as pollutants, as well as selected non-regulated emissions such as
carbon dioxide. For each process, atmospheric emissions associated with the combustion
of fuel for process or transportation energy, as well as any emissions released from the
process itself, are included in this LCI. The amounts reported represent actual discharges
into the atmosphere after the effluents pass through existing emission control devices.
Some of the more commonly reported atmospheric emissions are: carbon dioxide, carbon
monoxide, non-methane hydrocarbons, nitrogen oxides, particulates, and sulfur oxides.
The emissions results discussion in Chapter 2 focuses on greenhouse gas emissions,
expressed in pounds of carbon dioxide equivalents.
Waterborne Emissions. As with atmospheric emissions, waterborne emissions
include all substances classified as pollutants. The values reported are the average
quantity of pollutants still present in the wastewater stream after wastewater treatment
and represent discharges into receiving waters. This includes both process-related and
fuel-related waterborne emissions. Some of the most commonly reported waterborne
emissions are: acid, ammonia, biochemical oxygen demand (BOD), chemical oxygen
demand (COD), chromium, dissolved solids, iron, and suspended solids.
Solid Wastes. This category includes solid wastes generated from all sources that
are landfilled or disposed of in some other way, such as incineration with or without
energy recovery. These include industrial process- and fuel-related wastes. Examples of
industrial process wastes are residuals from chemical processes and manufacturing scrap
that is not recycled or sold. Examples of fuel-related solid wastes are ash generated by
burning coal to produce electricity, or particulates from fuel combustion that are collected
in air pollution control devices.
LCI PRACTITIONER METHODOLOGY VARIATION
There is general consensus among life cycle practitioners on the fundamental
methodology for performing LCIs.12 However, for some specific aspects of life cycle
inventory, there is some minor variation in methodology used by experienced
practitioners. These areas include the method used to allocate energy requirements and
environmental releases among more than one useful product produced by a process, the
method used to account for the energy contained in material feedstocks, and the
methodology used to allocate environmental burdens for postconsumer recycled content
and end-of-life recovery of materials for recycling. LCI practitioners vary to some extent
in their approaches to these issues. The following sections describe the approach to each
issue used in this study.
12 International Organization for Standardization. ISO 14040:2006 Environmental management—Life
cycle assessment—Principles and framework, ISO 14044:2006, Environmental management – Life
cycle assessment – Requirements and guidelines.
Chapter 1 Life Cycle Methodology
CLIENTS\PFPG\KC112313.doc
02.04.11 3666.00.003.001 1-6
Co-product Credit
One unique feature of life cycle inventories is that the quantification of inputs and
outputs are related to a specific amount of product from a process. However, it is
sometimes difficult or impossible to identify which inputs and outputs are associated with
individual products of interest resulting from a single process (or process sequence) that
produces multiple useful products. The practice of allocating inputs and outputs among
multiple products from a process is often referred to as “co-product credit”13 or
“partitioning”14.
Co-product credit is done out of necessity when raw materials and emissions
cannot be directly attributed to one of several product outputs from a system. It has long
been recognized that the practice of giving co-product credit is less desirable than being
able to identify which inputs lead to particular outputs. In this study, co-product
allocations are necessary because of multiple useful outputs from some of the “upstream”
chemical processes involved in producing the resins used to manufacture plastic products
and coatings on paperboard cups and plates, and from processes used to convert corn to
PLA.
Franklin Associates follows the guidelines for allocating co-product credit shown
in the ISO 14044:2006 standard on life cycle assessment requirements and guidelines. In
this standard, the preferred hierarchy for handling allocation is (1) avoid allocation where
possible, (2) allocate flows based on direct physical relationships to product outputs, (3)
use some other relationship between elementary flows and product output. No single
allocation method is suitable for every scenario. How product allocation is made will
vary from one system to another but the choice of parameter is not arbitrary. ISO 14044
section 4.3.4.2 states “The inventory is based on material balances between input and
output. Allocation procedures should therefore approximate as much as possible such
fundamental input/output relationships and characteristics.”
Some processes lend themselves to physical allocation because they have physical
parameters that provide a good representation of the environmental burdens of each co-
product. Examples of various allocation methods are mass, stoichiometric, elemental,
reaction enthalpy, and economic allocation. Simple mass and enthalpy allocation have
been chosen as the common forms of allocation in this analysis. However, these
allocation methods were not chosen as a default choice, but made on a case by case basis
after due consideration of the chemistry and basis for production.
13 Hunt, Robert G., Sellers, Jere D., and Franklin, William E. Resource and Environmental Profile
Analysis: A Life Cycle Environmental Assessment for Products and Procedures. Environmental
Impact Assessment Review. 1992; 12:245-269.
14 Boustead, Ian. Eco-balance Methodology for Commodity Thermoplastics. A report for The Centre
for Plastics in the Environment (PWMI). Brussels, Belgium. December, 1992.
Chapter 1 Life Cycle Methodology
CLIENTS\PFPG\KC112313.doc
02.04.11 3666.00.003.001 1-7
In the sequence of processes used to produce resins that are used in the
polystyrene products and resin coatings for paperboard cups and plates, some processes
produce material or energy co-products. When the co-product is heat or steam or a co-
product sold for use as a fuel, the energy content of the exported heat, steam, or fuel is
shown as an energy credit for that process. When the co-product is a material, the process
inputs and emissions are allocated to the primary product and co-product material(s) on a
mass basis. (Allocation based on economic value can also be used to partition process
burdens among useful co-products; however, this approach is less preferred under ISO
life cycle standards, as it depends on the economic market, which can change
dramatically over time depending on many factors unrelated to the chemical and physical
relationships between process inputs and outputs.)
Scrap from product fabrication is treated as a co-product if it is recycled, and
treated as a waste if it is disposed. In other words, the foodservice product system carries
no burdens for material inputs that end up as fabrication scrap that is recycled into some
other product. If the fabrication scrap is disposed, however, and does not end up in any
other use, then the burdens for producing and disposing of the scrap are assigned to the
foodservice product system. At least one manufacturer uses recycled industrial scrap as
the material feedstock for molded pulp plate production; however, data from this
producer were not available for this analysis. Therefore, in this analysis molded pulp
plates are modeled based on production from bleached kraft market pulp.
PLA production in this study is modeled based on a cradle-to-resin dataset for
NatureWorks Ingeo™ polymer. The dataset, published in the U.S. LCI Database in
March 2010, covers all processes from corn growing through production of PLA resin
ready to be shipped. Based on communication with the LCA practitioner who prepared
the analysis, all corn growing impacts are assigned to the corn, and none to the corn
stover (stalks and leaves) that are typically left in the field. The harvested corn is then
processed at a corn wet mill, which produces coproducts of corn gluten feed, corn gluten
meal, heavy steep water, and corn germ. As described in an LCA study using
NatureWorks data15, mass-based coproduct allocation is used to divide the corn wet mill
burdens among the outputs. Because the PLA data were published as a rolled-up cradle-
to-resin data set, it was not possible to further evaluate process flows for individual
subprocesses or evaluate alternative allocation scenarios.
Energy of Material Resource
For some raw materials, such as petroleum, natural gas, and coal, the amount
consumed in all industrial applications as fuel far exceeds the amount consumed as raw
materials (feedstock) for products. The primary use of these materials in the marketplace
is for energy. The total amount of these materials can be viewed as an energy pool or
reserve. This concept is illustrated in Figure 1-3.
15 Life Cycle Assessment of Polylactide (PLA) : A comparison of food packaging made from
NatureWorks® PLA and alternative materials. IFEU Heidelberg. July 2006. Commissioned by
NatureWorks LLC.
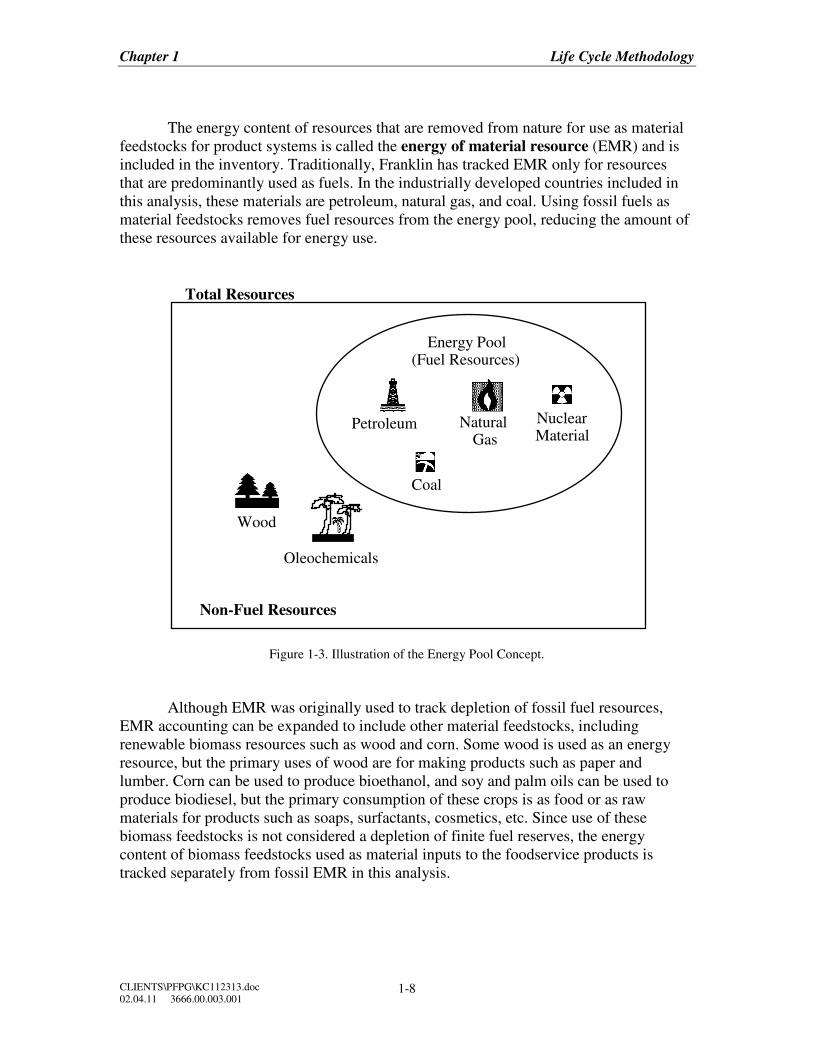
Chapter 1 Life Cycle Methodology
CLIENTS\PFPG\KC112313.doc
02.04.11 3666.00.003.001 1-8
The energy content of resources that are removed from nature for use as material
feedstocks for product systems is called the energy of material resource (EMR) and is
included in the inventory. Traditionally, Franklin has tracked EMR only for resources
that are predominantly used as fuels. In the industrially developed countries included in
this analysis, these materials are petroleum, natural gas, and coal. Using fossil fuels as
material feedstocks removes fuel resources from the energy pool, reducing the amount of
these resources available for energy use.
Wood
Oleochemicals
Nuclear Material
Petroleum
Coal
Natural Gas
Energy Pool (Fuel Resources)
Non-Fuel Resources
Total Resources
Figure 1-3. Illustration of the Energy Pool Concept.
Although EMR was originally used to track depletion of fossil fuel resources,
EMR accounting can be expanded to include other material feedstocks, including
renewable biomass resources such as wood and corn. Some wood is used as an energy
resource, but the primary uses of wood are for making products such as paper and
lumber. Corn can be used to produce bioethanol, and soy and palm oils can be used to
produce biodiesel, but the primary consumption of these crops is as food or as raw
materials for products such as soaps, surfactants, cosmetics, etc. Since use of these
biomass feedstocks is not considered a depletion of finite fuel reserves, the energy
content of biomass feedstocks used as material inputs to the foodservice products is
tracked separately from fossil EMR in this analysis.
Chapter 1 Life Cycle Methodology
CLIENTS\PFPG\KC112313.doc
02.04.11 3666.00.003.001 1-9
EMR assigned to a material is not the energy value of the final product, but is the
energy value of the raw material at the point of extraction from its natural environment.
For fossil fuels, this definition is straightforward. For instance, petroleum is extracted in
the form of crude oil. Therefore, the EMR for petroleum is the higher heating value of
crude oil. Biomass EMR for PLA products is based on the energy content of the
harvested corn grain used for PLA production, while the biomass EMR for paperboard
products is based on the energy content of the harvested wood, adjusted to subtract out
the amount of process energy that is derived from the wood at the paperboard mill (e.g.,
via combustion of wood wastes or combustion of black liquor from the pulping process).
When the feedstock is converted to a product, the EMR becomes energy content
of the product. The energy content of the product is always somewhat less than the
feedstock EMR because of the energy losses associated with the steps required to convert
the raw feedstocks into a finished product. The energy tables in this LCI track the energy
content of landfilled products as well as the energy recovered from waste-to-energy
combustion of products at end of life.
Postconsumer Recycling Methodology
When material is used in one system and subsequently recovered, reprocessed,
and used in another application, there are different methods that can be used to allocate
environmental burdens among different useful lives of the material. Material production
and disposal burdens can be allocated over all the useful lives of the material, or
boundaries can be drawn between each successive useful life of the material. In this
analysis, no recycling is considered for any of the foodservice products, so no
postconsumer recycling allocations are necessary.
DATA
The accuracy of the study is directly related to the quality of input data. The
development of methodology for the collection of data is essential to obtaining quality
data. Careful adherence to that methodology determines not only data quality but also
objectivity. Data quality and uncertainty are discussed in more detail at the end of this
section.
Data necessary for conducting this analysis are separated into two categories:
process-related data and fuel-related data.
Process Data
Methodology for Collection/Verification. The process of gathering data is an
iterative one. The data-gathering process for each system begins with a literature search
to identify raw materials and processes necessary to produce the final product. The search
is then extended to identify the raw materials and processes used to produce these raw
materials. In this way, a flow diagram is systematically constructed to represent the
production pathway of each system.
Chapter 1 Life Cycle Methodology
CLIENTS\PFPG\KC112313.doc
02.04.11 3666.00.003.001 1-10
Each process identified during the construction of the flow diagram is then
researched to identify potential industry sources for data. In this study, composition and
fabrication of plastic and paperboard products was largely based on data from the peer-
reviewed PSPC life cycle inventory study, updated with fabrication data for some
products provided by a private company in 2008.
Confidentiality. Franklin Associates takes care to protect data that is considered
confidential by individual data providers. In order to protect product fabrication data sets
provided by individual companies, the data shown in this report for each product are
aggregated to include all steps from raw material acquisition through product fabrication.
Objectivity. Each unit process in the life cycle study is researched independently
of all other processes. No calculations are performed to link processes together with the
production of their raw materials until after data gathering and review are complete. This
allows objective review of individual data sets before their contribution to the overall life
cycle results has been determined. Also, because these data are reviewed individually,
assumptions are reviewed based on their relevance to the process rather than their effect
on the overall outcome of the study.
Data Sources. As stated in the Study Goal section, the intended purpose of the
study was to update and expand the environmental profiles of several types of disposable
foodservice products, including polystyrene, paperboard, and PLA products. The life
cycle results were developed using the most up-to-date data available.
Other than updated plate fabrication data sets from a 2009 study for a private
company (used here with the permission of Pactiv) and PLA molding data from the 2006
OVAM report, data sets for all other unit processes in this study were taken from the U.S.
LCI Database, the peer-reviewed PSPC study, or Franklin Associates’ United States
industry average database. The Franklin database has been developed over a period of
years through research for many LCI projects encompassing a wide variety of products
and materials. Another advantage of the database is that it is continually updated. For
each ongoing LCI project, verification and updating is carried out for the portions of the
database that are accessed by that project.
PLA production in this study is modeled based on a cradle-to-resin data set for
NatureWorks Ingeo PLA polymer published in the U.S. LCI Database in March 2010.
The dataset is specific to the supply chain and processes for Ingeo production at the
NatureWorks facility in Blair, Nebraska. Since this PLA production facility accounts for
all current U.S. PLA production, the PLA products in this study are modeled using the
Ingeo data set. However, because the PLA data set is published as a rolled-up cradle-to-
resin data set, it is not possible to further analyze the flows for individual subprocesses or
evaluate alternative allocation scenarios.
Chapter 1 Life Cycle Methodology
CLIENTS\PFPG\KC112313.doc
02.04.11 3666.00.003.001 1-11
Fuel Data
When fuels are used for process or transportation energy, there are energy and
emissions associated with the production and delivery of the fuels as well as the energy
and emissions released when the fuels are burned. Before each fuel is usable, it must be
mined, as in the case of coal or uranium, or extracted from the earth in some manner.
Further processing is often necessary before the fuel is usable. For example, coal is
crushed or pulverized and sometimes cleaned. Crude oil is refined to produce fuel oils,
and “wet” natural gas is processed to produce natural gas liquids for fuel or feedstock.
To distinguish between environmental emissions from the combustion of fuels
and emissions associated with the production of fuels, different terms are used to describe
the different emissions. The combustion products of fuels are defined as combustion
data. Energy consumption and emissions which result from the mining, refining, and
transportation of fuels are defined as precombustion data. Precombustion data and
combustion data together are referred to as fuel-related data.
Fuel-related data are developed for fuels that are burned directly in industrial
furnaces, boilers, and transport vehicles. Fuel-related data are also developed for the
production of electricity. These data are assembled into a database from which the energy
requirements and environmental emissions for the production and combustion of process
fuels are calculated.
Energy data are developed in the form of units of each primary fuel required per
unit of each fuel type. For electricity production, federal government statistical records
provided data for the amount of fuel required to produce electricity from each fuel
source, and the total amount of electricity generated from petroleum, natural gas, coal,
nuclear, hydropower, and other (solar, geothermal, etc.). Literature sources and federal
government statistical records provided data for the emissions resulting from the
combustion of fuels in utility boilers, industrial boilers, stationary equipment such as
pumps and compressors, and transportation equipment. Because electricity and other
fuels are required in order to produce electricity and primary fuels, there is a complex and
technically infinite set of interdependent steps involved in fuel modeling. An input-output
modeling matrix is used for these calculations.
In 2003, Franklin Associates updated our fuels and energy database for inclusion
in the U.S. LCI database. This fuels and energy database, which is published in the U.S
LCI Database, is used in this analysis.
Data Quality Goals for This Study
ISO standard 14044:2006 states that “Data quality requirements shall be specified
to enable the goal and scope of the LCA to be met.” Data quality requirements listed
include time-related coverage, geographical coverage, technology coverage, and more.
Chapter 1 Life Cycle Methodology
CLIENTS\PFPG\KC112313.doc
02.04.11 3666.00.003.001 1-12
The data quality goal for this study was to use data that most accurately represents
the production of current disposable foodservice products. The quality of individual data
sets vary in terms of age, representativeness, measured values or estimates, etc.; however,
all materials and process data sets used in this study were thoroughly reviewed for
accuracy and currency and updated to the best of our capabilities for this analysis.
Data Accuracy
An important issue to consider when using LCI study results is the reliability of
the data. In a complex study with literally thousands of numeric entries, the accuracy of
the data and how it affects conclusions is truly a complex subject, and one that does not
lend itself to standard error analysis techniques. Techniques such as Monte Carlo analysis
can be used to study uncertainty, but the greatest challenge is the lack of uncertainty data
or probability distributions for key parameters, which are often only available as single
point estimates. However, the reliability of the study can be assessed in other ways.
A key question is whether the LCI profiles are accurate and study conclusions are
correct. The accuracy of an environmental profile depends on the accuracy of the
numbers that are combined to arrive at that conclusion. Because of the many processes
required to produce each foodservice product, many numbers in the LCI are added
together for a total numeric result. Each number by itself may contribute little to the total,
so the accuracy of each number by itself has a small effect on the overall accuracy of the
total. There is no widely accepted analytical method for assessing the accuracy of each
number to any degree of confidence. For many chemical processes, the data sets are
based on actual plant data reported by plant personnel. The data reported may represent
operations for the previous year or may be representative of engineering and/or
accounting methods. All data received are evaluated to determine whether or not they are
representative of the typical industry practices for that operation or process being
evaluated. Taking into consideration budget considerations and limited industry
participation, the data used in this report are believed to be the best that can be currently
obtained.
There are several other important points with regard to data accuracy. Each
number generally contributes a small part to the total value, so a large error in one data
point does not necessarily create a problem. For process steps that make a larger than
average contribution to the total, special care is taken with the data quality. It is assumed
that with careful scrutiny of the data, any errors will be random.
There is another dimension to the reliability of the data. Certain numbers do not
stand alone, but rather affect several numbers in the system. An example is the amount of
material required for a process. This number will affect every step in the production
sequence prior to the process. Errors such as this that propagate throughout the system
are more significant in steps that are closest to the end of the production sequence. For
example, changing the weight of an input to the final fabrication step for a plastic
component changes the amounts of resin inputs to that process, and so on back to the
quantities of crude oil and natural gas extracted.
Chapter 1 Life Cycle Methodology
CLIENTS\PFPG\KC112313.doc
02.04.11 3666.00.003.001 1-13
In summary, for the particular data sources used and for the specific methodology
described in this report, the results of this report are believed to be as accurate and
reasonable as possible. As noted earlier in the Data Sources section of this chapter, the
data on corn growing should be considered to have more variability than data for other
industrial processes modeled. In addition, the following section on End of Life
Management discusses the uncertainty of the estimates of global warming potential
resulting from landfilling and WTE combustion of postconsumer foodservice products.
The results discussions in Chapter 2 present guidelines for considering differences
between system results to be meaningful (greater than the margin of error/uncertainty of
the data).
METHODOLOGY ISSUES
The following sections discuss how several key methodological issues are
handled in this study.
Precombustion Energy and Emissions
The energy content of fuels has been adjusted to include the energy requirements
for extracting, processing, and transporting fuels, in addition to the primary energy of a
fuel resulting from its combustion. In this study, this additional energy is called
precombustion energy. Precombustion energy refers to all the energy that must be
expended to prepare and deliver the primary fuel. Adjustments for losses during
transmission, spills, leaks, exploration, and drilling/mining operations are incorporated
into the calculation of precombustion energy.
Precombustion environmental emissions (air, waterborne, and solid waste) are
also associated with the acquisition, processing, and transportation of the primary fuel.
These precombustion emissions are added to the emissions resulting from the burning of
the fuels.
Electricity Grid Fuel Profile
In general, detailed data do not exist on the fuels used to generate the electricity
consumed by each industry. Electricity production and distribution systems in the United
States are interlinked and are not easily separated. Users of electricity, in general, cannot
specify the fuels used to produce their share of the electric power grid. Therefore, the
United States national average fuel consumption by electrical utilities is used.
Chapter 1 Life Cycle Methodology
CLIENTS\PFPG\KC112313.doc
02.04.11 3666.00.003.001 1-14
METHODOLOGICAL DECISIONS
Some general decisions are always necessary to limit a study such as this to a
reasonable scope. It is important to understand these decisions. The key assumptions and
limitations for this study are discussed in the following sections.
Geographic Scope
Data for foreign processes are generally not available. This is usually only a
consideration for the production of oil that is obtained from overseas. In cases such as
this, the energy requirements and emissions are assumed to be the same as if the materials
originated in the United States. Since foreign standards and regulations vary from those
of the United States, it is acknowledged that this assumption may introduce some error.
Transportation of crude oil used for petroleum fuels and plastic resins is modeled based
on the current mix of domestic and imported crude oil used.
End of Life Management
In the U.S., municipal solid waste (MSW) that is not recovered for recycling or
composting is managed 80 percent by weight to landfill (LF) and 20 percent by weight to
waste-to-energy (WTE) incineration.16 Thus, the calculations of the greenhouse gas
impacts for discarded foodservice products are based on a scenario in which 80 percent of
the postconsumer products goes to landfill and 20 percent to WTE combustion.
In this study, estimates of the end results of landfilling and WTE combustion are
limited to greenhouse gas (GHG) effects. There are GHG contributions from WTE
combustion of postconsumer foodservice products and from fugitive emissions of landfill
methane from decomposition of paperboard products. There are also GHG credits for grid
electricity displaced by the generation of electricity from WTE combustion of
postconsumer products and from WTE combustion of methane recovered from
decomposition of landfilled paperboard products. Some carbon is also sequestered in the
biomass-derived products that do not decompose. The U.S. EPA greenhouse gas
accounting methodology does not assign a carbon sequestration credit to landfilling of
fossil-derived materials because this is considered a transfer between carbon stocks (from
oil deposit to landfill) with no net change in the overall amount of carbon stored.17
16 U.S. EPA. Municipal Solid Waste Facts and Figures 2008. Accessible at
http://www.epa.gov/msw/msw99.htm.
17 U.S. EPA. Solid Waste Management and Greenhouse Gases: A Life-Cycle Assessment of
Emissions and Sinks. Third Edition. September 2006. Section 1.3, subsection Carbon Stocks, Carbon
Storage, and Carbon Sequestration. Page 6.
Chapter 1 Life Cycle Methodology
CLIENTS\PFPG\KC112313.doc
02.04.11 3666.00.003.001 1-15
In this study, decomposition of landfilled paperboard foodservice items is
modeled based on the maximum decomposition of bleached paper in landfill simulation
experiments conducted by Dr. Morton Barlaz, et al. 18 The landfill simulation
experiments analyzed decomposition of office paper, clay-coated magazine paper,
newspaper, and corrugated in reactors with optimized conditions for decomposition.
Plastic-coated paperboard foodservice items were not included in the simulated landfill
experiments. This analysis uses experimental data on office paper to estimate
decomposition of the bleached paperboard content of the paperboard products. It is likely
that the coatings on paperboard foodservice products will delay or significantly inhibit
decomposition of the paper. Because of the potential effect of the plastic coating, and
because the landfill simulation experiments were designed to maximize decomposition,
the estimates presented here should be considered an upper limit for landfill gas
generation from decomposition of paperboard products. Alternative results for modeling
lesser degrees of decomposition (50 percent of maximum decomposition, and 0 percent
decomposition) are also shown in the tables and figures.
Although the Barlaz experiments included coated magazine paper, this is not
considered to be a suitable surrogate for coated bleached paperboard foodservice
products because of several important differences between coated magazine paper and
coated paperboard foodservice products: (1) magazine paper contains groundwood pulp,
which has a higher degree of lignin than foodservice paperboard, (2) magazine paper
coating is clay, compared to resin coatings used on the paperboard foodservice products,
and (3) approximately 1/3 of the weight of the coated magazine paper is coating,
compared to a coating weight of 10 percent modeled for the paperboard foodservice
products.
For paper and paperboard materials, the cellulose and hemicellulose fractions of
the material decompose to some extent, while the lignin fraction of the material tends to
decompose to a much lesser extent under anaerobic conditions. Thus, the potentially
degradable carbon content of the landfilled material is based on its cellulose and
hemicellulose content. Based on the cellulose, hemicellulose, and lignin percentages in
each material, and the carbon content of each fraction, the total carbon content of
bleached office paper is calculated as 44.1 percent by weight (42.6 percent potentially
degradable carbon in the cellulose and hemicellulose fractions, 1.5 percent carbon in
lignin).
18 Barlaz, Morton, et al. “Biodegradability of Municipal Solid Waste Components in Laboratory-Scale
Landfills.” Published in Environmental Science & Technology. Volume 31, Number 3, 1997.
Chapter 1 Life Cycle Methodology
CLIENTS\PFPG\KC112313.doc
02.04.11 3666.00.003.001 1-16
In the Barlaz experiments, the following conditions were used to simulate
enhanced decomposition in a landfill: addition of a seed of well-decomposed refuse to
help initiate decomposition, incubation at about 40°C, and leachate recycling and
neutralization. The reactors were maintained at these conditions to maximize
decomposition and monitored until no more methane was being produced. After 671 days
of monitoring, the maximum degree of decomposition for the cellulose and hemicellulose
fractions of office paper was 98 percent and 86 percent, respectively, based on material
analysis of the residual material in the reactor at the end of the decomposition period.
Overall, 41 percent by weight of the office paper degraded, based on the calculated
carbon content of the cellulose and hemicellulose that decomposed. The remaining
biomass carbon content of the paperboard did not degrade.
The quantities of methane recovered from decomposition of the various paper
grades in the Barlaz experiments generally corresponded well with the theoretical amount
of methane expected to be produced based on the carbon content of cellulose and
hemicellulose and the observed degree of decomposition of the cellulose and
hemicellulose fractions. However, this was not the case for office paper. The amount of
methane recovered from the office paper reactor (155 g methane/kg of paper) was
considerably lower than the amount of methane expected based on the amount of
cellulose and hemicellulose that degraded (276 g methane/kg of paper). According to the
Barlaz paper, it was not possible to determine the reason for the discrepancy between the
amount of collected methane and the amount that should have been produced from the
degraded material. As a result, there is uncertainty regarding the ultimate fate of the
amount of carbon that degraded but did not produce methane. It is not clear whether this
carbon was ultimately released or sequestered. Because of this uncertainty, the maximum
methane emissions used in the end-of-life modeling for foodservice paperboard are based
on the theoretical amount that should be produced from anaerobic decomposition of the
amount of cellulose and hemicellulose that degraded in the landfill simulation
experiment. End-of-life results based on the actual amounts of methane recovered from
the experimental reactors are shown in the sensitivity analysis.
The composition of landfill gas as generated from anaerobic decomposition is
approximately 50 percent by volume methane and 50 percent by volume CO2.19 The
mass of methane generated from decomposition of a biomass-derived product is
calculated based on the mass of carbon in the product that decomposes and the mass of
methane generated, assuming 50 percent of the carbon that decomposes produces
methane. Currently, about 53 percent of methane generated from solid waste landfills is
converted to CO2 before it is released to the environment. Twenty-three percent is flared,
25 percent is burned with energy recovery, and about 5 percent (10 percent of the
methane that is not captured or flared) is oxidized as it travels through the landfill cover.
20
19 U.S. EPA. Draft Inventory of U.S. Greenhouse Gas Emissions and Sinks: 1990-2006 (February
2008). Chapter 8, section 8.1 Landfills.
20 Ibid.Calculated from 2006 data in Table 8-4.
Chapter 1 Life Cycle Methodology
CLIENTS\PFPG\KC112313.doc
02.04.11 3666.00.003.001 1-17
Biomass CO2 released from decomposition of paper products or from oxidation of
biomass-derived methane to CO2 is considered carbon neutral, as the CO2 released
represents a return to the environment of the carbon taken up as CO2 during the plant’s
growth cycle and does not result in a net increase in atmospheric CO2. Thus, biomass-
derived CO2 is not included in the GHG results shown in this analysis. Methane releases
to the environment from anaerobic decomposition of biomass are not considered carbon
neutral, however, since these releases resulting from human intervention have a higher
global warming potential (GWP) than the CO2 taken up or released during the natural
carbon cycle.
The U.S. EPA’s Landfill Methane Outreach Program (LMOP) Landfill
Database21 indicates that the majority of landfill gas burned with energy recovery is used
to produce electricity. The gross energy recovered from combustion of LF gas from each
material is converted to displaced quantities of grid electricity using an efficiency factor
of 1 kWh generated per 11,700 Btu of LF gas burned.22 Each product system is credited
with avoiding the CO2 eq associated with production of the offset quantity of grid
electricity.
For the carbon that remains fixed in the landfilled biomass-derived material (e.g.,
in the PLA resin and in the undecomposed portion of the paperboard foodservice
products), a sequestration credit is given for the equivalent pounds of CO2 that the
sequestered carbon could produce.
Waste-to-energy combustion of postconsumer material is modeled using a similar
approach to the landfill gas combustion credit. However, for WTE combustion of
foodservice products, the CO2 releases are modeled based on the total carbon content of
the material oxidizing to CO2. For combustion of paperboard and PLA, the CO2 produced
is considered carbon-neutral biomass CO2, while the CO2 from combustion of EPS and
GPPS resin and LDPE coatings on paperboard products is fossil CO2.
The gross heat produced from WTE combustion is calculated based on the pounds
of material burned and the higher heating value of the material. The heat is converted to
kWh of electricity using a conversion efficiency of 1 kWh per 19,120 Btu for mass burn
facilities23, and a credit is given for avoiding the CO2 eq associated with producing the
equivalent amount of grid electricity.
21 Operational LFG energy projects spreadsheet, sorted by LFGE utilization type and project type.
Accessible at http://www.epa.gov/lmop/proj/#1.
22 LMOP Benefits Calculator. Calculations and References tab. Accessible at
http://www.epa.gov/lmop/res/lfge_benefitscalc.xls.
23 U.S. EPA. Solid Waste Management and Greenhouse Gases: A Life-Cycle Assessment of
Emissions and Sinks. Third Edition. September 2006. Chapter 5 Combustion, section 5.1.5.
Calculation is based on 550 kWh produced per ton of MSW burned, with a heat value of 5,000 Btu per
pound of MSW. For mass burn facilities, 523 kWh of electricity are delivered per 550 kWh generated.
Full report and individual chapters of the report are accessible at
http://www.epa.gov/climatechange/wycd/waste/SWMGHGreport.html.
Chapter 1 Life Cycle Methodology
CLIENTS\PFPG\KC112313.doc
02.04.11 3666.00.003.001 1-18
The net end-of-life CO2 eq for each product system is calculated by summing the
individual impacts and credits described above, based on 80 percent landfill and 20
percent WTE combustion of the postconsumer foodservice products.
Limitations of End-of-Life Modeling Approach. As noted, the landfill methane
calculations in this analysis are based on the aggregated emissions of methane that may
result from decomposition of the degradable carbon content of the landfilled material.
The long time frame over which those emissions occur has implications that result in
additional uncertainties for the landfill methane CO2 eq estimates.
• The length of time required for paperboard products to decompose will
vary depending on landfill conditions and the effects of any coatings on
the products that may inhibit or prevent decomposition. The global
warming impacts of the total pounds of methane emissions released from
decomposition are calculated using 100-year global warming potentials. In
other words, regardless of the time frame over which decomposition
occurs, the GWP calculation takes into account the global warming
impacts of each pound of released methane in the atmosphere for 100
years after it has been released.
• In this analysis, the management of the aggregated landfill methane
emissions is modeled based on current percentages of flaring, WTE
combustion, and uncaptured releases. Over time, it is likely that efforts to
mitigate global warming will result in increased efforts to capture and
combust landfill methane. Combustion of biomass-derived methane
converts the carbon back to CO2, neutralizing the net global warming
impact. In addition, when combustion energy is recovered and used to
produce electricity, there are CO2 eq credits for displacing grid electricity.
With increased future capture and combustion of landfill methane, the
future net effect of landfill methane could gradually shift from a negative
impact (from uncaptured, untreated methane emissions) to a net credit (for
capturing landfill methane and burning it to produce energy with carbon-
neutral CO2 emissions, displacing fossil fuel combustion emissions).
• The percentage of methane that oxidizes as it passes through the landfill
cover was calculated based on 2006 landfill methane data in the EPA’s
Inventory of U.S. Greenhouse Gas Emissions and Sinks, which uses the
IPCC guideline of 10 percent as the default value for oxidation of landfill
methane that is not captured or vented. However, some studies have
suggested that a higher percentage of uncollected methane may oxidize as
it migrates to the landfill surface.24 The higher the percentage of
uncollected methane that oxidizes in the landfill cover, the lower the CO2
eq for landfilled paperboard products.
24 Chanton, J. P.; Powelson, D. K.; Green, R.B. Methane Oxidation in Landfill Cover Soils, is a 10%
Default Value Reasonable?, J Environ. Qual. 38:654-663 (2009).
Chapter 1 Life Cycle Methodology
CLIENTS\PFPG\KC112313.doc
02.04.11 3666.00.003.001 1-19
Based on the uncertainties about degree of decomposition of paperboard products,
the amount of methane produced from decomposition, and the fate of the generated
methane, sensitivity analysis on end-of-life CO2 eq for paperboard products is presented
in Chapter 3.
Water Use
Although there is increasing emphasis on including water use in life cycle
inventories, there is currently a lack of detailed water use data available for modeling on
a unit process level. In addition, water use data that are available from different sources
do not use a consistent method of distinguishing between consumptive use and non-
consumptive use of water or clearly identifying the water sources used (freshwater versus
saltwater, groundwater versus surface water). A recent article in the International Journal
of Life Cycle Assessment summarized the status and deficiencies of water use data for
LCA, including the statement, “To date, data availability on freshwater use proves to be a
limiting factor for establishing meaningful water footprints of products.”25 A description
of the water use research and data used in this analysis are presented in Appendix A.
System Components Not Included
The following components of each system are not included in this LCI study:
Capital Equipment. The energy and wastes associated with the manufacture of
capital equipment are not included. This includes equipment to manufacture buildings,
motor vehicles, and industrial machinery. The energy and emissions associated with such
capital equipment generally, for 1,000 pounds of materials, become negligible when
averaged over the millions of pounds of product manufactured over the useful lifetime of
the capital equipment.
Space Conditioning. The fuels and power consumed to heat, cool, and light
manufacturing establishments are omitted from the calculations in most cases. For
manufacturing plants that carry out thermal processing or otherwise consume large
amounts of energy, space conditioning energy is quite low compared to process energy.
Energy consumed for space conditioning is usually less than one percent of the total
energy consumption for the manufacturing process. This assumption has been checked in
the past by Franklin Associates staff using confidential data from manufacturing plants.
Support Personnel Requirements. The energy and wastes associated with
research and development, sales, and administrative personnel or related activities have
not been included in this study. Similar to space conditioning, energy requirements and
related emissions are assumed to be quite small for support personnel activities.
25 Koehler, Annette. “Water use in LCA: managing the planet’s freshwater resources.” Int J Life Cycle
Assess (2008) 13:451-455.

Chapter 1 Life Cycle Methodology
CLIENTS\PFPG\KC112313.doc
02.04.11 3666.00.003.001 1-20
Miscellaneous Materials and Additives. Selected materials such as catalysts,
pigments, or other additives which total less than one percent by weight of the net process
inputs are typically not included in the assessment unless inventory data for their
production are readily available or there is reason to believe the materials would make
significant contributions to energy use or environmental impacts. For example, some
manufacturers of disposable foodservice items use inks and pigments to decorate their
products. The production and application of inks and pigments were not included in the
scope of this analysis.
Omitting miscellaneous materials and additives helps keep the scope of the study
focused and manageable within budget and time constraints. While there are energy and
emissions associated with production of materials that are used in very low quantities, the
amounts would have to be disproportionately high per pound of material for such small
additives to have a significant effect on overall life cycle results for the systems studied.
Indirect Land Use Change. Indirect land use change is defined as “the
conversion of non-agricultural land to agricultural land as a consequence of changes in
agricultural practice elsewhere” (PAS 2050). Indirect land use can be an important issue
in LCAs that look at large shifts in uses of agricultural products (e.g., diversion of corn
grain from food uses to produce biofuels) and attempt to evaluate the consequential
effects on other systems outside the boundaries of the product systems being studied. For
PLA products, there could be indirect land use changes if the use of corn as a feedstock
for PLA reduced the available U.S. corn supply such that non-agricultural land had to be
converted to agricultural use to make up for this. However, it is unclear whether there
have been indirect land use changes that can be attributed to the use of corn for PLA
production. Additionally, there are large uncertainties in projecting the types and
locations of land that might be converted to agricultural use as a result of using a given
quantity of corn as feedstock for PLA. The greenhouse gas emissions for indirect land
use change can vary widely depending on assumptions about the type and location of
land converted. Furthermore, this analysis is an attributional LCI, not a consequential
LCI. As such, the analysis is based on the environmental burdens attributed to the
products being studied and does not attempt to model the consequential effects on other
systems.

Chapter 2 Life Cycle Inventory Results for Disposable Foodservice Products
CLIENTS\PFPG\KC112313.doc
02.04.11 3666.00.003.001 2-1
CHAPTER 2
LIFE CYCLE INVENTORY RESULTS FOR
DISPOSABLE FOODSERVICE PRODUCTS
INTRODUCTION
A life cycle inventory examines the sequence of steps in the life cycle of a
product system, beginning with raw material extraction and continuing on through
material production, product fabrication, use, reuse or recycling where applicable, and
final disposition. For each life cycle step, the inventory identifies and quantifies the
material inputs, energy consumption, and environmental emissions (atmospheric
emissions, waterborne wastes, and solid wastes). The information from this type of
analysis can be used as the basis for further study of the potential improvement of
resource use and environmental emissions associated with product systems. It can also
pinpoint areas (e.g., material components or processes) where changes would be most
beneficial in terms of reduced energy use or environmental emissions.
STUDY GOAL AND INTENDED USE
The goal of this study is to extend the scope of the 2006 PSPC LCI to include the
following additions:
1. Production and disposal of available PLA products corresponding as
closely as possible to the foodservice products in the original LCI,
2. Modeling of the carbon footprint implications of landfilling and waste-to-
energy (WTE) incineration of the foodservice products from the original
study and the PLA products,
3. Addition of water use to the life cycle inventory results.
The primary intended use of the study results is to provide PFPG with more
complete information about the environmental burdens and greenhouse gas impacts from
the life cycle of disposable foodservice products. A secondary intended use is public
release of the study. The LCI has been conducted following internationally accepted
standards for LCI methodology. Before the study is made publicly available, the
completed report will be peer reviewed in accordance with ISO standards for life cycle
assessment.
The results presented here for paperboard and PLA foodservice products are
intended for benchmarking purposes only. Because this study was conducted without the
direct participation of manufacturers of paperboard and PLA foodservice products, the
results shown in this study should not be used to represent specific brands of these
products available in the marketplace. Although the PLA modeling in this analysis is
based on NatureWorks Ingeo™ data, it is not known whether the PLA product samples
weighed for this analysis were manufactured from Ingeo brand PLA.
Chapter 2 Life Cycle Inventory Results for Disposable Foodservice Products
CLIENTS\PFPG\KC112313.doc
02.04.11 3666.00.003.001 2-2
In addition, a key observation in the original PSPC foodservice study was that
conclusions regarding the environmental profiles of foodservice products are dependent
not only on the materials used but on the weights of the products. The results presented in
this report are for the average weight polystyrene and paperboard products from the
PSPC report and a limited number of samples of PLA products. Comparisons of products
with different weights than the products studied in this analysis may yield different
conclusions about the products’ relative environmental profiles. Therefore, the results of
this study should not be used to draw general conclusions about comparative results for
the full range of products available in each product category.
SCOPE AND BOUNDARIES
This LCI encompasses the following steps in the life cycle of each foodservice
product studied:
• Raw material extraction (e.g., extraction of petroleum and natural gas as
feedstocks for EPS and GPPS resin, growing of corn used as feedstock for
PLA production, harvesting of trees used for papermaking)
• Processing and fabrication steps to transform raw materials into finished
products
• End-of-life management.
Transportation of products from manufacturing sites to retail stores is not
included, nor does the analysis include the production and disposal of secondary
packaging used to package products for shipment. Foodservice products are typically
packaged in film sleeves, with several sleeves of products in a corrugated box. Because
foamed products are thicker than coated paperboard products, the height of a stack of
foam products is greater than the stacked height of an equivalent number of paperboard
items. Therefore, a box of the same dimensions can hold a greater number of paperboard
items than foam items. However, the greater density of paperboard products may require
a sturdier (heavier) box compared to a box containing foam products. The contribution of
secondary packaging to the overall results for foodservice products was evaluated in the
original PSPC study.
The modeling for PLA production begins with corn growing. The NatureWorks
PLA data set reported the amount of land required for production of 1 kg of PLA but did
not provide details about any land use change impacts that may have been modeled.
Because the PLA facility is supplied by corn from counties that have a history of corn
production, it is expected that the land used to grow the corn was already in use for
agricultural purposes and did not require converting land from its natural state.
Chapter 2 Life Cycle Inventory Results for Disposable Foodservice Products
CLIENTS\PFPG\KC112313.doc
02.04.11 3666.00.003.001 2-3
End-of-life management options considered for the disposable foodservice
products include landfilling and waste-to-energy combustion. According to recent U.S.
EPA Municipal Solid Waste Facts and Figures reports, approximately 80 percent by
weight of municipal solid waste that is not recovered for recycling or composting is
managed by landfill and the other 20 percent by weight is managed by waste-to-energy
(WTE) combustion. Although some of the products analyzed are recyclable or
compostable, currently there is very little recycling or composting of the foodservice
products studied in this analysis, so evaluation of composting or recycling of foodservice
items is excluded from the scope of this analysis.
The results presented in this analysis include energy, solid waste (by weight and
by volume), greenhouse gas emissions, and water use. The end-of-life greenhouse gas
results include estimates of carbon dioxide from WTE combustion of postconsumer
foodservice products, methane from decomposition of landfilled paperboard foodservice
products, emission credits for avoided grid electricity displaced by electricity generated
from WTE energy and landfill gas combustion, and carbon sequestration in landfilled
biomass-derived material that does not decompose.
There are large uncertainties about the decomposition of landfilled paperboard
foodservice products. Landfill simulation studies have not been run on coated paperboard
foodservice products, so decomposition results for the paperboard content of the
foodservice products are estimated based on experimental results for bleached paper, as
described in the End of Life Management section of the Methodology chapter. The
coatings on paperboard cups and plates may inhibit or prevent decomposition of the fiber
content. Furthermore, there are variations in the moisture and temperature conditions in
landfills, as well as variations in the management of landfill gas at individual sites.
Therefore, it is not possible to define an average or most likely scenario for greenhouse
gas impacts from landfilled paperboard foodservice products. This analysis presents
results for maximum potential decomposition, 50% decomposition, and 0%
decomposition to cover upper and lower bounds and an intermediate scenario for
potential end-of-life GHG results.
FUNCTIONAL UNIT
In a life cycle study, products are compared on the basis of providing the same
defined function (called the functional unit). The function of disposable foodservice
products is to hold a serving of food or beverage for a single use application.
As in the original PSPC study, it should be recognized that there are differences in
the strength of different plates and the insulating performance of different types of cups.
In this analysis, products are compared on a one-to-one basis. This basis allows easy
scaling to alternative scenarios such as use of nested non-insulated cups (“double-
cupping”) or use of more than one plate to support a heavy load of food.
Chapter 2 Life Cycle Inventory Results for Disposable Foodservice Products
CLIENTS\PFPG\KC112313.doc
02.04.11 3666.00.003.001 2-4
In addition to the average weight high-grade plates from the original PSPC study,
the plate figures in this analysis also include results for two lighter weight plates (a
GPPS foam plate and an equivalent strength coated paperboard plate) from a 2009 LCI
study.26 Including the 2009 plate results serves two purposes: (1) to provide a
comparison of two plates with equivalent strength, and (2) to illustrate the influence of
product weight on LCI results.
SYSTEMS STUDIED
The following foodservice product categories are included in the analysis:
• 16-ounce hot cups (EPS foam, poly-coated paperboard with and without a
corrugated sleeve, PLA-coated paperboard with and without a corrugated
sleeve)
• 32-ounce cold cups (EPS foam, poly-coated paperboard, wax-coated
paperboard, solid PLA)
• 9-inch high-grade plates (GPPS foam, poly-coated paperboard, bleached
molded pulp, solid PLA)
• Sandwich-size clamshells (GPPS foam, corrugated paperboard, solid
PLA)
For the most part, the products modeled in this analysis are based on the average
weight products in the PSPC study. For the new category of PLA products, a literature
search was conducted for published information on weights of PLA foodservice products,
and product samples were ordered from several companies.
Although the goal of the study was to model PLA products that corresponded as
closely as possible with the PSPC study foodservice products, no PLA foam products
were found. Also, the properties of PLA are not suitable for hot cups to be made entirely
from PLA, so a 16-ounce hot cup PLA-coated paperboard hot cup is evaluated. For the
cold cup, plate, and clamshell applications, solid PLA products are analyzed.
For the cold cup application, no 32-ounce PLA cup samples were available;
however, samples of 24-ounce PLA cups and solid PP cups were obtained from the same
manufacturer. Two approaches were used to estimate the weight of a 32-ounce PLA cup.
The first method was to use the weight of a 32-ounce PP cup sample and scale up the
weight based on the ratios of the weights of the PLA and PP 24-oz cup samples. The
second approach was to take the weight of the 32-ounce PP cup and scale it up based on
the relative densities of PLA and PP resin. The report shows results for both PLA cup
weight estimates.
26 “Life Cycle Inventory of Foam and Coated Paperboard Plates” conducted by Franklin Associates, Ltd.
for Pactiv, December 2009.
Chapter 2 Life Cycle Inventory Results for Disposable Foodservice Products
CLIENTS\PFPG\KC112313.doc
02.04.11 3666.00.003.001 2-5
The weight of the PLA plate is based on the weight of a solid polystyrene plate
scaled using the weight ratio of samples of PLA clamshells and same size solid PS
clamshells. The weight of the sandwich-size clamshell is based on actual PLA clamshell
samples. The product weights analyzed in this study are listed in Table 2-1, together with
a brief description of the source of the weight data.
DATA SOURCES
The following data sources were used to model the systems:
• The 2006 PSPC study was used as the primary source of data on the
polystyrene and coated paperboard products. Plastic resin data (PS, LDPE)
are ACC industry average resin data revised by Franklin Associates in
2010. Plate fabrication data and the weight of resin coating on the plate
were updated using data sets provided by a private company in 2008.
• For PLA products, cradle-to-PLA resin energy and material use were
based on a rolled-up cradle-to-resin dataset for NatureWorks Ingeo PLA
polymer published in the U.S. LCI Database in March 2010. Converting
energy for solid PLA products was based on a 2006 European study.27
• Production and combustion of fuels and U.S. average grid electricity used
for process and transportation energy in all processes are from the U.S.
LCI database.
• Water use data were derived from other published LCI databases,
including PlasticsEurope Ecoprofiles28 and the Ecoinvent database. The
Ingeo dataset provided data on water use for corn growing as well as
process and cooling water used in PLA production processes.
• End-of-life modeling is based on U.S. EPA reports and the Environmental
Science and Technology article cited earlier29.
27 Comparative LCA of 4 Types of Drinking Cups Used at Events. OVAM. 2006. Downloaded from
http://www.natureworksllc.com/our-values-and-views/life-cycle-assessment/external-life-cycle-
assessment-studies.aspx. PLA cup fabrication data in section 1.8.4.2, page 263.
28 Accessed at http://lca.plasticseurope.org/index.htm.
29 Barlaz, et al.

Chapter 2 Life Cycle Inventory Results for Disposable Foodservice Products
CLIENTS\PFPG\KC112313.doc
02.04.11 3666.00.003.001 2-6
16 oz Hot Cups
grams/
item Source
Weight ratio
compared to avg PS
foam product
Wt range
in 2006
study (g)
EPS 4.7 average weight cup from 2006 PSPC study 4.4 - 5.0
LDPE-coated Paperboard 13.3 average weight cup from 2006 PSPC study
2.8 for cup only;
4.1 for cup + sleeve 12.3 - 15.0
PLA-coated Paperboard 12.7 average wt of 16 samples from one manufacturer
2.7 for cup only;
3.9 for cup + sleeve N/A
Unbleached Corrug Sleeve 5.8 average weight cup sleeve from 2006 PSPC study 4.1 - 7.5
32 oz Cold Cups
grams/
item Source
Weight ratio
compared to avg PS
foam product
Wt range
in 2006
study (g)
EPS 8.8 average weight cup from 2006 PSPC study 8.1 - 10.0
LDPE-coated Paperboard 19.8 average weight cup from 2006 PSPC study 2.2 19.8 - 23.3
Wax-coated Paperboard 31.3
average weight cup from 2006 PSPC study (one
producer) 3.5
Solid PLA 1 35.0
estimated based on weight of a 32 oz PP cup (23.3 g) and
the weight ratios of samples of 24 oz PLA and PP cups
produced by the same manufacturer (1) 4.0 N/A
Solid PLA 2 32.4
estimated based on the weight of 32 oz PP cup and ratio
of densities of PLA and PP (2) 3.7 N/A
9-inch Heavy Duty Plates
grams/
item Source
Weight ratio
compared to avg PS
foam product
Wt range
in 2006
study (g)
GPPS Foam 10.8 average weight plate from 2006 PSPC study 10.4 - 11.1
LDPE-coated Paperboard 18.4 average weight plate from 2006 PSPC study 1.7 18.2 - 18.5
Solid PLA 20.7
estimated based on weight of solid PS plate samples (18
g) and the weight ratio of solid PLA and solid PS
clamshells produced by the same manufacturer (3) 1.9 N/A
Molded Pulp 16.6 average weight plate from 2006 PSPC study 1.5 16.2 - 17.4
9-inch Lightweight Plates
grams/
item Source
Weight ratio
compared to avg PS
foam product
GPPS Foam 4.7 separate 2009 study
Competing
LDPE-coated Paperboard 12.1 separate 2009 study 2.6
Sandwich-size Clamshells
grams/
item Source
Weight ratio
compared to avg PS
foam product
Wt range
in 2006
study (g)
GPPS Foam 4.8 average weight clamshell from PSPC study 4.4 - 5.0
Fluted Paperboard 10.2 average weight clamshell from PSPC study 2.1 10.2 - 10.3
Solid PLA 23.3
average weight of actual samples of PLA clamshells
obtained and weighed by Franklin Associates 4.9 N/A
Source: Franklin Associates, A Division of ERG.
(3) For samples of PLA clamshells and solid (non-foam) PS clamshells made by the same producer, the PLA clamshell was
15% heaver than the same size PS clamshell. This weight ratio was applied to the weight of a solid PS plate (18 g) to estimate
the weight of the same size solid PLA plate (18 g PS plate x 1.15 = 20.7 g PLA plate).
(1) For samples of 24 oz PLA cups and 24 oz PP cups made by the same producer, the PLA cup was 50% heavier than the
same size PP cup. This weight ratio was applied to the weight of a 32 oz PP cup (23.3 g) to estimate the weight of a 32 oz
PLA cup (23.3 x 1.5 = 35.0 g).
(2) Using resin densities of 0.90 g/cm3 for PP and 1.25 g/cm3 for PLA, a product made of PLA would weigh 1.39 times as
much as a product made of the equivalent volume of PP resin. 23.3 g PP cup x 1.25/0.9 = 32.4 g PLA cup.
Table 2-1. Products Modeled
Chapter 2 Life Cycle Inventory Results for Disposable Foodservice Products
CLIENTS\PFPG\KC112313.doc
02.04.11 3666.00.003.001 2-7
For coated paperboard foodservice cups, the amount of coating is modeled as 10
percent of the weight of the product, the same assumption used in the peer-reviewed life
cycle inventory study of foodservice products30. This assumption was validated by
Franklin Associates based on published information on coated foodservice boardstock
composition. The plate coating was modeled as approximately 8 percent by weight of the
plate, based on information provided to Franklin Associates by a private company.
RESULTS
In addition to the energy, solid waste, and greenhouse gas emissions that were
reported in the 2006 PSPC study, this report adds results for water use and end-of-life
greenhouse gas emissions, expressed as pounds of carbon dioxide equivalents (CO2 eq).
An important issue with LCI results is whether two numbers are actually different
from one another. If the error or variability in the data is sufficiently large, it cannot be
concluded that the two numbers are truly different. A statistical analysis that yields clear
numerical answers would be ideal, but LCI data, which are typically based on a limited
number of data sets for each unit process, are not suited to application of formal statistics,
which pertain to random samples from large populations that result in “normal curve”
distributions. However, based on the professional judgment of the analysts, the following
guidance is provided for interpretation of LCI results presented in this report: In order for
two systems’ results to be considered significantly different, there must be a minimum
percent difference of 10% in results for energy and postconsumer solid waste weight and
25% for emissions.31
Energy Results
The energy results presented in this report include not only the energy directly
consumed in process and transportation steps, but also precombustion energy (the energy
used to extract and process fuels used for process energy and transportation energy), and
the energy content of resources used as material inputs to the product systems.
Total Energy by Category. Tables 2-2 through 2-5 present total energy results
for each system broken out into the categories of process energy, transportation energy,
and energy of material resource (EMR).
30 “Life Cycle Inventory of Polystyrene Foam, Bleached Paperboard, and Corrugated Paperboard
Foodservice Products” conducted by Franklin Associates, Ltd. for the Polystyrene Packaging Council,
March 2006. Available at the American Chemistry Council website:
http://www.americanchemistry.com/s_plastics/sec_pfpg.asp?CID=1439&DID=5231.
31 The percent difference between system results is calculated as the difference between the two systems’
results divided by the average of the two systems’ results.
Chapter 2 Life Cycle Inventory Results for Disposable Foodservice Products
CLIENTS\PFPG\KC112313.doc
02.04.11 3666.00.003.001 2-8
The category of process energy includes totals for all processes required to
produce each foodservice product, from acquisition of raw materials through manufacture
of finished products, as well as operation of equipment used in landfilling postconsumer
products. The end-of-life process energy shown in Tables 2-2 through 2-5 includes a
credit for the energy recovered from waste-to-energy combustion of postconsumer items
or recovered landfill gas. Transportation energy is the energy used to move material
from location to location during its journey from raw material to finished product, and for
collection and transport of postconsumer material. Energy of material resource (EMR)
is the energy value of resources that are removed from the natural environment for use as
material feedstocks for the product systems. EMR derived from fossil fuel resources and
from biomass resources are shown separately in Tables 2-2 through 2-5. Some of the
EMR remains embodied in the end product and can potentially be recovered depending
on the ultimate fate of the postconsumer material. Energy can be recovered through WTE
combustion of the material at the end of its useful life, or the energy content of the
material can go with it into a landfill. The EMR shown in Tables 2-2 through 2-5 is the
total EMR to produce the product. Adjustment for the EMR that remains in landfilled
postconsumer products is included in the calculation of net expended energy shown in
Tables 2-7 through 2-10. Energy of material resource is described in more detail in
Chapter 1.
EMR accounts for 38 to 47 percent of total energy for the polystyrene foodservice
products. For coated paperboard products, fossil EMR associated with polyethylene
coatings represents 6 to 9 percent of total energy, and biomass EMR for the paperboard
content is 21 to 31 percent of the total energy. For solid PLA products, biomass EMR
comprises 31 to 36 percent of total energy requirements.
Transportation energy accounts for a small percentage of total energy for the
systems, less than 5 percent. The remainder of the energy for each system is process
energy. For the coated and uncoated paperboard systems, process energy accounts for 63
to 77 percent of the total energy requirements. Process energy ranges from 50 to 59
percent of the total energy for the PS systems, and 62 to 68 percent of total energy for
solid PLA products.
Energy results by category are shown for the four categories of foodservice
products in Figures 2-1a through 2-4a.
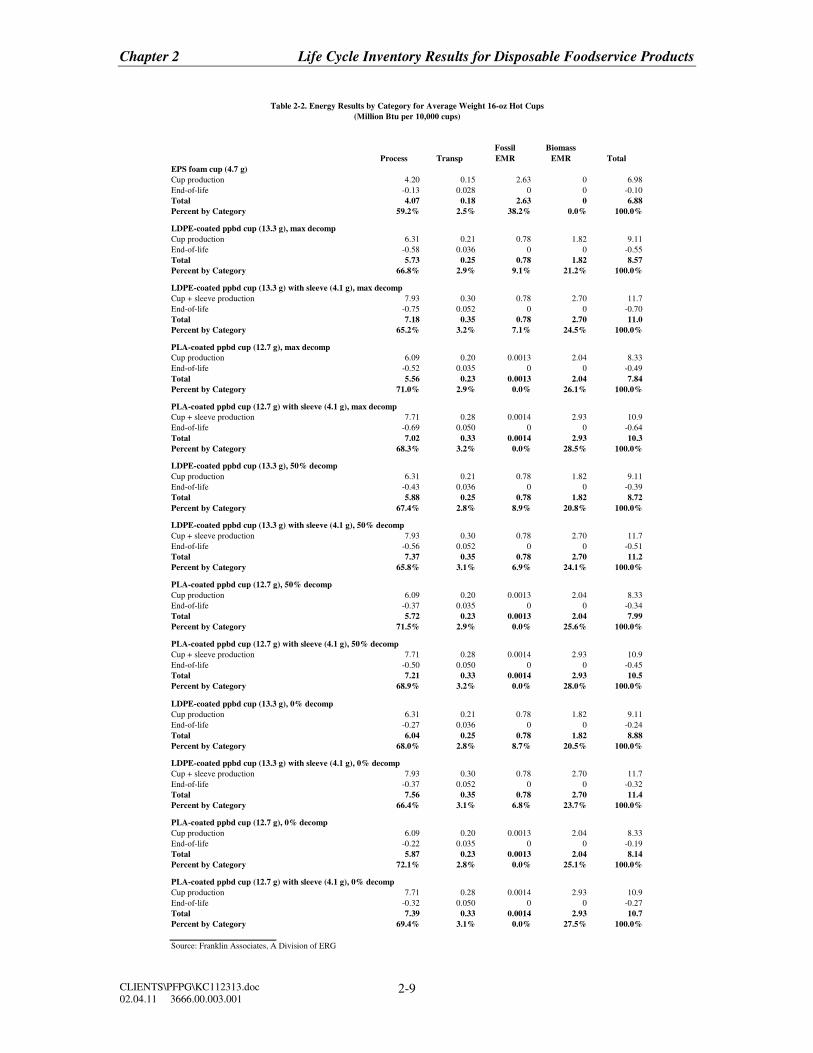
Chapter 2 Life Cycle Inventory Results for Disposable Foodservice Products
CLIENTS\PFPG\KC112313.doc
02.04.11 3666.00.003.001 2-9
Process Transp
Fossil
EMR
Biomass
EMR Total
EPS foam cup (4.7 g)
Cup production 4.20 0.15 2.63 0 6.98
End-of-life -0.13 0.028 0 0 -0.10
Total 4.07 0.18 2.63 0 6.88
Percent by Category 59.2% 2.5% 38.2% 0.0% 100.0%
LDPE-coated ppbd cup (13.3 g), max decomp
Cup production 6.31 0.21 0.78 1.82 9.11
End-of-life -0.58 0.036 0 0 -0.55
Total 5.73 0.25 0.78 1.82 8.57
Percent by Category 66.8% 2.9% 9.1% 21.2% 100.0%
LDPE-coated ppbd cup (13.3 g) with sleeve (4.1 g), max decomp
Cup + sleeve production 7.93 0.30 0.78 2.70 11.7
End-of-life -0.75 0.052 0 0 -0.70
Total 7.18 0.35 0.78 2.70 11.0
Percent by Category 65.2% 3.2% 7.1% 24.5% 100.0%
PLA-coated ppbd cup (12.7 g), max decomp
Cup production 6.09 0.20 0.0013 2.04 8.33
End-of-life -0.52 0.035 0 0 -0.49
Total 5.56 0.23 0.0013 2.04 7.84
Percent by Category 71.0% 2.9% 0.0% 26.1% 100.0%
PLA-coated ppbd cup (12.7 g) with sleeve (4.1 g), max decomp
Cup + sleeve production 7.71 0.28 0.0014 2.93 10.9
End-of-life -0.69 0.050 0 0 -0.64
Total 7.02 0.33 0.0014 2.93 10.3
Percent by Category 68.3% 3.2% 0.0% 28.5% 100.0%
LDPE-coated ppbd cup (13.3 g), 50% decomp
Cup production 6.31 0.21 0.78 1.82 9.11
End-of-life -0.43 0.036 0 0 -0.39
Total 5.88 0.25 0.78 1.82 8.72
Percent by Category 67.4% 2.8% 8.9% 20.8% 100.0%
LDPE-coated ppbd cup (13.3 g) with sleeve (4.1 g), 50% decomp
Cup + sleeve production 7.93 0.30 0.78 2.70 11.7
End-of-life -0.56 0.052 0 0 -0.51
Total 7.37 0.35 0.78 2.70 11.2
Percent by Category 65.8% 3.1% 6.9% 24.1% 100.0%
PLA-coated ppbd cup (12.7 g), 50% decomp
Cup production 6.09 0.20 0.0013 2.04 8.33
End-of-life -0.37 0.035 0 0 -0.34
Total 5.72 0.23 0.0013 2.04 7.99
Percent by Category 71.5% 2.9% 0.0% 25.6% 100.0%
PLA-coated ppbd cup (12.7 g) with sleeve (4.1 g), 50% decomp
Cup + sleeve production 7.71 0.28 0.0014 2.93 10.9
End-of-life -0.50 0.050 0 0 -0.45
Total 7.21 0.33 0.0014 2.93 10.5
Percent by Category 68.9% 3.2% 0.0% 28.0% 100.0%
LDPE-coated ppbd cup (13.3 g), 0% decomp
Cup production 6.31 0.21 0.78 1.82 9.11
End-of-life -0.27 0.036 0 0 -0.24
Total 6.04 0.25 0.78 1.82 8.88
Percent by Category 68.0% 2.8% 8.7% 20.5% 100.0%
LDPE-coated ppbd cup (13.3 g) with sleeve (4.1 g), 0% decomp
Cup + sleeve production 7.93 0.30 0.78 2.70 11.7
End-of-life -0.37 0.052 0 0 -0.32
Total 7.56 0.35 0.78 2.70 11.4
Percent by Category 66.4% 3.1% 6.8% 23.7% 100.0%
PLA-coated ppbd cup (12.7 g), 0% decomp
Cup production 6.09 0.20 0.0013 2.04 8.33
End-of-life -0.22 0.035 0 0 -0.19
Total 5.87 0.23 0.0013 2.04 8.14
Percent by Category 72.1% 2.8% 0.0% 25.1% 100.0%
PLA-coated ppbd cup (12.7 g) with sleeve (4.1 g), 0% decomp
Cup production 7.71 0.28 0.0014 2.93 10.9
End-of-life -0.32 0.050 0 0 -0.27
Total 7.39 0.33 0.0014 2.93 10.7
Percent by Category 69.4% 3.1% 0.0% 27.5% 100.0%
Source: Franklin Associates, A Division of ERG
(Million Btu per 10,000 cups)
Table 2-2. Energy Results by Category for Average Weight 16-oz Hot Cups
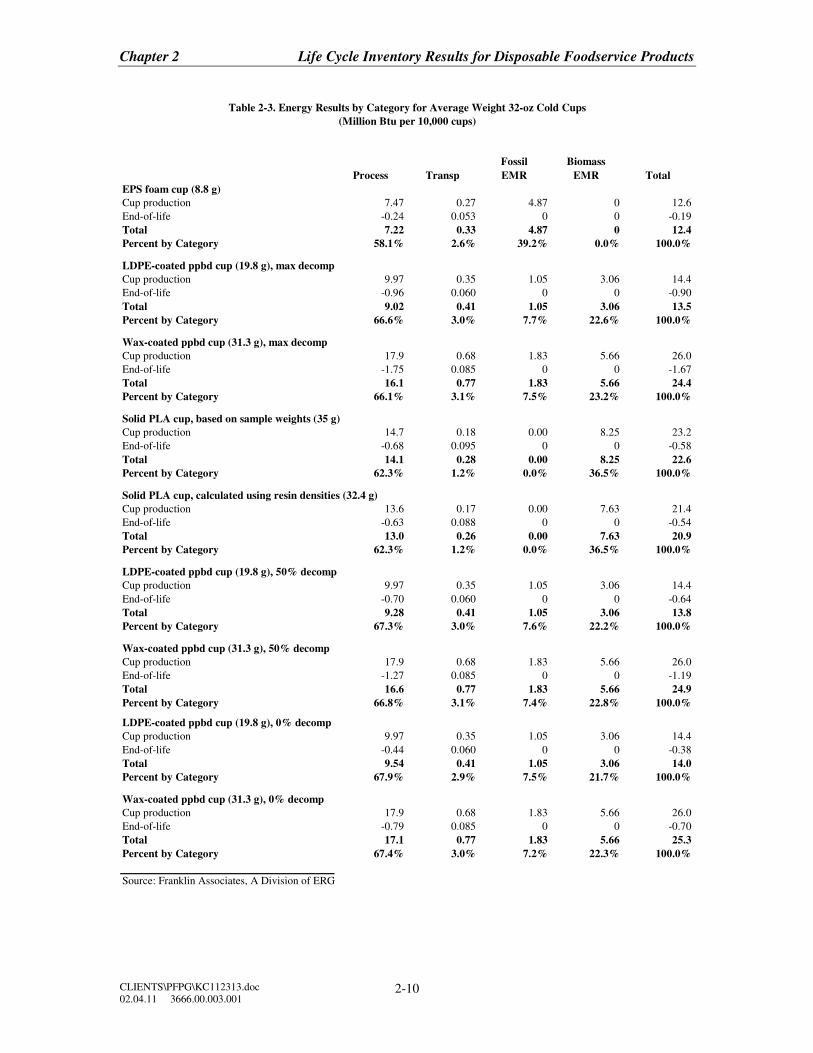
Chapter 2 Life Cycle Inventory Results for Disposable Foodservice Products
CLIENTS\PFPG\KC112313.doc
02.04.11 3666.00.003.001 2-10
Process Transp
Fossil
EMR
Biomass
EMR Total
EPS foam cup (8.8 g)
Cup production 7.47 0.27 4.87 0 12.6
End-of-life -0.24 0.053 0 0 -0.19
Total 7.22 0.33 4.87 0 12.4
Percent by Category 58.1% 2.6% 39.2% 0.0% 100.0%
LDPE-coated ppbd cup (19.8 g), max decomp
Cup production 9.97 0.35 1.05 3.06 14.4
End-of-life -0.96 0.060 0 0 -0.90
Total 9.02 0.41 1.05 3.06 13.5
Percent by Category 66.6% 3.0% 7.7% 22.6% 100.0%
Wax-coated ppbd cup (31.3 g), max decomp
Cup production 17.9 0.68 1.83 5.66 26.0
End-of-life -1.75 0.085 0 0 -1.67
Total 16.1 0.77 1.83 5.66 24.4
Percent by Category 66.1% 3.1% 7.5% 23.2% 100.0%
Solid PLA cup, based on sample weights (35 g)
Cup production 14.7 0.18 0.00 8.25 23.2
End-of-life -0.68 0.095 0 0 -0.58
Total 14.1 0.28 0.00 8.25 22.6
Percent by Category 62.3% 1.2% 0.0% 36.5% 100.0%
Solid PLA cup, calculated using resin densities (32.4 g)
Cup production 13.6 0.17 0.00 7.63 21.4
End-of-life -0.63 0.088 0 0 -0.54
Total 13.0 0.26 0.00 7.63 20.9
Percent by Category 62.3% 1.2% 0.0% 36.5% 100.0%
LDPE-coated ppbd cup (19.8 g), 50% decomp
Cup production 9.97 0.35 1.05 3.06 14.4
End-of-life -0.70 0.060 0 0 -0.64
Total 9.28 0.41 1.05 3.06 13.8
Percent by Category 67.3% 3.0% 7.6% 22.2% 100.0%
Wax-coated ppbd cup (31.3 g), 50% decomp
Cup production 17.9 0.68 1.83 5.66 26.0
End-of-life -1.27 0.085 0 0 -1.19
Total 16.6 0.77 1.83 5.66 24.9
Percent by Category 66.8% 3.1% 7.4% 22.8% 100.0%
LDPE-coated ppbd cup (19.8 g), 0% decomp
Cup production 9.97 0.35 1.05 3.06 14.4
End-of-life -0.44 0.060 0 0 -0.38
Total 9.54 0.41 1.05 3.06 14.0
Percent by Category 67.9% 2.9% 7.5% 21.7% 100.0%
Wax-coated ppbd cup (31.3 g), 0% decomp
Cup production 17.9 0.68 1.83 5.66 26.0
End-of-life -0.79 0.085 0 0 -0.70
Total 17.1 0.77 1.83 5.66 25.3
Percent by Category 67.4% 3.0% 7.2% 22.3% 100.0%
Source: Franklin Associates, A Division of ERG
(Million Btu per 10,000 cups)
Table 2-3. Energy Results by Category for Average Weight 32-oz Cold Cups
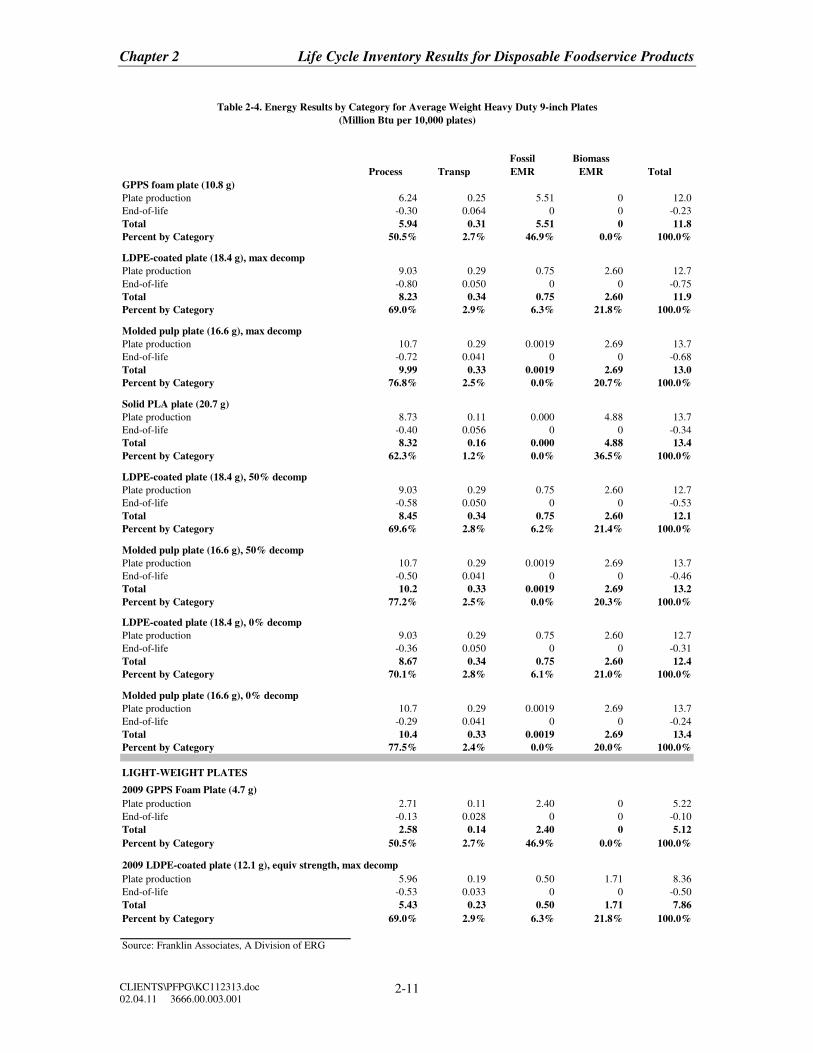
Chapter 2 Life Cycle Inventory Results for Disposable Foodservice Products
CLIENTS\PFPG\KC112313.doc
02.04.11 3666.00.003.001 2-11
Process Transp
Fossil
EMR
Biomass
EMR Total
GPPS foam plate (10.8 g)
Plate production 6.24 0.25 5.51 0 12.0
End-of-life -0.30 0.064 0 0 -0.23
Total 5.94 0.31 5.51 0 11.8
Percent by Category 50.5% 2.7% 46.9% 0.0% 100.0%
LDPE-coated plate (18.4 g), max decomp
Plate production 9.03 0.29 0.75 2.60 12.7
End-of-life -0.80 0.050 0 0 -0.75
Total 8.23 0.34 0.75 2.60 11.9
Percent by Category 69.0% 2.9% 6.3% 21.8% 100.0%
Molded pulp plate (16.6 g), max decomp
Plate production 10.7 0.29 0.0019 2.69 13.7
End-of-life -0.72 0.041 0 0 -0.68
Total 9.99 0.33 0.0019 2.69 13.0
Percent by Category 76.8% 2.5% 0.0% 20.7% 100.0%
Solid PLA plate (20.7 g)
Plate production 8.73 0.11 0.000 4.88 13.7
End-of-life -0.40 0.056 0 0 -0.34
Total 8.32 0.16 0.000 4.88 13.4
Percent by Category 62.3% 1.2% 0.0% 36.5% 100.0%
LDPE-coated plate (18.4 g), 50% decomp
Plate production 9.03 0.29 0.75 2.60 12.7
End-of-life -0.58 0.050 0 0 -0.53
Total 8.45 0.34 0.75 2.60 12.1
Percent by Category 69.6% 2.8% 6.2% 21.4% 100.0%
Molded pulp plate (16.6 g), 50% decomp
Plate production 10.7 0.29 0.0019 2.69 13.7
End-of-life -0.50 0.041 0 0 -0.46
Total 10.2 0.33 0.0019 2.69 13.2
Percent by Category 77.2% 2.5% 0.0% 20.3% 100.0%
LDPE-coated plate (18.4 g), 0% decomp
Plate production 9.03 0.29 0.75 2.60 12.7
End-of-life -0.36 0.050 0 0 -0.31
Total 8.67 0.34 0.75 2.60 12.4
Percent by Category 70.1% 2.8% 6.1% 21.0% 100.0%
Molded pulp plate (16.6 g), 0% decomp
Plate production 10.7 0.29 0.0019 2.69 13.7
End-of-life -0.29 0.041 0 0 -0.24
Total 10.4 0.33 0.0019 2.69 13.4
Percent by Category 77.5% 2.4% 0.0% 20.0% 100.0%
LIGHT-WEIGHT PLATES
2009 GPPS Foam Plate (4.7 g)
Plate production 2.71 0.11 2.40 0 5.22
End-of-life -0.13 0.028 0 0 -0.10
Total 2.58 0.14 2.40 0 5.12
Percent by Category 50.5% 2.7% 46.9% 0.0% 100.0%
2009 LDPE-coated plate (12.1 g), equiv strength, max decomp
Plate production 5.96 0.19 0.50 1.71 8.36
End-of-life -0.53 0.033 0 0 -0.50
Total 5.43 0.23 0.50 1.71 7.86
Percent by Category 69.0% 2.9% 6.3% 21.8% 100.0%
Source: Franklin Associates, A Division of ERG
(Million Btu per 10,000 plates)
Table 2-4. Energy Results by Category for Average Weight Heavy Duty 9-inch Plates
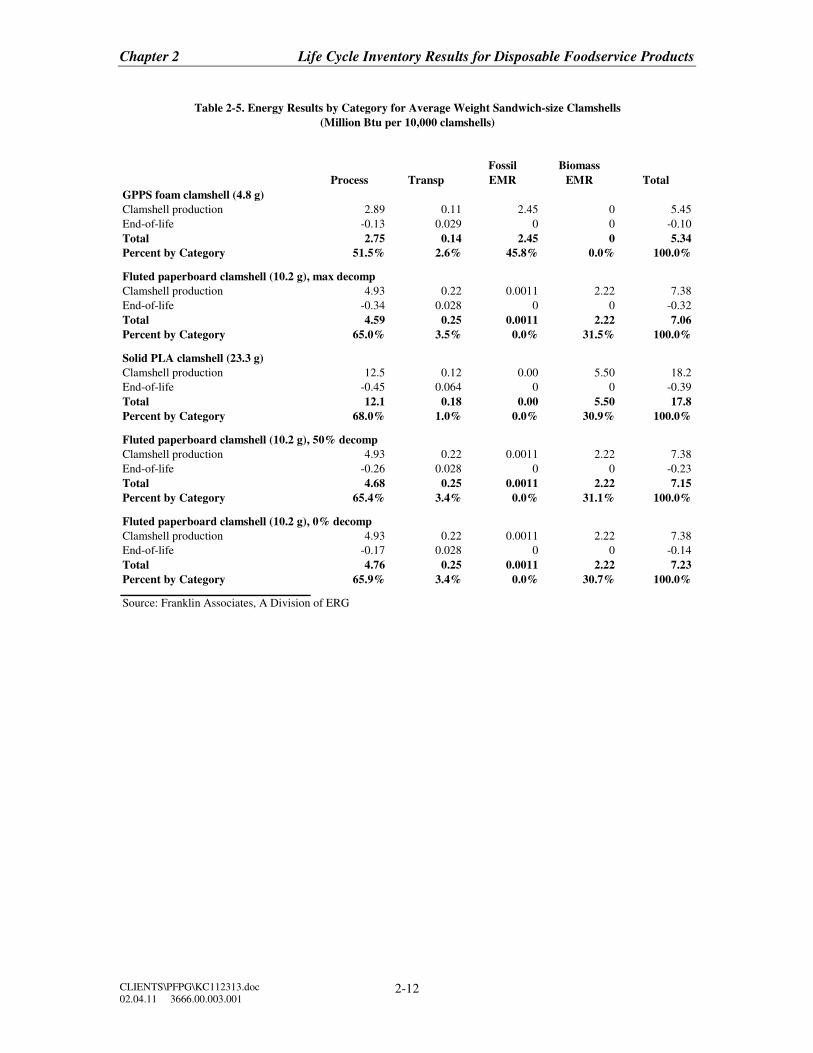
Chapter 2 Life Cycle Inventory Results for Disposable Foodservice Products
CLIENTS\PFPG\KC112313.doc
02.04.11 3666.00.003.001 2-12
Process Transp
Fossil
EMR
Biomass
EMR Total
GPPS foam clamshell (4.8 g)
Clamshell production 2.89 0.11 2.45 0 5.45
End-of-life -0.13 0.029 0 0 -0.10
Total 2.75 0.14 2.45 0 5.34
Percent by Category 51.5% 2.6% 45.8% 0.0% 100.0%
Fluted paperboard clamshell (10.2 g), max decomp
Clamshell production 4.93 0.22 0.0011 2.22 7.38
End-of-life -0.34 0.028 0 0 -0.32
Total 4.59 0.25 0.0011 2.22 7.06
Percent by Category 65.0% 3.5% 0.0% 31.5% 100.0%
Solid PLA clamshell (23.3 g)
Clamshell production 12.5 0.12 0.00 5.50 18.2
End-of-life -0.45 0.064 0 0 -0.39
Total 12.1 0.18 0.00 5.50 17.8
Percent by Category 68.0% 1.0% 0.0% 30.9% 100.0%
Fluted paperboard clamshell (10.2 g), 50% decomp
Clamshell production 4.93 0.22 0.0011 2.22 7.38
End-of-life -0.26 0.028 0 0 -0.23
Total 4.68 0.25 0.0011 2.22 7.15
Percent by Category 65.4% 3.4% 0.0% 31.1% 100.0%
Fluted paperboard clamshell (10.2 g), 0% decomp
Clamshell production 4.93 0.22 0.0011 2.22 7.38
End-of-life -0.17 0.028 0 0 -0.14
Total 4.76 0.25 0.0011 2.22 7.23
Percent by Category 65.9% 3.4% 0.0% 30.7% 100.0%
Source: Franklin Associates, A Division of ERG
(Million Btu per 10,000 clamshells)
Table 2-5. Energy Results by Category for Average Weight Sandwich-size Clamshells
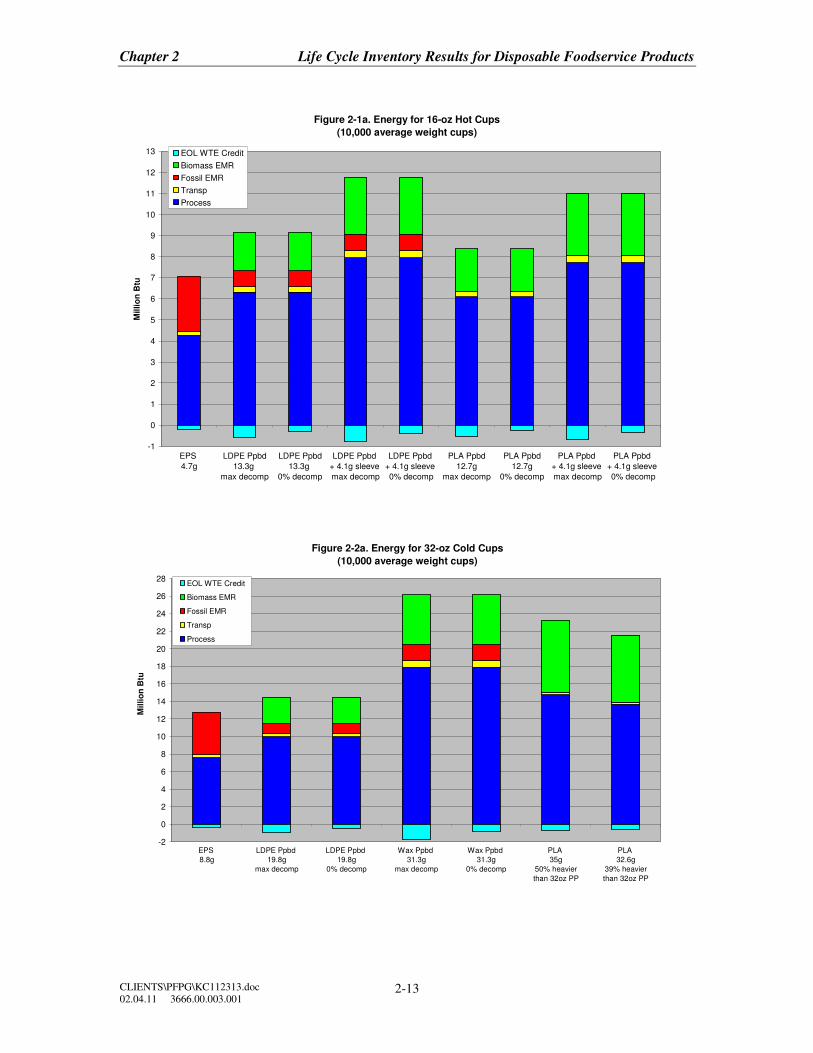
Chapter 2 Life Cycle Inventory Results for Disposable Foodservice Products
CLIENTS\PFPG\KC112313.doc
02.04.11 3666.00.003.001 2-13
Figure 2-1a. Energy for 16-oz Hot Cups
(10,000 average weight cups)
-1
0
1
2
3
4
5
6
7
8
9
10
11
12
13
EPS
4.7g
LDPE Ppbd
13.3g
max decomp
LDPE Ppbd
13.3g
0% decomp
LDPE Ppbd
+ 4.1g sleeve
max decomp
LDPE Ppbd
+ 4.1g sleeve
0% decomp
PLA Ppbd
12.7g
max decomp
PLA Ppbd
12.7g
0% decomp
PLA Ppbd
+ 4.1g sleeve
max decomp
PLA Ppbd
+ 4.1g sleeve
0% decomp
Millio
n B
tu
EOL WTE Credit
Biomass EMR
Fossil EMR
Transp
Process
Figure 2-2a. Energy for 32-oz Cold Cups
(10,000 average weight cups)
-2
0
2
4
6
8
10
12
14
16
18
20
22
24
26
28
EPS
8.8g
LDPE Ppbd
19.8g
max decomp
LDPE Ppbd
19.8g
0% decomp
Wax Ppbd
31.3g
max decomp
Wax Ppbd
31.3g
0% decomp
PLA
35g
50% heavier
than 32oz PP
PLA
32.6g
39% heavier
than 32oz PP
Millio
n B
tu
EOL WTE Credit
Biomass EMR
Fossil EMR
Transp
Process
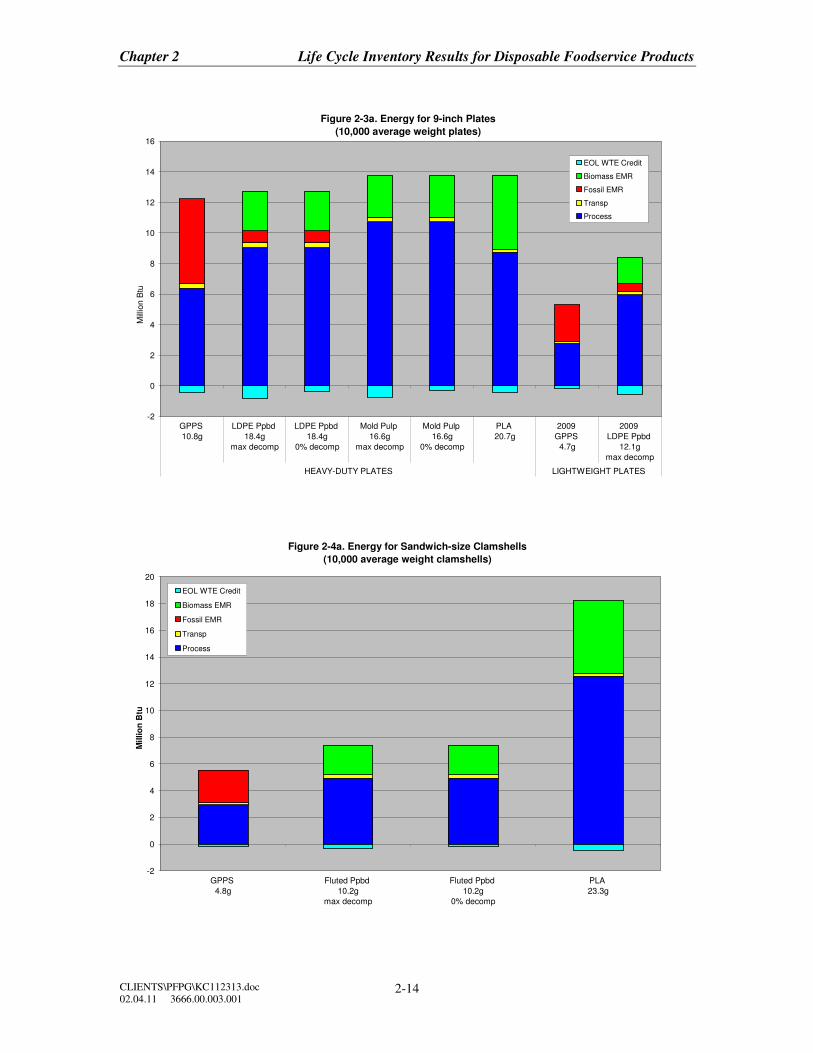
Chapter 2 Life Cycle Inventory Results for Disposable Foodservice Products
CLIENTS\PFPG\KC112313.doc
02.04.11 3666.00.003.001 2-14
Figure 2-3a. Energy for 9-inch Plates
(10,000 average weight plates)
-2
0
2
4
6
8
10
12
14
16
GPPS
10.8g
LDPE Ppbd
18.4g
max decomp
LDPE Ppbd
18.4g
0% decomp
Mold Pulp
16.6g
max decomp
Mold Pulp
16.6g
0% decomp
PLA
20.7g
2009
GPPS
4.7g
2009
LDPE Ppbd
12.1g
max decomp
HEAVY-DUTY PLATES LIGHTWEIGHT PLATES
Mill
ion B
tu
EOL WTE Credit
Biomass EMR
Fossil EMR
Transp
Process
Figure 2-4a. Energy for Sandwich-size Clamshells
(10,000 average weight clamshells)
-2
0
2
4
6
8
10
12
14
16
18
20
GPPS
4.8g
Fluted Ppbd
10.2g
max decomp
Fluted Ppbd
10.2g
0% decomp
PLA
23.3g
Millio
n B
tu
EOL WTE Credit
Biomass EMR
Fossil EMR
Transp
Process
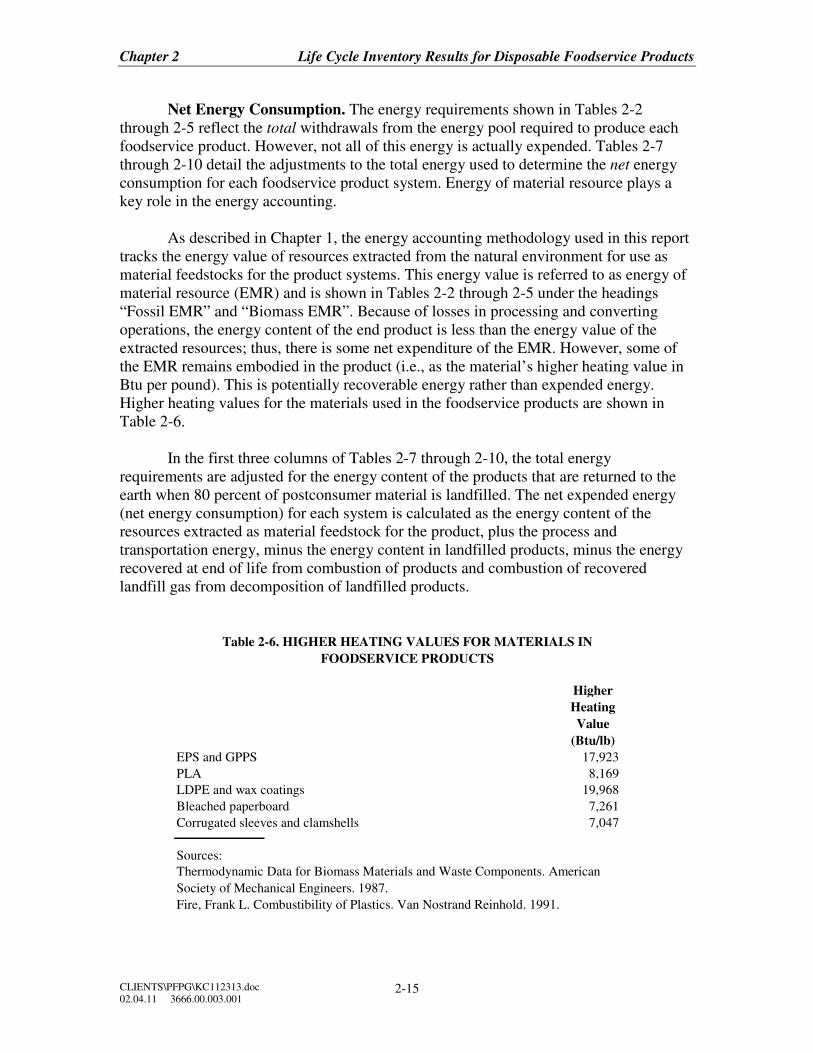
Chapter 2 Life Cycle Inventory Results for Disposable Foodservice Products
CLIENTS\PFPG\KC112313.doc
02.04.11 3666.00.003.001 2-15
Net Energy Consumption. The energy requirements shown in Tables 2-2
through 2-5 reflect the total withdrawals from the energy pool required to produce each
foodservice product. However, not all of this energy is actually expended. Tables 2-7
through 2-10 detail the adjustments to the total energy used to determine the net energy
consumption for each foodservice product system. Energy of material resource plays a
key role in the energy accounting.
As described in Chapter 1, the energy accounting methodology used in this report
tracks the energy value of resources extracted from the natural environment for use as
material feedstocks for the product systems. This energy value is referred to as energy of
material resource (EMR) and is shown in Tables 2-2 through 2-5 under the headings
“Fossil EMR” and “Biomass EMR”. Because of losses in processing and converting
operations, the energy content of the end product is less than the energy value of the
extracted resources; thus, there is some net expenditure of the EMR. However, some of
the EMR remains embodied in the product (i.e., as the material’s higher heating value in
Btu per pound). This is potentially recoverable energy rather than expended energy.
Higher heating values for the materials used in the foodservice products are shown in
Table 2-6.
In the first three columns of Tables 2-7 through 2-10, the total energy
requirements are adjusted for the energy content of the products that are returned to the
earth when 80 percent of postconsumer material is landfilled. The net expended energy
(net energy consumption) for each system is calculated as the energy content of the
resources extracted as material feedstock for the product, plus the process and
transportation energy, minus the energy content in landfilled products, minus the energy
recovered at end of life from combustion of products and combustion of recovered
landfill gas from decomposition of landfilled products.
EPS and GPPS 17,923
PLA 8,169
LDPE and wax coatings 19,968
Bleached paperboard 7,261
Corrugated sleeves and clamshells 7,047
Sources:
Fire, Frank L. Combustibility of Plastics. Van Nostrand Reinhold. 1991.
Table 2-6. HIGHER HEATING VALUES FOR MATERIALS IN
FOODSERVICE PRODUCTS
Higher
Heating
Value
(Btu/lb)
Thermodynamic Data for Biomass Materials and Waste Components. American
Society of Mechanical Engineers. 1987.
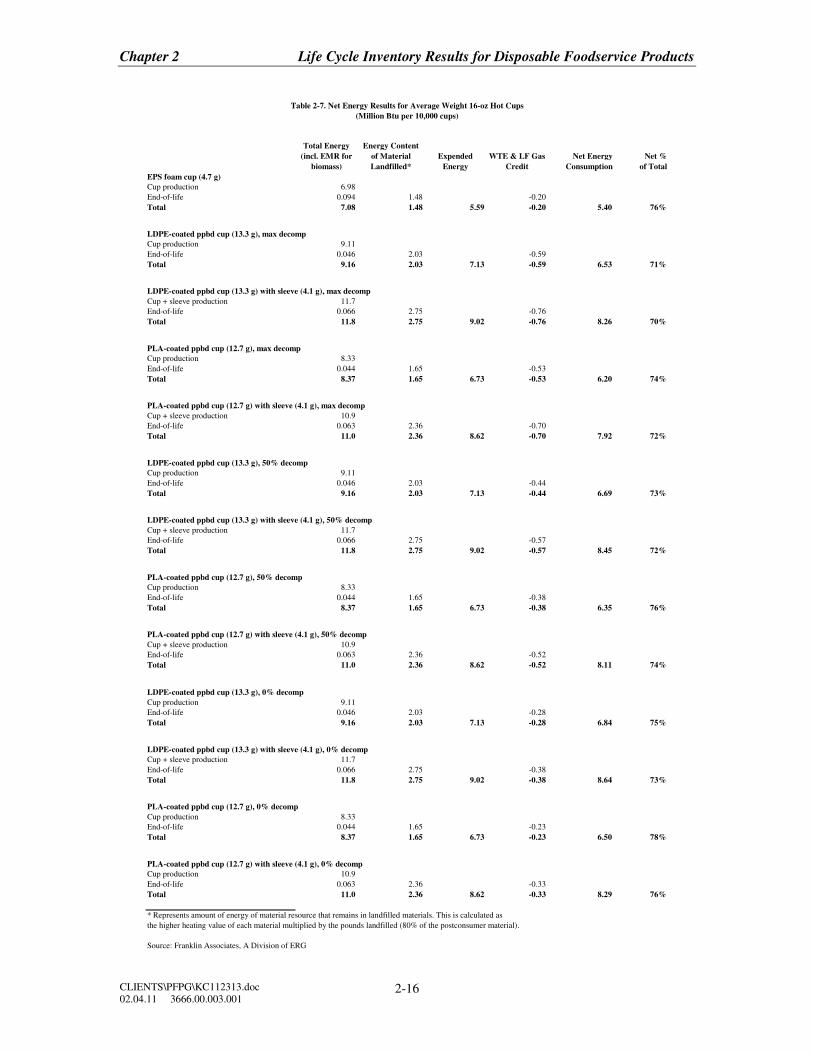
Chapter 2 Life Cycle Inventory Results for Disposable Foodservice Products
CLIENTS\PFPG\KC112313.doc
02.04.11 3666.00.003.001 2-16
Total Energy
(incl. EMR for
biomass)
Energy Content
of Material
Landfilled*
Expended
Energy
WTE & LF Gas
Credit
Net Energy
Consumption
Net %
of Total
EPS foam cup (4.7 g)
Cup production 6.98
End-of-life 0.094 1.48 -0.20
Total 7.08 1.48 5.59 -0.20 5.40 76%
LDPE-coated ppbd cup (13.3 g), max decomp
Cup production 9.11
End-of-life 0.046 2.03 -0.59
Total 9.16 2.03 7.13 -0.59 6.53 71%
LDPE-coated ppbd cup (13.3 g) with sleeve (4.1 g), max decomp
Cup + sleeve production 11.7
End-of-life 0.066 2.75 -0.76
Total 11.8 2.75 9.02 -0.76 8.26 70%
PLA-coated ppbd cup (12.7 g), max decomp
Cup production 8.33
End-of-life 0.044 1.65 -0.53
Total 8.37 1.65 6.73 -0.53 6.20 74%
PLA-coated ppbd cup (12.7 g) with sleeve (4.1 g), max decomp
Cup + sleeve production 10.9
End-of-life 0.063 2.36 -0.70
Total 11.0 2.36 8.62 -0.70 7.92 72%
LDPE-coated ppbd cup (13.3 g), 50% decomp
Cup production 9.11
End-of-life 0.046 2.03 -0.44
Total 9.16 2.03 7.13 -0.44 6.69 73%
LDPE-coated ppbd cup (13.3 g) with sleeve (4.1 g), 50% decomp
Cup + sleeve production 11.7
End-of-life 0.066 2.75 -0.57
Total 11.8 2.75 9.02 -0.57 8.45 72%
PLA-coated ppbd cup (12.7 g), 50% decomp
Cup production 8.33
End-of-life 0.044 1.65 -0.38
Total 8.37 1.65 6.73 -0.38 6.35 76%
PLA-coated ppbd cup (12.7 g) with sleeve (4.1 g), 50% decomp
Cup + sleeve production 10.9
End-of-life 0.063 2.36 -0.52
Total 11.0 2.36 8.62 -0.52 8.11 74%
LDPE-coated ppbd cup (13.3 g), 0% decomp
Cup production 9.11
End-of-life 0.046 2.03 -0.28
Total 9.16 2.03 7.13 -0.28 6.84 75%
LDPE-coated ppbd cup (13.3 g) with sleeve (4.1 g), 0% decomp
Cup + sleeve production 11.7
End-of-life 0.066 2.75 -0.38
Total 11.8 2.75 9.02 -0.38 8.64 73%
PLA-coated ppbd cup (12.7 g), 0% decomp
Cup production 8.33
End-of-life 0.044 1.65 -0.23
Total 8.37 1.65 6.73 -0.23 6.50 78%
PLA-coated ppbd cup (12.7 g) with sleeve (4.1 g), 0% decomp
Cup production 10.9
End-of-life 0.063 2.36 -0.33
Total 11.0 2.36 8.62 -0.33 8.29 76%
* Represents amount of energy of material resource that remains in landfilled materials. This is calculated as
the higher heating value of each material multiplied by the pounds landfilled (80% of the postconsumer material).
Source: Franklin Associates, A Division of ERG
Table 2-7. Net Energy Results for Average Weight 16-oz Hot Cups
(Million Btu per 10,000 cups)
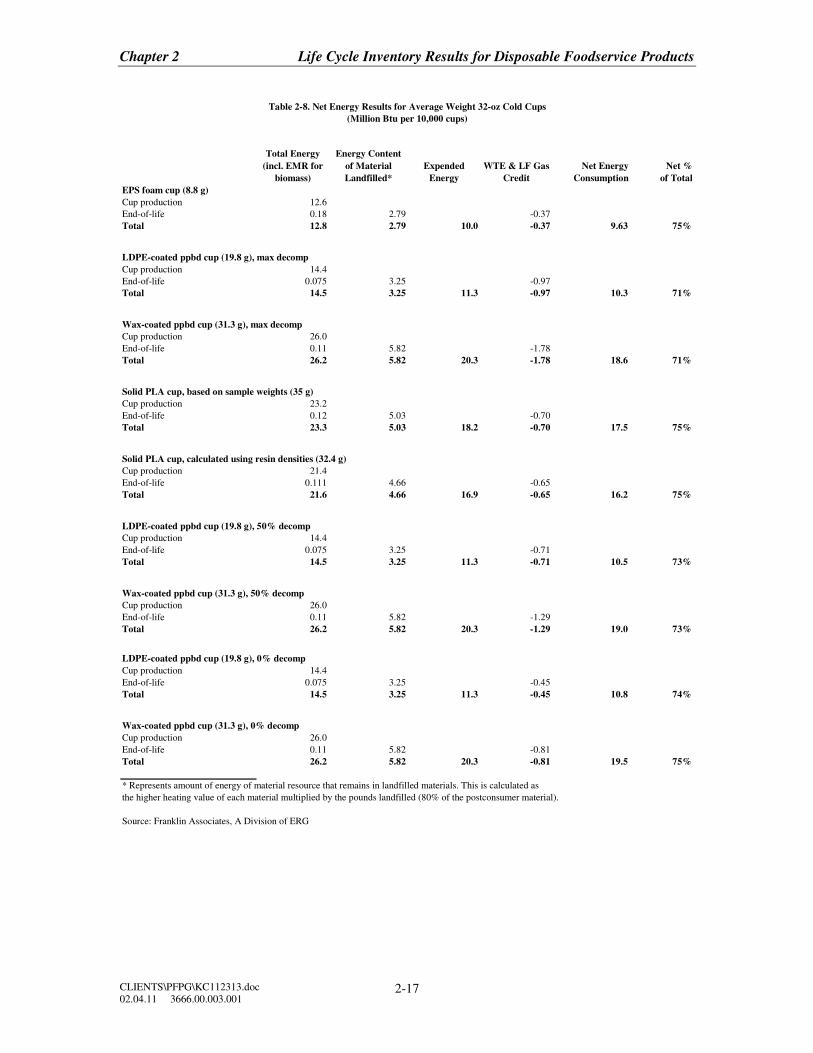
Chapter 2 Life Cycle Inventory Results for Disposable Foodservice Products
CLIENTS\PFPG\KC112313.doc
02.04.11 3666.00.003.001 2-17
Total Energy
(incl. EMR for
biomass)
Energy Content
of Material
Landfilled*
Expended
Energy
WTE & LF Gas
Credit
Net Energy
Consumption
Net %
of Total
EPS foam cup (8.8 g)
Cup production 12.6
End-of-life 0.18 2.79 -0.37
Total 12.8 2.79 10.0 -0.37 9.63 75%
LDPE-coated ppbd cup (19.8 g), max decomp
Cup production 14.4
End-of-life 0.075 3.25 -0.97
Total 14.5 3.25 11.3 -0.97 10.3 71%
Wax-coated ppbd cup (31.3 g), max decomp
Cup production 26.0
End-of-life 0.11 5.82 -1.78
Total 26.2 5.82 20.3 -1.78 18.6 71%
Solid PLA cup, based on sample weights (35 g)
Cup production 23.2
End-of-life 0.12 5.03 -0.70
Total 23.3 5.03 18.2 -0.70 17.5 75%
Solid PLA cup, calculated using resin densities (32.4 g)
Cup production 21.4
End-of-life 0.111 4.66 -0.65
Total 21.6 4.66 16.9 -0.65 16.2 75%
LDPE-coated ppbd cup (19.8 g), 50% decomp
Cup production 14.4
End-of-life 0.075 3.25 -0.71
Total 14.5 3.25 11.3 -0.71 10.5 73%
Wax-coated ppbd cup (31.3 g), 50% decomp
Cup production 26.0
End-of-life 0.11 5.82 -1.29
Total 26.2 5.82 20.3 -1.29 19.0 73%
LDPE-coated ppbd cup (19.8 g), 0% decomp
Cup production 14.4
End-of-life 0.075 3.25 -0.45
Total 14.5 3.25 11.3 -0.45 10.8 74%
Wax-coated ppbd cup (31.3 g), 0% decomp
Cup production 26.0
End-of-life 0.11 5.82 -0.81
Total 26.2 5.82 20.3 -0.81 19.5 75%
* Represents amount of energy of material resource that remains in landfilled materials. This is calculated as
the higher heating value of each material multiplied by the pounds landfilled (80% of the postconsumer material).
Source: Franklin Associates, A Division of ERG
Table 2-8. Net Energy Results for Average Weight 32-oz Cold Cups
(Million Btu per 10,000 cups)
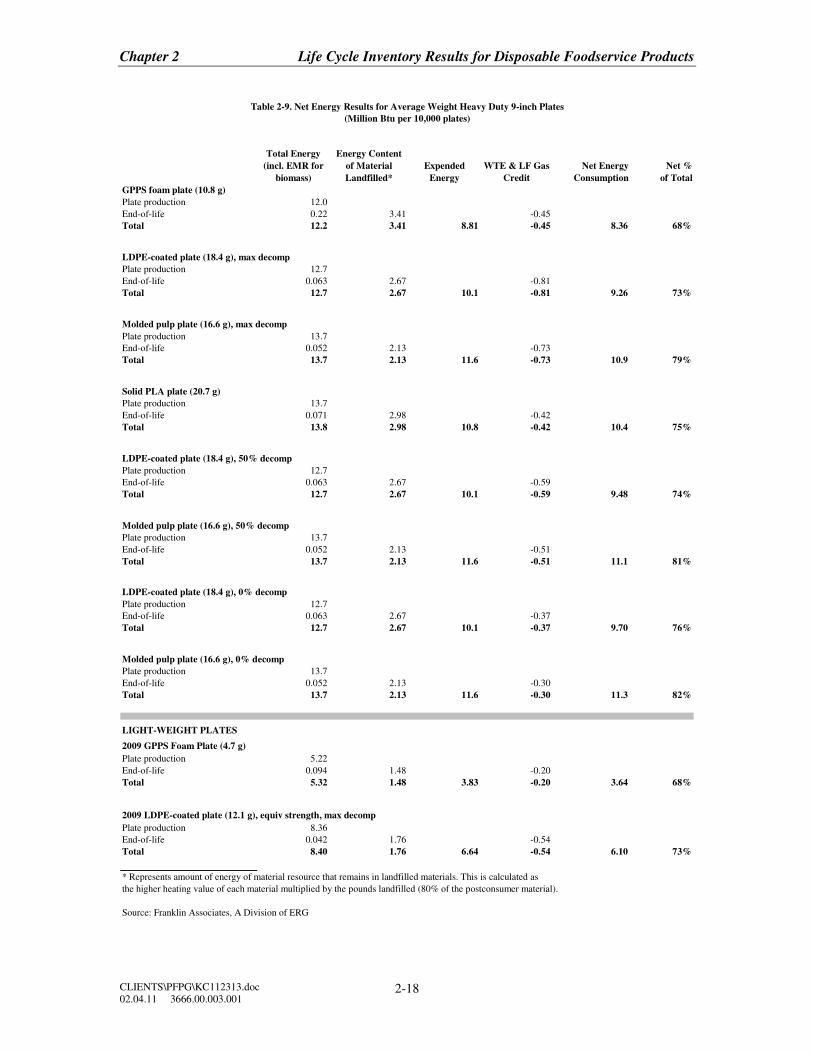
Chapter 2 Life Cycle Inventory Results for Disposable Foodservice Products
CLIENTS\PFPG\KC112313.doc
02.04.11 3666.00.003.001 2-18
Total Energy
(incl. EMR for
biomass)
Energy Content
of Material
Landfilled*
Expended
Energy
WTE & LF Gas
Credit
Net Energy
Consumption
Net %
of Total
GPPS foam plate (10.8 g)
Plate production 12.0
End-of-life 0.22 3.41 -0.45
Total 12.2 3.41 8.81 -0.45 8.36 68%
LDPE-coated plate (18.4 g), max decomp
Plate production 12.7
End-of-life 0.063 2.67 -0.81
Total 12.7 2.67 10.1 -0.81 9.26 73%
Molded pulp plate (16.6 g), max decomp
Plate production 13.7
End-of-life 0.052 2.13 -0.73
Total 13.7 2.13 11.6 -0.73 10.9 79%
Solid PLA plate (20.7 g)
Plate production 13.7
End-of-life 0.071 2.98 -0.42
Total 13.8 2.98 10.8 -0.42 10.4 75%
LDPE-coated plate (18.4 g), 50% decomp
Plate production 12.7
End-of-life 0.063 2.67 -0.59
Total 12.7 2.67 10.1 -0.59 9.48 74%
Molded pulp plate (16.6 g), 50% decomp
Plate production 13.7
End-of-life 0.052 2.13 -0.51
Total 13.7 2.13 11.6 -0.51 11.1 81%
LDPE-coated plate (18.4 g), 0% decomp
Plate production 12.7
End-of-life 0.063 2.67 -0.37
Total 12.7 2.67 10.1 -0.37 9.70 76%
Molded pulp plate (16.6 g), 0% decomp
Plate production 13.7
End-of-life 0.052 2.13 -0.30
Total 13.7 2.13 11.6 -0.30 11.3 82%
LIGHT-WEIGHT PLATES
2009 GPPS Foam Plate (4.7 g)
Plate production 5.22
End-of-life 0.094 1.48 -0.20
Total 5.32 1.48 3.83 -0.20 3.64 68%
2009 LDPE-coated plate (12.1 g), equiv strength, max decomp
Plate production 8.36
End-of-life 0.042 1.76 -0.54
Total 8.40 1.76 6.64 -0.54 6.10 73%
* Represents amount of energy of material resource that remains in landfilled materials. This is calculated as
the higher heating value of each material multiplied by the pounds landfilled (80% of the postconsumer material).
Source: Franklin Associates, A Division of ERG
Table 2-9. Net Energy Results for Average Weight Heavy Duty 9-inch Plates
(Million Btu per 10,000 plates)
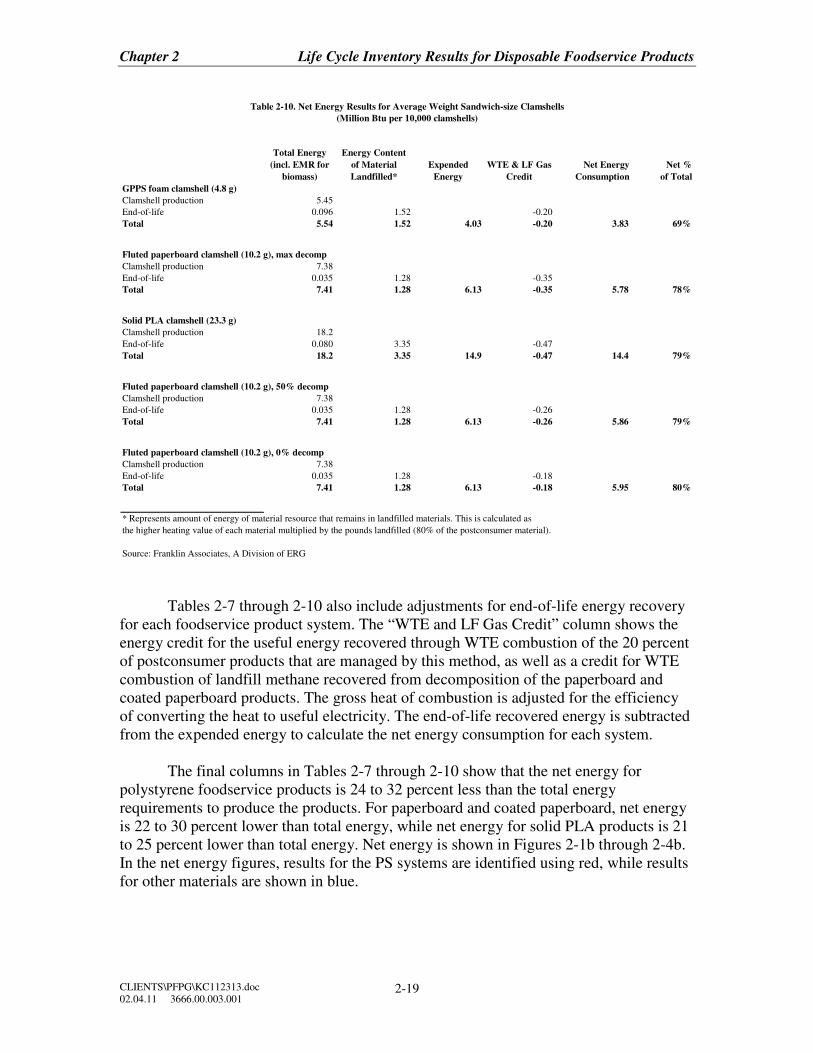
Chapter 2 Life Cycle Inventory Results for Disposable Foodservice Products
CLIENTS\PFPG\KC112313.doc
02.04.11 3666.00.003.001 2-19
Total Energy
(incl. EMR for
biomass)
Energy Content
of Material
Landfilled*
Expended
Energy
WTE & LF Gas
Credit
Net Energy
Consumption
Net %
of Total
GPPS foam clamshell (4.8 g)
Clamshell production 5.45
End-of-life 0.096 1.52 -0.20
Total 5.54 1.52 4.03 -0.20 3.83 69%
Fluted paperboard clamshell (10.2 g), max decomp
Clamshell production 7.38
End-of-life 0.035 1.28 -0.35
Total 7.41 1.28 6.13 -0.35 5.78 78%
Solid PLA clamshell (23.3 g)
Clamshell production 18.2
End-of-life 0.080 3.35 -0.47
Total 18.2 3.35 14.9 -0.47 14.4 79%
Fluted paperboard clamshell (10.2 g), 50% decomp
Clamshell production 7.38
End-of-life 0.035 1.28 -0.26
Total 7.41 1.28 6.13 -0.26 5.86 79%
Fluted paperboard clamshell (10.2 g), 0% decomp
Clamshell production 7.38
End-of-life 0.035 1.28 -0.18
Total 7.41 1.28 6.13 -0.18 5.95 80%
* Represents amount of energy of material resource that remains in landfilled materials. This is calculated as
the higher heating value of each material multiplied by the pounds landfilled (80% of the postconsumer material).
Source: Franklin Associates, A Division of ERG
Table 2-10. Net Energy Results for Average Weight Sandwich-size Clamshells
(Million Btu per 10,000 clamshells)
Tables 2-7 through 2-10 also include adjustments for end-of-life energy recovery
for each foodservice product system. The “WTE and LF Gas Credit” column shows the
energy credit for the useful energy recovered through WTE combustion of the 20 percent
of postconsumer products that are managed by this method, as well as a credit for WTE
combustion of landfill methane recovered from decomposition of the paperboard and
coated paperboard products. The gross heat of combustion is adjusted for the efficiency
of converting the heat to useful electricity. The end-of-life recovered energy is subtracted
from the expended energy to calculate the net energy consumption for each system.
The final columns in Tables 2-7 through 2-10 show that the net energy for
polystyrene foodservice products is 24 to 32 percent less than the total energy
requirements to produce the products. For paperboard and coated paperboard, net energy
is 22 to 30 percent lower than total energy, while net energy for solid PLA products is 21
to 25 percent lower than total energy. Net energy is shown in Figures 2-1b through 2-4b.
In the net energy figures, results for the PS systems are identified using red, while results
for other materials are shown in blue.
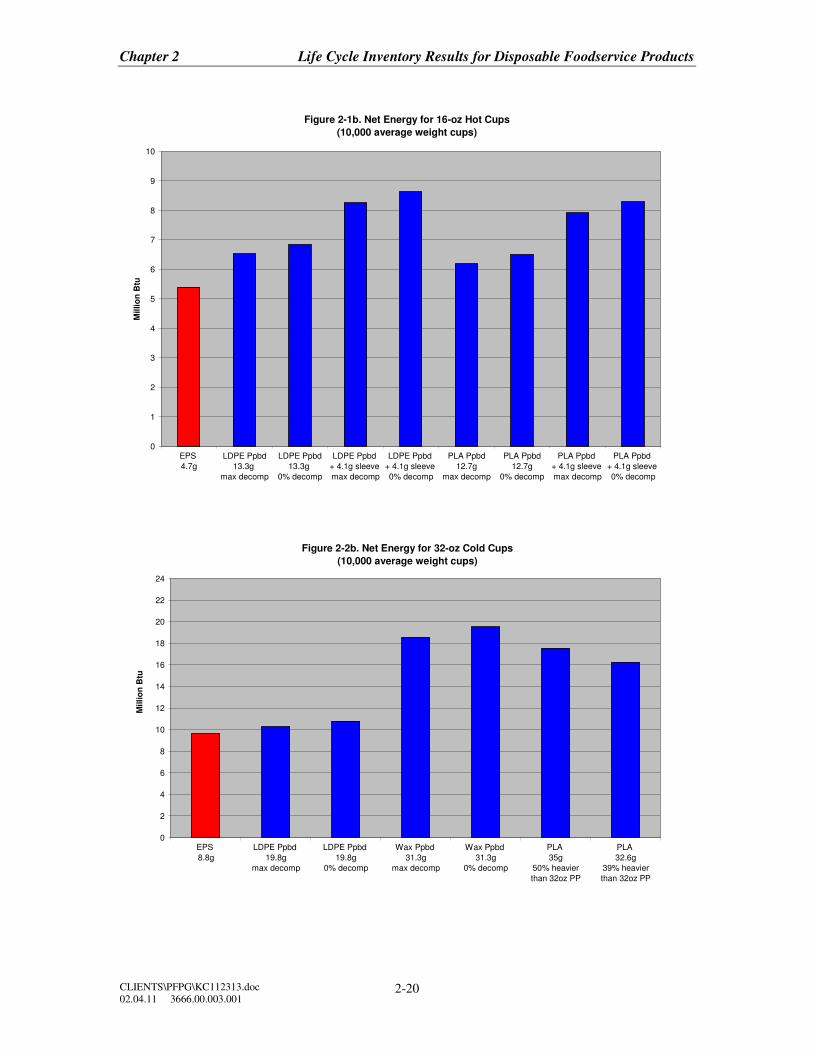
Chapter 2 Life Cycle Inventory Results for Disposable Foodservice Products
CLIENTS\PFPG\KC112313.doc
02.04.11 3666.00.003.001 2-20
Figure 2-1b. Net Energy for 16-oz Hot Cups
(10,000 average weight cups)
0
1
2
3
4
5
6
7
8
9
10
EPS
4.7g
LDPE Ppbd
13.3g
max decomp
LDPE Ppbd
13.3g
0% decomp
LDPE Ppbd
+ 4.1g sleeve
max decomp
LDPE Ppbd
+ 4.1g sleeve
0% decomp
PLA Ppbd
12.7g
max decomp
PLA Ppbd
12.7g
0% decomp
PLA Ppbd
+ 4.1g sleeve
max decomp
PLA Ppbd
+ 4.1g sleeve
0% decomp
Millio
n B
tu
Figure 2-2b. Net Energy for 32-oz Cold Cups
(10,000 average weight cups)
0
2
4
6
8
10
12
14
16
18
20
22
24
EPS
8.8g
LDPE Ppbd
19.8g
max decomp
LDPE Ppbd
19.8g
0% decomp
Wax Ppbd
31.3g
max decomp
Wax Ppbd
31.3g
0% decomp
PLA
35g
50% heavier
than 32oz PP
PLA
32.6g
39% heavier
than 32oz PP
Millio
n B
tu
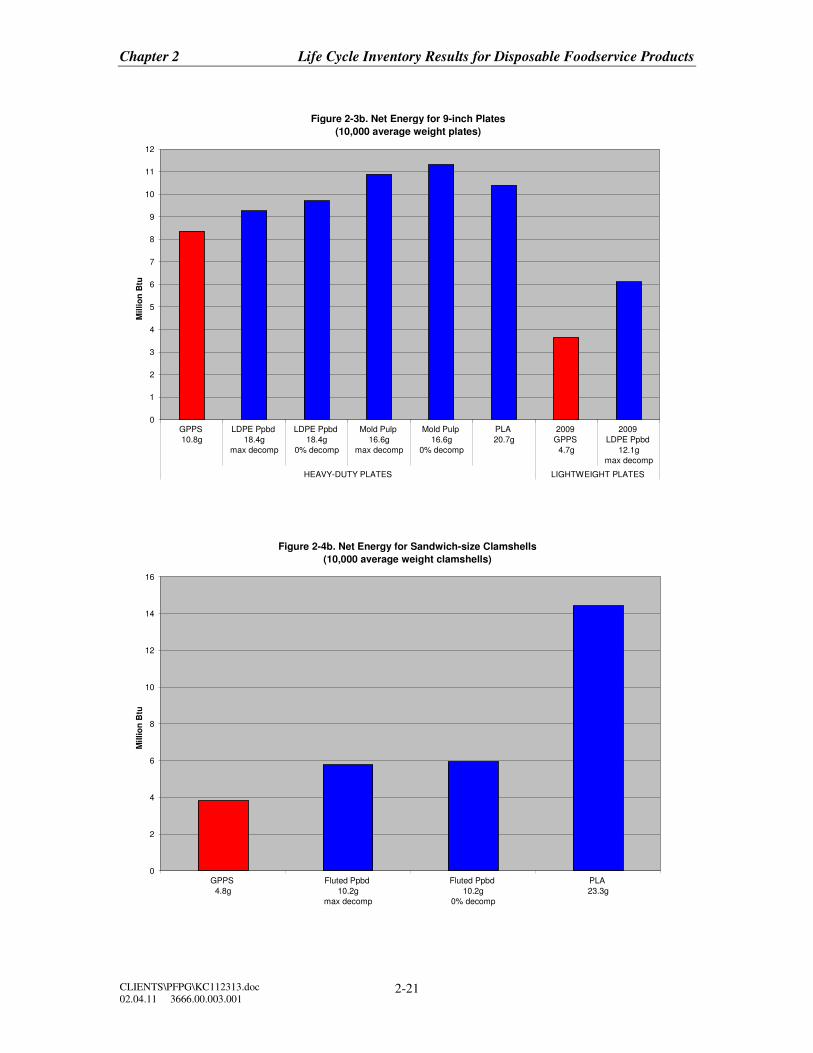
Chapter 2 Life Cycle Inventory Results for Disposable Foodservice Products
CLIENTS\PFPG\KC112313.doc
02.04.11 3666.00.003.001 2-21
Figure 2-3b. Net Energy for 9-inch Plates
(10,000 average weight plates)
0
1
2
3
4
5
6
7
8
9
10
11
12
GPPS
10.8g
LDPE Ppbd
18.4g
max decomp
LDPE Ppbd
18.4g
0% decomp
Mold Pulp
16.6g
max decomp
Mold Pulp
16.6g
0% decomp
PLA
20.7g
2009
GPPS
4.7g
2009
LDPE Ppbd
12.1g
max decomp
HEAVY-DUTY PLATES LIGHTWEIGHT PLATES
Millio
n B
tu
Figure 2-4b. Net Energy for Sandwich-size Clamshells
(10,000 average weight clamshells)
0
2
4
6
8
10
12
14
16
GPPS
4.8g
Fluted Ppbd
10.2g
max decomp
Fluted Ppbd
10.2g
0% decomp
PLA
23.3g
Millio
n B
tu
Chapter 2 Life Cycle Inventory Results for Disposable Foodservice Products
CLIENTS\PFPG\KC112313.doc
02.04.11 3666.00.003.001 2-22
Fossil and Non-Fossil Energy. Fossil fuels – natural gas, petroleum and coal –
are used for direct combustion as process and transportation fuels and also are used to
generate over 70 percent of the purchased electricity in the United States. Petroleum is
also the dominant energy source for transportation. The use of natural gas and petroleum
as raw material inputs for the production of plastics (reported as fossil EMR in Tables 2-2
through 2-5) is included in the totals for fossil energy shown in Tables 2-11 through 2-14.
The non-fossil energy shown in the tables includes process energy (e.g., wood-derived
energy at paper mills, use of hydropower, nuclear, and wind energy to produce grid
electricity) as well as the biomass EMR for paperboard and PLA products. Tables 2-11
through 2-14 do not include adjustment for the energy content remaining in the products
landfilled at end of life.
For the polystyrene systems, over 95 percent of total energy is fossil energy. This
includes not only the use of fossil fuels as process and transportation fuel but also the
EMR of the resin material. For paperboard product systems, fossil energy accounts for a
much lower share of total energy, about 28 to 37 percent of the total. In addition to the
biomass EMR in the paper products, virgin paper mills utilize wood wastes as a fuel
source, reducing their use of fossil fuels. For solid PLA products, 56 to 63 percent of total
energy is fossil energy. Although the EMR for PLA is from biomass, process energy for
PLA products is derived mainly from fossil fuels.
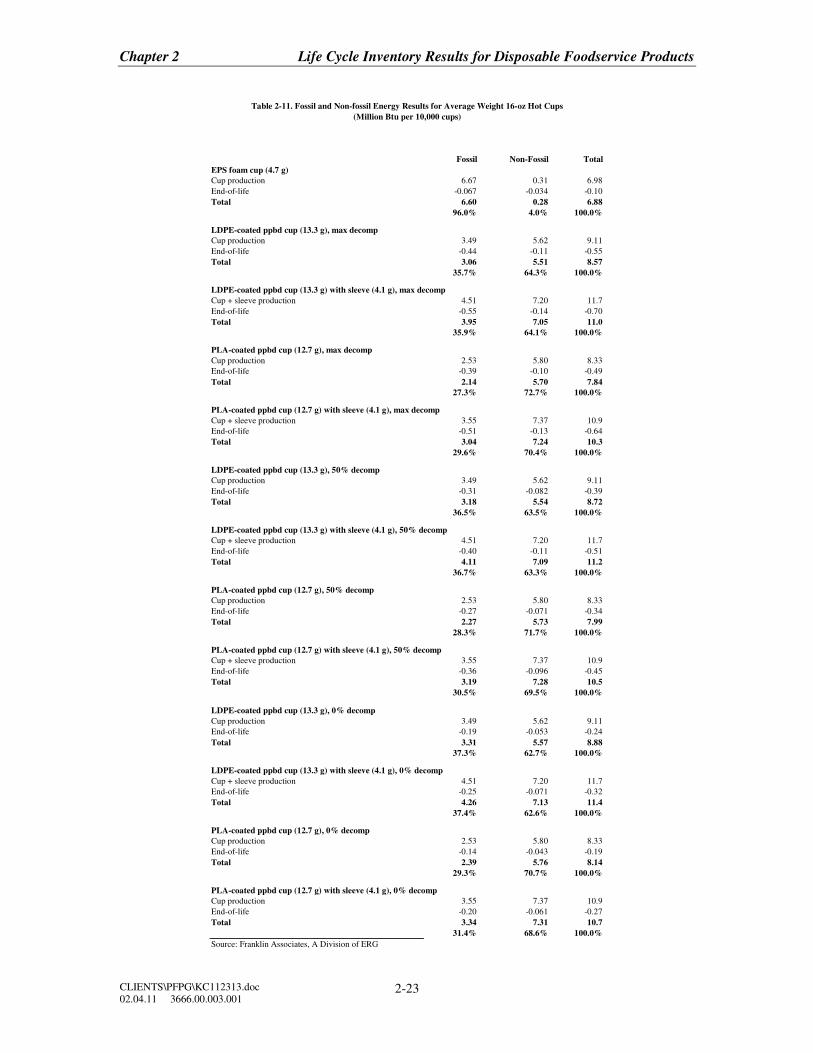
Chapter 2 Life Cycle Inventory Results for Disposable Foodservice Products
CLIENTS\PFPG\KC112313.doc
02.04.11 3666.00.003.001 2-23
Fossil Non-Fossil Total
EPS foam cup (4.7 g)
Cup production 6.67 0.31 6.98
End-of-life -0.067 -0.034 -0.10
Total 6.60 0.28 6.88
96.0% 4.0% 100.0%
LDPE-coated ppbd cup (13.3 g), max decomp
Cup production 3.49 5.62 9.11
End-of-life -0.44 -0.11 -0.55
Total 3.06 5.51 8.57
35.7% 64.3% 100.0%
LDPE-coated ppbd cup (13.3 g) with sleeve (4.1 g), max decomp
Cup + sleeve production 4.51 7.20 11.7
End-of-life -0.55 -0.14 -0.70
Total 3.95 7.05 11.0
35.9% 64.1% 100.0%
PLA-coated ppbd cup (12.7 g), max decomp
Cup production 2.53 5.80 8.33
End-of-life -0.39 -0.10 -0.49
Total 2.14 5.70 7.84
27.3% 72.7% 100.0%
PLA-coated ppbd cup (12.7 g) with sleeve (4.1 g), max decomp
Cup + sleeve production 3.55 7.37 10.9
End-of-life -0.51 -0.13 -0.64
Total 3.04 7.24 10.3
29.6% 70.4% 100.0%
LDPE-coated ppbd cup (13.3 g), 50% decomp
Cup production 3.49 5.62 9.11
End-of-life -0.31 -0.082 -0.39
Total 3.18 5.54 8.72
36.5% 63.5% 100.0%
LDPE-coated ppbd cup (13.3 g) with sleeve (4.1 g), 50% decomp
Cup + sleeve production 4.51 7.20 11.7
End-of-life -0.40 -0.11 -0.51
Total 4.11 7.09 11.2
36.7% 63.3% 100.0%
PLA-coated ppbd cup (12.7 g), 50% decomp
Cup production 2.53 5.80 8.33
End-of-life -0.27 -0.071 -0.34
Total 2.27 5.73 7.99
28.3% 71.7% 100.0%
PLA-coated ppbd cup (12.7 g) with sleeve (4.1 g), 50% decomp
Cup + sleeve production 3.55 7.37 10.9
End-of-life -0.36 -0.096 -0.45
Total 3.19 7.28 10.5
30.5% 69.5% 100.0%
LDPE-coated ppbd cup (13.3 g), 0% decomp
Cup production 3.49 5.62 9.11
End-of-life -0.19 -0.053 -0.24
Total 3.31 5.57 8.88
37.3% 62.7% 100.0%
LDPE-coated ppbd cup (13.3 g) with sleeve (4.1 g), 0% decomp
Cup + sleeve production 4.51 7.20 11.7
End-of-life -0.25 -0.071 -0.32
Total 4.26 7.13 11.4
37.4% 62.6% 100.0%
PLA-coated ppbd cup (12.7 g), 0% decomp
Cup production 2.53 5.80 8.33
End-of-life -0.14 -0.043 -0.19
Total 2.39 5.76 8.14
29.3% 70.7% 100.0%
PLA-coated ppbd cup (12.7 g) with sleeve (4.1 g), 0% decomp
Cup production 3.55 7.37 10.9
End-of-life -0.20 -0.061 -0.27
Total 3.34 7.31 10.7
31.4% 68.6% 100.0%
Source: Franklin Associates, A Division of ERG
(Million Btu per 10,000 cups)
Table 2-11. Fossil and Non-fossil Energy Results for Average Weight 16-oz Hot Cups
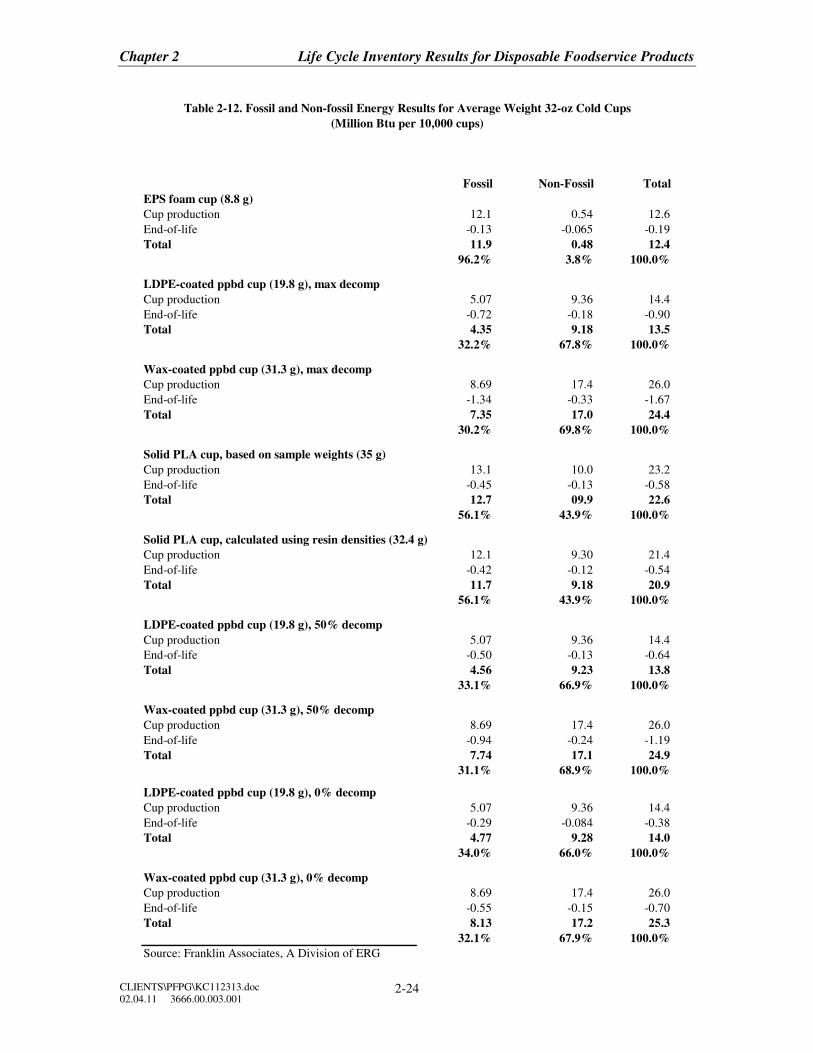
Chapter 2 Life Cycle Inventory Results for Disposable Foodservice Products
CLIENTS\PFPG\KC112313.doc
02.04.11 3666.00.003.001 2-24
Fossil Non-Fossil Total
EPS foam cup (8.8 g)
Cup production 12.1 0.54 12.6
End-of-life -0.13 -0.065 -0.19
Total 11.9 0.48 12.4
96.2% 3.8% 100.0%
LDPE-coated ppbd cup (19.8 g), max decomp
Cup production 5.07 9.36 14.4
End-of-life -0.72 -0.18 -0.90
Total 4.35 9.18 13.5
32.2% 67.8% 100.0%
Wax-coated ppbd cup (31.3 g), max decomp
Cup production 8.69 17.4 26.0
End-of-life -1.34 -0.33 -1.67
Total 7.35 17.0 24.4
30.2% 69.8% 100.0%
Solid PLA cup, based on sample weights (35 g)
Cup production 13.1 10.0 23.2
End-of-life -0.45 -0.13 -0.58
Total 12.7 09.9 22.6
56.1% 43.9% 100.0%
Solid PLA cup, calculated using resin densities (32.4 g)
Cup production 12.1 9.30 21.4
End-of-life -0.42 -0.12 -0.54
Total 11.7 9.18 20.9
56.1% 43.9% 100.0%
LDPE-coated ppbd cup (19.8 g), 50% decomp
Cup production 5.07 9.36 14.4
End-of-life -0.50 -0.13 -0.64
Total 4.56 9.23 13.8
33.1% 66.9% 100.0%
Wax-coated ppbd cup (31.3 g), 50% decomp
Cup production 8.69 17.4 26.0
End-of-life -0.94 -0.24 -1.19
Total 7.74 17.1 24.9
31.1% 68.9% 100.0%
LDPE-coated ppbd cup (19.8 g), 0% decomp
Cup production 5.07 9.36 14.4
End-of-life -0.29 -0.084 -0.38
Total 4.77 9.28 14.0
34.0% 66.0% 100.0%
Wax-coated ppbd cup (31.3 g), 0% decomp
Cup production 8.69 17.4 26.0
End-of-life -0.55 -0.15 -0.70
Total 8.13 17.2 25.3
32.1% 67.9% 100.0%
Source: Franklin Associates, A Division of ERG
(Million Btu per 10,000 cups)
Table 2-12. Fossil and Non-fossil Energy Results for Average Weight 32-oz Cold Cups
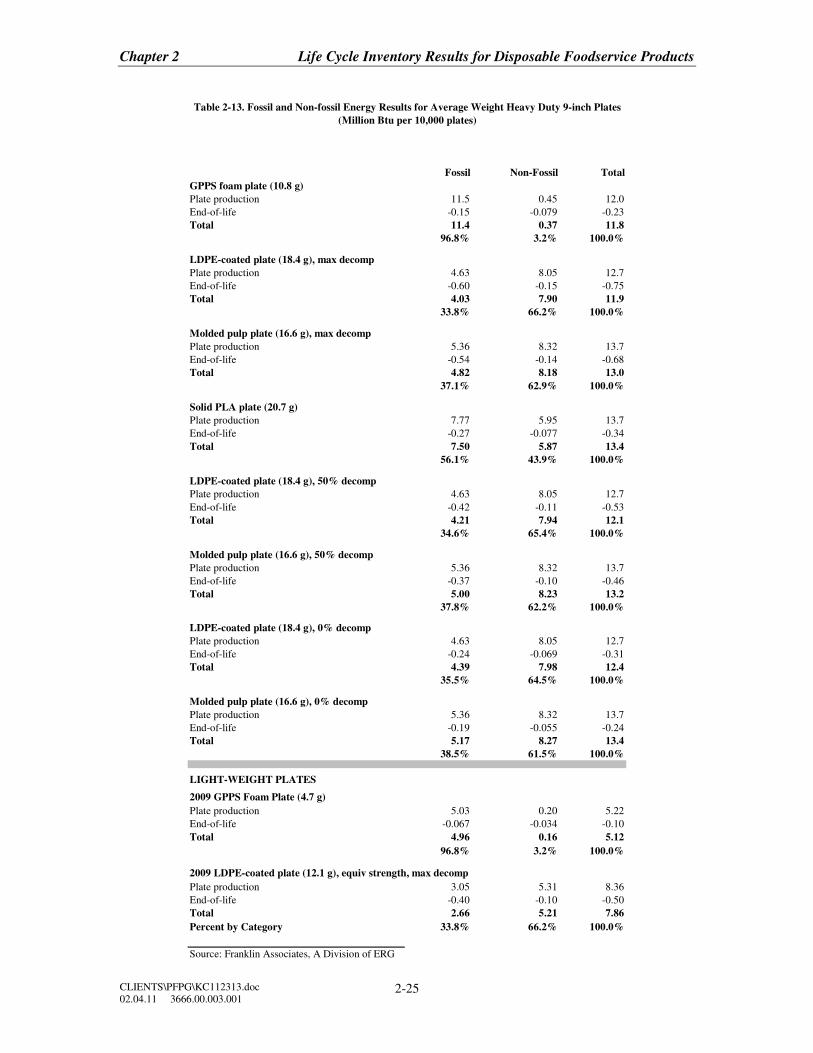
Chapter 2 Life Cycle Inventory Results for Disposable Foodservice Products
CLIENTS\PFPG\KC112313.doc
02.04.11 3666.00.003.001 2-25
Fossil Non-Fossil Total
GPPS foam plate (10.8 g)
Plate production 11.5 0.45 12.0
End-of-life -0.15 -0.079 -0.23
Total 11.4 0.37 11.8
96.8% 3.2% 100.0%
LDPE-coated plate (18.4 g), max decomp
Plate production 4.63 8.05 12.7
End-of-life -0.60 -0.15 -0.75
Total 4.03 7.90 11.9
33.8% 66.2% 100.0%
Molded pulp plate (16.6 g), max decomp
Plate production 5.36 8.32 13.7
End-of-life -0.54 -0.14 -0.68
Total 4.82 8.18 13.0
37.1% 62.9% 100.0%
Solid PLA plate (20.7 g)
Plate production 7.77 5.95 13.7
End-of-life -0.27 -0.077 -0.34
Total 7.50 5.87 13.4
56.1% 43.9% 100.0%
LDPE-coated plate (18.4 g), 50% decomp
Plate production 4.63 8.05 12.7
End-of-life -0.42 -0.11 -0.53
Total 4.21 7.94 12.1
34.6% 65.4% 100.0%
Molded pulp plate (16.6 g), 50% decomp
Plate production 5.36 8.32 13.7
End-of-life -0.37 -0.10 -0.46
Total 5.00 8.23 13.2
37.8% 62.2% 100.0%
LDPE-coated plate (18.4 g), 0% decomp
Plate production 4.63 8.05 12.7
End-of-life -0.24 -0.069 -0.31
Total 4.39 7.98 12.4
35.5% 64.5% 100.0%
Molded pulp plate (16.6 g), 0% decomp
Plate production 5.36 8.32 13.7
End-of-life -0.19 -0.055 -0.24
Total 5.17 8.27 13.4
38.5% 61.5% 100.0%
LIGHT-WEIGHT PLATES
2009 GPPS Foam Plate (4.7 g)
Plate production 5.03 0.20 5.22
End-of-life -0.067 -0.034 -0.10
Total 4.96 0.16 5.12
96.8% 3.2% 100.0%
2009 LDPE-coated plate (12.1 g), equiv strength, max decomp
Plate production 3.05 5.31 8.36
End-of-life -0.40 -0.10 -0.50
Total 2.66 5.21 7.86
Percent by Category 33.8% 66.2% 100.0%
Source: Franklin Associates, A Division of ERG
(Million Btu per 10,000 plates)
Table 2-13. Fossil and Non-fossil Energy Results for Average Weight Heavy Duty 9-inch Plates
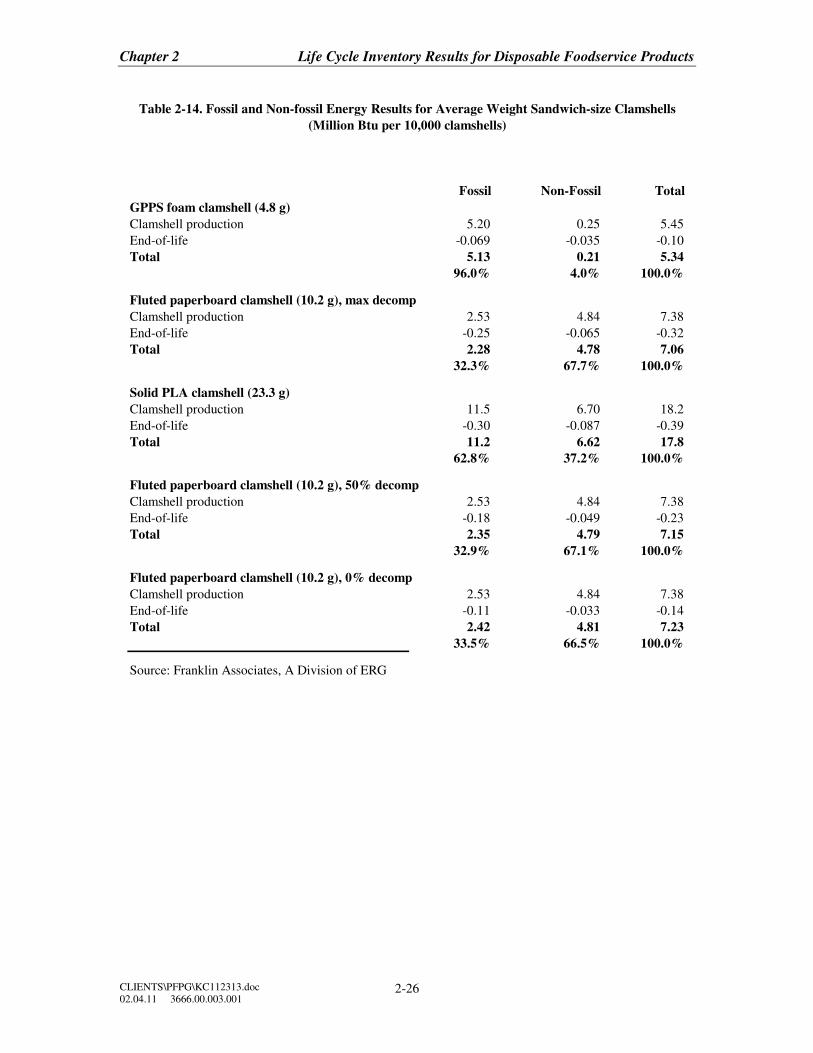
Chapter 2 Life Cycle Inventory Results for Disposable Foodservice Products
CLIENTS\PFPG\KC112313.doc
02.04.11 3666.00.003.001 2-26
Fossil Non-Fossil Total
GPPS foam clamshell (4.8 g)
Clamshell production 5.20 0.25 5.45
End-of-life -0.069 -0.035 -0.10
Total 5.13 0.21 5.34
96.0% 4.0% 100.0%
Fluted paperboard clamshell (10.2 g), max decomp
Clamshell production 2.53 4.84 7.38
End-of-life -0.25 -0.065 -0.32
Total 2.28 4.78 7.06
32.3% 67.7% 100.0%
Solid PLA clamshell (23.3 g)
Clamshell production 11.5 6.70 18.2
End-of-life -0.30 -0.087 -0.39
Total 11.2 6.62 17.8
62.8% 37.2% 100.0%
Fluted paperboard clamshell (10.2 g), 50% decomp
Clamshell production 2.53 4.84 7.38
End-of-life -0.18 -0.049 -0.23
Total 2.35 4.79 7.15
32.9% 67.1% 100.0%
Fluted paperboard clamshell (10.2 g), 0% decomp
Clamshell production 2.53 4.84 7.38
End-of-life -0.11 -0.033 -0.14
Total 2.42 4.81 7.23
33.5% 66.5% 100.0%
Source: Franklin Associates, A Division of ERG
(Million Btu per 10,000 clamshells)
Table 2-14. Fossil and Non-fossil Energy Results for Average Weight Sandwich-size Clamshells
Chapter 2 Life Cycle Inventory Results for Disposable Foodservice Products
CLIENTS\PFPG\KC112313.doc
02.04.11 3666.00.003.001 2-27
Solid Waste
Based on the uncertainty in solid waste data, differences in solid waste weight
results between systems are not considered meaningful unless the percent difference is
greater than 25 percent for process and fuel-related wastes, or greater than 10 percent for
postconsumer wastes. (Percent difference between systems is defined as the difference
between solid waste totals divided by the average of the two system totals.) This
minimum percent difference criterion was developed based on the experience and
professional judgment of the analysts. The landfill density factors used to convert solid
waste weights to volume are more uncertain, so a minimum 25 percent difference is
required to consider solid waste volume results significantly different.
Solid waste is broadly categorized into process wastes, fuel-related wastes, and
postconsumer wastes. Process wastes are the solid wastes generated by the various
processes from raw material acquisition through fabrication of foodservice products,
including any unrecycled fabrication scrap. Fuel-related wastes are the wastes from the
production and combustion of fuels used for process energy and transportation energy.
Postconsumer wastes are the products that are landfilled at end of life. This category
also includes any ash resulting from waste-to-energy combustion of 20 percent of
foodservice items.
Weight of Solid Waste. Solid waste results by weight are shown in Tables 2-15
through 2-18. The tables show the quantity of solid waste by type as well as the
contributions of production and end-of-life management to the total. Figures 2-5 through
2-8 show the weight of solid wastes for each product system by category.
Postconsumer products account for the largest share of the weight of solid waste
for all systems, from 63 to 79 percent of the total weight of solid waste. Since the
majority of the solid waste for each system is postconsumer product, and the average
weight polystyrene foam products are lighter than the coated paperboard and solid PLA
products analyzed, the PS foam products have a lower total weight of solid waste
compared to the alternative products.
The remainder of the solid waste is process and fuel-related wastes from
production of the foodservice items. Fuel-related solid waste ranges from 16 to 26
percent of total solid waste for polystyrene foam systems and 22 to 27 percent of the total
for solid PLA products. For paperboard product systems, fuel-related solid wastes make
up 15 to 25 percent of the total solid waste. Paperboard products have the highest
percentage of process solid waste, ranging from 8 to 13 percent of the total weight of
solid waste. Process solid wastes are about 4 percent of total solid waste for the
polystyrene systems and less than 1 percent for solid PLA products.

Chapter 2 Life Cycle Inventory Results for Disposable Foodservice Products
CLIENTS\PFPG\KC112313.doc
02.04.11 3666.00.003.001 2-28
Process Fuel
Postconsumer
(LF + WTE ash) Total
Percent
by Stage
EPS foam cup (4.7 g)
Cup production 4.58 33.6 0 38.2 32.6%
End-of-life 0 -3.73 82.8 79.1 67.4%
Total 4.58 29.9 82.8 117
Percent by Category 3.9% 25.5% 70.6% 100.0% 100.0%
LDPE-coated ppbd cup (13.3 g), max decomp
Cup production 42.7 68.5 0 111 33.1%
End-of-life 0 -10.9 235 224 66.9%
Total 42.7 57.6 235 336
Percent by Category 12.7% 17.2% 70.1% 100.0% 100.0%
LDPE-coated ppbd cup (13.3 g) with sleeve (4.1 g), max decomp
Cup + sleeve production 55.6 92.5 0 148 31.4%
End-of-life 0 -13.9 338 324 68.6%
Total 55.6 78.6 338 472
Percent by Category 11.8% 16.6% 71.6% 100.0% 100.0%
PLA-coated ppbd cup (12.7 g), max decomp
Cup production 40.9 69.1 0 110.0 33.9%
End-of-life 0 -9.75 225 215 66.1%
Total 40.9 59.4 225 325
Percent by Category 12.6% 18.3% 69.1% 100.0% 100.0%
PLA-coated ppbd cup (12.7 g) with sleeve (4.1 g), max decomp
Cup + sleeve production 53.7 93.2 0 147 31.8%
End-of-life 0 -12.8 327 315 68.2%
Total 53.7 80.4 327 461
Percent by Category 11.6% 17.4% 70.9% 100.0% 100.0%
LDPE-coated ppbd cup (13.3 g), 50% decomp
Cup production 42.7 68.5 0 111 32.9%
End-of-life 0 -8.00 235 227 67.1%
Total 42.7 60.5 235 338
Percent by Category 12.6% 17.9% 69.5% 100.0% 100.0%
LDPE-coated ppbd cup (13.3 g) with sleeve (4.1 g), 50% decomp
Cup + sleeve production 55.6 92.5 0 148 31.1%
End-of-life 0 -10.4 338 327 68.9%
Total 55.6 82.1 338 476
Percent by Category 11.7% 17.3% 71.1% 100.0% 100.0%
PLA-coated ppbd cup (12.7 g), 50% decomp
Cup production 40.9 69.1 0 110.0 33.6%
End-of-life 0 -6.95 225 218 66.4%
Total 40.9 62.2 225 328
Percent by Category 12.5% 19.0% 68.6% 100.0% 100.0%
PLA-coated ppbd cup (12.7 g) with sleeve (4.1 g), 50% decomp
Cup + sleeve production 53.7 93.2 0 147 31.6%
End-of-life 0 -9.38 327 318 68.4%
Total 53.7 83.8 327 465
Percent by Category 11.6% 18.0% 70.4% 100.0% 100.0%
LDPE-coated ppbd cup (13.3 g), 0% decomp
Cup production 42.7 68.5 0 111 32.6%
End-of-life 0 -5.14 235 230 67.4%
Total 42.7 63.3 235 341
Percent by Category 12.5% 18.6% 68.9% 100.0% 100.0%
LDPE-coated ppbd cup (13.3 g) with sleeve (4.1 g), 0% decomp
Cup + sleeve production 55.6 92.5 0 148 30.9%
End-of-life 0 -6.94 338 331 69.1%
Total 55.6 85.6 338 479
Percent by Category 11.6% 17.9% 70.5% 100.0% 100.0%
PLA-coated ppbd cup (12.7 g), 0% decomp
Cup production 40.9 69.1 0 110.0 33.3%
End-of-life 0 -4.14 225 221 66.7%
Total 40.9 65.0 225 331
Percent by Category 12.4% 19.7% 68.0% 100.0% 100.0%
PLA-coated ppbd cup (12.7 g) with sleeve (4.1 g), 0% decomp
Cup production 53.7 93.2 0 147 31.4%
End-of-life 0 -5.94 327 321 68.6%
Total 53.7 87.3 327 468
Percent by Category 11.5% 18.6% 69.9% 100.0% 100.0%
Source: Franklin Associates, A Division of ERG
(Pounds per 10,000 cups)
Table 2-15. Solid Waste by Weight for Average Weight 16-oz Hot Cups
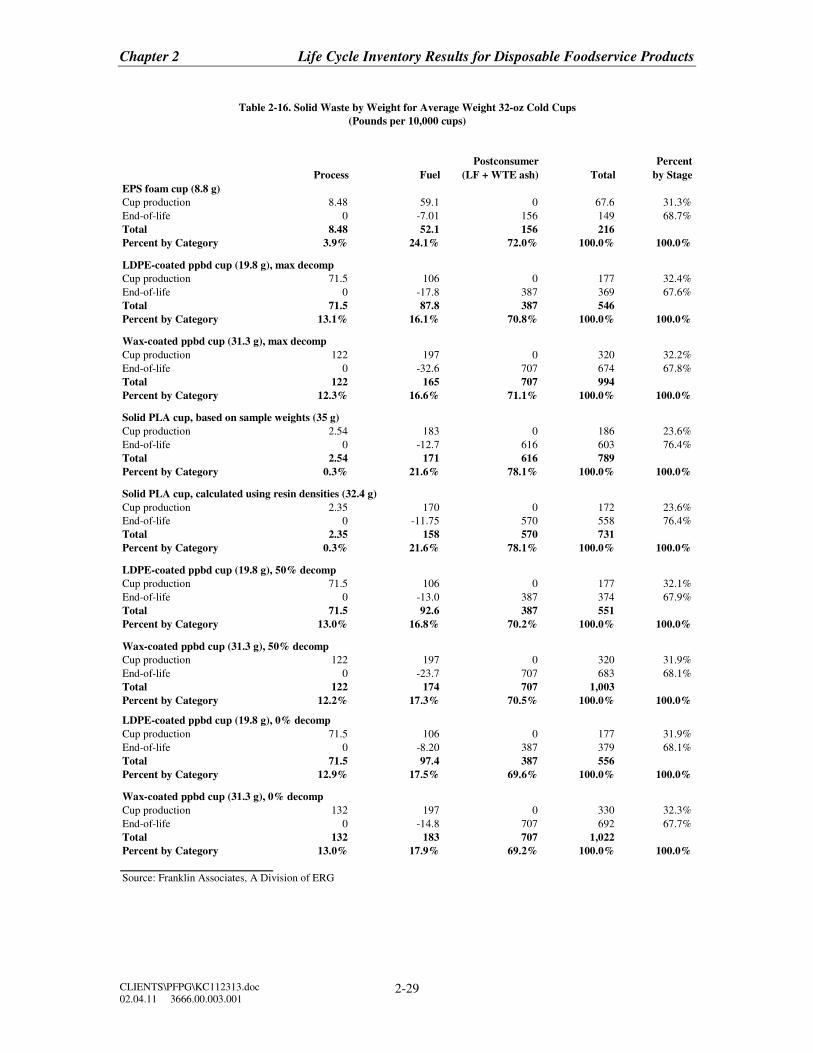
Chapter 2 Life Cycle Inventory Results for Disposable Foodservice Products
CLIENTS\PFPG\KC112313.doc
02.04.11 3666.00.003.001 2-29
Process Fuel
Postconsumer
(LF + WTE ash) Total
Percent
by Stage
EPS foam cup (8.8 g)
Cup production 8.48 59.1 0 67.6 31.3%
End-of-life 0 -7.01 156 149 68.7%
Total 8.48 52.1 156 216
Percent by Category 3.9% 24.1% 72.0% 100.0% 100.0%
LDPE-coated ppbd cup (19.8 g), max decomp
Cup production 71.5 106 0 177 32.4%
End-of-life 0 -17.8 387 369 67.6%
Total 71.5 87.8 387 546
Percent by Category 13.1% 16.1% 70.8% 100.0% 100.0%
Wax-coated ppbd cup (31.3 g), max decomp
Cup production 122 197 0 320 32.2%
End-of-life 0 -32.6 707 674 67.8%
Total 122 165 707 994
Percent by Category 12.3% 16.6% 71.1% 100.0% 100.0%
Solid PLA cup, based on sample weights (35 g)
Cup production 2.54 183 0 186 23.6%
End-of-life 0 -12.7 616 603 76.4%
Total 2.54 171 616 789
Percent by Category 0.3% 21.6% 78.1% 100.0% 100.0%
Solid PLA cup, calculated using resin densities (32.4 g)
Cup production 2.35 170 0 172 23.6%
End-of-life 0 -11.75 570 558 76.4%
Total 2.35 158 570 731
Percent by Category 0.3% 21.6% 78.1% 100.0% 100.0%
LDPE-coated ppbd cup (19.8 g), 50% decomp
Cup production 71.5 106 0 177 32.1%
End-of-life 0 -13.0 387 374 67.9%
Total 71.5 92.6 387 551
Percent by Category 13.0% 16.8% 70.2% 100.0% 100.0%
Wax-coated ppbd cup (31.3 g), 50% decomp
Cup production 122 197 0 320 31.9%
End-of-life 0 -23.7 707 683 68.1%
Total 122 174 707 1,003
Percent by Category 12.2% 17.3% 70.5% 100.0% 100.0%
LDPE-coated ppbd cup (19.8 g), 0% decomp
Cup production 71.5 106 0 177 31.9%
End-of-life 0 -8.20 387 379 68.1%
Total 71.5 97.4 387 556
Percent by Category 12.9% 17.5% 69.6% 100.0% 100.0%
Wax-coated ppbd cup (31.3 g), 0% decomp
Cup production 132 197 0 330 32.3%
End-of-life 0 -14.8 707 692 67.7%
Total 132 183 707 1,022
Percent by Category 13.0% 17.9% 69.2% 100.0% 100.0%
Source: Franklin Associates, A Division of ERG
(Pounds per 10,000 cups)
Table 2-16. Solid Waste by Weight for Average Weight 32-oz Cold Cups
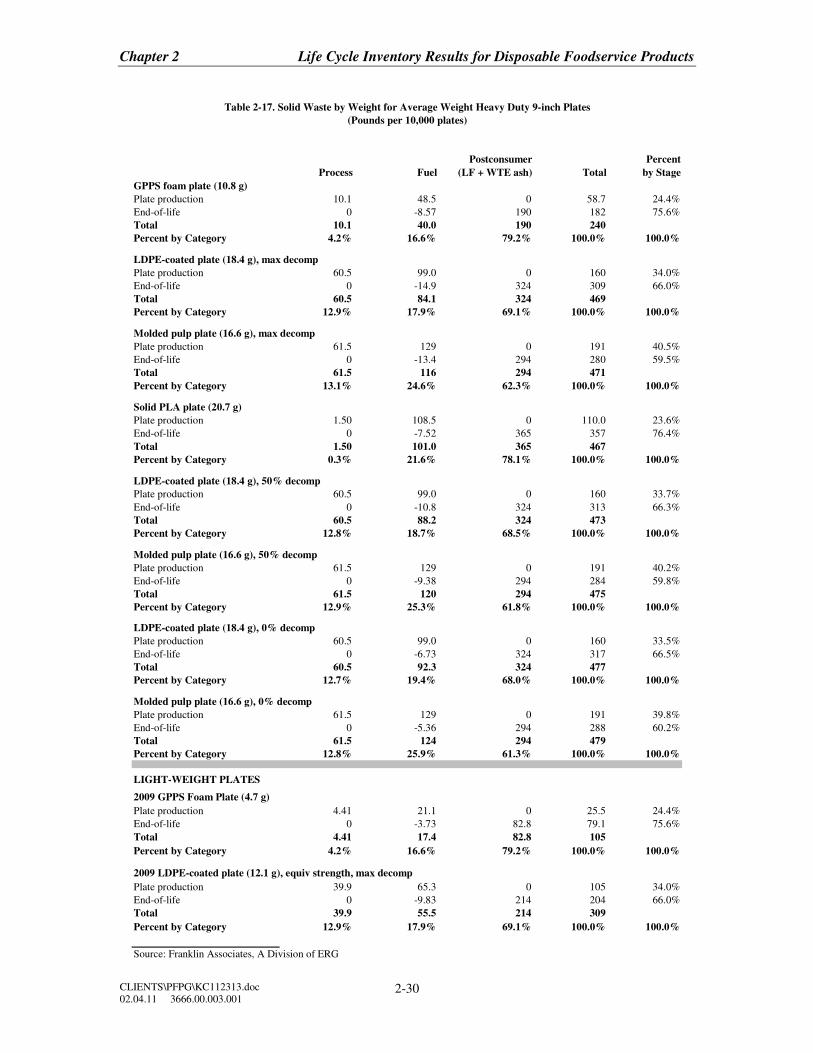
Chapter 2 Life Cycle Inventory Results for Disposable Foodservice Products
CLIENTS\PFPG\KC112313.doc
02.04.11 3666.00.003.001 2-30
Process Fuel
Postconsumer
(LF + WTE ash) Total
Percent
by Stage
GPPS foam plate (10.8 g)
Plate production 10.1 48.5 0 58.7 24.4%
End-of-life 0 -8.57 190 182 75.6%
Total 10.1 40.0 190 240
Percent by Category 4.2% 16.6% 79.2% 100.0% 100.0%
LDPE-coated plate (18.4 g), max decomp
Plate production 60.5 99.0 0 160 34.0%
End-of-life 0 -14.9 324 309 66.0%
Total 60.5 84.1 324 469
Percent by Category 12.9% 17.9% 69.1% 100.0% 100.0%
Molded pulp plate (16.6 g), max decomp
Plate production 61.5 129 0 191 40.5%
End-of-life 0 -13.4 294 280 59.5%
Total 61.5 116 294 471
Percent by Category 13.1% 24.6% 62.3% 100.0% 100.0%
Solid PLA plate (20.7 g)
Plate production 1.50 108.5 0 110.0 23.6%
End-of-life 0 -7.52 365 357 76.4%
Total 1.50 101.0 365 467
Percent by Category 0.3% 21.6% 78.1% 100.0% 100.0%
LDPE-coated plate (18.4 g), 50% decomp
Plate production 60.5 99.0 0 160 33.7%
End-of-life 0 -10.8 324 313 66.3%
Total 60.5 88.2 324 473
Percent by Category 12.8% 18.7% 68.5% 100.0% 100.0%
Molded pulp plate (16.6 g), 50% decomp
Plate production 61.5 129 0 191 40.2%
End-of-life 0 -9.38 294 284 59.8%
Total 61.5 120 294 475
Percent by Category 12.9% 25.3% 61.8% 100.0% 100.0%
LDPE-coated plate (18.4 g), 0% decomp
Plate production 60.5 99.0 0 160 33.5%
End-of-life 0 -6.73 324 317 66.5%
Total 60.5 92.3 324 477
Percent by Category 12.7% 19.4% 68.0% 100.0% 100.0%
Molded pulp plate (16.6 g), 0% decomp
Plate production 61.5 129 0 191 39.8%
End-of-life 0 -5.36 294 288 60.2%
Total 61.5 124 294 479
Percent by Category 12.8% 25.9% 61.3% 100.0% 100.0%
LIGHT-WEIGHT PLATES
2009 GPPS Foam Plate (4.7 g)
Plate production 4.41 21.1 0 25.5 24.4%
End-of-life 0 -3.73 82.8 79.1 75.6%
Total 4.41 17.4 82.8 105
Percent by Category 4.2% 16.6% 79.2% 100.0% 100.0%
2009 LDPE-coated plate (12.1 g), equiv strength, max decomp
Plate production 39.9 65.3 0 105 34.0%
End-of-life 0 -9.83 214 204 66.0%
Total 39.9 55.5 214 309
Percent by Category 12.9% 17.9% 69.1% 100.0% 100.0%
Source: Franklin Associates, A Division of ERG
(Pounds per 10,000 plates)
Table 2-17. Solid Waste by Weight for Average Weight Heavy Duty 9-inch Plates
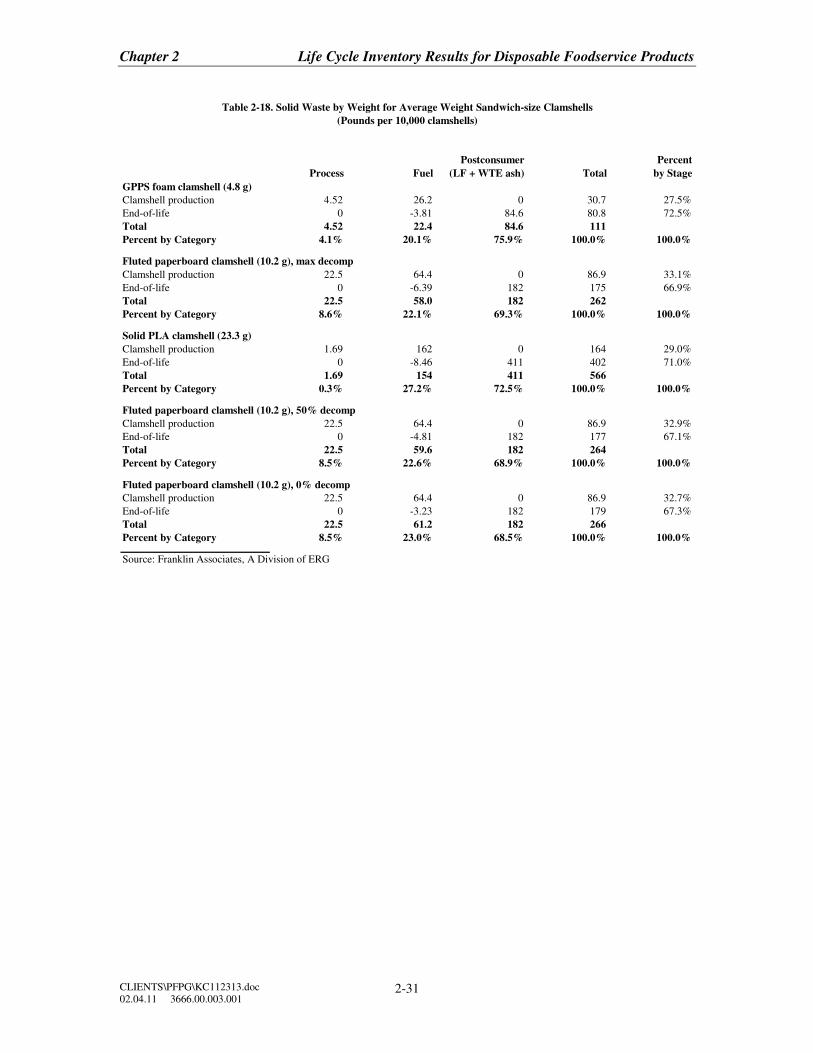
Chapter 2 Life Cycle Inventory Results for Disposable Foodservice Products
CLIENTS\PFPG\KC112313.doc
02.04.11 3666.00.003.001 2-31
Process Fuel
Postconsumer
(LF + WTE ash) Total
Percent
by Stage
GPPS foam clamshell (4.8 g)
Clamshell production 4.52 26.2 0 30.7 27.5%
End-of-life 0 -3.81 84.6 80.8 72.5%
Total 4.52 22.4 84.6 111
Percent by Category 4.1% 20.1% 75.9% 100.0% 100.0%
Fluted paperboard clamshell (10.2 g), max decomp
Clamshell production 22.5 64.4 0 86.9 33.1%
End-of-life 0 -6.39 182 175 66.9%
Total 22.5 58.0 182 262
Percent by Category 8.6% 22.1% 69.3% 100.0% 100.0%
Solid PLA clamshell (23.3 g)
Clamshell production 1.69 162 0 164 29.0%
End-of-life 0 -8.46 411 402 71.0%
Total 1.69 154 411 566
Percent by Category 0.3% 27.2% 72.5% 100.0% 100.0%
Fluted paperboard clamshell (10.2 g), 50% decomp
Clamshell production 22.5 64.4 0 86.9 32.9%
End-of-life 0 -4.81 182 177 67.1%
Total 22.5 59.6 182 264
Percent by Category 8.5% 22.6% 68.9% 100.0% 100.0%
Fluted paperboard clamshell (10.2 g), 0% decomp
Clamshell production 22.5 64.4 0 86.9 32.7%
End-of-life 0 -3.23 182 179 67.3%
Total 22.5 61.2 182 266
Percent by Category 8.5% 23.0% 68.5% 100.0% 100.0%
Source: Franklin Associates, A Division of ERG
(Pounds per 10,000 clamshells)
Table 2-18. Solid Waste by Weight for Average Weight Sandwich-size Clamshells
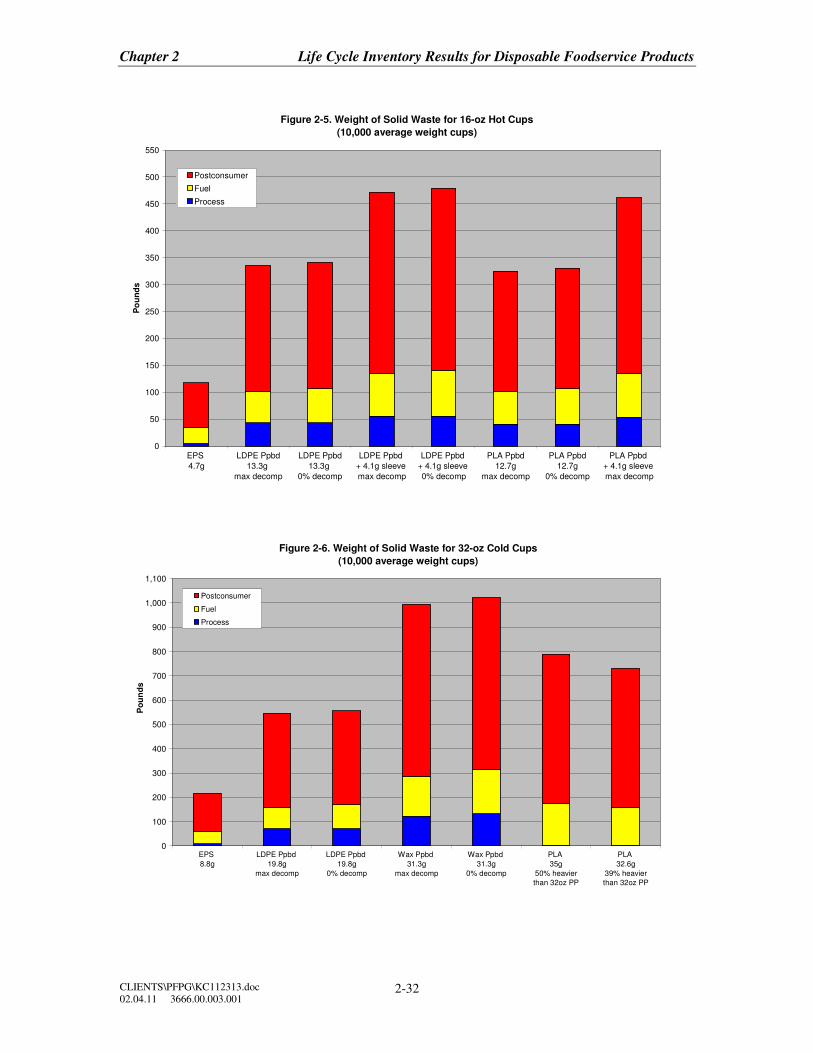
Chapter 2 Life Cycle Inventory Results for Disposable Foodservice Products
CLIENTS\PFPG\KC112313.doc
02.04.11 3666.00.003.001 2-32
Figure 2-5. Weight of Solid Waste for 16-oz Hot Cups
(10,000 average weight cups)
0
50
100
150
200
250
300
350
400
450
500
550
EPS
4.7g
LDPE Ppbd
13.3g
max decomp
LDPE Ppbd
13.3g
0% decomp
LDPE Ppbd
+ 4.1g sleeve
max decomp
LDPE Ppbd
+ 4.1g sleeve
0% decomp
PLA Ppbd
12.7g
max decomp
PLA Ppbd
12.7g
0% decomp
PLA Ppbd
+ 4.1g sleeve
max decomp
Po
un
ds
Postconsumer
Fuel
Process
Figure 2-6. Weight of Solid Waste for 32-oz Cold Cups
(10,000 average weight cups)
0
100
200
300
400
500
600
700
800
900
1,000
1,100
EPS
8.8g
LDPE Ppbd
19.8g
max decomp
LDPE Ppbd
19.8g
0% decomp
Wax Ppbd
31.3g
max decomp
Wax Ppbd
31.3g
0% decomp
PLA
35g
50% heavier
than 32oz PP
PLA
32.6g
39% heavier
than 32oz PP
Po
un
ds
Postconsumer
Fuel
Process
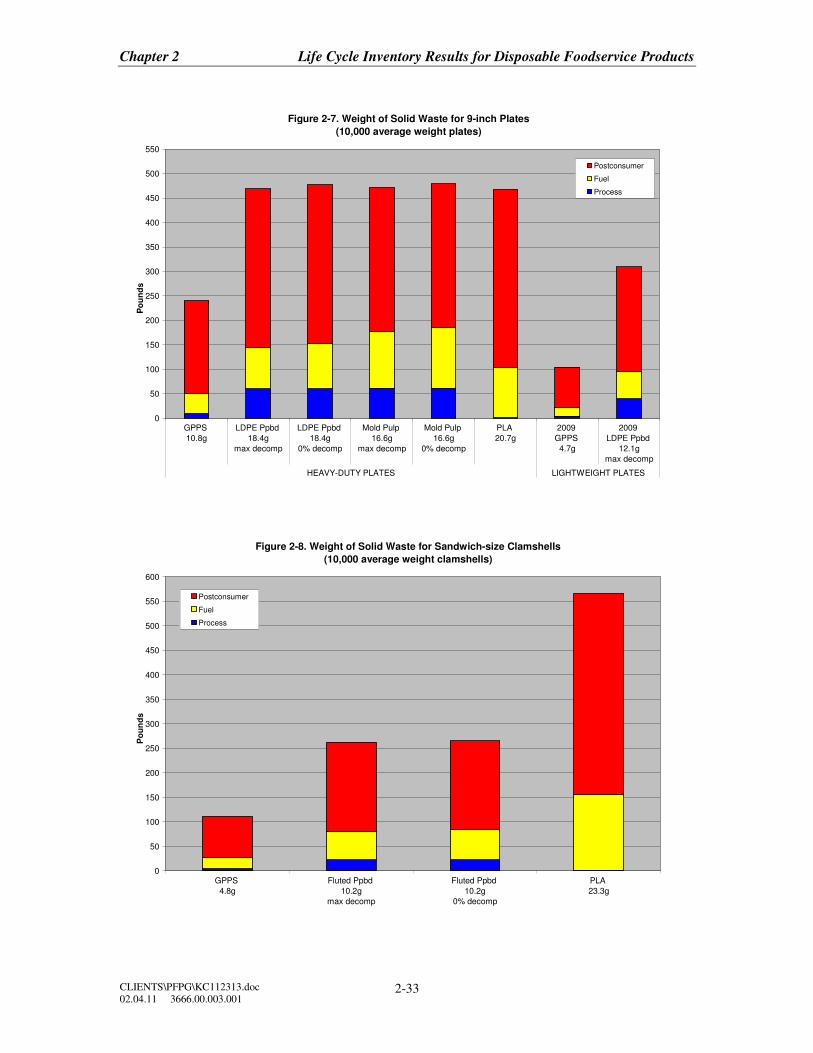
Chapter 2 Life Cycle Inventory Results for Disposable Foodservice Products
CLIENTS\PFPG\KC112313.doc
02.04.11 3666.00.003.001 2-33
Figure 2-7. Weight of Solid Waste for 9-inch Plates
(10,000 average weight plates)
0
50
100
150
200
250
300
350
400
450
500
550
GPPS
10.8g
LDPE Ppbd
18.4g
max decomp
LDPE Ppbd
18.4g
0% decomp
Mold Pulp
16.6g
max decomp
Mold Pulp
16.6g
0% decomp
PLA
20.7g
2009
GPPS
4.7g
2009
LDPE Ppbd
12.1g
max decomp
HEAVY-DUTY PLATES LIGHTWEIGHT PLATES
Po
un
ds
Postconsumer
Fuel
Process
Figure 2-8. Weight of Solid Waste for Sandwich-size Clamshells
(10,000 average weight clamshells)
0
50
100
150
200
250
300
350
400
450
500
550
600
GPPS
4.8g
Fluted Ppbd
10.2g
max decomp
Fluted Ppbd
10.2g
0% decomp
PLA
23.3g
Po
un
ds
Postconsumer
Fuel
Process
Chapter 2 Life Cycle Inventory Results for Disposable Foodservice Products
CLIENTS\PFPG\KC112313.doc
02.04.11 3666.00.003.001 2-34
Volume of Solid Waste. Results for solid waste by volume are shown in Tables
2-19 through 2-22 and Figures 2-9 through 2-12. Weights of process- and fuel-related
wastes are converted to volume using an average density factor of 50 pounds per cubic
foot (1,350 pounds per cubic yard). The weights of postconsumer products are converted
to volume using density factors that take into account not only the density of each
material but also the degree to which these materials compact in the landfill. The landfill
densities used for the conversions are shown in Table 2-23.
The lower the landfill density, the more space the postconsumer materials take up.
Foam products have a lower landfill density than paperboard or solid PLA products, so
each pound of foam product takes up more landfill space than a pound of paperboard or
PLA product. Comparing the postconsumer solid waste segments in the solid waste
weight and volume figures shows how the lower landfill density of foam foodservice
products results in a volume of postconsumer solid waste that is similar to (and in some
cases, higher than) the volume of paperboard and solid PLA products.
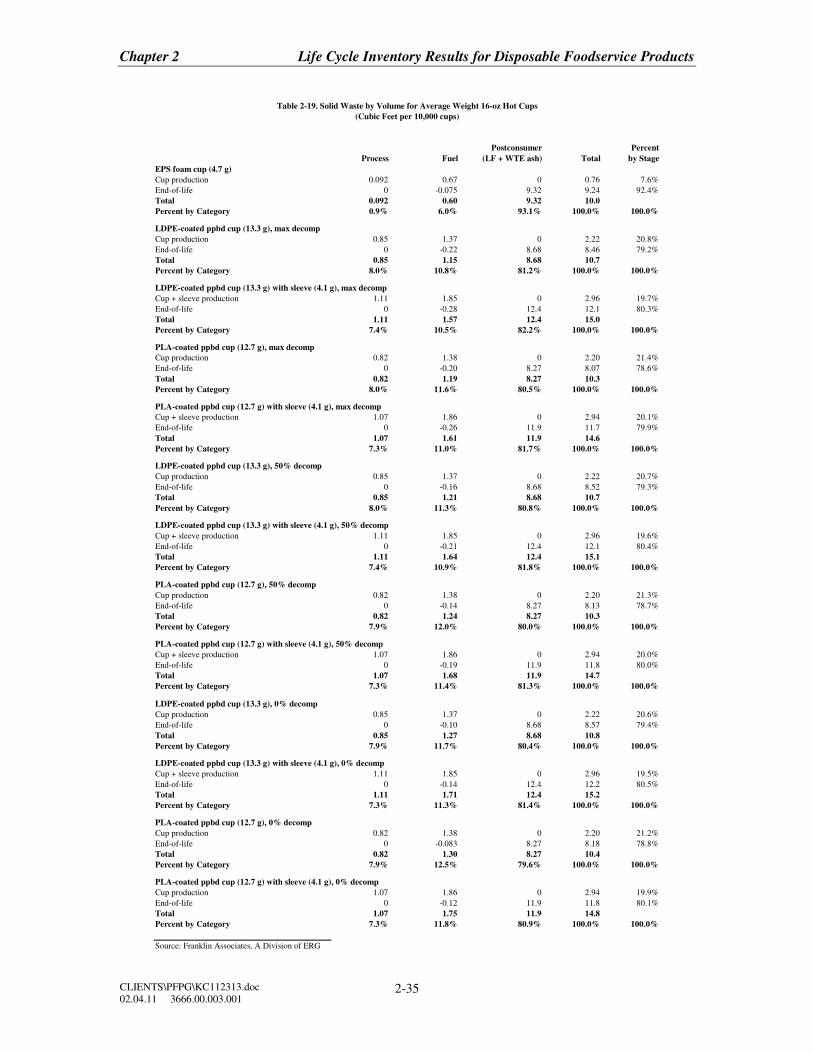
Chapter 2 Life Cycle Inventory Results for Disposable Foodservice Products
CLIENTS\PFPG\KC112313.doc
02.04.11 3666.00.003.001 2-35
Process Fuel
Postconsumer
(LF + WTE ash) Total
Percent
by Stage
EPS foam cup (4.7 g)
Cup production 0.092 0.67 0 0.76 7.6%
End-of-life 0 -0.075 9.32 9.24 92.4%
Total 0.092 0.60 9.32 10.0
Percent by Category 0.9% 6.0% 93.1% 100.0% 100.0%
LDPE-coated ppbd cup (13.3 g), max decomp
Cup production 0.85 1.37 0 2.22 20.8%
End-of-life 0 -0.22 8.68 8.46 79.2%
Total 0.85 1.15 8.68 10.7
Percent by Category 8.0% 10.8% 81.2% 100.0% 100.0%
LDPE-coated ppbd cup (13.3 g) with sleeve (4.1 g), max decomp
Cup + sleeve production 1.11 1.85 0 2.96 19.7%
End-of-life 0 -0.28 12.4 12.1 80.3%
Total 1.11 1.57 12.4 15.0
Percent by Category 7.4% 10.5% 82.2% 100.0% 100.0%
PLA-coated ppbd cup (12.7 g), max decomp
Cup production 0.82 1.38 0 2.20 21.4%
End-of-life 0 -0.20 8.27 8.07 78.6%
Total 0.82 1.19 8.27 10.3
Percent by Category 8.0% 11.6% 80.5% 100.0% 100.0%
PLA-coated ppbd cup (12.7 g) with sleeve (4.1 g), max decomp
Cup + sleeve production 1.07 1.86 0 2.94 20.1%
End-of-life 0 -0.26 11.9 11.7 79.9%
Total 1.07 1.61 11.9 14.6
Percent by Category 7.3% 11.0% 81.7% 100.0% 100.0%
LDPE-coated ppbd cup (13.3 g), 50% decomp
Cup production 0.85 1.37 0 2.22 20.7%
End-of-life 0 -0.16 8.68 8.52 79.3%
Total 0.85 1.21 8.68 10.7
Percent by Category 8.0% 11.3% 80.8% 100.0% 100.0%
LDPE-coated ppbd cup (13.3 g) with sleeve (4.1 g), 50% decomp
Cup + sleeve production 1.11 1.85 0 2.96 19.6%
End-of-life 0 -0.21 12.4 12.1 80.4%
Total 1.11 1.64 12.4 15.1
Percent by Category 7.4% 10.9% 81.8% 100.0% 100.0%
PLA-coated ppbd cup (12.7 g), 50% decomp
Cup production 0.82 1.38 0 2.20 21.3%
End-of-life 0 -0.14 8.27 8.13 78.7%
Total 0.82 1.24 8.27 10.3
Percent by Category 7.9% 12.0% 80.0% 100.0% 100.0%
PLA-coated ppbd cup (12.7 g) with sleeve (4.1 g), 50% decomp
Cup + sleeve production 1.07 1.86 0 2.94 20.0%
End-of-life 0 -0.19 11.9 11.8 80.0%
Total 1.07 1.68 11.9 14.7
Percent by Category 7.3% 11.4% 81.3% 100.0% 100.0%
LDPE-coated ppbd cup (13.3 g), 0% decomp
Cup production 0.85 1.37 0 2.22 20.6%
End-of-life 0 -0.10 8.68 8.57 79.4%
Total 0.85 1.27 8.68 10.8
Percent by Category 7.9% 11.7% 80.4% 100.0% 100.0%
LDPE-coated ppbd cup (13.3 g) with sleeve (4.1 g), 0% decomp
Cup + sleeve production 1.11 1.85 0 2.96 19.5%
End-of-life 0 -0.14 12.4 12.2 80.5%
Total 1.11 1.71 12.4 15.2
Percent by Category 7.3% 11.3% 81.4% 100.0% 100.0%
PLA-coated ppbd cup (12.7 g), 0% decomp
Cup production 0.82 1.38 0 2.20 21.2%
End-of-life 0 -0.083 8.27 8.18 78.8%
Total 0.82 1.30 8.27 10.4
Percent by Category 7.9% 12.5% 79.6% 100.0% 100.0%
PLA-coated ppbd cup (12.7 g) with sleeve (4.1 g), 0% decomp
Cup production 1.07 1.86 0 2.94 19.9%
End-of-life 0 -0.12 11.9 11.8 80.1%
Total 1.07 1.75 11.9 14.8
Percent by Category 7.3% 11.8% 80.9% 100.0% 100.0%
Source: Franklin Associates, A Division of ERG
Table 2-19. Solid Waste by Volume for Average Weight 16-oz Hot Cups
(Cubic Feet per 10,000 cups)
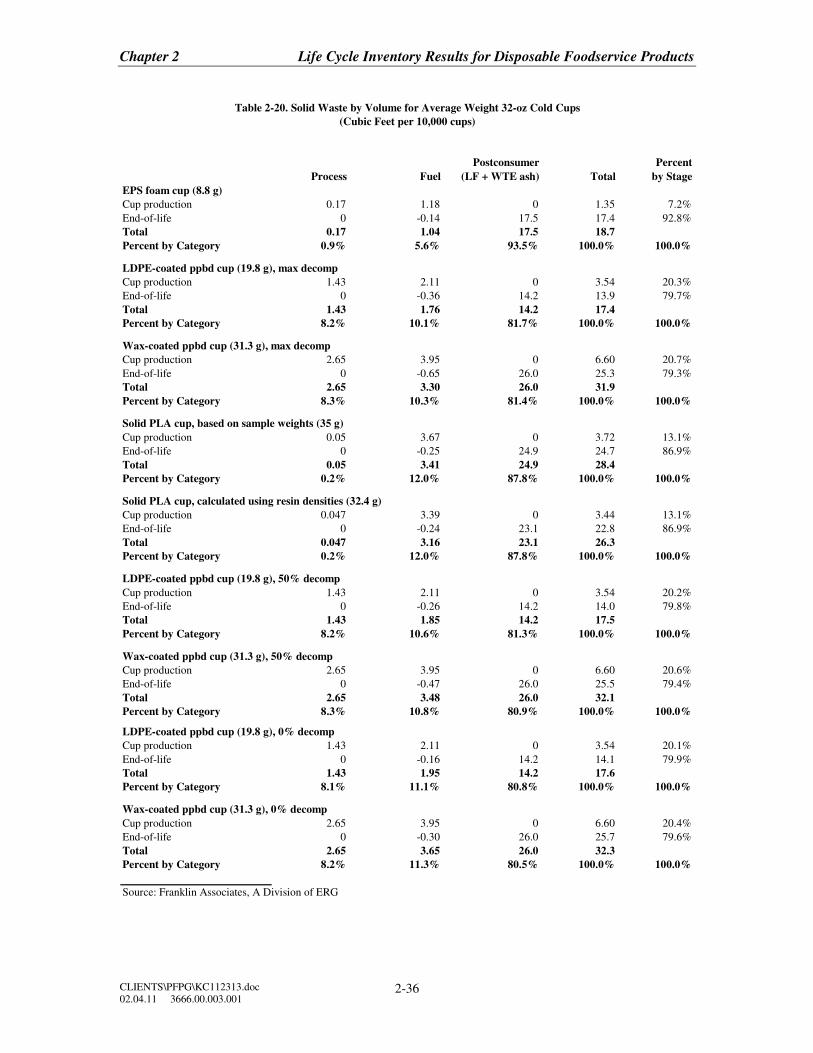
Chapter 2 Life Cycle Inventory Results for Disposable Foodservice Products
CLIENTS\PFPG\KC112313.doc
02.04.11 3666.00.003.001 2-36
Process Fuel
Postconsumer
(LF + WTE ash) Total
Percent
by Stage
EPS foam cup (8.8 g)
Cup production 0.17 1.18 0 1.35 7.2%
End-of-life 0 -0.14 17.5 17.4 92.8%
Total 0.17 1.04 17.5 18.7
Percent by Category 0.9% 5.6% 93.5% 100.0% 100.0%
LDPE-coated ppbd cup (19.8 g), max decomp
Cup production 1.43 2.11 0 3.54 20.3%
End-of-life 0 -0.36 14.2 13.9 79.7%
Total 1.43 1.76 14.2 17.4
Percent by Category 8.2% 10.1% 81.7% 100.0% 100.0%
Wax-coated ppbd cup (31.3 g), max decomp
Cup production 2.65 3.95 0 6.60 20.7%
End-of-life 0 -0.65 26.0 25.3 79.3%
Total 2.65 3.30 26.0 31.9
Percent by Category 8.3% 10.3% 81.4% 100.0% 100.0%
Solid PLA cup, based on sample weights (35 g)
Cup production 0.05 3.67 0 3.72 13.1%
End-of-life 0 -0.25 24.9 24.7 86.9%
Total 0.05 3.41 24.9 28.4
Percent by Category 0.2% 12.0% 87.8% 100.0% 100.0%
Solid PLA cup, calculated using resin densities (32.4 g)
Cup production 0.047 3.39 0 3.44 13.1%
End-of-life 0 -0.24 23.1 22.8 86.9%
Total 0.047 3.16 23.1 26.3
Percent by Category 0.2% 12.0% 87.8% 100.0% 100.0%
LDPE-coated ppbd cup (19.8 g), 50% decomp
Cup production 1.43 2.11 0 3.54 20.2%
End-of-life 0 -0.26 14.2 14.0 79.8%
Total 1.43 1.85 14.2 17.5
Percent by Category 8.2% 10.6% 81.3% 100.0% 100.0%
Wax-coated ppbd cup (31.3 g), 50% decomp
Cup production 2.65 3.95 0 6.60 20.6%
End-of-life 0 -0.47 26.0 25.5 79.4%
Total 2.65 3.48 26.0 32.1
Percent by Category 8.3% 10.8% 80.9% 100.0% 100.0%
LDPE-coated ppbd cup (19.8 g), 0% decomp
Cup production 1.43 2.11 0 3.54 20.1%
End-of-life 0 -0.16 14.2 14.1 79.9%
Total 1.43 1.95 14.2 17.6
Percent by Category 8.1% 11.1% 80.8% 100.0% 100.0%
Wax-coated ppbd cup (31.3 g), 0% decomp
Cup production 2.65 3.95 0 6.60 20.4%
End-of-life 0 -0.30 26.0 25.7 79.6%
Total 2.65 3.65 26.0 32.3
Percent by Category 8.2% 11.3% 80.5% 100.0% 100.0%
Source: Franklin Associates, A Division of ERG
Table 2-20. Solid Waste by Volume for Average Weight 32-oz Cold Cups
(Cubic Feet per 10,000 cups)
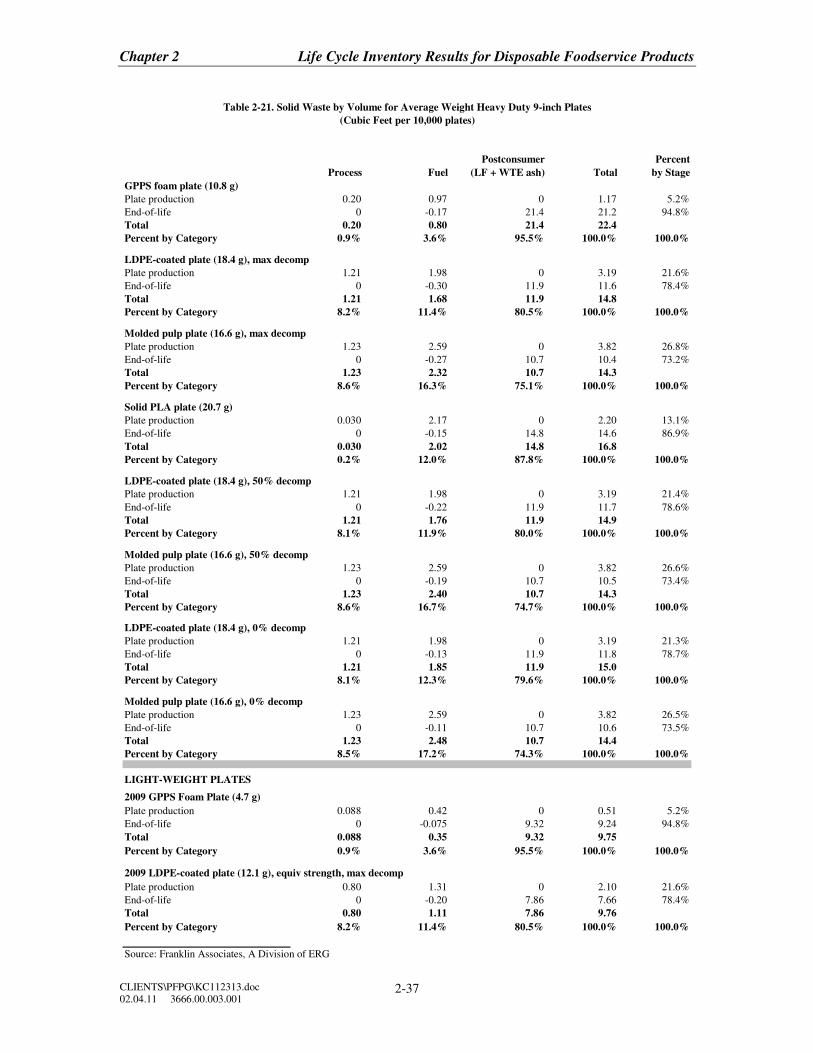
Chapter 2 Life Cycle Inventory Results for Disposable Foodservice Products
CLIENTS\PFPG\KC112313.doc
02.04.11 3666.00.003.001 2-37
Process Fuel
Postconsumer
(LF + WTE ash) Total
Percent
by Stage
GPPS foam plate (10.8 g)
Plate production 0.20 0.97 0 1.17 5.2%
End-of-life 0 -0.17 21.4 21.2 94.8%
Total 0.20 0.80 21.4 22.4
Percent by Category 0.9% 3.6% 95.5% 100.0% 100.0%
LDPE-coated plate (18.4 g), max decomp
Plate production 1.21 1.98 0 3.19 21.6%
End-of-life 0 -0.30 11.9 11.6 78.4%
Total 1.21 1.68 11.9 14.8
Percent by Category 8.2% 11.4% 80.5% 100.0% 100.0%
Molded pulp plate (16.6 g), max decomp
Plate production 1.23 2.59 0 3.82 26.8%
End-of-life 0 -0.27 10.7 10.4 73.2%
Total 1.23 2.32 10.7 14.3
Percent by Category 8.6% 16.3% 75.1% 100.0% 100.0%
Solid PLA plate (20.7 g)
Plate production 0.030 2.17 0 2.20 13.1%
End-of-life 0 -0.15 14.8 14.6 86.9%
Total 0.030 2.02 14.8 16.8
Percent by Category 0.2% 12.0% 87.8% 100.0% 100.0%
LDPE-coated plate (18.4 g), 50% decomp
Plate production 1.21 1.98 0 3.19 21.4%
End-of-life 0 -0.22 11.9 11.7 78.6%
Total 1.21 1.76 11.9 14.9
Percent by Category 8.1% 11.9% 80.0% 100.0% 100.0%
Molded pulp plate (16.6 g), 50% decomp
Plate production 1.23 2.59 0 3.82 26.6%
End-of-life 0 -0.19 10.7 10.5 73.4%
Total 1.23 2.40 10.7 14.3
Percent by Category 8.6% 16.7% 74.7% 100.0% 100.0%
LDPE-coated plate (18.4 g), 0% decomp
Plate production 1.21 1.98 0 3.19 21.3%
End-of-life 0 -0.13 11.9 11.8 78.7%
Total 1.21 1.85 11.9 15.0
Percent by Category 8.1% 12.3% 79.6% 100.0% 100.0%
Molded pulp plate (16.6 g), 0% decomp
Plate production 1.23 2.59 0 3.82 26.5%
End-of-life 0 -0.11 10.7 10.6 73.5%
Total 1.23 2.48 10.7 14.4
Percent by Category 8.5% 17.2% 74.3% 100.0% 100.0%
LIGHT-WEIGHT PLATES
2009 GPPS Foam Plate (4.7 g)
Plate production 0.088 0.42 0 0.51 5.2%
End-of-life 0 -0.075 9.32 9.24 94.8%
Total 0.088 0.35 9.32 9.75
Percent by Category 0.9% 3.6% 95.5% 100.0% 100.0%
2009 LDPE-coated plate (12.1 g), equiv strength, max decomp
Plate production 0.80 1.31 0 2.10 21.6%
End-of-life 0 -0.20 7.86 7.66 78.4%
Total 0.80 1.11 7.86 9.76
Percent by Category 8.2% 11.4% 80.5% 100.0% 100.0%
Source: Franklin Associates, A Division of ERG
Table 2-21. Solid Waste by Volume for Average Weight Heavy Duty 9-inch Plates
(Cubic Feet per 10,000 plates)

Chapter 2 Life Cycle Inventory Results for Disposable Foodservice Products
CLIENTS\PFPG\KC112313.doc
02.04.11 3666.00.003.001 2-38
Process Fuel
Postconsumer
(LF + WTE ash) Total
Percent
by Stage
GPPS foam clamshell (4.8 g)
Clamshell production 0.090 0.52 0 0.61 6.1%
End-of-life 0 -0.076 9.52 9.44 93.9%
Total 0.090 0.45 9.52 10.1
Percent by Category 0.9% 4.5% 94.7% 100.0% 100.0%
Fluted paperboard clamshell (10.2 g), max decomp
Clamshell production 0.45 1.29 0 1.74 21.3%
End-of-life 0 -0.13 6.55 6.42 78.7%
Total 0.45 1.16 6.55 8.16
Percent by Category 5.5% 14.2% 80.3% 100.0% 100.0%
Solid PLA clamshell (23.3 g)
Clamshell production 0.034 3.25 0 3.28 16.6%
End-of-life 0 -0.17 16.6 16.5 83.4%
Total 0.034 3.08 16.6 19.7
Percent by Category 0.2% 15.6% 84.2% 100.0% 100.0%
Fluted paperboard clamshell (10.2 g), 50% decomp
Clamshell production 0.45 1.29 0 1.74 21.2%
End-of-life 0 -0.096 6.55 6.45 78.8%
Total 0.45 1.19 6.55 8.19
Percent by Category 5.5% 14.6% 80.0% 100.0% 100.0%
Fluted paperboard clamshell (10.2 g), 0% decomp
Clamshell production 0.45 1.29 0 1.74 21.1%
End-of-life 0 -0.065 6.55 6.48 78.9%
Total 0.45 1.22 6.55 8.22
Percent by Category 5.5% 14.9% 79.6% 100.0% 100.0%
Source: Franklin Associates, A Division of ERG
Table 2-22. Solid Waste by Volume for Average Weight Sandwich-size Clamshells
(Cubic Feet per 10,000 clamshells)
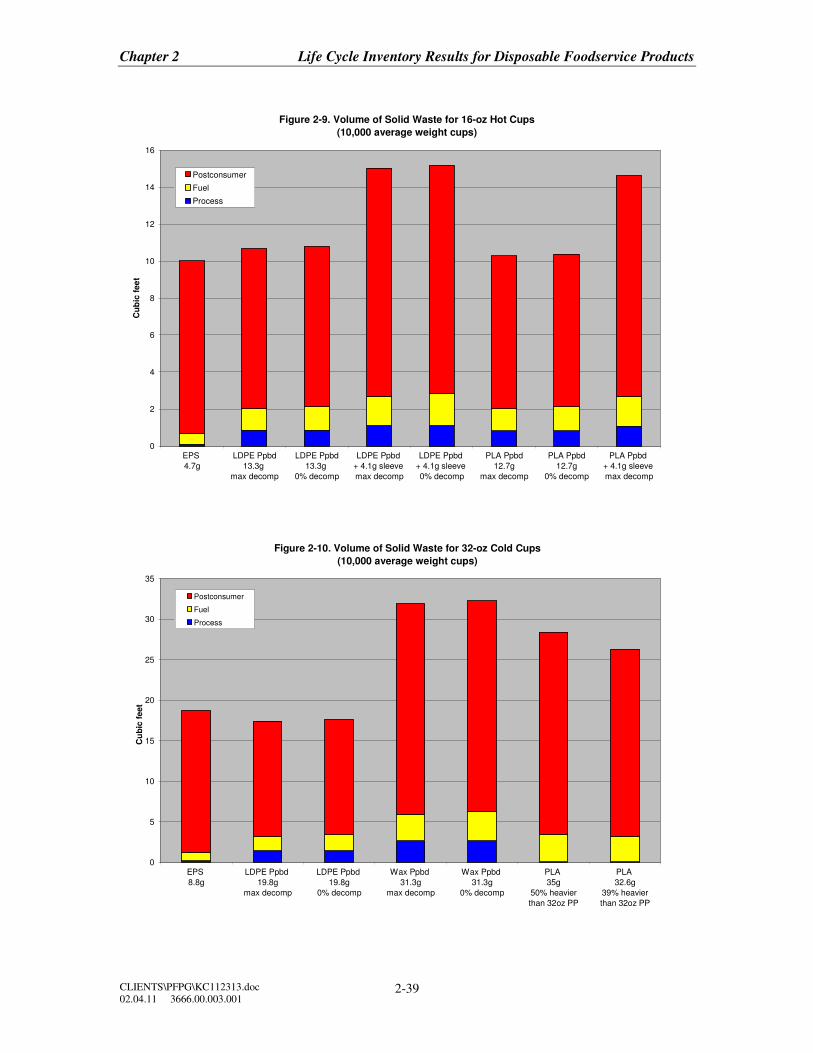
Chapter 2 Life Cycle Inventory Results for Disposable Foodservice Products
CLIENTS\PFPG\KC112313.doc
02.04.11 3666.00.003.001 2-39
Figure 2-9. Volume of Solid Waste for 16-oz Hot Cups
(10,000 average weight cups)
0
2
4
6
8
10
12
14
16
EPS
4.7g
LDPE Ppbd
13.3g
max decomp
LDPE Ppbd
13.3g
0% decomp
LDPE Ppbd
+ 4.1g sleeve
max decomp
LDPE Ppbd
+ 4.1g sleeve
0% decomp
PLA Ppbd
12.7g
max decomp
PLA Ppbd
12.7g
0% decomp
PLA Ppbd
+ 4.1g sleeve
max decomp
Cu
bic
fee
t
Postconsumer
Fuel
Process
Figure 2-10. Volume of Solid Waste for 32-oz Cold Cups
(10,000 average weight cups)
0
5
10
15
20
25
30
35
EPS
8.8g
LDPE Ppbd
19.8g
max decomp
LDPE Ppbd
19.8g
0% decomp
Wax Ppbd
31.3g
max decomp
Wax Ppbd
31.3g
0% decomp
PLA
35g
50% heavier
than 32oz PP
PLA
32.6g
39% heavier
than 32oz PP
Cu
bic
feet
Postconsumer
Fuel
Process
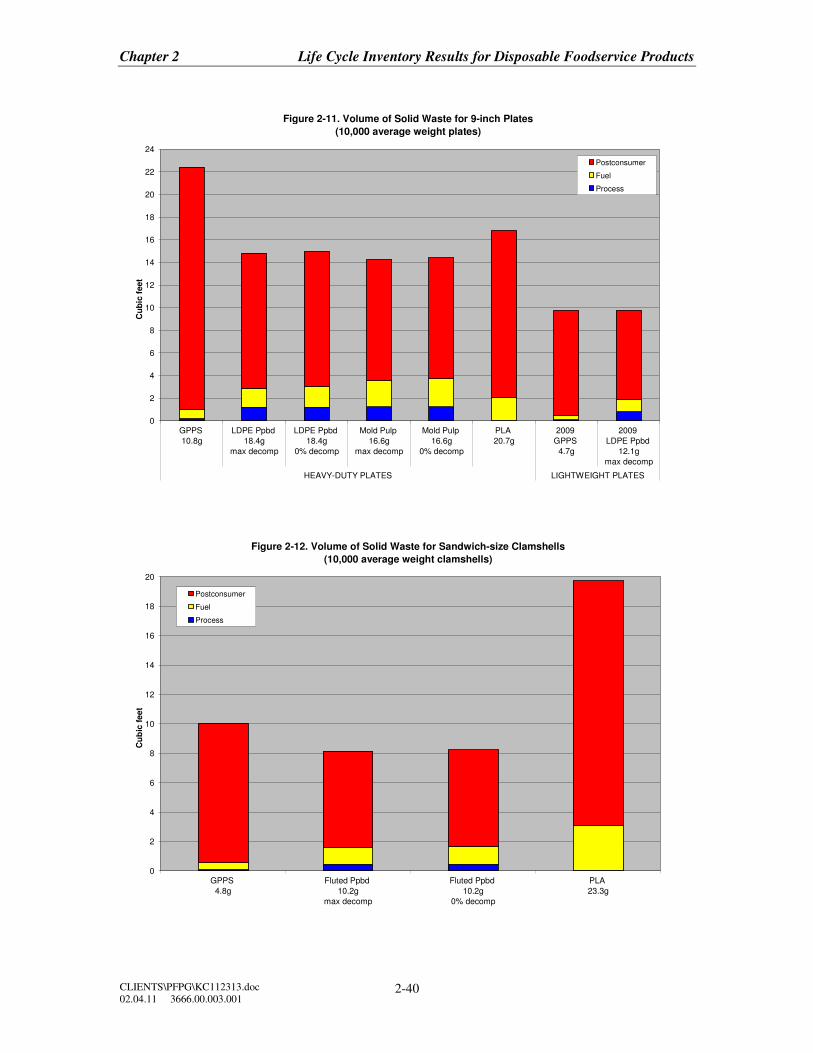
Chapter 2 Life Cycle Inventory Results for Disposable Foodservice Products
CLIENTS\PFPG\KC112313.doc
02.04.11 3666.00.003.001 2-40
Figure 2-11. Volume of Solid Waste for 9-inch Plates
(10,000 average weight plates)
0
2
4
6
8
10
12
14
16
18
20
22
24
GPPS
10.8g
LDPE Ppbd
18.4g
max decomp
LDPE Ppbd
18.4g
0% decomp
Mold Pulp
16.6g
max decomp
Mold Pulp
16.6g
0% decomp
PLA
20.7g
2009
GPPS
4.7g
2009
LDPE Ppbd
12.1g
max decomp
HEAVY-DUTY PLATES LIGHTWEIGHT PLATES
Cu
bic
feet
Postconsumer
Fuel
Process
Figure 2-12. Volume of Solid Waste for Sandwich-size Clamshells
(10,000 average weight clamshells)
0
2
4
6
8
10
12
14
16
18
20
GPPS
4.8g
Fluted Ppbd
10.2g
max decomp
Fluted Ppbd
10.2g
0% decomp
PLA
23.3g
Cu
bic
feet
Postconsumer
Fuel
Process
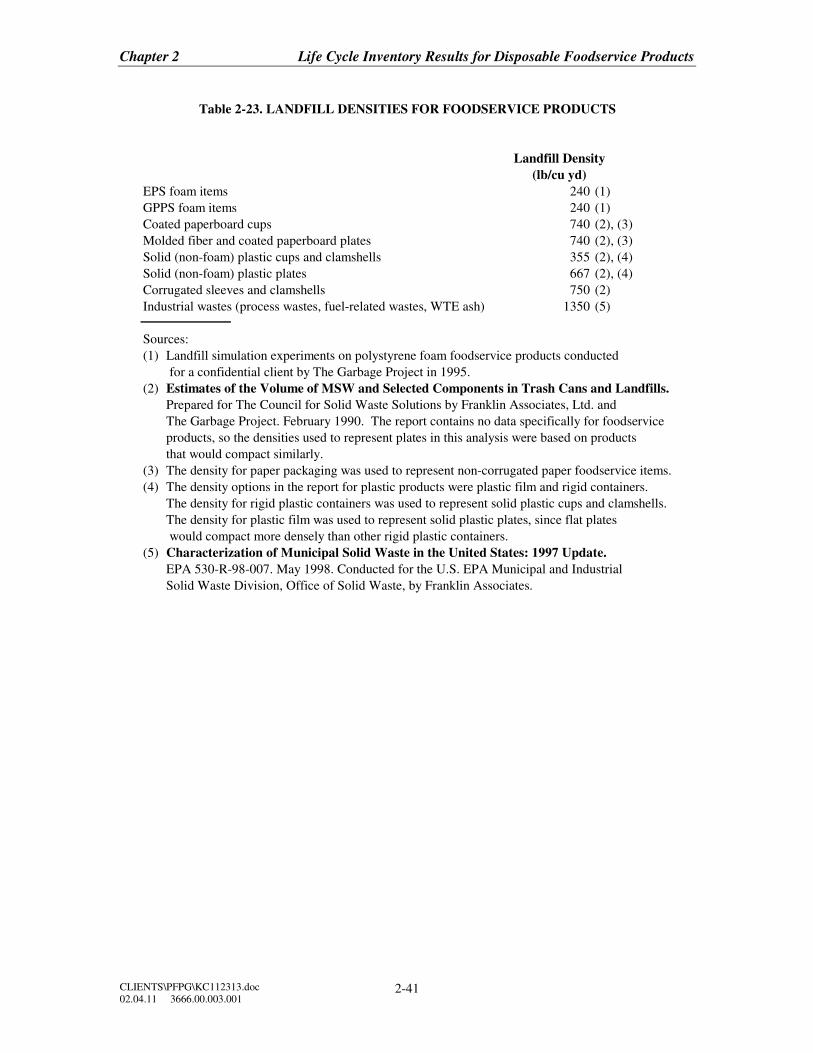
Chapter 2 Life Cycle Inventory Results for Disposable Foodservice Products
CLIENTS\PFPG\KC112313.doc
02.04.11 3666.00.003.001 2-41
Landfill Density
(lb/cu yd)
EPS foam items 240 (1)
GPPS foam items 240 (1)
Coated paperboard cups 740 (2), (3)
Molded fiber and coated paperboard plates 740 (2), (3)
Solid (non-foam) plastic cups and clamshells 355 (2), (4)
Solid (non-foam) plastic plates 667 (2), (4)
Corrugated sleeves and clamshells 750 (2)
Industrial wastes (process wastes, fuel-related wastes, WTE ash) 1350 (5)
Sources:
(1) Landfill simulation experiments on polystyrene foam foodservice products conducted
for a confidential client by The Garbage Project in 1995.
(2) Estimates of the Volume of MSW and Selected Components in Trash Cans and Landfills.
Prepared for The Council for Solid Waste Solutions by Franklin Associates, Ltd. and
The Garbage Project. February 1990. The report contains no data specifically for foodservice
products, so the densities used to represent plates in this analysis were based on products
that would compact similarly.
(3) The density for paper packaging was used to represent non-corrugated paper foodservice items.
(4) The density options in the report for plastic products were plastic film and rigid containers.
The density for rigid plastic containers was used to represent solid plastic cups and clamshells.
The density for plastic film was used to represent solid plastic plates, since flat plates
would compact more densely than other rigid plastic containers.
(5) Characterization of Municipal Solid Waste in the United States: 1997 Update.
EPA 530-R-98-007. May 1998. Conducted for the U.S. EPA Municipal and Industrial
Solid Waste Division, Office of Solid Waste, by Franklin Associates.
Table 2-23. LANDFILL DENSITIES FOR FOODSERVICE PRODUCTS
Chapter 2 Life Cycle Inventory Results for Disposable Foodservice Products
CLIENTS\PFPG\KC112313.doc
02.04.11 3666.00.003.001 2-42
Environmental Emissions
The emissions reported in this analysis include those associated with production
of materials and production and combustion of fuels and are based upon the best data
available. However, in the many unit processes included in the system models, some
emissions data have been reported from industrial sources, some are estimated from EPA
emission factors, and some have been calculated based on reaction chemistry or other
information. This means there are significant uncertainties with regards to the application
of the data to these particular product systems. Because of these uncertainties, the
difference in two systems’ emissions of a given substance is not considered meaningful
unless the percent difference exceeds 25 percent. (Percent difference is defined as the
difference between two system totals divided by their average.) This minimum percent
difference criterion was developed based on the experience and professional judgment of
the analysts.
Atmospheric and waterborne emissions for each system include emissions from
processes and emissions associated with the combustion of fuels. Process emissions are
those released directly from the sequence of processes that are used to extract, transform,
fabricate, or otherwise effect changes on a material or product during its life cycle, while
fuel-related emissions are those associated with the combustion of fuels used for process
energy and transportation energy. The majority of atmospheric emissions are fuel-related,
particularly in the case of greenhouse gas emissions, which are the focus of this
discussion.
Greenhouse Gas Results. In this analysis, results for greenhouse gas emissions
are reported in terms of carbon dioxide equivalents (CO2 eq). Each greenhouse gas has a
global warming potential (GWP) that represents its global warming contribution relative
to an equivalent quantity of carbon dioxide. As defined in the International Panel on
Climate Change (IPCC) Second Assessment Report (SAR), published in 1996, GWPs are
calculated as the ratio of the radiative forcing that would result from the emissions of one
kilogram of a greenhouse gas to that from emission of one kilogram of carbon dioxide
over a period of time (usually 100 years). Radiative forcing is a measure of how the
energy balance of the Earth-atmosphere system is influenced when factors that affect
climate are altered.
The weight of releases of each greenhouse gas is multiplied by its GWP, then
results for all GHGs are added to arrive at the total CO2 eq. All CO2 calculations,
including CO2 eq calculations for the aggregated methane releases from decomposition of
landfilled paper products, are based on 100-year GWP factors.
Chapter 2 Life Cycle Inventory Results for Disposable Foodservice Products
CLIENTS\PFPG\KC112313.doc
02.04.11 3666.00.003.001 2-43
The primary three atmospheric emissions reported in this analysis that contribute
over 99.9 percent of the total CO2 eq for each system are fossil fuel-derived carbon
dioxide, methane, and nitrous oxide. (Non-fossil carbon dioxide emissions, such as those
from the burning of wood, are considered part of the natural carbon cycle and are not
considered a net contributor to global warming.)
The GWP factors that are most widely used are those from the IPCC SAR
published in 1996. Although two subsequent updates of the IPCC report with slightly
different GWPs have been published since the SAR, the GWPs from the SAR are used
for consistency with international reporting standards.32 The IPCC SAR 100-year global
warming potentials (GWP) are 21 for methane and 310 for nitrous oxide.
In addition to process and fuel-related greenhouse gas emissions, Tables 2-23
through 2-26 also include estimates of CO2 eq associated with end-of-life management of
postconsumer foodservice items. The methodology and data sources used to estimate CO2
eq from WTE combustion of postconsumer products, CO2 eq from landfill gas emissions,
CO2 eq credits for displacement of grid electricity, and carbon sequestration credits are
described in detail in the End of Life Management section of Chapter 1.
32 The United Nations Framework Convention on Climate Change reporting guidelines for national
inventories continue to use GWPs from the IPPC Second Assessment Report (SAR). For this reason, the
U.S. EPA also uses GWPs from the IPCC SAR, as described on page ES-3 of EPA 430-R-10-006
Inventory of U.S. Greenhouse Gas Emissions and Sinks: 1990-2008 (April 2010). The U.S. EPA
Mandatory Greenhouse Gas Reporting Rule, published in the Federal Register / Vol. 74, No. 209 /
Friday, October 30, 2009 / Rules and Regulations, also uses 100-year GWPs from the SAR
(http://www.epa.gov/climatechange/emissions/downloads09/GHG-MRR-FinalRule.pdf; GWP factors are
in Table A-1 on p. 56395 of Part 98).
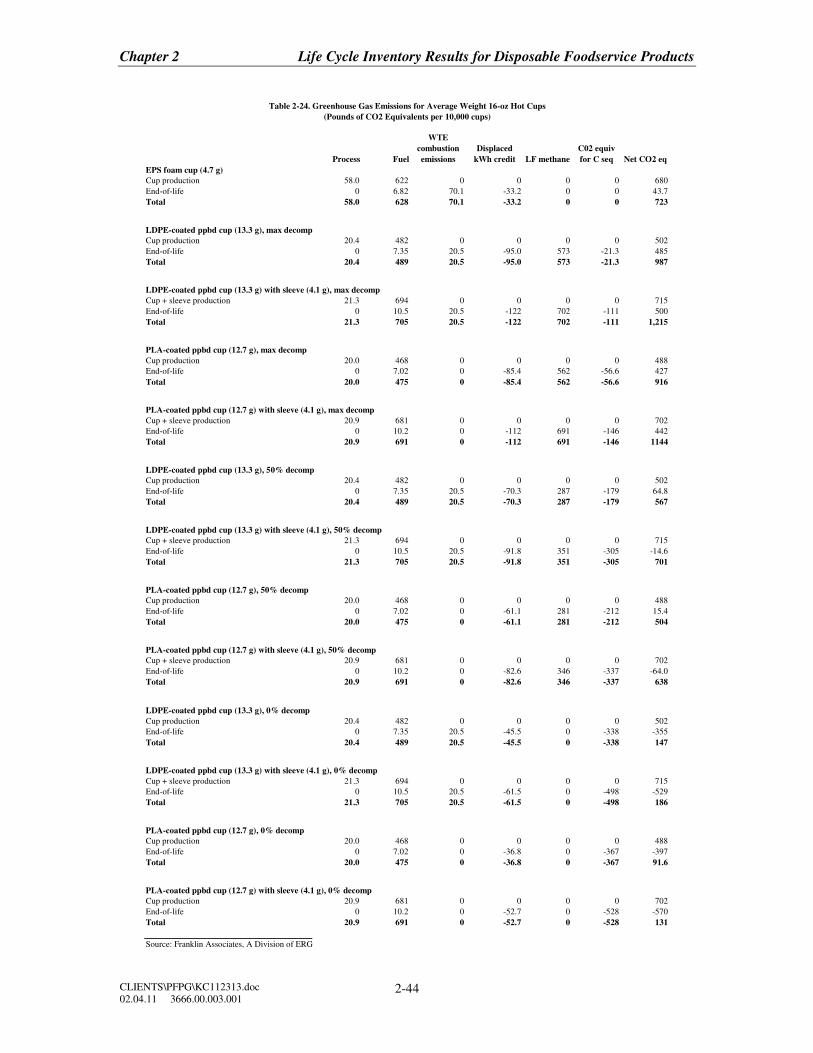
Chapter 2 Life Cycle Inventory Results for Disposable Foodservice Products
CLIENTS\PFPG\KC112313.doc
02.04.11 3666.00.003.001 2-44
Process Fuel
WTE
combustion
emissions
Displaced
kWh credit LF methane
C02 equiv
for C seq Net CO2 eq
EPS foam cup (4.7 g)
Cup production 58.0 622 0 0 0 0 680
End-of-life 0 6.82 70.1 -33.2 0 0 43.7
Total 58.0 628 70.1 -33.2 0 0 723
LDPE-coated ppbd cup (13.3 g), max decomp
Cup production 20.4 482 0 0 0 0 502
End-of-life 0 7.35 20.5 -95.0 573 -21.3 485
Total 20.4 489 20.5 -95.0 573 -21.3 987
LDPE-coated ppbd cup (13.3 g) with sleeve (4.1 g), max decomp
Cup + sleeve production 21.3 694 0 0 0 0 715
End-of-life 0 10.5 20.5 -122 702 -111 500
Total 21.3 705 20.5 -122 702 -111 1,215
PLA-coated ppbd cup (12.7 g), max decomp
Cup production 20.0 468 0 0 0 0 488
End-of-life 0 7.02 0 -85.4 562 -56.6 427
Total 20.0 475 0 -85.4 562 -56.6 916
PLA-coated ppbd cup (12.7 g) with sleeve (4.1 g), max decomp
Cup + sleeve production 20.9 681 0 0 0 0 702
End-of-life 0 10.2 0 -112 691 -146 442
Total 20.9 691 0 -112 691 -146 1144
LDPE-coated ppbd cup (13.3 g), 50% decomp
Cup production 20.4 482 0 0 0 0 502
End-of-life 0 7.35 20.5 -70.3 287 -179 64.8
Total 20.4 489 20.5 -70.3 287 -179 567
LDPE-coated ppbd cup (13.3 g) with sleeve (4.1 g), 50% decomp
Cup + sleeve production 21.3 694 0 0 0 0 715
End-of-life 0 10.5 20.5 -91.8 351 -305 -14.6
Total 21.3 705 20.5 -91.8 351 -305 701
PLA-coated ppbd cup (12.7 g), 50% decomp
Cup production 20.0 468 0 0 0 0 488
End-of-life 0 7.02 0 -61.1 281 -212 15.4
Total 20.0 475 0 -61.1 281 -212 504
PLA-coated ppbd cup (12.7 g) with sleeve (4.1 g), 50% decomp
Cup + sleeve production 20.9 681 0 0 0 0 702
End-of-life 0 10.2 0 -82.6 346 -337 -64.0
Total 20.9 691 0 -82.6 346 -337 638
LDPE-coated ppbd cup (13.3 g), 0% decomp
Cup production 20.4 482 0 0 0 0 502
End-of-life 0 7.35 20.5 -45.5 0 -338 -355
Total 20.4 489 20.5 -45.5 0 -338 147
LDPE-coated ppbd cup (13.3 g) with sleeve (4.1 g), 0% decomp
Cup + sleeve production 21.3 694 0 0 0 0 715
End-of-life 0 10.5 20.5 -61.5 0 -498 -529
Total 21.3 705 20.5 -61.5 0 -498 186
PLA-coated ppbd cup (12.7 g), 0% decomp
Cup production 20.0 468 0 0 0 0 488
End-of-life 0 7.02 0 -36.8 0 -367 -397
Total 20.0 475 0 -36.8 0 -367 91.6
PLA-coated ppbd cup (12.7 g) with sleeve (4.1 g), 0% decomp
Cup production 20.9 681 0 0 0 0 702
End-of-life 0 10.2 0 -52.7 0 -528 -570
Total 20.9 691 0 -52.7 0 -528 131
Source: Franklin Associates, A Division of ERG
Table 2-24. Greenhouse Gas Emissions for Average Weight 16-oz Hot Cups
(Pounds of CO2 Equivalents per 10,000 cups)
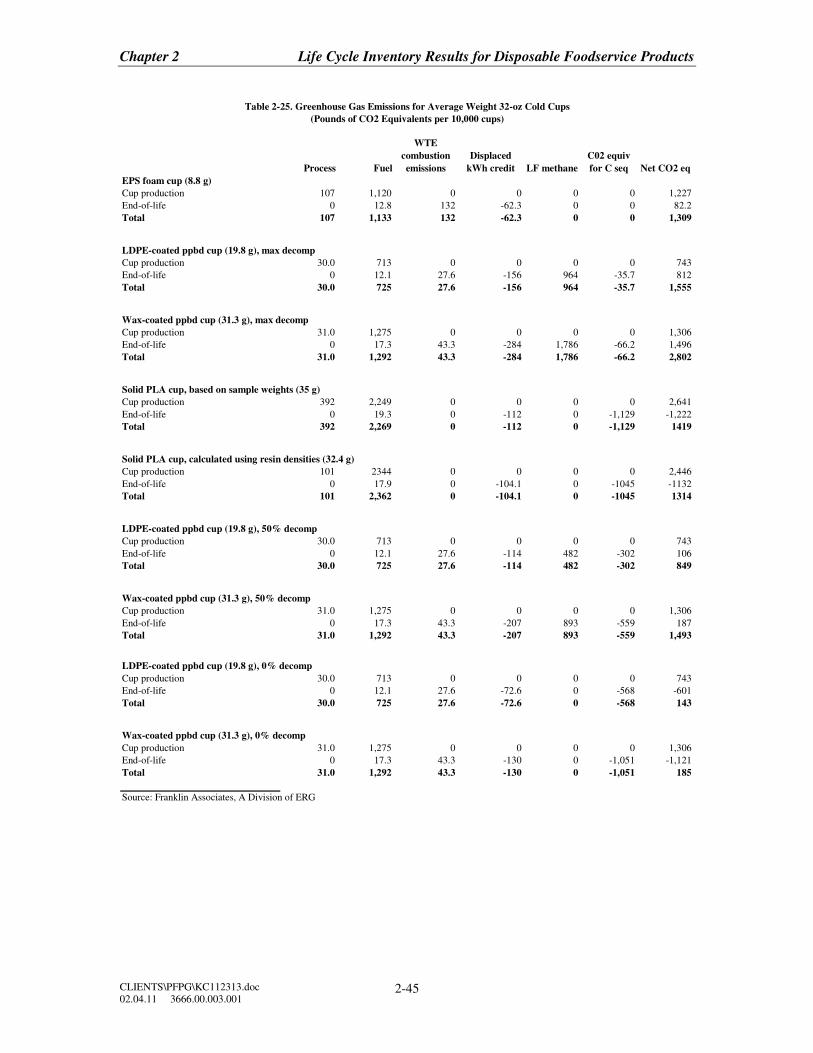
Chapter 2 Life Cycle Inventory Results for Disposable Foodservice Products
CLIENTS\PFPG\KC112313.doc
02.04.11 3666.00.003.001 2-45
Process Fuel
WTE
combustion
emissions
Displaced
kWh credit LF methane
C02 equiv
for C seq Net CO2 eq
EPS foam cup (8.8 g)
Cup production 107 1,120 0 0 0 0 1,227
End-of-life 0 12.8 132 -62.3 0 0 82.2
Total 107 1,133 132 -62.3 0 0 1,309
LDPE-coated ppbd cup (19.8 g), max decomp
Cup production 30.0 713 0 0 0 0 743
End-of-life 0 12.1 27.6 -156 964 -35.7 812
Total 30.0 725 27.6 -156 964 -35.7 1,555
Wax-coated ppbd cup (31.3 g), max decomp
Cup production 31.0 1,275 0 0 0 0 1,306
End-of-life 0 17.3 43.3 -284 1,786 -66.2 1,496
Total 31.0 1,292 43.3 -284 1,786 -66.2 2,802
Solid PLA cup, based on sample weights (35 g)
Cup production 392 2,249 0 0 0 0 2,641
End-of-life 0 19.3 0 -112 0 -1,129 -1,222
Total 392 2,269 0 -112 0 -1,129 1419
Solid PLA cup, calculated using resin densities (32.4 g)
Cup production 101 2344 0 0 0 0 2,446
End-of-life 0 17.9 0 -104.1 0 -1045 -1132
Total 101 2,362 0 -104.1 0 -1045 1314
LDPE-coated ppbd cup (19.8 g), 50% decomp
Cup production 30.0 713 0 0 0 0 743
End-of-life 0 12.1 27.6 -114 482 -302 106
Total 30.0 725 27.6 -114 482 -302 849
Wax-coated ppbd cup (31.3 g), 50% decomp
Cup production 31.0 1,275 0 0 0 0 1,306
End-of-life 0 17.3 43.3 -207 893 -559 187
Total 31.0 1,292 43.3 -207 893 -559 1,493
LDPE-coated ppbd cup (19.8 g), 0% decomp
Cup production 30.0 713 0 0 0 0 743
End-of-life 0 12.1 27.6 -72.6 0 -568 -601
Total 30.0 725 27.6 -72.6 0 -568 143
Wax-coated ppbd cup (31.3 g), 0% decomp
Cup production 31.0 1,275 0 0 0 0 1,306
End-of-life 0 17.3 43.3 -130 0 -1,051 -1,121
Total 31.0 1,292 43.3 -130 0 -1,051 185
Source: Franklin Associates, A Division of ERG
Table 2-25. Greenhouse Gas Emissions for Average Weight 32-oz Cold Cups
(Pounds of CO2 Equivalents per 10,000 cups)
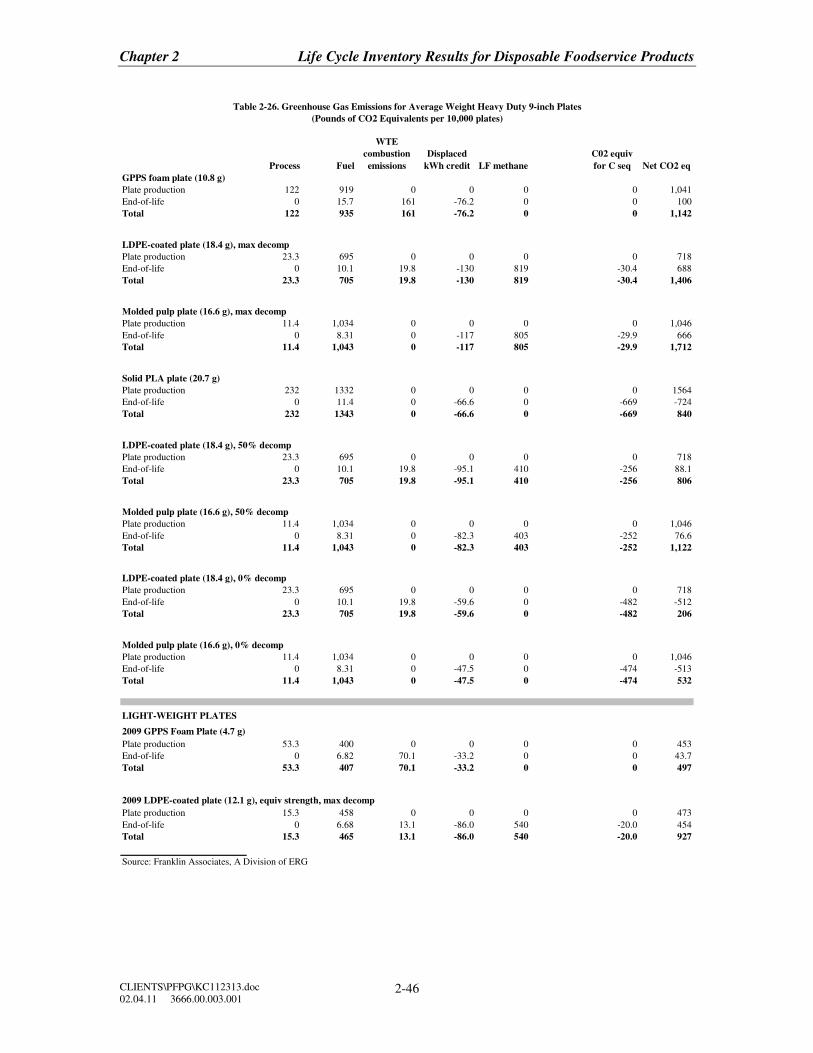
Chapter 2 Life Cycle Inventory Results for Disposable Foodservice Products
CLIENTS\PFPG\KC112313.doc
02.04.11 3666.00.003.001 2-46
Process Fuel
WTE
combustion
emissions
Displaced
kWh credit LF methane
C02 equiv
for C seq Net CO2 eq
GPPS foam plate (10.8 g)
Plate production 122 919 0 0 0 0 1,041
End-of-life 0 15.7 161 -76.2 0 0 100
Total 122 935 161 -76.2 0 0 1,142
LDPE-coated plate (18.4 g), max decomp
Plate production 23.3 695 0 0 0 0 718
End-of-life 0 10.1 19.8 -130 819 -30.4 688
Total 23.3 705 19.8 -130 819 -30.4 1,406
Molded pulp plate (16.6 g), max decomp
Plate production 11.4 1,034 0 0 0 0 1,046
End-of-life 0 8.31 0 -117 805 -29.9 666
Total 11.4 1,043 0 -117 805 -29.9 1,712
Solid PLA plate (20.7 g)
Plate production 232 1332 0 0 0 0 1564
End-of-life 0 11.4 0 -66.6 0 -669 -724
Total 232 1343 0 -66.6 0 -669 840
LDPE-coated plate (18.4 g), 50% decomp
Plate production 23.3 695 0 0 0 0 718
End-of-life 0 10.1 19.8 -95.1 410 -256 88.1
Total 23.3 705 19.8 -95.1 410 -256 806
Molded pulp plate (16.6 g), 50% decomp
Plate production 11.4 1,034 0 0 0 0 1,046
End-of-life 0 8.31 0 -82.3 403 -252 76.6
Total 11.4 1,043 0 -82.3 403 -252 1,122
LDPE-coated plate (18.4 g), 0% decomp
Plate production 23.3 695 0 0 0 0 718
End-of-life 0 10.1 19.8 -59.6 0 -482 -512
Total 23.3 705 19.8 -59.6 0 -482 206
Molded pulp plate (16.6 g), 0% decomp
Plate production 11.4 1,034 0 0 0 0 1,046
End-of-life 0 8.31 0 -47.5 0 -474 -513
Total 11.4 1,043 0 -47.5 0 -474 532
LIGHT-WEIGHT PLATES
2009 GPPS Foam Plate (4.7 g)
Plate production 53.3 400 0 0 0 0 453
End-of-life 0 6.82 70.1 -33.2 0 0 43.7
Total 53.3 407 70.1 -33.2 0 0 497
2009 LDPE-coated plate (12.1 g), equiv strength, max decomp
Plate production 15.3 458 0 0 0 0 473
End-of-life 0 6.68 13.1 -86.0 540 -20.0 454
Total 15.3 465 13.1 -86.0 540 -20.0 927
Source: Franklin Associates, A Division of ERG
Table 2-26. Greenhouse Gas Emissions for Average Weight Heavy Duty 9-inch Plates
(Pounds of CO2 Equivalents per 10,000 plates)
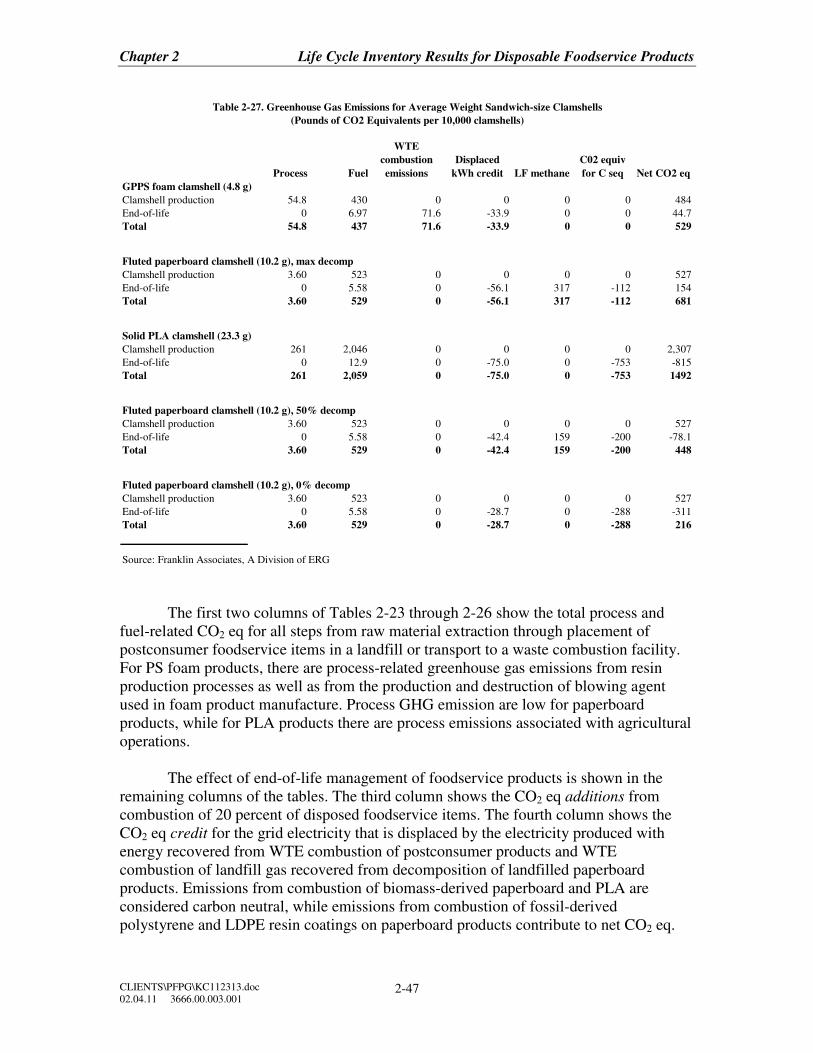
Chapter 2 Life Cycle Inventory Results for Disposable Foodservice Products
CLIENTS\PFPG\KC112313.doc
02.04.11 3666.00.003.001 2-47
Process Fuel
WTE
combustion
emissions
Displaced
kWh credit LF methane
C02 equiv
for C seq Net CO2 eq
GPPS foam clamshell (4.8 g)
Clamshell production 54.8 430 0 0 0 0 484
End-of-life 0 6.97 71.6 -33.9 0 0 44.7
Total 54.8 437 71.6 -33.9 0 0 529
Fluted paperboard clamshell (10.2 g), max decomp
Clamshell production 3.60 523 0 0 0 0 527
End-of-life 0 5.58 0 -56.1 317 -112 154
Total 3.60 529 0 -56.1 317 -112 681
Solid PLA clamshell (23.3 g)
Clamshell production 261 2,046 0 0 0 0 2,307
End-of-life 0 12.9 0 -75.0 0 -753 -815
Total 261 2,059 0 -75.0 0 -753 1492
Fluted paperboard clamshell (10.2 g), 50% decomp
Clamshell production 3.60 523 0 0 0 0 527
End-of-life 0 5.58 0 -42.4 159 -200 -78.1
Total 3.60 529 0 -42.4 159 -200 448
Fluted paperboard clamshell (10.2 g), 0% decomp
Clamshell production 3.60 523 0 0 0 0 527
End-of-life 0 5.58 0 -28.7 0 -288 -311
Total 3.60 529 0 -28.7 0 -288 216
Source: Franklin Associates, A Division of ERG
Table 2-27. Greenhouse Gas Emissions for Average Weight Sandwich-size Clamshells
(Pounds of CO2 Equivalents per 10,000 clamshells)
The first two columns of Tables 2-23 through 2-26 show the total process and
fuel-related CO2 eq for all steps from raw material extraction through placement of
postconsumer foodservice items in a landfill or transport to a waste combustion facility.
For PS foam products, there are process-related greenhouse gas emissions from resin
production processes as well as from the production and destruction of blowing agent
used in foam product manufacture. Process GHG emission are low for paperboard
products, while for PLA products there are process emissions associated with agricultural
operations.
The effect of end-of-life management of foodservice products is shown in the
remaining columns of the tables. The third column shows the CO2 eq additions from
combustion of 20 percent of disposed foodservice items. The fourth column shows the
CO2 eq credit for the grid electricity that is displaced by the electricity produced with
energy recovered from WTE combustion of postconsumer products and WTE
combustion of landfill gas recovered from decomposition of landfilled paperboard
products. Emissions from combustion of biomass-derived paperboard and PLA are
considered carbon neutral, while emissions from combustion of fossil-derived
polystyrene and LDPE resin coatings on paperboard products contribute to net CO2 eq.
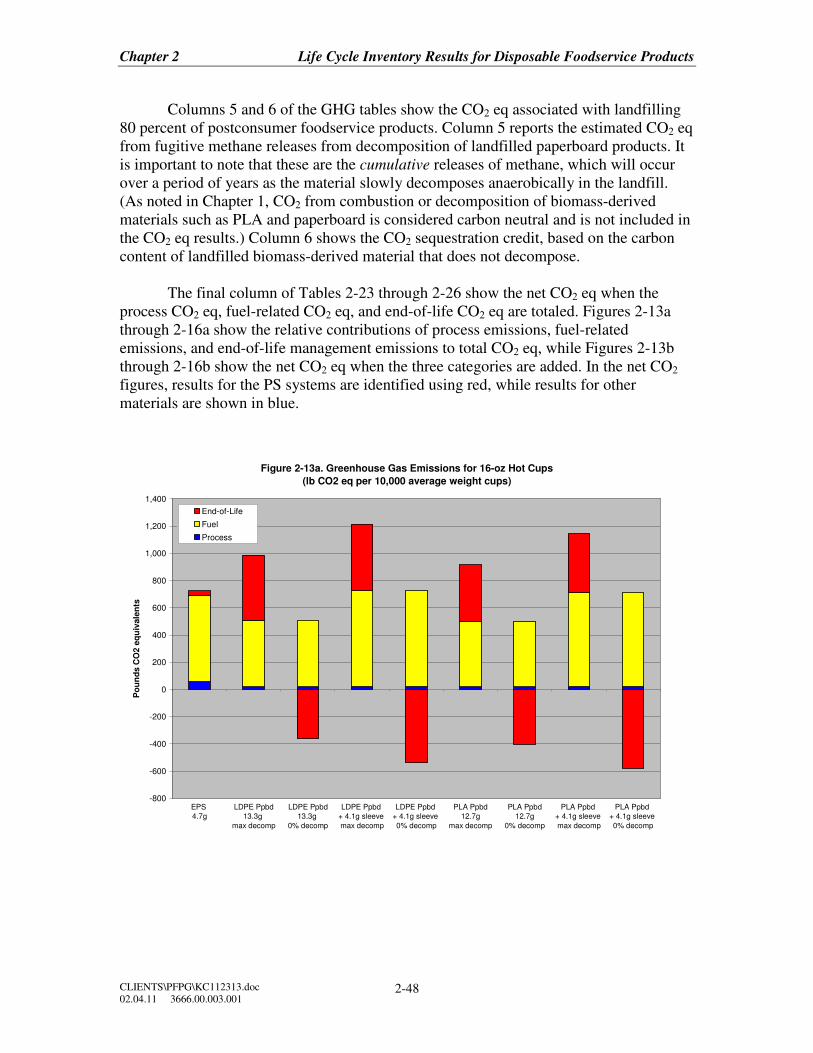
Chapter 2 Life Cycle Inventory Results for Disposable Foodservice Products
CLIENTS\PFPG\KC112313.doc
02.04.11 3666.00.003.001 2-48
Columns 5 and 6 of the GHG tables show the CO2 eq associated with landfilling
80 percent of postconsumer foodservice products. Column 5 reports the estimated CO2 eq
from fugitive methane releases from decomposition of landfilled paperboard products. It
is important to note that these are the cumulative releases of methane, which will occur
over a period of years as the material slowly decomposes anaerobically in the landfill.
(As noted in Chapter 1, CO2 from combustion or decomposition of biomass-derived
materials such as PLA and paperboard is considered carbon neutral and is not included in
the CO2 eq results.) Column 6 shows the CO2 sequestration credit, based on the carbon
content of landfilled biomass-derived material that does not decompose.
The final column of Tables 2-23 through 2-26 show the net CO2 eq when the
process CO2 eq, fuel-related CO2 eq, and end-of-life CO2 eq are totaled. Figures 2-13a
through 2-16a show the relative contributions of process emissions, fuel-related
emissions, and end-of-life management emissions to total CO2 eq, while Figures 2-13b
through 2-16b show the net CO2 eq when the three categories are added. In the net CO2
figures, results for the PS systems are identified using red, while results for other
materials are shown in blue.
Figure 2-13a. Greenhouse Gas Emissions for 16-oz Hot Cups
(lb CO2 eq per 10,000 average weight cups)
-800
-600
-400
-200
0
200
400
600
800
1,000
1,200
1,400
EPS
4.7g
LDPE Ppbd
13.3g
max decomp
LDPE Ppbd
13.3g
0% decomp
LDPE Ppbd
+ 4.1g sleeve
max decomp
LDPE Ppbd
+ 4.1g sleeve
0% decomp
PLA Ppbd
12.7g
max decomp
PLA Ppbd
12.7g
0% decomp
PLA Ppbd
+ 4.1g sleeve
max decomp
PLA Ppbd
+ 4.1g sleeve
0% decomp
Po
un
ds C
O2
eq
uiv
ale
nts
End-of-Life
Fuel
Process
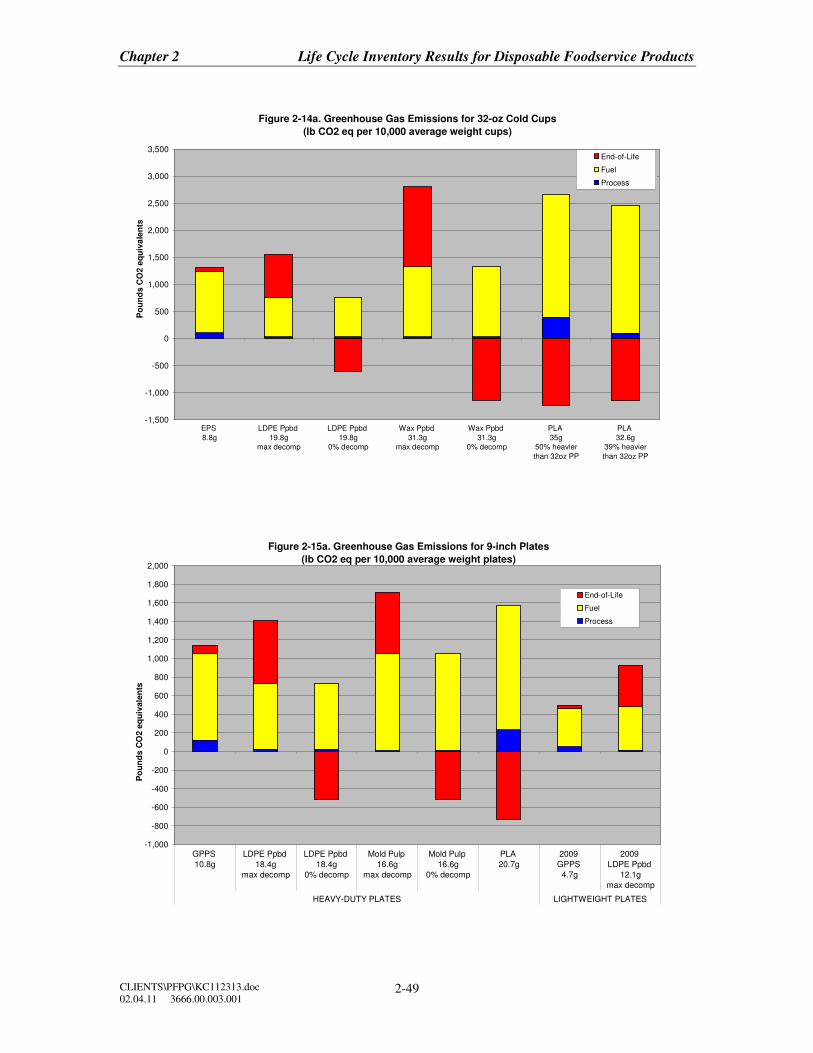
Chapter 2 Life Cycle Inventory Results for Disposable Foodservice Products
CLIENTS\PFPG\KC112313.doc
02.04.11 3666.00.003.001 2-49
Figure 2-14a. Greenhouse Gas Emissions for 32-oz Cold Cups
(lb CO2 eq per 10,000 average weight cups)
-1,500
-1,000
-500
0
500
1,000
1,500
2,000
2,500
3,000
3,500
EPS
8.8g
LDPE Ppbd
19.8g
max decomp
LDPE Ppbd
19.8g
0% decomp
Wax Ppbd
31.3g
max decomp
Wax Ppbd
31.3g
0% decomp
PLA
35g
50% heavier
than 32oz PP
PLA
32.6g
39% heavier
than 32oz PP
Po
un
ds C
O2 e
qu
iva
len
ts
End-of-Life
Fuel
Process
Figure 2-15a. Greenhouse Gas Emissions for 9-inch Plates
(lb CO2 eq per 10,000 average weight plates)
-1,000
-800
-600
-400
-200
0
200
400
600
800
1,000
1,200
1,400
1,600
1,800
2,000
GPPS
10.8g
LDPE Ppbd
18.4g
max decomp
LDPE Ppbd
18.4g
0% decomp
Mold Pulp
16.6g
max decomp
Mold Pulp
16.6g
0% decomp
PLA
20.7g
2009
GPPS
4.7g
2009
LDPE Ppbd
12.1g
max decomp
HEAVY-DUTY PLATES LIGHTWEIGHT PLATES
Po
un
ds C
O2 e
qu
ivale
nts
End-of-Life
Fuel
Process
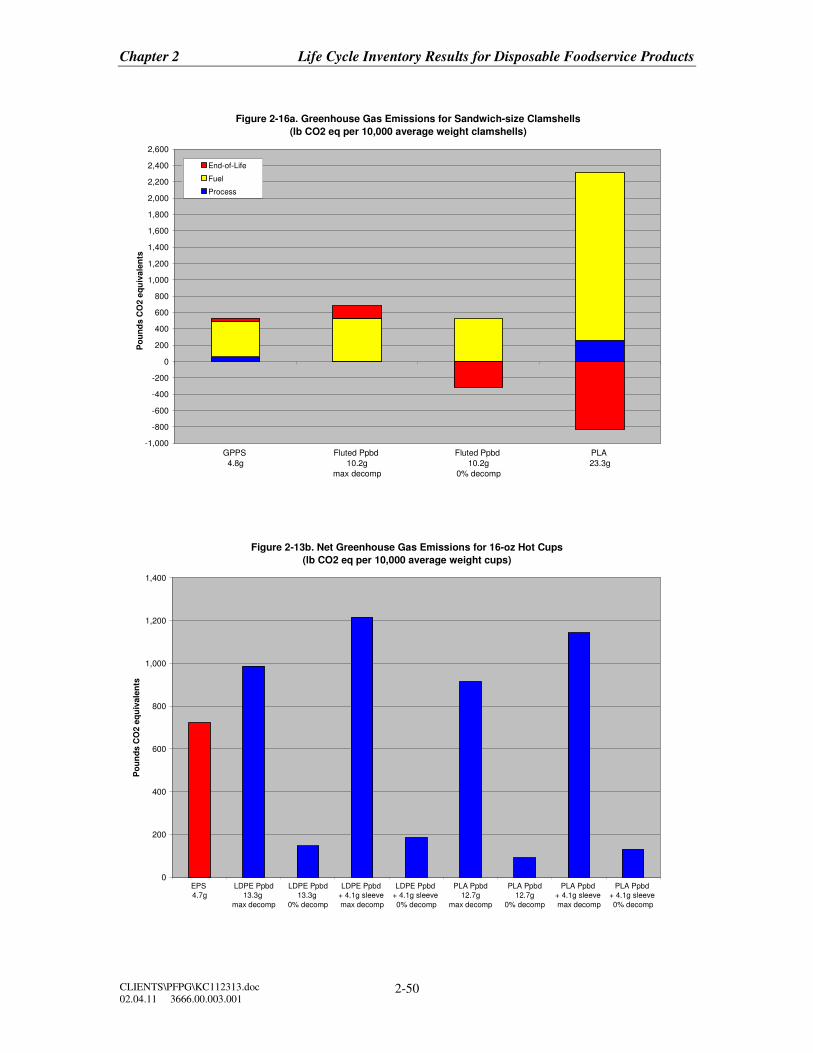
Chapter 2 Life Cycle Inventory Results for Disposable Foodservice Products
CLIENTS\PFPG\KC112313.doc
02.04.11 3666.00.003.001 2-50
Figure 2-16a. Greenhouse Gas Emissions for Sandwich-size Clamshells
(lb CO2 eq per 10,000 average weight clamshells)
-1,000
-800
-600
-400
-200
0
200
400
600
800
1,000
1,200
1,400
1,600
1,800
2,000
2,200
2,400
2,600
GPPS
4.8g
Fluted Ppbd
10.2g
max decomp
Fluted Ppbd
10.2g
0% decomp
PLA
23.3g
Po
un
ds C
O2 e
qu
ivale
nts
End-of-Life
Fuel
Process
Figure 2-13b. Net Greenhouse Gas Emissions for 16-oz Hot Cups
(lb CO2 eq per 10,000 average weight cups)
0
200
400
600
800
1,000
1,200
1,400
EPS
4.7g
LDPE Ppbd
13.3g
max decomp
LDPE Ppbd
13.3g
0% decomp
LDPE Ppbd
+ 4.1g sleeve
max decomp
LDPE Ppbd
+ 4.1g sleeve
0% decomp
PLA Ppbd
12.7g
max decomp
PLA Ppbd
12.7g
0% decomp
PLA Ppbd
+ 4.1g sleeve
max decomp
PLA Ppbd
+ 4.1g sleeve
0% decomp
Po
un
ds C
O2
eq
uiv
ale
nts
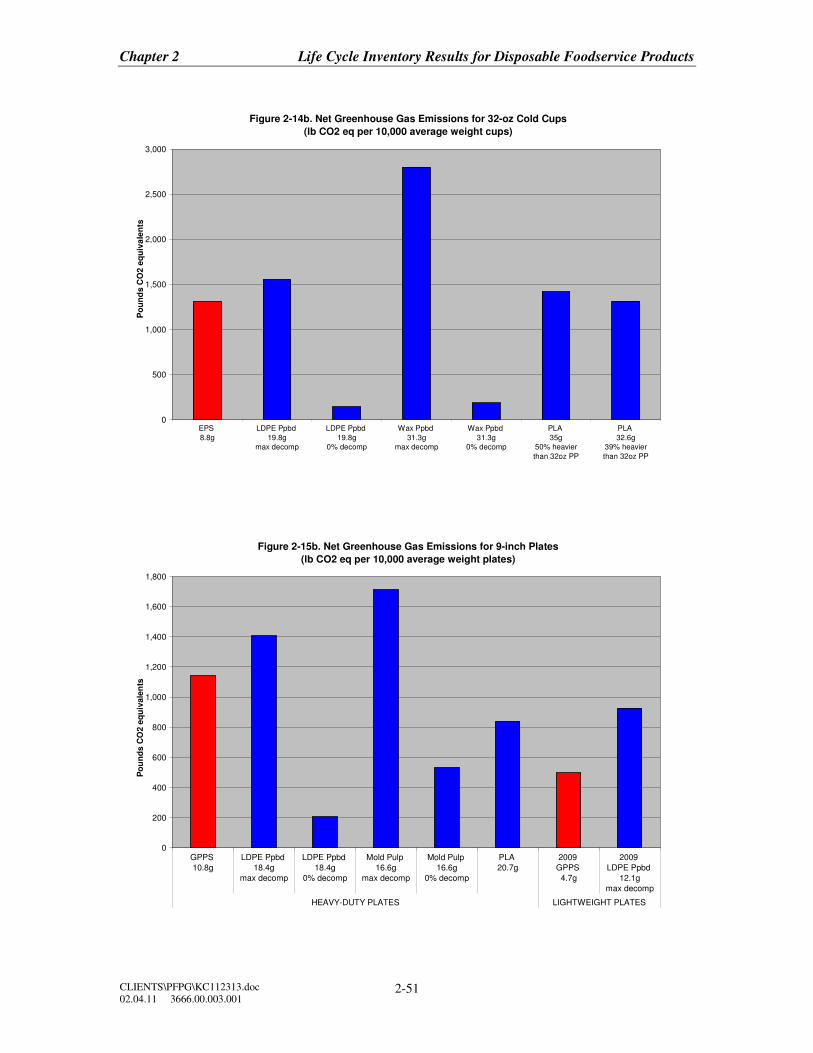
Chapter 2 Life Cycle Inventory Results for Disposable Foodservice Products
CLIENTS\PFPG\KC112313.doc
02.04.11 3666.00.003.001 2-51
Figure 2-14b. Net Greenhouse Gas Emissions for 32-oz Cold Cups
(lb CO2 eq per 10,000 average weight cups)
0
500
1,000
1,500
2,000
2,500
3,000
EPS
8.8g
LDPE Ppbd
19.8g
max decomp
LDPE Ppbd
19.8g
0% decomp
Wax Ppbd
31.3g
max decomp
Wax Ppbd
31.3g
0% decomp
PLA
35g
50% heavier
than 32oz PP
PLA
32.6g
39% heavier
than 32oz PP
Po
un
ds C
O2 e
qu
iva
len
ts
Figure 2-15b. Net Greenhouse Gas Emissions for 9-inch Plates
(lb CO2 eq per 10,000 average weight plates)
0
200
400
600
800
1,000
1,200
1,400
1,600
1,800
GPPS
10.8g
LDPE Ppbd
18.4g
max decomp
LDPE Ppbd
18.4g
0% decomp
Mold Pulp
16.6g
max decomp
Mold Pulp
16.6g
0% decomp
PLA
20.7g
2009
GPPS
4.7g
2009
LDPE Ppbd
12.1g
max decomp
HEAVY-DUTY PLATES LIGHTWEIGHT PLATES
Po
un
ds C
O2 e
qu
ivale
nts
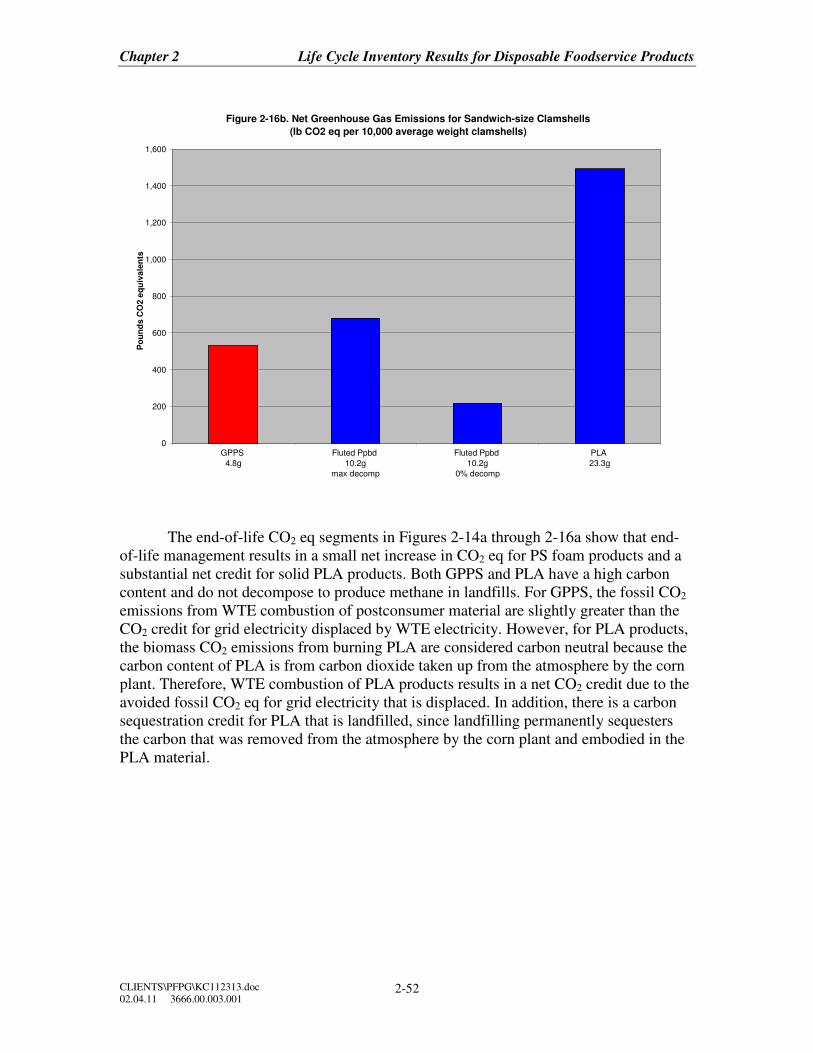
Chapter 2 Life Cycle Inventory Results for Disposable Foodservice Products
CLIENTS\PFPG\KC112313.doc
02.04.11 3666.00.003.001 2-52
Figure 2-16b. Net Greenhouse Gas Emissions for Sandwich-size Clamshells
(lb CO2 eq per 10,000 average weight clamshells)
0
200
400
600
800
1,000
1,200
1,400
1,600
GPPS
4.8g
Fluted Ppbd
10.2g
max decomp
Fluted Ppbd
10.2g
0% decomp
PLA
23.3g
Po
un
ds C
O2 e
qu
ivale
nts
The end-of-life CO2 eq segments in Figures 2-14a through 2-16a show that end-
of-life management results in a small net increase in CO2 eq for PS foam products and a
substantial net credit for solid PLA products. Both GPPS and PLA have a high carbon
content and do not decompose to produce methane in landfills. For GPPS, the fossil CO2
emissions from WTE combustion of postconsumer material are slightly greater than the
CO2 credit for grid electricity displaced by WTE electricity. However, for PLA products,
the biomass CO2 emissions from burning PLA are considered carbon neutral because the
carbon content of PLA is from carbon dioxide taken up from the atmosphere by the corn
plant. Therefore, WTE combustion of PLA products results in a net CO2 credit due to the
avoided fossil CO2 eq for grid electricity that is displaced. In addition, there is a carbon
sequestration credit for PLA that is landfilled, since landfilling permanently sequesters
the carbon that was removed from the atmosphere by the corn plant and embodied in the
PLA material.
Chapter 2 Life Cycle Inventory Results for Disposable Foodservice Products
CLIENTS\PFPG\KC112313.doc
02.04.11 3666.00.003.001 2-53
The net GHG effect of end-of-life management of paperboard foodservice items
depends on assumptions about decomposition and landfill gas management. The tables
and figures show that maximum decomposition of the biomass carbon content results in a
large net increase in end-of-life CO2 eq associated with emissions of methane into the
atmosphere. At maximum decomposition of bleached paperboard, there is little carbon
sequestered in the portion of the material that does not decompose. However, if the
bleached paperboard is assumed to decompose to only half of the maximum degree
observed in landfill simulation experiments, there is only a small net increase in end-of-
life CO2 eq. For cup sleeves and clamshells, the unbleached kraft used in these products
is less delignified than bleached kraft; therefore, less of the fiber decomposes and there is
a small net carbon sequestration credit at 50 percent decomposition. At zero percent
decomposition, no methane is produced, and all the biomass carbon in the paperboard
products is sequestered, resulting in a large net CO2 sequestration credit.
End-of-Life GHG Uncertainty. It is important to note that the end-of-life CO2
eq estimates have a larger uncertainty than other LCI emissions data. Some of the
modeling assumptions contributing to the uncertainty include the following:
• The CO2 emissions from WTE combustion of postconsumer materials are
estimated based on complete conversion of the carbon content of the
material to CO2.
• The end-of-life decomposition of paperboard products is modeled based
on results from landfill simulation experiments designed to maximize
decomposition. The ultimate degree of decomposition can be highly
variable in actual landfills where moisture, temperature, and other factors
differ from the experimental conditions.
• Results for bleached office paper decomposition were used to estimate
decomposition of the bleached paper content of the coated paperboard
products. There are no experimental landfill simulation studies on coated
paperboard foodservice items, so it is unknown to what extent the coatings
on these products affect the ultimate degree of decomposition of the paper
fraction.
• Electricity offset credits are based on average efficiencies for converting
combustion energy to electricity at municipal solid waste mass burn WTE
combustion facilities and landfill gas WTE facilities. Actual efficiencies
for individual energy recovery facilities will vary.
• Management of landfill methane is based on applying current landfill gas
management practices to the cumulative methane emissions from
decomposition of the material. However, the methane would be released
gradually over many years, during which time landfill gas collection may
be increased or WTE combustion of landfill gas may be increased.
Chapter 2 Life Cycle Inventory Results for Disposable Foodservice Products
CLIENTS\PFPG\KC112313.doc
02.04.11 3666.00.003.001 2-54
To address the effects of some of these uncertainties on the end-of-life CO2 eq for
paperboard products, additional sensitivity analysis is presented in Chapter 3.
Process and Fuel-related GHG by Substance. Tables 2-27 through 2-30 present
detail on the process and fuel-related CO2 eq by substance. The results in this table
(which correspond to the emissions shown in the first two columns of Tables 2-23
through 2-26) include cradle-to-production results for foodservice products, including
transport to a landfill or combustion facility but excluding estimated end-of-life GHG
effects associated with combustion or landfill decomposition. Thus, the results in Tables
2-27 through 2-30 do not include any emissions associated with EMR of products, since
EMR does not result in emissions unless the material is burned, e.g., in WTE combustion
facilities at end of life. The tables shows that fossil carbon dioxide is the main contributor
to process and fuel-related CO2 eq for PS foam and paperboard systems, accounting for at
least 88 percent of the total CO2 eq for all the systems studied. Methane emissions for PS
foam products account for approximately 10 percent of the total process and fuel-related
CO2 eq and are largely associated with the extraction and processing of natural gas, used
as one of the material inputs to polystyrene resin production and production of the
pentane blowing agent. For the solid PLA systems, fossil carbon dioxide is also the
largest contributor to the process and fuel-related CO2 eq, but nitrous oxide emissions
account for about 4 percent of the total. The nitrous oxide emissions are mainly
associated with agricultural operations.
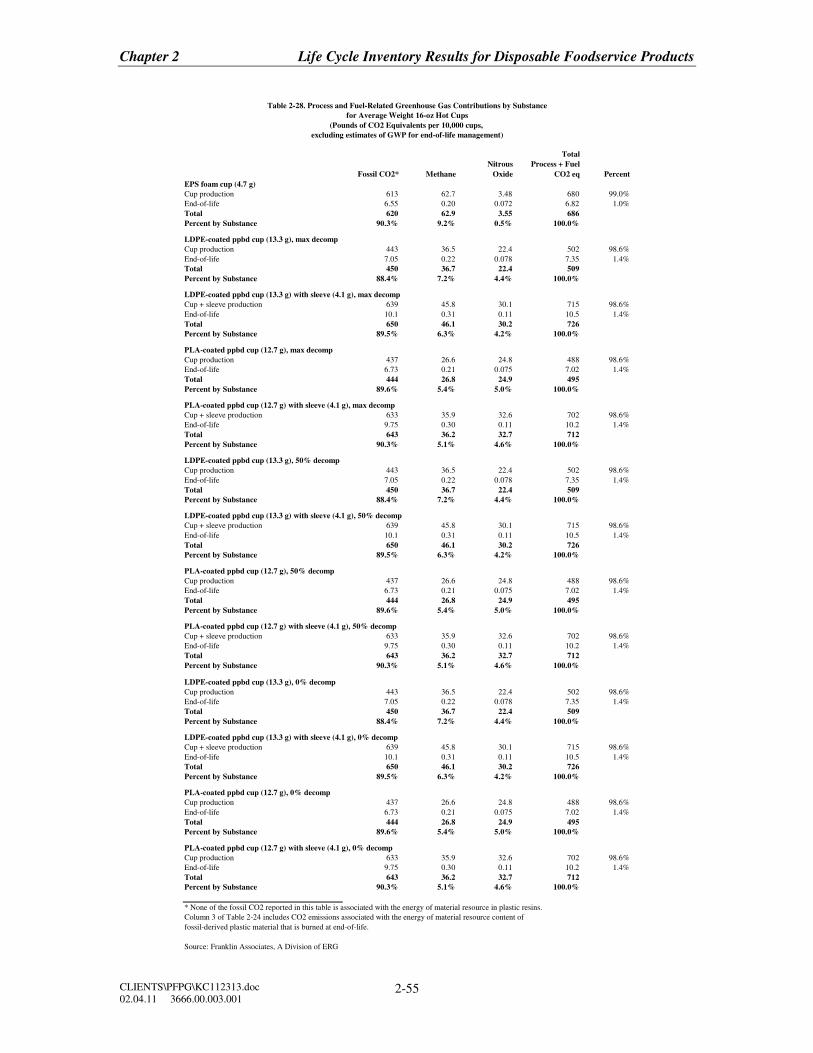
Chapter 2 Life Cycle Inventory Results for Disposable Foodservice Products
CLIENTS\PFPG\KC112313.doc
02.04.11 3666.00.003.001 2-55
Fossil CO2* Methane
Nitrous
Oxide
Total
Process + Fuel
CO2 eq Percent
EPS foam cup (4.7 g)
Cup production 613 62.7 3.48 680 99.0%
End-of-life 6.55 0.20 0.072 6.82 1.0%
Total 620 62.9 3.55 686
Percent by Substance 90.3% 9.2% 0.5% 100.0%
LDPE-coated ppbd cup (13.3 g), max decomp
Cup production 443 36.5 22.4 502 98.6%
End-of-life 7.05 0.22 0.078 7.35 1.4%
Total 450 36.7 22.4 509
Percent by Substance 88.4% 7.2% 4.4% 100.0%
LDPE-coated ppbd cup (13.3 g) with sleeve (4.1 g), max decomp
Cup + sleeve production 639 45.8 30.1 715 98.6%
End-of-life 10.1 0.31 0.11 10.5 1.4%
Total 650 46.1 30.2 726
Percent by Substance 89.5% 6.3% 4.2% 100.0%
PLA-coated ppbd cup (12.7 g), max decomp
Cup production 437 26.6 24.8 488 98.6%
End-of-life 6.73 0.21 0.075 7.02 1.4%
Total 444 26.8 24.9 495
Percent by Substance 89.6% 5.4% 5.0% 100.0%
PLA-coated ppbd cup (12.7 g) with sleeve (4.1 g), max decomp
Cup + sleeve production 633 35.9 32.6 702 98.6%
End-of-life 9.75 0.30 0.11 10.2 1.4%
Total 643 36.2 32.7 712
Percent by Substance 90.3% 5.1% 4.6% 100.0%
LDPE-coated ppbd cup (13.3 g), 50% decomp
Cup production 443 36.5 22.4 502 98.6%
End-of-life 7.05 0.22 0.078 7.35 1.4%
Total 450 36.7 22.4 509
Percent by Substance 88.4% 7.2% 4.4% 100.0%
LDPE-coated ppbd cup (13.3 g) with sleeve (4.1 g), 50% decomp
Cup + sleeve production 639 45.8 30.1 715 98.6%
End-of-life 10.1 0.31 0.11 10.5 1.4%
Total 650 46.1 30.2 726
Percent by Substance 89.5% 6.3% 4.2% 100.0%
PLA-coated ppbd cup (12.7 g), 50% decomp
Cup production 437 26.6 24.8 488 98.6%
End-of-life 6.73 0.21 0.075 7.02 1.4%
Total 444 26.8 24.9 495
Percent by Substance 89.6% 5.4% 5.0% 100.0%
PLA-coated ppbd cup (12.7 g) with sleeve (4.1 g), 50% decomp
Cup + sleeve production 633 35.9 32.6 702 98.6%
End-of-life 9.75 0.30 0.11 10.2 1.4%
Total 643 36.2 32.7 712
Percent by Substance 90.3% 5.1% 4.6% 100.0%
LDPE-coated ppbd cup (13.3 g), 0% decomp
Cup production 443 36.5 22.4 502 98.6%
End-of-life 7.05 0.22 0.078 7.35 1.4%
Total 450 36.7 22.4 509
Percent by Substance 88.4% 7.2% 4.4% 100.0%
LDPE-coated ppbd cup (13.3 g) with sleeve (4.1 g), 0% decomp
Cup + sleeve production 639 45.8 30.1 715 98.6%
End-of-life 10.1 0.31 0.11 10.5 1.4%
Total 650 46.1 30.2 726
Percent by Substance 89.5% 6.3% 4.2% 100.0%
PLA-coated ppbd cup (12.7 g), 0% decomp
Cup production 437 26.6 24.8 488 98.6%
End-of-life 6.73 0.21 0.075 7.02 1.4%
Total 444 26.8 24.9 495
Percent by Substance 89.6% 5.4% 5.0% 100.0%
PLA-coated ppbd cup (12.7 g) with sleeve (4.1 g), 0% decomp
Cup production 633 35.9 32.6 702 98.6%
End-of-life 9.75 0.30 0.11 10.2 1.4%
Total 643 36.2 32.7 712
Percent by Substance 90.3% 5.1% 4.6% 100.0%
* None of the fossil CO2 reported in this table is associated with the energy of material resource in plastic resins.
Column 3 of Table 2-24 includes CO2 emissions associated with the energy of material resource content of
fossil-derived plastic material that is burned at end-of-life.
Source: Franklin Associates, A Division of ERG
Table 2-28. Process and Fuel-Related Greenhouse Gas Contributions by Substance
for Average Weight 16-oz Hot Cups
excluding estimates of GWP for end-of-life management)
(Pounds of CO2 Equivalents per 10,000 cups,

Chapter 2 Life Cycle Inventory Results for Disposable Foodservice Products
CLIENTS\PFPG\KC112313.doc
02.04.11 3666.00.003.001 2-56
Fossil CO2* Methane
Nitrous
Oxide
Total
Process + Fuel
CO2 eq Percent
EPS foam cup (8.8 g)
Cup production 1,106 115 6.24 1,227 99.0%
End-of-life 12.3 0.38 0.13 12.8 1.0%
Total 1,119 115 6.37 1,240
Percent by Substance 90.2% 9.3% 0.5% 100.0%
LDPE-coated ppbd cup (19.8 g), max decomp
Cup production 653 53.4 37.0 743 98.4%
End-of-life 11.6 0.36 0.13 12.1 1.6%
Total 665 53.7 37.1 755
Percent by Substance 88.0% 7.1% 4.9% 100.0%
Wax-coated ppbd cup (31.3 g), max decomp
Cup production 1,160 77.2 68.4 1,306 98.7%
End-of-life 16.6 0.52 0.18 17.3 1.3%
Total 1,177 77.7 68.6 1,323
Percent by Substance 88.9% 5.9% 5.2% 100.0%
Solid PLA cup, based on sample weights (35 g)
Cup production 2,382 157 103 2,641 99.3%
End-of-life 18.5 0.58 0.21 19.3 0.7%
Total 2,400 157 103 2,661
Percent by Substance 90.2% 5.9% 3.9% 100.0%
Solid PLA cup, calculated using resin densities (32.4 g)
Cup production 2,205 145.3 95 2,446 99.3%
End-of-life 17.1 0.53 0.19 17.9 0.7%
Total 2,222 145.8 95 2,464
Percent by Substance 90.2% 5.9% 3.9% 100.0%
LDPE-coated ppbd cup (19.8 g), 50% decomp
Cup production 653 53.4 37.0 743 98.4%
End-of-life 11.6 0.36 0.13 12.1 1.6%
Total 665 53.7 37.1 755
Percent by Substance 88.0% 7.1% 4.9% 100.0%
Wax-coated ppbd cup (31.3 g), 50% decomp
Cup production 1,160 77.2 68.4 1,306 98.7%
End-of-life 16.6 0.52 0.18 17.3 1.3%
Total 1,177 77.7 68.6 1,323
Percent by Substance 88.9% 5.9% 5.2% 100.0%
LDPE-coated ppbd cup (19.8 g), 0% decomp
Cup production 653 53.4 37.0 743 98.4%
End-of-life 11.6 0.36 0.13 12.1 1.6%
Total 665 53.7 37.1 755
Percent by Substance 88.0% 7.1% 4.9% 100.0%
Wax-coated ppbd cup (31.3 g), 0% decomp
Cup production 1,160 77.2 68.4 1,306 98.7%
End-of-life 16.6 0.52 0.18 17.3 1.3%
Total 1,177 77.7 68.6 1,323
Percent by Substance 88.9% 5.9% 5.2% 100.0%
* None of the fossil CO2 reported in this table is associated with the energy of material resource in plastic resins.
Column 3 of Table 2-25 includes CO2 emissions associated with the energy of material resource content of
fossil-derived plastic material that is burned at end-of-life.
Source: Franklin Associates, A Division of ERG
Table 2-29. Process and Fuel-Related Greenhouse Gas Contributions by Substance
for Average Weight 32-oz Cold Cups
excluding estimates of GWP for end-of-life management)
(Pounds of CO2 Equivalents per 10,000 cups,

Chapter 2 Life Cycle Inventory Results for Disposable Foodservice Products
CLIENTS\PFPG\KC112313.doc
02.04.11 3666.00.003.001 2-57
Fossil CO2* Methane
Nitrous
Oxide
Total
Process + Fuel
CO2 eq Percent
GPPS foam plate (10.8 g)
Plate production 933 104 4.98 1,041 98.5%
End-of-life 15.1 0.47 0.16 15.7 1.5%
Total 948 104 5.14 1,057
Percent by Substance 89.7% 9.8% 0.5% 100.0%
LDPE-coated plate (18.4 g), max decomp
Plate production 638 48.2 32.0 718 98.6%
End-of-life 9.72 0.30 0.11 10.1 1.4%
Total 647 48.5 32.1 728
Percent by Substance 88.9% 6.7% 4.4% 100.0%
Molded pulp plate (16.6 g), max decomp
Plate production 947 54.5 43.8 1,046 99.2%
End-of-life 7.97 0.25 0.089 8.31 0.8%
Total 955 54.8 43.9 1,054
Percent by Substance 90.6% 5.2% 4.2% 100.0%
Solid PLA plate (20.7 g)
Plate production 1,410 92.9 61 1,564 99.3%
End-of-life 11.0 0.34 0.12 11.4 0.7%
Total 1,421 93.3 61 1,576
Percent by Substance 90.2% 5.9% 3.9% 100.0%
LDPE-coated plate (18.4 g), 50% decomp
Plate production 638 48.2 32.0 718 98.6%
End-of-life 9.72 0.30 0.11 10.1 1.4%
Total 647 48.5 32.1 728
Percent by Substance 88.9% 6.7% 4.4% 100.0%
Molded pulp plate (16.6 g), 50% decomp
Plate production 947 54.5 43.8 1,046 99.2%
End-of-life 7.97 0.25 0.089 8.31 0.8%
Total 955 54.8 43.9 1,054
Percent by Substance 90.6% 5.2% 4.2% 100.0%
LDPE-coated plate (18.4 g), 0% decomp
Plate production 638 48.2 32.0 718 98.6%
End-of-life 9.72 0.30 0.11 10.1 1.4%
Total 647 48.5 32.1 728
Percent by Substance 88.9% 6.7% 4.4% 100.0%
Molded pulp plate (16.6 g), 0% decomp
Plate production 947 54.5 43.8 1,046 99.2%
End-of-life 7.97 0.25 0.089 8.31 0.8%
Total 955 54.8 43.9 1,054
Percent by Substance 90.6% 5.2% 4.2% 100.0%
LIGHT-WEIGHT PLATES
2009 GPPS Foam Plate (4.7 g)
Plate production 406 45.1 2.17 453 98.5%
End-of-life 6.55 0.20 0.072 6.82 1.5%
Total 412 45.3 2.24 460
Percent by Substance 89.7% 9.8% 0.5% 100.0%
2009 LDPE-coated plate (12.1 g), equiv strength, max decomp
Plate production 420 31.8 21.1 473 98.6%
End-of-life 6.41 0.20 0.071 6.68 1.4%
Total 427 32.0 21.2 480
Percent by Substance 88.9% 6.7% 4.4% 100.0%
* None of the fossil CO2 reported in this table is associated with the energy of material resource in plastic resins.
Column 3 of Table 2-26 includes CO2 emissions associated with the energy of material resource content of
fossil-derived plastic material that is burned at end-of-life.
Source: Franklin Associates, A Division of ERG
Table 2-30. Process and Fuel-Related Greenhouse Gas Contributions by Substance
for Average Weight Heavy Duty 9-inch Plates
excluding estimates of GWP for end-of-life management)
(Pounds of CO2 Equivalents per 10,000 plates,

Chapter 2 Life Cycle Inventory Results for Disposable Foodservice Products
CLIENTS\PFPG\KC112313.doc
02.04.11 3666.00.003.001 2-58
Fossil CO2* Methane
Nitrous
Oxide
Total
Process + Fuel
CO2 eq Percent
GPPS foam clamshell (4.8 g)
Clamshell production 436 45.8 2.39 484 98.6%
End-of-life 6.69 0.21 0.073 6.97 1.4%
Total 443 46.0 2.47 491
Percent by Substance 90.1% 9.4% 0.5% 100.0%
Fluted paperboard clamshell (10.2 g), max decomp
Clamshell production 484 22.1 20.4 527 99.0%
End-of-life 5.36 0.17 0.060 5.58 1.0%
Total 489 22.3 20.4 532
Percent by Substance 92.0% 4.2% 3.8% 100.0%
Solid PLA clamshell (23.3 g)
Clamshell production 2,091 132 84 2,307 99.4%
End-of-life 12.3 0.38 0.14 12.9 0.6%
Total 2,103 133 84 2,320
Percent by Substance 90.6% 5.7% 3.6% 100.0%
Fluted paperboard clamshell (10.2 g), 50% decomp
Clamshell production 484 22.1 20.4 527 99.0%
End-of-life 5.36 0.17 0.060 5.58 1.0%
Total 489 22.3 20.4 532
Percent by Substance 92.0% 4.2% 3.8% 100.0%
Fluted paperboard clamshell (10.2 g), 0% decomp
Clamshell production 484 22.1 20.4 527 99.0%
End-of-life 5.36 0.17 0.060 5.58 1.0%
Total 489 22.3 20.4 532
Percent by Substance 92.0% 4.2% 3.8% 100.0%
* None of the fossil CO2 reported in this table is associated with the energy of material resource in plastic resins.
Column 3 of Table 2-27 includes CO2 emissions associated with the energy of material resource content of
fossil-derived plastic material that is burned at end-of-life.
Source: Franklin Associates, A Division of ERG
Table 2-31. Process and Fuel-Related Greenhouse Gas Contributions by Substance
for Average Weight Sandwich-size Clamshells
excluding estimates of GWP for end-of-life management)
(Pounds of CO2 Equivalents per 10,000 clamshells,

Chapter 2 Life Cycle Inventory Results for Disposable Foodservice Products
CLIENTS\PFPG\KC112313.doc
02.04.11 3666.00.003.001 2-59
Water Use
The goal of the water use analysis was to identify water use for each unit process
for each foodservice product and add the water use data to the unit process data sets to
construct a full life cycle model of water use for each product system. However, it was
not possible to meet this goal.
Although water use is increasingly becoming a focus in life cycle assessments,
reliable and complete water use data are currently not available on a unit process level for
many industrial processes and materials. This results in data gaps when attempting to
construct cradle-to-product models for product systems on a unit process basis. In
addition, available water data may not clearly distinguish between the type of use
(process water, cooling water), source of the water used (groundwater, river, lake, ocean,
etc.), or whether the water is recirculated or consumed. Without differentiation between
consumptive and non-consumptive uses of water, the water results shown throughout this
report are referred to as water use rather than water consumption.
With the lack of consistency and detail in how water use is reported, different
water use data sets for the same process or material can show wide variations. For
example, a data set that reports only consumptive use of cooling water might show much
lower water use than a data set for the same process that also includes the volume of
cooling water that recirculates through manufacturing equipment. Therefore, the water
use results presented here have a higher uncertainty than other life cycle inventory
results. The data sources, assumptions, and limitations of the water use results are
described in more detail in Appendix A.
For plastic resins and resin coatings on paperboard products, cradle-to-resin water
use data from PlasticsEurope Ecoprofiles was used. The water use data in Ecoprofiles is
fully aggregated data that includes process water use, cooling water used for the
processes, and cooling water associated with production of the electricity used in the
processes. Because similar technologies are used for production of resins in the U.S. and
in Europe, it is assumed that the Ecoprofiles data provide a good approximation of water
use for U.S. resin production.
Several sources of water use data for paperboard production were evaluated, and
all reported use of substantial volumes of water for process water and cooling. The water
modeling for paperboard foodservice products in this analysis is based on Ecoinvent data
sets for water use for production of pulp and water use for production of paper from pulp.
These were the best-documented data sets available and were similar in overall water
requirements to the other data sets evaluated.
Chapter 2 Life Cycle Inventory Results for Disposable Foodservice Products
CLIENTS\PFPG\KC112313.doc
02.04.11 3666.00.003.001 2-60
The water use modeling for PLA was based on NatureWorks Ingeo data published
as a rolled-up cradle-to-resin data set in the U.S. LCI Database. The NatureWorks data
include water used for corn irrigation, water used in corn wet milling processes (allocated
among the wet mill coproducts), and water used in PLA production. In the Ingeo cradle-
to-resin dataset, about 44 percent of the reported water use is irrigation water, 34 percent
is water used in processes that convert the corn to PLA, and about 23 percent is cooling
water.
The corn irrigation water use included in the NatureWorks data set is specific to
the Nebraska and Iowa counties that supply corn to the Blair, Nebraska Ingeo plant. Only
9.4 percent of the corn acreage in these counties is irrigated, compared to about 60
percent of all corn acreage in Nebraska. In addition, the water use per irrigated acre for
these counties is lower than the average water use per irrigated corn acre, because there is
more rainfall in eastern Nebraska and western Iowa compared to other corn-growing
regions of the Midwest. The average amount of water applied per irrigated acre for the
Blair plant’s supplying counties was reported by NatureWorks as 127 mm (5 inches). In
contrast, recent U.S. Department of Agriculture Farm and Ranch Irrigation Surveys
reported averages of 14.4 inches of water per irrigated acre of Nebraska corn in 2003 and
9.6 inches of water per irrigated acre of Nebraska corn in 2008. Different sourcing for the
corn used for PLA could have a significant effect on the water use results.
The results shown in the tables and figures include process water and cooling
water that is directly used in producing the foodservice product materials, as well as
cooling water for production of the electricity used in these processes. Further description
of electricity cooling water use is provided in Appendix A. Data on cooling water use by
foodservice product converting equipment was not available for all types of converting
processes, and equipment cooling water is generally recirculated in closed-loop systems;
therefore, for the operations used to convert paperboard, PS resin, and PLA resin into
finished products, only electricity-related water use is included. Cooling water use per
pound of product is higher for production of PS foam products and PLA products
compared to paperboard products, since molding and thermoforming of resins requires
more electricity compared to the processes used to convert paperboard into cups, plates,
and clamshells.
Water use results for polystyrene foam products are dominated by cooling water,
which includes the cooling water in the aggregated cradle-to-resin data as well as the
cooling water associated with the electricity used to convert the resin into foodservice
products. Process water makes a small contribution to the total water use for PS foam
products, but accounts for 35 to 40 percent of total water use for paperboard product
systems. Water use results for average weight paperboard products are 20 to 30 percent
higher than water use for corresponding average weight PS foam products.
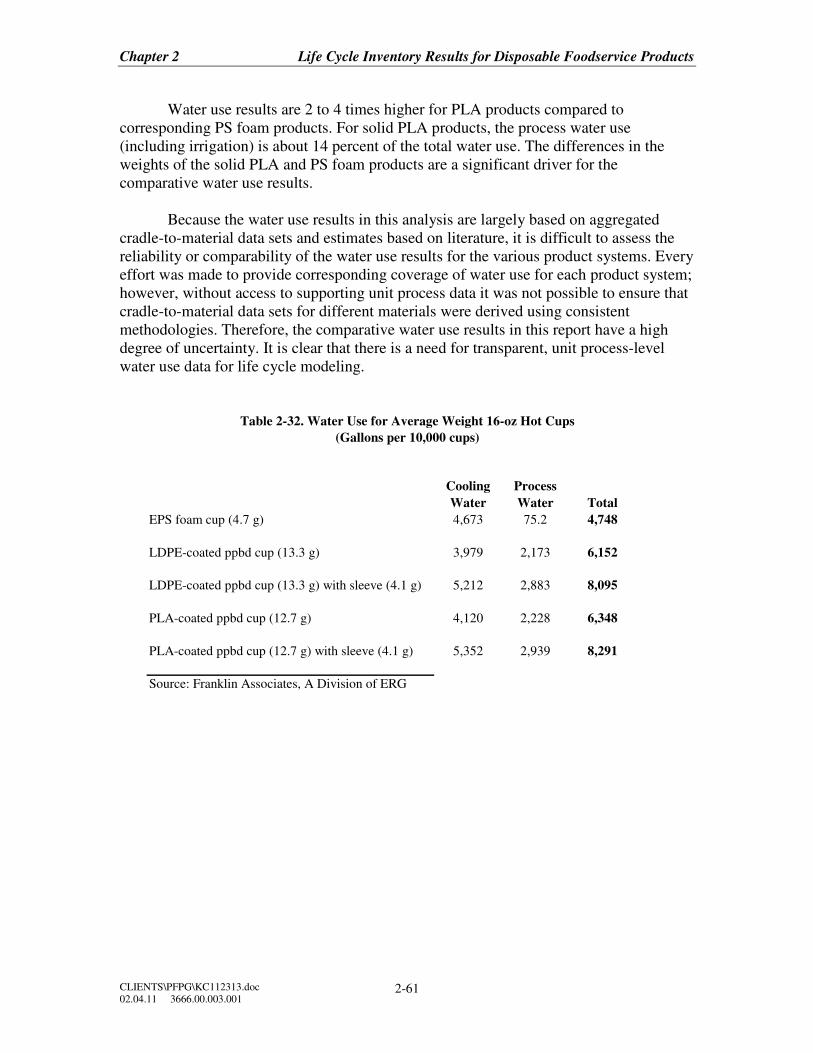
Chapter 2 Life Cycle Inventory Results for Disposable Foodservice Products
CLIENTS\PFPG\KC112313.doc
02.04.11 3666.00.003.001 2-61
Water use results are 2 to 4 times higher for PLA products compared to
corresponding PS foam products. For solid PLA products, the process water use
(including irrigation) is about 14 percent of the total water use. The differences in the
weights of the solid PLA and PS foam products are a significant driver for the
comparative water use results.
Because the water use results in this analysis are largely based on aggregated
cradle-to-material data sets and estimates based on literature, it is difficult to assess the
reliability or comparability of the water use results for the various product systems. Every
effort was made to provide corresponding coverage of water use for each product system;
however, without access to supporting unit process data it was not possible to ensure that
cradle-to-material data sets for different materials were derived using consistent
methodologies. Therefore, the comparative water use results in this report have a high
degree of uncertainty. It is clear that there is a need for transparent, unit process-level
water use data for life cycle modeling.
Cooling
Water
Process
Water Total
EPS foam cup (4.7 g) 4,673 75.2 4,748
LDPE-coated ppbd cup (13.3 g) 3,979 2,173 6,152
LDPE-coated ppbd cup (13.3 g) with sleeve (4.1 g) 5,212 2,883 8,095
PLA-coated ppbd cup (12.7 g) 4,120 2,228 6,348
PLA-coated ppbd cup (12.7 g) with sleeve (4.1 g) 5,352 2,939 8,291
Source: Franklin Associates, A Division of ERG
Table 2-32. Water Use for Average Weight 16-oz Hot Cups
(Gallons per 10,000 cups)

Chapter 2 Life Cycle Inventory Results for Disposable Foodservice Products
CLIENTS\PFPG\KC112313.doc
02.04.11 3666.00.003.001 2-62
Cooling
Water
Process
Water Total
EPS foam cup (8.8 g) 8,301 139 8,441
LDPE-coated ppbd cup (19.8 g) 5,628 3,650 9,278
Wax-coated ppbd cup (31.3 g) 10,506 6,764 17,271
Solid PLA cup, based on sample weights (35 g) 20,581 3,413 23,994
Solid PLA cup, calculated using resin densities (32.4 g) 19,057 3,160 22,217
Source: Franklin Associates, A Division of ERG
Table 2-33. Water Use for Average Weight 32-oz Cold Cups
(Gallons per 10,000 cups)
Cooling
Water
Process
Water Total
GPPS foam plate (10.8 g) 7,216 249 7,466
LDPE-coated plate (18.4 g) 5,798 3,100 8,898
Molded pulp plate (16.6 g) 5,821 3,196 9,017
Solid PLA plate (20.7 g) 12,187 2,021 14,208
Source: Franklin Associates, A Division of ERG
Table 2-34. Water Use for Average Weight Heavy Duty 9-inch Plates
(Gallons per 10,000 plates)
Cooling
Water
Process
Water Total
GPPS foam clamshell (4.8 g) 3,761 112 3,873
Fluted paperboard clamshell (10.2 g) 3,169 1,783 4,951
Solid PLA clamshell (23.3 g) 13,721 2,275 15,996
Source: Franklin Associates, A Division of ERG
Table 2-35. Water Use for Average Weight Sandwich-size Clamshells
(Gallons per 10,000 clamshells)
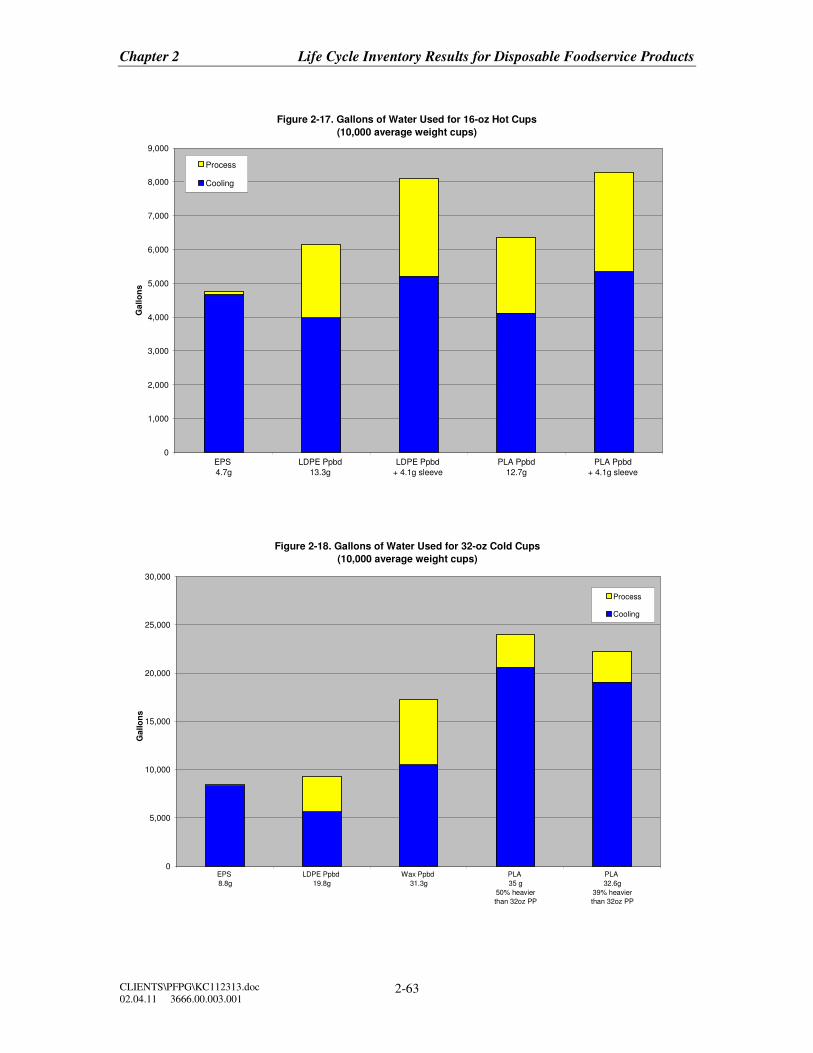
Chapter 2 Life Cycle Inventory Results for Disposable Foodservice Products
CLIENTS\PFPG\KC112313.doc
02.04.11 3666.00.003.001 2-63
Figure 2-17. Gallons of Water Used for 16-oz Hot Cups
(10,000 average weight cups)
0
1,000
2,000
3,000
4,000
5,000
6,000
7,000
8,000
9,000
EPS
4.7g
LDPE Ppbd
13.3g
LDPE Ppbd
+ 4.1g sleeve
PLA Ppbd
12.7g
PLA Ppbd
+ 4.1g sleeve
Gallo
ns
Process
Cooling
Figure 2-18. Gallons of Water Used for 32-oz Cold Cups
(10,000 average weight cups)
0
5,000
10,000
15,000
20,000
25,000
30,000
EPS
8.8g
LDPE Ppbd
19.8g
Wax Ppbd
31.3g
PLA
35 g
50% heavier
than 32oz PP
PLA
32.6g
39% heavier
than 32oz PP
Gallo
ns
Process
Cooling
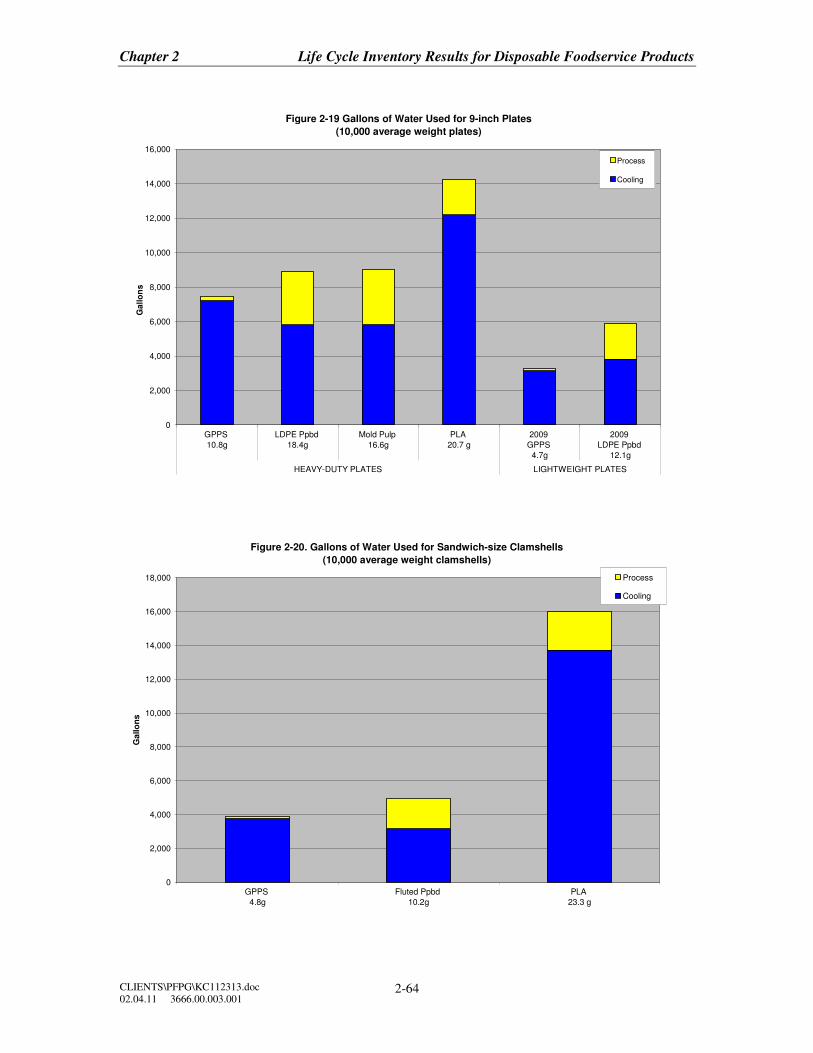
Chapter 2 Life Cycle Inventory Results for Disposable Foodservice Products
CLIENTS\PFPG\KC112313.doc
02.04.11 3666.00.003.001 2-64
Figure 2-19 Gallons of Water Used for 9-inch Plates
(10,000 average weight plates)
0
2,000
4,000
6,000
8,000
10,000
12,000
14,000
16,000
GPPS
10.8g
LDPE Ppbd
18.4g
Mold Pulp
16.6g
PLA
20.7 g
2009
GPPS
4.7g
2009
LDPE Ppbd
12.1g
HEAVY-DUTY PLATES LIGHTWEIGHT PLATES
Gallo
ns
Process
Cooling
Figure 2-20. Gallons of Water Used for Sandwich-size Clamshells
(10,000 average weight clamshells)
0
2,000
4,000
6,000
8,000
10,000
12,000
14,000
16,000
18,000
GPPS
4.8g
Fluted Ppbd
10.2g
PLA
23.3 g
Gallo
ns
Process
Cooling
Chapter 2 Life Cycle Inventory Results for Disposable Foodservice Products
CLIENTS\PFPG\KC112313.doc
02.04.11 3666.00.003.001 2-65
KEY OBSERVATIONS AND CONCLUSIONS
The observations and conclusions regarding energy, solid waste, water use and
greenhouse gases are all sensitive to the assumptions and choices made in this study
about
• Product weight
• Inclusion of bio-based EMR
• Solid waste reporting basis (by weight or by volume)
• Decomposition of products in landfills and management of methane
produced from decomposition
• Exclusion of indirect land use change
• Corn irrigation practices
• Choice of allocation method.
The following observations and conclusions are based on the assumptions made
in this study and apply to the specific product weights analyzed in this report. The results,
observations, and conclusions should not be considered representative of the full range of
product weights that may be available in the marketplace.
• Influence of Product Weight on LCI Results: The majority of the
environmental burdens for producing each type of foodservice item is
from the production of the materials used. Material production burdens for
a product are calculated as the product of the burdens per pound of
material multiplied by the pounds of material used in the product system.
Many grades and weights of disposable foodservice products are available
in the marketplace. As shown in Table ES-1, all paperboard and PLA
products analyzed in this study are heavier than the corresponding average
weight PS foam product. Comparisons of products with different weight
ratios may yield different conclusions. This can be seen in the plate tables,
where there are large differences in the results for average weight high-
grade plates and results for lighter weight plates from a 2009 LCI study.
• Energy: For the product weights modeled, the total energy requirements
for average PS foam products across the different product categories are
generally lower than total energy requirements for the equivalent number
of (heavier) PLA or paperboard products analyzed. Total energy
requirements for LDPE-coated cold cups, LDPE-coated plates, and
molded pulp plates are not significantly different from energy
requirements for the corresponding PS products.
Chapter 2 Life Cycle Inventory Results for Disposable Foodservice Products
CLIENTS\PFPG\KC112313.doc
02.04.11 3666.00.003.001 2-66
• Net Energy Consumption: A significant portion of the total energy
requirements for each product is energy of material resource. Some of the
EMR remains embodied in the postconsumer products that are sent to
landfills at end of life. Some energy is also recovered from postconsumer
materials that are managed by WTE combustion, as well as from WTE
combustion of landfill gas produced from paperboard decomposition.
• Solid Waste: Comparative conclusions about solid waste differ depending
whether the results are expressed in terms of weight or volume of waste.
Postconsumer products account for the largest share of solid waste for
each system. The plastic foam systems produce less weight of solid waste
compared to heavier paperboard and PLA products. However, because of
the low density of foam products, the differences in solid waste volume of
postconsumer foam products and corresponding paperboard or solid resin
products become relatively small for most product categories. For plates,
heavy-duty PS foam plates produce a greater volume of solid waste than
other types of heavy-duty plates; however, for the 2009 equivalent
strength plate comparison, the PS foam and paperboard plates have very
similar solid waste volumes.
• Greenhouse Gas Results: The majority of GHG emissions for most
systems studied are associated with combustion of fossil fuels for process
and transportation energy. For the PLA system, there are also significant
process GHG emissions associated with nitrous oxide emissions from
fertilizer use for corn. The end-of-life greenhouse gas results presented
here should be considered more uncertain than other emissions data. End-
of-life management results in a small net increase in GHG for PS foam
products and a net GHG credit for PLA products. End-of-life results for
paperboard products vary considerably depending on assumptions about
decomposition. At maximum experimental decomposition levels, the
overall effect of the estimated GHG additions and credits from end-of-life
management is a large net increase in GHG for paperboard products. At
lower decomposition rates, the net end-of-life GHG for paperboard
products is much smaller, since less methane is released and more carbon
is sequestered in undecomposed material. If the paperboard does not
decompose, no methane is produced and all the biomass carbon in the
paperboard product is sequestered, resulting in a large carbon
sequestration credit.
Chapter 2 Life Cycle Inventory Results for Disposable Foodservice Products
CLIENTS\PFPG\KC112313.doc
02.04.11 3666.00.003.001 2-67
• Limitations of Water Use Data: Because of a lack of unit process-level
data on water use, the water use results in this analysis are largely based
on aggregated cradle-to-material data sets and estimates based on
literature. In addition, data sources did not distinguish between
consumptive use of cooling water and recirculating use of cooling water.
Every effort was made to provide corresponding coverage of water use for
each product system; however, without access to the supporting unit
process data, and lacking distinction between consumptive and non-
consumptive uses of water, it was not possible to ensure that different
cradle-to-material data sets were derived using consistent methodologies.
Therefore, the comparative water use results in this report have a high
degree of uncertainty.
• Water Use Results: Across the different product categories, water use for
the average weight paperboard product in each category is 20 to 30
percent higher than for the corresponding average weight PS foam
product, and water use for the solid PLA product is 2 to 4 times as high as
for the corresponding PS foam product. The differences in the weights of
the solid PLA and PS foam products are a significant driver for the
comparative water use results.
Chapter 3 Sensitivity Analysis on End-of-Life Decomposition of Paperboard Products
CLIENTS\PFPG\KC112313.doc
02.04.11 3666.00.003.001 3-1
CHAPTER 3
SENSITIVITY ANALYSIS ON END-OF-LIFE DECOMPOSITION OF
PAPERBOARD PRODUCTS
BACKGROUND
As described in the Greenhouse Gas Results section in Chapter 2, assumptions
about end-of-life decomposition and the fate of landfill gas can significantly affect the
end-of-life GHG results for paperboard products. There is a limited amount of
experimental data on decomposition of different types of paper under simulated landfill
conditions, and no experimental data on decomposition of coated paperboard foodservice
products was found. The coatings on paperboard foodservice products may inhibit or
perhaps even prevent decomposition of the fiber content.
The data sources and methodology used to estimate maximum decomposition of
bleached paperboard foodservice products were described in detail in the section “End of
Life Management” in Chapter 1. The sensitivity analysis in this chapter examines the
effect of reduced gas production from decomposed material and increased landfill
oxidation of generated methane for several of the paperboard foodservice products
evaluated in this report. Based on information from NatureWorks’ website about the
stability of landfilled PLA and the conditions required for successful composting of PLA,
no modeling of landfill decomposition of PLA was included in this analysis.
SCENARIO RESULTS
The maximum potential landfill methane emissions calculated in Chapter 2
(designated “theor max” in the results figures) are based on the experimental degree of
decomposition of the cellulose and hemicellulose fractions of the fiber and the theoretical
amount of methane that would be produced if all the decomposed carbon produced an
equimolar mixture of carbon dioxide and methane. However, in the Barlaz experiments,
the measured amount of methane gas recovered from the bleached paper reactors was
much lower than the amount that should have been produced based on the measured
degree of decomposition of the cellulose and hemicellulose in the paper. The expected
amount of methane for the measured degree of decomposition is 276 g methane/kg of
paper, but the measured amount of methane was 155 g/kg of paper. It was not possible to
determine the fate of the carbon that decomposed but that did not show up as measured
methane, so it is unknown whether that carbon ultimately is released or sequestered.
Therefore, the reader should be aware that the results labeled “expt max” in the results
figures do not include a complete carbon balance. The “expt max” emissions are based on
the measured experimental quantities of methane produced, and the sequestration credits
are based on the carbon content of the undecomposed material, so the difference between
the carbon in the residual material and the carbon content of the collected reactor gas is
not accounted for.
Chapter 3 Sensitivity Analysis on End-of-Life Decomposition of Paperboard Products
CLIENTS\PFPG\KC112313.doc
02.04.11 3666.00.003.001 3-2
Some of the methane generated from anaerobic decomposition of material in a
landfill is reduced by the percentage of methane that oxidizes as it passes through the
landfill cover. The landfill methane results in Chapter 2 are based on 2006 landfill
methane data in the EPA’s Inventory of U.S. Greenhouse Gas Emissions and Sinks,
which uses the IPCC guideline of 10 percent as the default value for oxidation of landfill
methane that is not captured or vented. However, some studies have suggested that a
higher percentage of uncollected methane may oxidize as it migrates to the landfill
surface.33 The higher the percentage of uncollected methane that oxidizes in the landfill
cover, the lower the CO2 eq for landfilled paperboard products. A 36 percent oxidation
rate34 is used in the sensitivity analysis calculations. Since the oxidation rate is applied to
the percentage of methane that is not flared or burned with energy recovery, landfill gas
energy recovery calculations are not affected by the use of higher oxidation rates.
Results by category for the end-of-life (EOL) sensitivity scenarios are shown in
Figure 3-1a for hot cups, Figure 3-2a for cold cups, and Figure 3-3a for plates. Net GHG
results are shown in Figures 3-1b through 3-3b. In each figure the PS product results are
shown as a reference point. A number of observations can be made:
• Using the experimental methane generation quantities from the Barlaz
experiments results in much lower EOL GHG than using the theoretical
amount of methane that should have been produced from the amount of
material that decomposed in the experiments.
• A decreased degree of decomposition has a much larger effect on the EOL
GHG compared to the effect of an increase in landfill methane oxidation
from 10 percent to 36 percent.
• As decomposition and gas generation decrease and oxidation of the
produced methane increases, less methane is released to the atmosphere
and more carbon is sequestered in the undecomposed material, shifting the
EOL GHG from a net increase to a net credit.
• Depending on the degree of end-of-life decomposition of landfilled
paperboard, the amount of methane produced from decomposition, and the
oxidation of the produced methane in the landfill, the net GHG results for
paperboard products can be higher than or lower than PS foam products.
Factors influencing decomposition and methane oxidation include
temperature, moisture, and landfill cover soil type. These factors can vary
widely from landfill to landfill, making it difficult to make general
predictions about EOL GHG for paperboard products.
• Because the PS foam products do not decompose in landfills to produce
methane, there is much less uncertainty in the EOL GHG estimates for PS
foam products.
33 Chanton, J. P.; Powelson, D. K.; Green, R.B. Methane Oxidation in Landfill Cover Soils, is a
10%Default Value Reasonable?, J Environ. Qual. 38:654-663 (2009).
34 Overall mean oxidation from all studies reviewed in the Chanton paper.
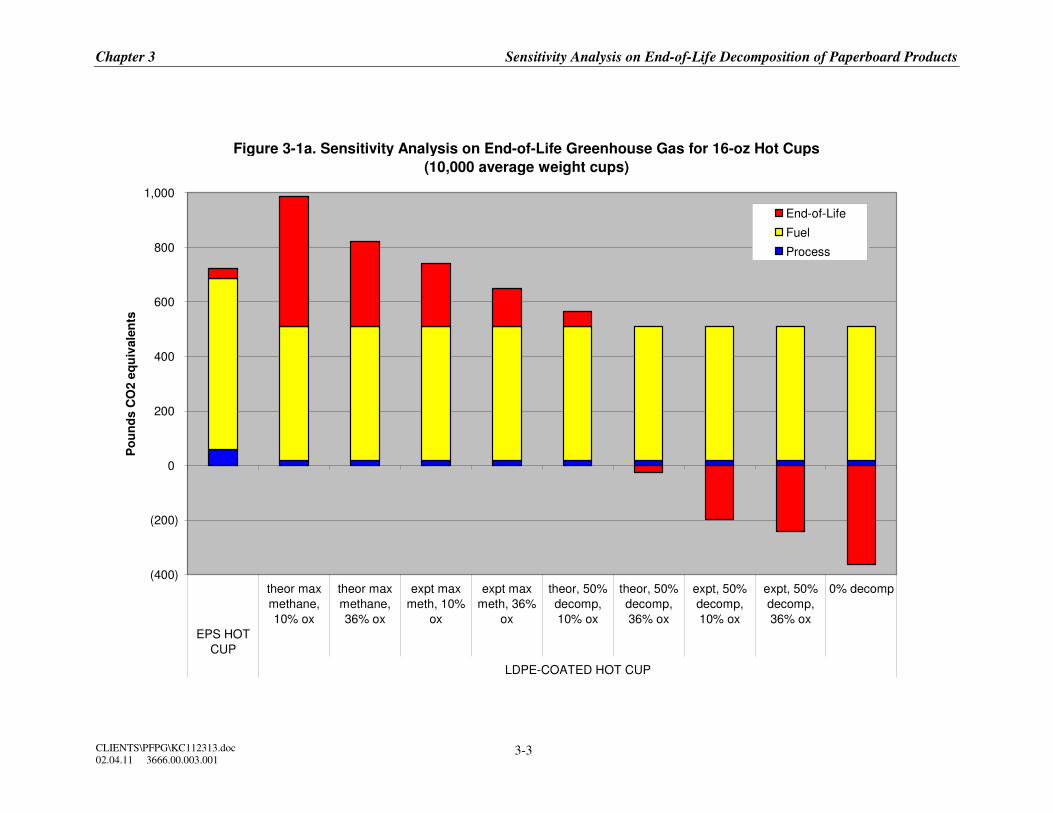
Chapter 3 Sensitivity Analysis on End-of-Life Decomposition of Paperboard Products
CLIENTS\PFPG\KC112313.doc
02.04.11 3666.00.003.001 3-3
Figure 3-1a. Sensitivity Analysis on End-of-Life Greenhouse Gas for 16-oz Hot Cups
(10,000 average weight cups)
(400)
(200)
0
200
400
600
800
1,000
EPS HOT
CUP
theor max
methane,
10% ox
theor max
methane,
36% ox
expt max
meth, 10%
ox
expt max
meth, 36%
ox
theor, 50%
decomp,
10% ox
theor, 50%
decomp,
36% ox
expt, 50%
decomp,
10% ox
expt, 50%
decomp,
36% ox
0% decomp
LDPE-COATED HOT CUP
Po
un
ds
CO
2 e
qu
ivale
nts
End-of-Life
Fuel
Process
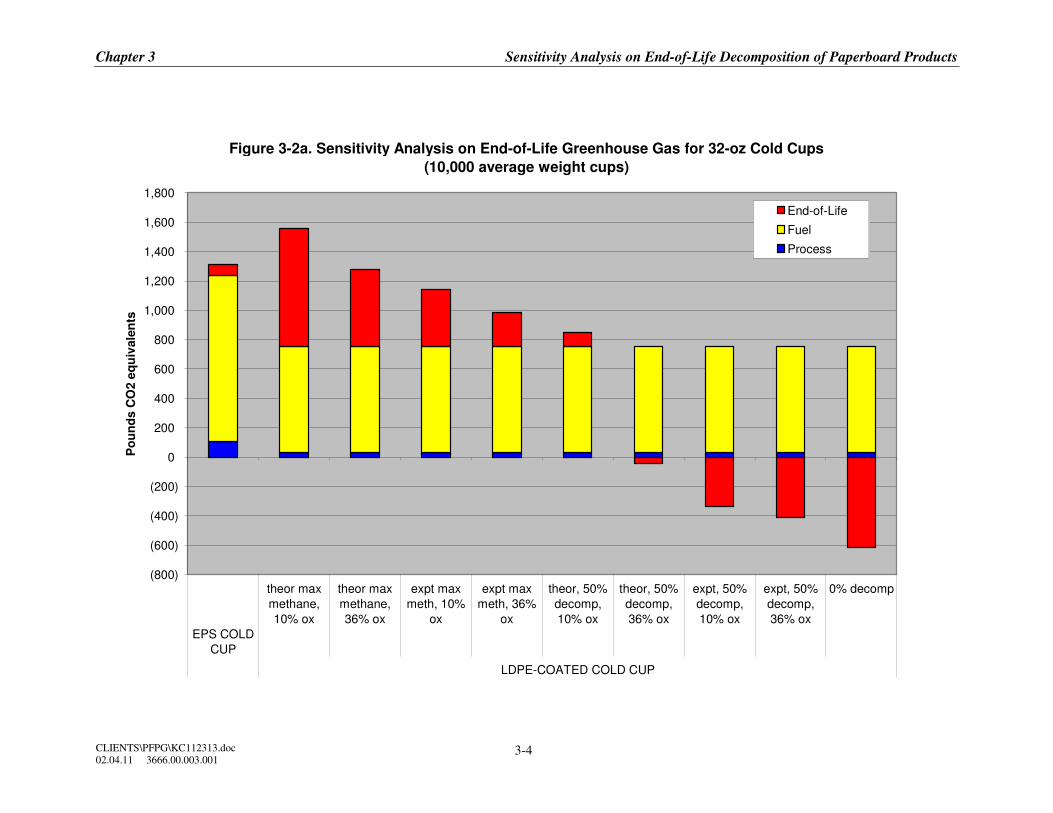
Chapter 3 Sensitivity Analysis on End-of-Life Decomposition of Paperboard Products
CLIENTS\PFPG\KC112313.doc
02.04.11 3666.00.003.001 3-4
Figure 3-2a. Sensitivity Analysis on End-of-Life Greenhouse Gas for 32-oz Cold Cups
(10,000 average weight cups)
(800)
(600)
(400)
(200)
0
200
400
600
800
1,000
1,200
1,400
1,600
1,800
EPS COLD
CUP
theor max
methane,
10% ox
theor max
methane,
36% ox
expt max
meth, 10%
ox
expt max
meth, 36%
ox
theor, 50%
decomp,
10% ox
theor, 50%
decomp,
36% ox
expt, 50%
decomp,
10% ox
expt, 50%
decomp,
36% ox
0% decomp
LDPE-COATED COLD CUP
Po
un
ds
CO
2 e
qu
ivale
nts
End-of-Life
Fuel
Process
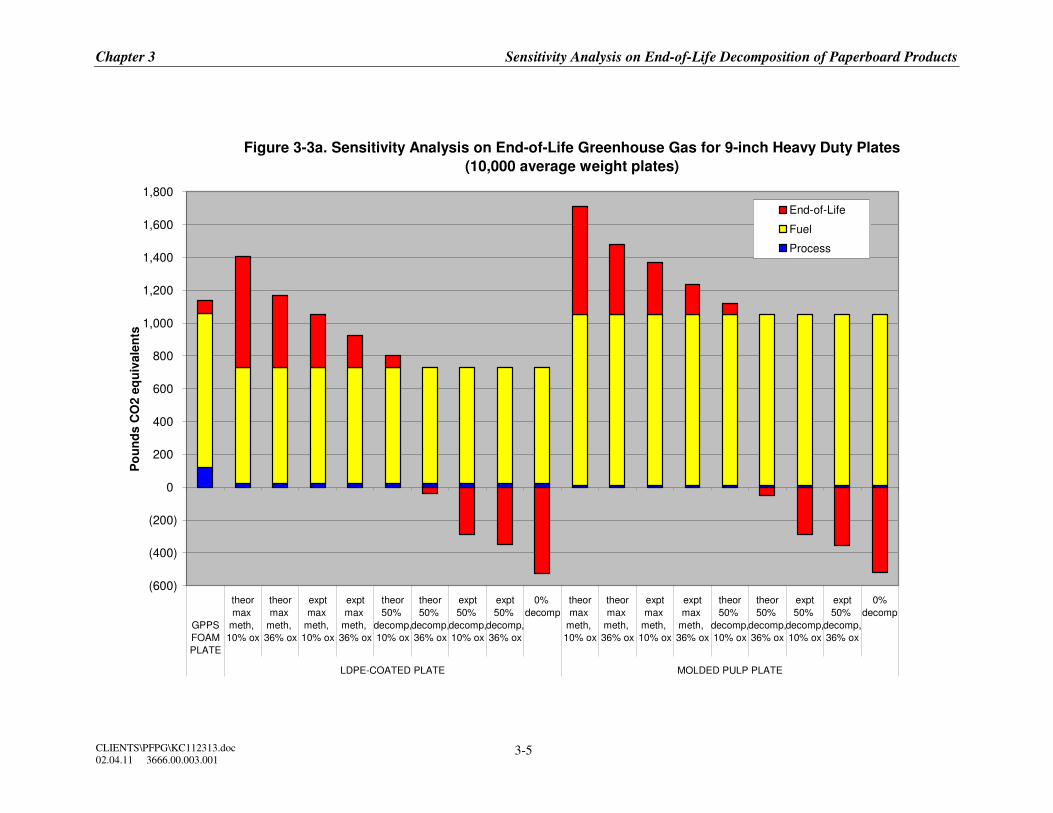
Chapter 3 Sensitivity Analysis on End-of-Life Decomposition of Paperboard Products
CLIENTS\PFPG\KC112313.doc
02.04.11 3666.00.003.001 3-5
Figure 3-3a. Sensitivity Analysis on End-of-Life Greenhouse Gas for 9-inch Heavy Duty Plates
(10,000 average weight plates)
(600)
(400)
(200)
0
200
400
600
800
1,000
1,200
1,400
1,600
1,800
GPPS
FOAM
PLATE
theor
max
meth,
10% ox
theor
max
meth,
36% ox
expt
max
meth,
10% ox
expt
max
meth,
36% ox
theor
50%
decomp,
10% ox
theor
50%
decomp,
36% ox
expt
50%
decomp,
10% ox
expt
50%
decomp,
36% ox
0%
decomp
theor
max
meth,
10% ox
theor
max
meth,
36% ox
expt
max
meth,
10% ox
expt
max
meth,
36% ox
theor
50%
decomp,
10% ox
theor
50%
decomp,
36% ox
expt
50%
decomp,
10% ox
expt
50%
decomp,
36% ox
0%
decomp
LDPE-COATED PLATE MOLDED PULP PLATE
Po
un
ds C
O2 e
qu
iva
len
ts
End-of-Life
Fuel
Process

Chapter 3 Sensitivity Analysis on End-of-Life Decomposition of Paperboard Products
CLIENTS\PFPG\KC112313.doc
02.04.11 3666.00.003.001 3-6
Figure 3-1b. Net Greenhouse Gas End-of-Life Sensitivity for 16-oz Hot Cups
(10,000 average weight cups)
0
100
200
300
400
500
600
700
800
900
1,000
EPS HOT
CUP
theor max
methane,
10% ox
theor max
methane,
36% ox
expt max
meth, 10%
ox
expt max
meth, 36%
ox
theor, 50%
decomp,
10% ox
theor, 50%
decomp,
36% ox
expt, 50%
decomp,
10% ox
expt, 50%
decomp,
36% ox
0% decomp
LDPE-COATED HOT CUP
Po
un
ds
CO
2 e
qu
ivale
nts
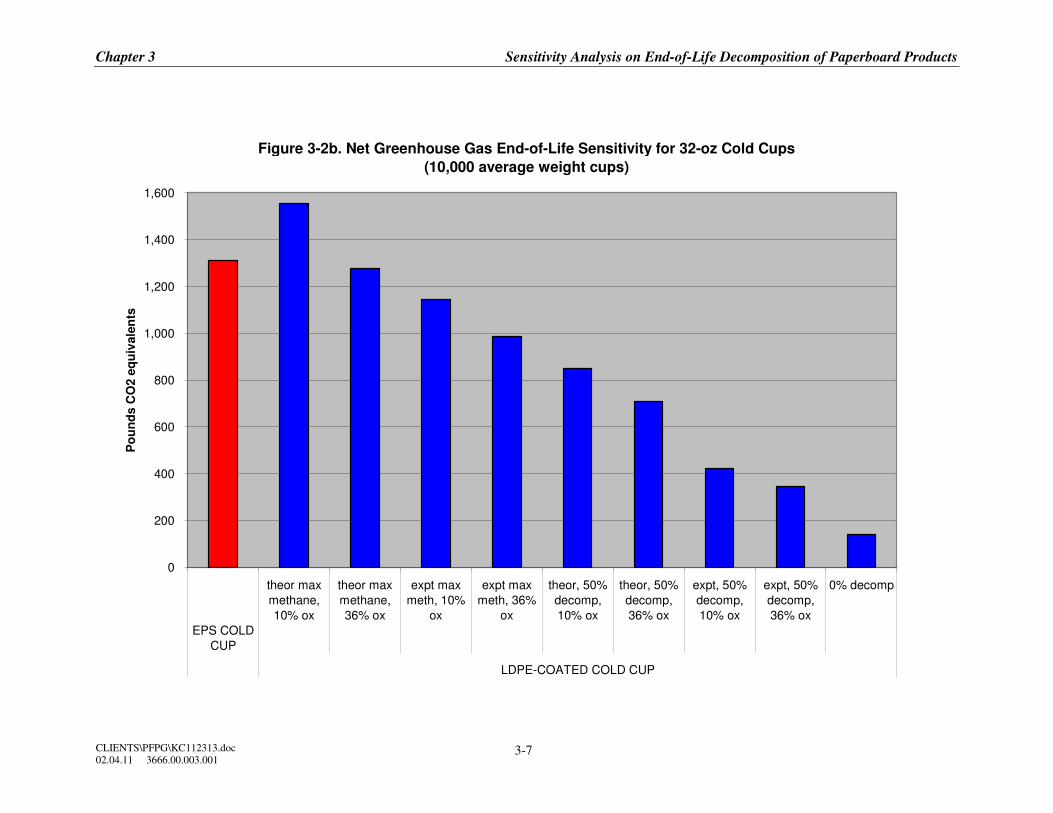
Chapter 3 Sensitivity Analysis on End-of-Life Decomposition of Paperboard Products
CLIENTS\PFPG\KC112313.doc
02.04.11 3666.00.003.001 3-7
Figure 3-2b. Net Greenhouse Gas End-of-Life Sensitivity for 32-oz Cold Cups
(10,000 average weight cups)
0
200
400
600
800
1,000
1,200
1,400
1,600
EPS COLD
CUP
theor max
methane,
10% ox
theor max
methane,
36% ox
expt max
meth, 10%
ox
expt max
meth, 36%
ox
theor, 50%
decomp,
10% ox
theor, 50%
decomp,
36% ox
expt, 50%
decomp,
10% ox
expt, 50%
decomp,
36% ox
0% decomp
LDPE-COATED COLD CUP
Po
un
ds
CO
2 e
qu
ivale
nts
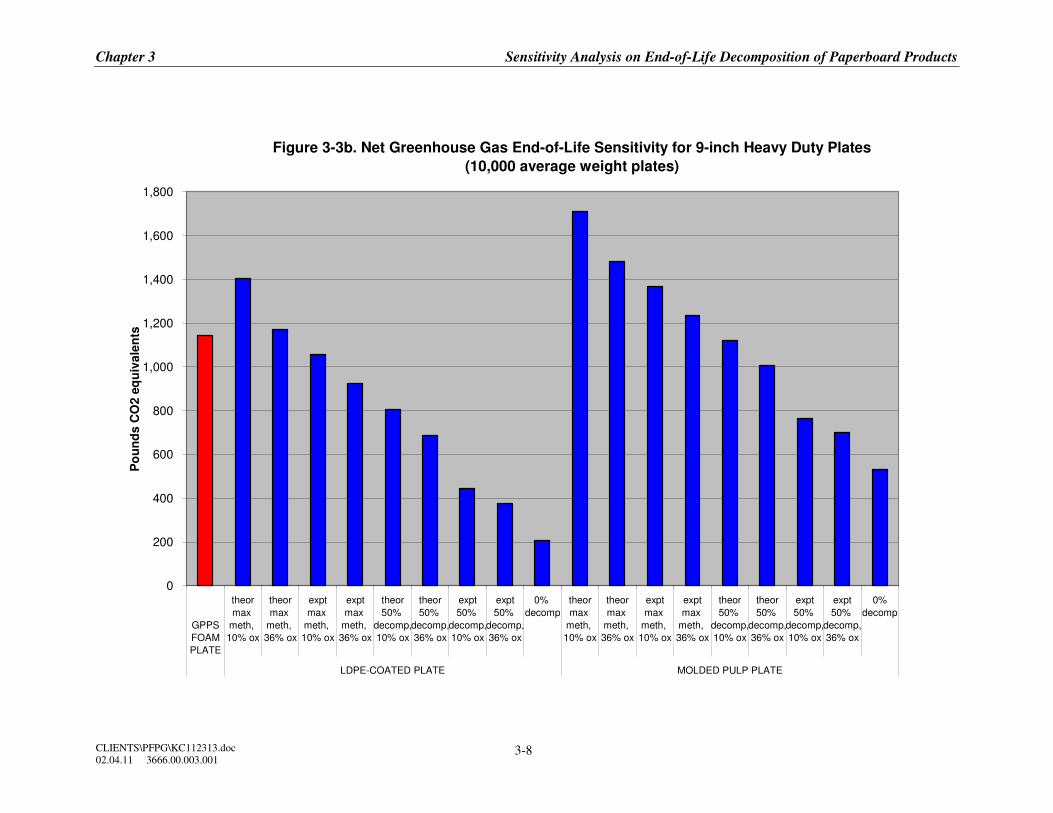
Chapter 3 Sensitivity Analysis on End-of-Life Decomposition of Paperboard Products
CLIENTS\PFPG\KC112313.doc
02.04.11 3666.00.003.001 3-8
Figure 3-3b. Net Greenhouse Gas End-of-Life Sensitivity for 9-inch Heavy Duty Plates
(10,000 average weight plates)
0
200
400
600
800
1,000
1,200
1,400
1,600
1,800
GPPS
FOAM
PLATE
theor
max
meth,
10% ox
theor
max
meth,
36% ox
expt
max
meth,
10% ox
expt
max
meth,
36% ox
theor
50%
decomp,
10% ox
theor
50%
decomp,
36% ox
expt
50%
decomp,
10% ox
expt
50%
decomp,
36% ox
0%
decomp
theor
max
meth,
10% ox
theor
max
meth,
36% ox
expt
max
meth,
10% ox
expt
max
meth,
36% ox
theor
50%
decomp,
10% ox
theor
50%
decomp,
36% ox
expt
50%
decomp,
10% ox
expt
50%
decomp,
36% ox
0%
decomp
LDPE-COATED PLATE MOLDED PULP PLATE
Po
un
ds C
O2 e
qu
iva
len
ts
Appendix A Water Use
CLIENTS\PFPG\KC112313.doc
02.04.11 3666.00.003.001 A-1
APPENDIX A
WATER USE
INTRODUCTION
Water use is becoming an increasing focus of attention in life cycle assessments;
however, well-documented data on water use are currently hard to find because
companies often do not track it. In this sense, a parallel can be drawn with carbon
dioxide, which was not tracked by industry until global warming became an issue of
concern. In fact, some of the emerging focus on water use can be attributed to concerns
about the effect of global warming on water supplies. Because of the scarcity of reliable
data on water use on a unit process basis, water use has not routinely been included in
U.S. life cycle studies.
Fresh water is a limited resource throughout large parts of the world, and more
attention has been paid to its use in recent years. According to the U.S. Geological
Survey, U.S. water withdraws in the year 2000 totaled 408,000 Mgal/day. Of the total
withdraws, 85 percent was freshwater; 76 percent of the freshwater withdraws were
surface water, and 24 percent were groundwater.35 Freshwater surface bodies of water
are replenished by rainfall and melting snow; the latter tends to be a more consistent flow
and ensures that rivers flow when no rain is falling. Unfortunately, rising global
temperatures and the retreat of glaciers is threatening to disrupt the balance that currently
exists. A shift in the mix of precipitation that falls as rain and as snow leads to increased
runoff and flooding, and a reduced flow of water during dry months.36
Water withdraws and consumption in the U.S. have more than doubled since
1950, while the amount of water available per person has dropped 45 percent, from 18.6
thousand m3/year per person in 1950 to an estimated 10.2 thousand m
3/year per person in
2000.37 This average is ten times the level of 1,000 m3/year per person that can be
considered catastrophically low, yet it masks a large degree of variability within the U.S.
Removing Alaska from consideration lowers the availability to 6.2 thousand m3/year per
person; the regions of the Lower Colorado, Rio Grande and California had respectively
0.3, 1.0 and 2.2 thousand m3/year per person in 1990. Additionally, it has been estimated
that about 20 percent of irrigated land in the U.S. draws on groundwater at rates that
35 Hutson, S.S., Barber, N.L., Kenny, J.F., Linsey, K.S., Lumia, D.S., and Maupin, M.A., Estimated use
of water in the United States in 2000. U.S. Geological Survey Circular 1268, 2004. 36 Brown, L. How water scarcity will shape the new century. Water Science and Technology. Vol 23 No
4 p 17-22. 2001.
37 Izmailova, A.V. (2003). Water resources, water use and water availability in North America. In I.A.
Shiklomanov & J.C. Rodda (Eds.), World Water Resources at the Beginning of the 21st Century.
Cambridge University Press.
Appendix A Water Use
CLIENTS\PFPG\KC112313.doc
02.04.11 3666.00.003.001 A-2
exceed replenishment.38 Therefore, information on water consumption is important to
consider when evaluating product systems so that decisions can be made to minimize
water depletion.
Data from the USGS water use survey show that 82 percent of industrial
withdraws are from surface water. Data for specific industries is unavailable, but trends
can be seen on a state-by-state basis. Eastern and northern states and those with higher
rainfall tend to use more surface-water, while dry western states use more groundwater.
This chapter describes the different categories for water use reporting and the
sources of water use data for the production of foodservice products made from
polystyrene foam, coated paperboard, and PLA.
SOURCES OF WATER
Surface Water
Approximately 81 percent of surface water withdraws in the U.S. are freshwater,
consisting of water from rivers and lakes. Surface water that is withdrawn for industrial
or thermoelectric cooling requires little or no treatment before it can be released back to
the original source. One of the major concerns with cooling water is the temperature
increase, which contributes to thermal pollution. Process water that needs to be treated
on-site or at a publicly owned treatment works (POTW) is typically released back to a
surface body of water.
Aside from cooling and process water that evaporates, agriculture is the largest
consumer of surface water that will not be returned to its source. Fifty-eight percent of
agriculture withdraws are from surface water, which represents 25 percent of surface
water use and 20 percent of all water withdraws.39
Groundwater
Unlike surface water, which can be used and returned to its source, extracting
groundwater is similar to using fossil fuel reserves. Aquifers are usually replenished at a
very slow rate, and it is difficult to return water to the aquifers from which they were
taken. Depletion of aquifers can have significant effects, including lowering the water
table – which requires drilling deeper wells – and can result in land subsidence.40
38 Shiklomanov I.A., Izmailova, A.V. (2003). Water management problems in North American: Canadian
transfers. In I.A. Shiklomanov & J.C. Rodda (Eds.), World Water Resources at the Beginning of the
21st Century. Cambridge University Press.
39 USGS, 2004.
40 Konikow, L., and Kendy, E. Groundwater depletion: A global problem. Hydrogeology Journal. Vol 13
No 1 p 317-320. 2005.

Appendix A Water Use
CLIENTS\PFPG\KC112313.doc
02.04.11 3666.00.003.001 A-3
Agriculture accounts for the largest percentage of groundwater use in the U.S. at 67
percent, followed by public supply at 19 percent and industrial uses at 4 percent.41
The effects of groundwater use are more complicated than simply reducing the
amount of water available, because the quality of fresh water is just as important as its
availability. Pumping water out of an aquifer lowers the pressure, which can allow
infiltration of saline or otherwise degraded water from other sources.42 While
compromised groundwater can still be used for some purposes, it is unfit for drinking and
most other uses.
TYPES OF WATER USE
As mentioned above, water can be used in many different ways. Some uses are
consumptive (the water is not returned to the source from which it was withdrawn), and
others are non-consumptive (e.g., cooling water that is withdrawn from a river and
returned to the source after use). Generally, water use reported in LCA databases is
reported in one of two categories: process and cooling. There is also some water use
reported as “unspecified”; in this analysis, this is included with process water.
Cooling Water
Industrial processes frequently produce heat, which must either be transported to
another process or released to the atmosphere. The high specific heat of water and its
relative inexpensive availability make it an ideal candidate for heat transport. Cooling
water can be released after a single pass through a system, or it can be cooled and
recirculated. The use of evaporative cooling towers allows cooling water to be
recirculated, lowering the total water withdrawn, but there are associated evaporative
losses. Cooling water can also be recirculated in a closed-loop system using refrigerant to
chill the water, minimizing water losses.
Process Water
Water use that is not specifically reported as used for transferring heat is generally
classified as process water. Process water may include the following uses of water:
• Water that is consumed in chemical reactions
• Water that is incorporated into the final product (e.g., as moisture content)
• Water that is directly used in an industrial process and must be cleaned
before it can be released;
• Water that is heated and used as steam;
• Water that is evaporated in industrial processes; and
• Water that is used for irrigation of crops.
41 USGS, 2004.
42 Konikow, L. 2005.
Appendix A Water Use
CLIENTS\PFPG\KC112313.doc
02.04.11 3666.00.003.001 A-4
WATER USE DATA SOURCES
Life cycle inventories are constructed by assembling data sets for all the unit
processes required to produce the functional unit of product output, beginning with raw
material extraction and continuing through the entire sequence of processes required to
produce the final output product. Data sets for individual processes are weighted
according to the quantity of output from each process that is required to produce the final
product.
The goal of this analysis was to identify water use for each unit process for each
foodservice product and add the water use data to each unit process data set to construct a
full life cycle model of water use for each product system. However, it was not possible
to meet this goal. For most processes in this study, detailed information regarding process
water in U.S. industries (quantity of water used, groundwater or surface water, salt water
or freshwater) were not available. No comprehensive source of data on U.S. industrial
processes could be found. Therefore, it was necessary to utilize other sources of data.
Data for a number of industrial chemicals and plastic resins were obtained from
the Ecoprofile reports published by PlasticsEurope, which were done by Dr. Ian
Boustead. The data in these reports are specific to manufacturing in Europe, including
upstream processes such as thermoelectric power generation and petroleum refining. The
data are presented in an aggregated manner, including not only the water use for the unit
process of interest but also the aggregated total water use for all steps from raw material
extraction leading up to that unit process. Without access to the weight factors used to
develop the aggregated cradle-to-process output totals, it was not possible to determine
the water use for individual unit processes.
For some industrial chemicals, data have been taken from Ecoinvent, a life cycle
database with data primarily from European sources. Ecoinvent reports both unit process
and life cycle water use for many processes. The sources of process water are listed
individually (lake, river, ocean, well, etc.), but cooling water is not identified by water
source. Some Ecoinvent data sets reported water designated as used for turbines (based
on water used for European electricity generation). For these data sets, the turbine water
use was replaced with U.S. data for average gallons of cooling water per kWh of
electricity (see Electricity section below).
Although the quantity of water used for U.S. processes is expected to be similar to
corresponding processes in Europe using similar process technologies, it should not be
assumed that the sources of water will be the same in the U.S. and Europe. A number of
different water sources are reported in the data sets in Ecoprofiles and in Ecoinvent, but
because of geographical differences these are not assumed to be representative of water
sources in the U.S. Therefore, water use data in this report are shown as total quantities
without distinguishing the source of the water as coming from oceans, lakes, rivers,
wells, etc.
Appendix A Water Use
CLIENTS\PFPG\KC112313.doc
02.04.11 3666.00.003.001 A-5
While PlasticsEurope and Ecoinvent served as the primary data sources for water
withdraws, a number of other sources were used. These include U.S. government
publications such as the Farm Survey, the USGS Water Use report, an EPA Profile of the
Pulp and Paper Industry, a DOE Profile of the Petroleum Industry and a paper by the
DOE and the National Energy Technology Lab (NETL) on Fossil Energy and Water. The
Environmental Defense Fund compiled several individual sources of water use in kraft
pulp and paper manufacturing, and water use in the production of PLA came from a
NatureWorks Ingeo™ data set published in the U.S. LCI Database in 2010.
Most sources did not distinguish between water use (withdraws) and
consumption. Because data on water consumption was only available for a small number
of unit processes, consumptive and non-consumptive use of water is not reported
separately in this study.
Electricity
Thermoelectric power generation requires large amounts of cooling water for
proper condensation. In thermoelectric generation, a fuel source provides heat to convert
water into steam, which powers a generator. Cooling water is then used to condense the
steam – usually in a shell and tube heat exchange system. Approximately 25 gallons of
water are withdrawn for each kWh of electricity generated by this method, with one half
of a gallon being consumed in evaporation.43
Two methods of water cooling are used in the U.S. in thermoelectric power plants
– recirculating and once through. Once-through systems have higher total water usage
(37.7 gal/kWh), but lower evaporation rates (0.1 gal/kWh); recirculating systems
withdraw less water (1.2 gal/kWh), but a larger amount is evaporated (1.1 gal/kWh).
Each has advantages and disadvantages according to the total amount of water available.
In 2001 approximately 31 percent of units recirculated their cooling water.44
Approximately 92 percent of U.S. electricity is produced via thermoelectric
generation, so this percentage is applied to the gallons of cooling water per thermoelectric
kWh to estimate the overall gallons of cooling water per kWh of U.S. grid electricity.
43 U.S. Department of Energy, NETL. Addressing the Critical Link Between Fossil Energy and Water.
2005.
44 Ibid.
Appendix A Water Use
CLIENTS\PFPG\KC112313.doc
02.04.11 3666.00.003.001 A-6
Produced Water
When oil and natural gas are extracted from the ground, they come to the surface
as a mixture of hydrocarbons, water, and suspended or dissolved solids. Because of this,
the produced water can include a variety of contaminants, such as salts (dissolved solids)
and hydrocarbons that need to be removed during cleaning. Cleaning costs range from
less than one cent to several dollars per barrel, demonstrating the variety of conditions
that produced water can be found in. The world average of produced water is two barrels
for every barrel of oil; because wells in the U.S. tend to be older, the average in the U.S.
is approximately 9.5 barrels of produced water for each barrel of oil. 45
The majority of produced water (71 percent) is reinjected as water or steam to
maintain reservoir pressure and increase oil production, although it can also be injected
into the ground for disposal purposes. If it is clean enough, produced water can also be
used for livestock and agriculture, or by industry. In areas where limited surface and
ground water is available, it has the potential to be a valuable resource.
Currently, the majority of produced water is disposed of, either through injection
or release to surface water. In the U.S., most water produced from onshore oil and natural
gas wells is reinjected, whereas most offshore wells discharge to the ocean. While
standards for discharge vary, this is the practice for offshore wells throughout the world.
Water Use in Polystyrene Foam Production
Water use data for the production of polystyrene and other plastic resins used as
coatings on paperboard product were drawn from PlasticsEurope Ecoprofiles. While
some U.S. water use data is available for the production of ethylene and pyrolysis gas,
there are data gaps for U.S. water use data for other processes in the sequence of steps
required to produce plastic resins. Therefore, the cradle-to-gate water use data in
PlasticsEurope were used instead of using incomplete water use data for U.S. processes.
The PlasticsEurope resins data are fully aggregated; that is, they include water use
for all upstream processes including the production of fuels and electricity. Because of
the fully aggregated nature of the datasets, electricity-related water use could not be
separated out, so it was not possible to adjust the cradle-to-resin data for differences in
water use for U.S. and European electricity generation.
45 U.S. Department of Energy, NETL. A White Paper Describing Produced Water from Production of
Crude Oil, Natural Gas, and Coal Bed Methane. 2004.
Appendix A Water Use
CLIENTS\PFPG\KC112313.doc
02.04.11 3666.00.003.001 A-7
Water Use in PLA Production
Water use for PLA production was modeled using data published for
NatureWorks Ingeo in the U.S. LCI Database. The Ingeo data include water used for corn
irrigation, water used in corn wet milling processes (allocated among the wet mill
coproducts), and water used in PLA production. Because the Ingeo cradle-to-PLA data
set shows electricity as an input (rather than aggregating electricity production impacts
into the cradle-to-PLA data set), water use for electricity production was added as
described in the Electricity section of this chapter.
The corn irrigation water use published by NatureWorks is specific to the
Nebraska and Iowa counties that supply corn to the Blair, Nebraska Ingeo plant. Not only
is a low percentage of corn acreage in these counties irrigated (9.4 percent in 2000,
compared to about 60 percent of all corn growing acreage in Nebraska), but the water use
per irrigated acre for these counties (calculated by NatureWorks as 5 inches) is lower
than the U.S. average water use per irrigated acre of corn in Nebraska (ranging from
about 10 to 14 inches in 2003 and 2008 Farm and Ranch Irrigation Surveys). There is
more rainfall in eastern Nebraska and western Iowa compared to other corn-growing
regions of the Midwest.
Water Use in Paperboard Production
Pulp and paper production uses a large amount of water, in addition to the water
needed to make the various chemicals used in the bleaching process. Water withdraws for
the production of chemicals such chlorine dioxide, sodium hydroxide and oxygen came
from PlasticsEurope and Ecoinvent; data sets evaluated for water use in pulp and paper
mills came from Ecoinvent and a white paper by the Environmental Defense Fund.46
46 Environmental Defense Fund. White Paper No. 10A, Environmental Comparison – Manufacturing
Technologies for Virgin and Recycled-Content Printing and Writing Paper. 1995.
Appendix B Peer Review
CLIENTS\PFPG\KC112313.doc
02.04.11 3666.00.003.001 B-1
APPENDIX B
PEER REVIEW
of
LIFE CYCLE INVENTORY OF FOAM POLYSTYRENE,
PAPER-BASED, AND PLA FOODSERVICE PRODUCTS
Prepared for
THE PLASTIC FOODSERVICE PACKAGING GROUP
and
FRANKLIN ASSOCIATES, A Division of ERG
by
Dr. David Allen
University of Texas
Mr. David Cornell
DD Cornell Associates LLC
Beth Quay (Chair)
Private Consultant
November 6, 2010
Appendix B Peer Review
CLIENTS\PFPG\KC112313.doc
02.04.11 3666.00.003.001 B-2
SUMMARY
At the request of The Plastic Foodservice Packaging Group, a peer review panel
evaluated an expanded and updated life cycle inventory (LCI) of foodservice packaging;
Franklin Associates (FAL) had originally completed the LCI in 2006 for the Polystyrene
Foodservice Packaging Council, now known as The Plastic Foodservice Packaging
Group (PFPG). The updated LCI examines the life cycle energy consumption, solid waste
generation, greenhouse gas (GHG) emissions, and water use of 16 single-service
containers across 4 categories: 16-ounce hot cups, 32-ounce cold cups, 9-inch high grade
plates, and sandwich-size clamshells. The 2010 update extends the scope of the original
study to include polylactic acid (PLA) containers, plus the analysis of water use.
In conformance with ISO 14044:2006 Section 6.3, the panel consisted of 3 external
experts independent of the study. They reviewed the draft LCI report against the
following six criteria, to ensure the analysis had been conducted in a manner consistent
with ISO standards for LCI:
• Is the methodology consistent with ISO 14040/14044?
• Are the objectives, scope, and boundaries of the study clearly identified?
• Are the assumptions used clearly identified and reasonable?
• Are the sources of data clearly identified and representative?
• Is the report complete, consistent, and transparent?
• Are the conclusions appropriate based on the data and analysis?
The panel’s detailed responses to each of the six questions are given below.
Is the methodology consistent with ISO 14040/14044?
In general, the study conforms to ISO standards. However, panel members noted the
following:
• One requirement of ISO 14044:2006 is the clear definition of the study goal.
According to Section 4.2.2 that goal “shall…unambiguously” state “the intended
application; the reasons for carrying out the study; the intended audience…whether
the results are intended to be used in comparative assertions intended to be disclosed
to the public.” FAL states that the study goal is “to provide PFPG with more complete
information about the environmental burdens and greenhouse gas impacts from the
life cycle of disposable foodservice products.” (Page ES-1). The report also indicates,
“A secondary intended use is public release of the study” (Page ES-2), in other words,
making comparative assertions. Particularly in light of this second goal, critical
assumptions should be very clearly stated in the Executive Summary—the only part
of the report seen by many readers. As noted below, some of those critical
assumptions need additional clarification and documentation.
Appendix B Peer Review
CLIENTS\PFPG\KC112313.doc
02.04.11 3666.00.003.001 B-3
Response: Language has been added in several places in the Executive Summary to
clarify the assumptions and limitations of the study. See responses to specific
comments below.
• ISO 14044:2006 further requires that a report with a “comparative assertion intended
to be disclosed to the public” include “detailed sensitivity analyses in the life cycle
interpretation phase” (Section 5.3.1). In compliance, the study includes a sensitivity
analysis of landfill decomposition rates and their effect on GHG formation. However,
since this study will be made public, sensitivity analyses for several other important
assumptions should also be included.
� At multiple points in the report, the study authors note that product weight has a
significant impact on study findings. For example, on page ES-1, the authors state
“Because this study is based primarily on average weight polystyrene foam and
paperboard products from the original PSPC study, plus a limited number of PLA
product samples, the results of this study should not be used to draw general
conclusions about comparative results for the full range of product weights
available in each product category”. The authors note that they collected weights
on multiple products, yet the Tables of product weights shown in the Executive
Summary and on page 2-5 show only single values. The study would be improved
if the authors reported a range of observed values for product weights (even if the
analysis is based on a single weight) and if some sensitivity analyses related to
product weight were performed.
Response: The intent of the project was to do a basic comparison of PLA
products to the average weight products from the original PSPC report.
Language has been added to the Goal and Scope sections of the report to clarify
this. The range of products weights from the 2006 study has been added to the
weight tables, and a link to the 2006 PSPC report has been added for readers
interested in the full range of results from that report. Due to the difficulties in
obtaining PLA product samples, it was necessary to make estimates of some PLA
product weights; the basis for the estimates are described in the report text and
weight tables. Wording has been added to the Conclusions section to clarify that
the statements apply to the average weight products analyzed in this study.
� The authors note on page 2-60: “The corn irrigation water use included in the
NatureWorks data set is specific to the Nebraska and Iowa counties that supply
corn to the Blair, Nebraska Ingeo plant. Only 9.4 percent of the corn acreage in
these counties is irrigated, compared to about 60 percent of all corn acreage in
Nebraska. In addition, the water use per irrigated acre for these counties is lower
than the average water use per irrigated corn acre, because there is more rainfall
in eastern Nebraska and western Iowa compared to other corn-growing regions of
the Midwest. The average amount of water applied per irrigated acre for the Blair
plant’s supplying counties was reported by NatureWorks as 127 mm (5 inches). In
contrast, recent U.S. Department of Agriculture Farm and Ranch Irrigation
Surveys reported averages of 14.4 inches of water per irrigated acre of Nebraska
corn in 2003 and 9.6 inches of water per irrigated acre of Nebraska corn in 2008.
Appendix B Peer Review
CLIENTS\PFPG\KC112313.doc
02.04.11 3666.00.003.001 B-4
Different sourcing for the corn used for PLA could have a significant effect on the
water use results.” A sensitivity analysis is recommended that would examine a
more typical water use pattern for corn production. In addition, it is not clear if
the energy required for pumping irrigation water is included in the energy
estimates.
Response: Because the Blair, NE plant is the sole commercial PLA production
facility in the U.S., it is reasonable to use irrigation data that represent the corn
supply for that facility. It is noted on page 2-60 that “Different sourcing for the
corn used for PLA could have a significant effect on the water use results.” The
NatureWorks PLA data set in the U.S. LCI Database used in this analysis is a
cradle-to-resin data set that does not separately report energy use for individual
life cycle steps. As the data module report states that the analysis includes inputs
of electricity and fuel use on the farm and inputs of irrigation water, it is assumed
that the energy for pumping irrigation water is included.
� As noted on page 1-7, “Scrap from product fabrication is treated as a co-product if
it is recycled, and treated as a waste if it is disposed. In other words, the
foodservice product system carries no burdens for material inputs that end up as
fabrication scrap that is recycled into some other product.” It is a common
practice to split burdens between the generating system and the system using the
materials. A sensitivity analysis assessing a different allocation method would
improve the study. In addition, it is noted on Page 1-7, “all corn growing impacts
are assigned to the corn, and none to the corn stover (stalks and leaves) that are
typically left in the field. The harvested corn is then processed at a corn wet mill,
which produces coproducts of corn gluten feed, corn gluten meal, heavy steep
water, and corn germ. As described in an LCA study using NatureWorks data
mass-based coproduct allocation is used to divide the corn wet mill burdens
among the outputs.” Sensitivity analyses on choice of allocation methods would
be useful here as well.
Response: It is common practice to allocate burdens for postconsumer recycled
material between the various systems in which the material is used as part of the
finished product. However, in the case of preconsumer converting scrap, the
material has not had a useful product life in the system generating the scrap.
Therefore, all the material burdens are assigned to the system using the scrap,
since this is the system in which the material first becomes part of a finished
product delivered to consumers.
The PLA data set published in the U.S. LCI Database is an aggregated cradle-to-
resin data set; therefore, it is not possible to conduct any alternative coproduct
allocations on the wet mill.
� A zero recycling rate was assumed for all containers in this updated study.
However, some foodservice container recycling programs already exist or are
soon coming on-stream. PS single-serving containers can be collected through
curbside programs in Ontario, Canada, where over 50% of households have
access to blue box programs. Last year the Environmental Protection Agency in
Appendix B Peer Review
CLIENTS\PFPG\KC112313.doc
02.04.11 3666.00.003.001 B-5
Taiwan announced it would complete arrangements for a PLA recycling system in
2010. Plarco is piloting a process to convert post-consumer PLA containers back
into lactic acid to be used in producing virgin PLA resin.
Response: While there is some recycling of the types of foodservice products in
this study, the levels are still low on a national basis. The 2006 PSPC report
included analysis of composting and recycling of containers at 2 percent of
generation. As stated in the Scope and Boundaries section, “The scope of this
analysis does not include recycling or composting of any of the products studied.”
Language has been added to refer interested readers to the 2006 PSPC report.
Are the objectives, scope, and boundaries of the study clearly identified?
The objectives, boundaries, and scope chosen for the study seem appropriate. Panel
members did express the following concerns and comments.
• The functional unit is defined as 10,000 disposable food service items. The study
authors do include the insulating sleeve often applied to coated paper hot cups;
however, they do not include the common practice of double cupping paper hot cups
and doubling less stiff plates. Panel members want to be sure the items studied are
equal in functionality. A reference is made to “a 2009 analysis of lighter-weight
GPPS foam plates and poly-coated paperboard plates of equivalent strength” without
defining equivalent strength. Because disposable foodservice plates can be quite
flexible, confirmation is needed that the comparison for 9-inch plates would not
include the user using double plates. Stiffness is probably more relevant.
Response: It is difficult to determine true functional equivalence of products within
each category due to differences in the properties of the materials, variations in
potential use applications, etc. For plates, two plates with different stiffnesses would
provide equivalent functionality in applications in which the food served on the plate
is below the maximum load limit for both plates. However, if the load of food is
heavier than one of the plates can support, then that application would require two of
the less stiff plate but only one of the stiffer plate. For the heavy-duty plates analyzed
in the 2006 study, data on the stiffness of individual heavy-duty plates were not
available. The results shown in the tables and figures for the average weight 2006
products are based on individual products, and the effects of double product use can
easily be estimated by multiplying the single product results.
The 2009 plates represent a different weight class of plates from the 2006 plates. For
the two lighter weight plates from the 2009 study, the manufacturer of the PS foam
plate provided strength information indicating that the 4.7 g GPPS foam plate and
the 12.1 g coated paper plate had equivalent strength. The higher weight of material
in a single coated paper plate provided equivalent stiffness to the lighter GPPS foam
plate such that single plates had equivalent functionality on a one-to-one basis.
Appendix B Peer Review
CLIENTS\PFPG\KC112313.doc
02.04.11 3666.00.003.001 B-6
• The boundaries do not include indirect land use for agricultural operations (Page 2-2).
There is some controversy associated with the inclusion of indirect land use in life
cycle inventories, since other indirect effects (e.g., indirect effects on petroleum
markets of use of petroleum feedstocks for EPS production) are generally ignored in
performing life cycle inventories. Nevertheless, in the United States, as part of the
Renewable Fuel Standard (RFS), the U.S. Environmental Protection Agency has
included indirect land use in comparisons between petroleum based fuels and fuels
derived from biomass. This would seem to establish an important precedent for life
cycle studies. The EPA results for greenhouse gas emission estimates for corn based
fuels indicate that the domestic and international land use change associated with corn
based fuels dominate the total greenhouse gas emissions. For this study, these
potentially significant indirect land use emissions were ignored. At a minimum, the
anticipated magnitude of the effect of this assumption should be noted in the
Executive Summary of the report.
http://www.epa.gov/otaq/fuels/renewablefuels/regulations.htm
http://www.epa.gov/otaq/renewablefuels/420r10006.pdf
http://www.epa.gov/otaq/renewablefuels/420f09024.pdf
Response: Indirect land use change is defined as “the conversion of non-agricultural
land to agricultural land as a consequence of changes in agricultural practice
elsewhere” (PAS 2050). Indirect land use change was included in the RFS evaluation to
account for potential consequences of land conversions in other locations when huge
quantities of U.S. corn are diverted from current food-related uses in order to produce
future target amounts of corn-derived fuel. There was much uncertainty about the types
of crops that would be used to replace the corn diverted from food use to fuel use, where
the crops would be grown, and the types of land that would be converted to agricultural
use.
Indirect land use is not typically included in product life cycle studies for several
reasons. For PLA products, there could be indirect land use changes if the use of corn as
a feedstock for PLA reduced the available U.S. corn supply such that non-agricultural
land had to be converted to agricultural use to make up for this. However, it is unclear
whether there have been indirect land use changes that can be attributed to the use of
corn for PLA production. Additionally, there are large uncertainties in projecting the
types and locations of land that might be converted to agricultural use as a result of
using a given quantity of corn as feedstock for PLA. The greenhouse gas emissions for
indirect land use change can vary widely depending on assumptions about the type and
location of land converted. Furthermore, this analysis is an attributional LCI, not a
consequential LCI. As such, the analysis is based on the environmental burdens
attributed to the products being studied and does not attempt to model the consequential
effects on other systems. A section on indirect land use change has been added to the
System Components Not Included section of Chapter 2.
Appendix B Peer Review
CLIENTS\PFPG\KC112313.doc
02.04.11 3666.00.003.001 B-7
• The near-zero inherent energy burden of PLA comes at the expense of land use.
Arable land is a limited resource, perhaps even more than fossil fuel. PLA does put
the land use issue up front (where PE and PS have relatively little burdens) and
introduces the agricultural use of water, which is significant and rendered unavailable
as it soaks in/evaporates/undergoes transpiration. Panel members are glad to see this
study includes at least a beginning discussion on water usage. Far more needs to be
done on water usage definitions and conventions, possibly starting with cooling water
vs. process water. The land use issues will also be the subject of much future life
cycle methodology development.
Agreed. No response required.
• Expanding the boundaries of this study to include both fossil fuel-based energy of
material resource (EMR) and bio-based EMR from wood and corn grain use is good
for the reader. For bio-based EMRs, the energy is tracked and reported separately,
which is a good practice. As noted in the discussion of assumptions, the decision to
include these energy flows has a significant impact on the conclusions from the study.
No response required.
• The process boundary begins with agricultural activity or extraction and ultimately
creates food service items of very similar service type. The study is expanded to
include carbon dioxide equivalents (CO2E), generation for various landfilling and
incineration end-of-life options for food service items.
No response required.
• The geographical boundary specifying final production of materials in the USA that
might be sourced world-wide is reasonable and appropriate.
No response required.
• The study does not include the use step in the life cycle, which is acceptable if each
food service item is expected to be used similarly.
No response required.
• No secondary packaging was considered, although a discussion is included about the
differences for sleeves of EPS vs. unfoamed food service items.
Response: For readers interested in the contribution of secondary packaging,
language has been added directing the reader to the 2006 PSPC report, which did
examine the contribution of packaging.
• The inclusion of water usage is justified and appropriate. The division into process
use and cooling use is appropriate as the effect on water quality will be different.
Water is not consumed as is energy. Use of water can change its availability for other
use in either quality or physical form or location.
Agreed. No response required.

Appendix B Peer Review
CLIENTS\PFPG\KC112313.doc
02.04.11 3666.00.003.001 B-8
• Excluded system components are the typical list and are reasonable. Other
methodological limitations are typical and reasonable or ranges of scenarios are
included, such as for landfill degradation.
No response required.
• In general, with the exceptions noted in this review, the allocation methods used in
this study seemed reasonable.
See responses to specific allocation comments.
• Franklin Associates is not using post-consumer recycled materials, pulp or plastic, for
the foodservice items. In so declaring, they comply with ISO standards and inform
the reader. Such a boundary definition is reasonable with respect to commercial
foodservice items.
No response required.
Are the assumptions used clearly identified and reasonable?
Overall, the assumptions in this study are reasonable and clearly identified. However, the
Executive Summary should plainly state that the choices made for a number of study
assumptions significantly impact conclusions that can be drawn from the study. These
key assumptions involve:
• Product weight
• Inclusion of bio-based EMR
• Choice of whether solid waste is reported by volume or weight
• Greenhouse gas production by landfills
• Inclusion of indirect land use
• Corn irrigation practices
• Differentiation of water consumption and withdrawal
• Choice of allocation method.
Response: Language has been added to the report as suggested.
Product weight
Page ES-2 states, “For the most part, the products modeled in this analysis are based on
the average weight products in the 2006 PSPC study.” This assumption causes great
concern. As time passes, technology changes; container manufacturers seek to reduce raw
material cost through light-weighting. The study itself gives one of the best illustrations
of this process for heavy duty 9-inch plates. The 2006 10.8-gram GPPS foam plate had
been functionally replaced by a 4.7 gram plate in 2009. And, the equivalent strength
LDPE-coated paperboard plate dropped from 18.4 to 12.1 grams over the same period.
Why weren’t 2010 samples of each product type taken to establish current container
weights?
Appendix B Peer Review
CLIENTS\PFPG\KC112313.doc
02.04.11 3666.00.003.001 B-9
Response: The 2009 plates do not replace the 2006 plates. The 2009 plates are for a
different weight class of plate than the heavy-duty plates and should not be directly
compared to the heavy-duty plates. Although the 2009 plates are in a different weight
class from the heavy-duty plates from the 2006 study, results for the two lighter class
plates are provided for two reasons: (1) to illustrate how LCI results can vary based on
the weight of the product, and (2) to present a comparison based on actual equivalent
strength (since strength data was not available for the heavy-duty plates). Text has been
added to the report discussion, tables, and figures to clarify that the 2006 and 2009 plate
results represent different weight classes of plates.
Of even greater concern are the assumptions of “estimated” PLA container weights, since
no PLA containers of the types studied currently exist. How reasonable are these
estimates?
• The 32 oz cold cup weight estimates for PLA cups are done two ways. The first way
looks at ratios of PLA and PP 24 oz cups weights and applies that ratio to a 32 oz PP
cold cup. The note suggests the 24 oz PLA cups are 50% heavier than 24 oz PP cups.
The density ratio is 1.38, suggesting the PLA cup is actually thicker than a PP. PLA
exhibits a higher flexural modulus than PP, so a cup could be thinner and possess the
same resistance to crushing. PLA is more brittle than PP and sensitive to elevated
warehouse temperatures, which could result in a deliberately thicker PLA cup. Thus,
the 50% heavier statement could represent an optimized container. This approach is
generally valid. The second way says on page 2-4 that the relative densities for the
PLA and PP plastics were applied to the 32 oz PP cup. This is taken to mean the
density ratio. On Table ES-1 and Table 2-1 the second way is described as depending
on ratios of PS and PLA clamshells. The note on the tables says 15% heavier while
the ratio of PLA density to PS density is 1.17 and the reference material is unstated.
There is a conflict in the text and table; the calculations and verbiage should be
reviewed.
Response: The description in Tables ES-1 and 2-1 for the second estimate of 32 oz
PLA cup weight was incorrect. The second estimate was based on the PP cup weight
and the ratio of resin densities. However, the 26.8 g weight was incorrectly based on
the weight of the 32 oz PP cup scaled using the weight ratio of PLA and PS products
(1.25 g/cm3 for PLA, 1.05 g/cm3 for PS). When the 32 oz PP cup weight is multiplied
by the ratio of PLA and PP densities (1.25 g/cm3 for PLA, 0.9 g/cm3 for PP), the
weight of the 32 oz PLA cup estimated by the second method is 32.4 g instead of 26.8
g. This is much closer to the alternative estimate that is based on the weight ratios of
24 oz PP and PLA cup samples. The weight table and results tables and figures for
this system have been updated throughout the report.
• The 9 inch PLA plate weight is estimated, page 2-1, as the PS plate times the ratio of
PS/PLA densities. The ratio of densities is 1.17, or PLA 17% heavier. The text on
Table ES-1 and Table 2-1 says the ratio of clamshells with PLA 15% heavier. The
correct words are needed and calculations confirmed.
Response: The description in Chapter 2 of estimating PLA plate weight based on
resin density is incorrect. Although the ratio of PLA and PS resin densities is 1.19
Appendix B Peer Review
CLIENTS\PFPG\KC112313.doc
02.04.11 3666.00.003.001 B-10
(1.25 g/cm3 for PLA, 1.05 g/cm3 for PS), the ratio of the weights of actual samples of
identically sized PLA and PS clamshells was 1.15. The resin density scaling method
assumes that the same amount of material is used in each product regardless of
differences in resin properties, while the weights of actual product samples would
reflect adjustments in the product design to take into account individual material
properties. Therefore, the product weight scaling method is considered a better way
to estimate weights of products with equivalent functionality. For example, as noted
in the reviewer comments above regarding resin properties, a PLA product could be
made thinner than a product made from another resin with a lower flexural modulus,
so that the PLA product could be lighter than would be predicted based on the resin
density ratio. Therefore, the product weight ratio for PLA and PS clamshells was
used as a scaling factor when estimating the weight of PLA plates. The description in
Chapter 2 has been corrected.
Inclusion of Bio-Based EMR
In most previous Life Cycle Inventories, FAL has assumed that the “energy of material
resource” is confined to products made using oil and natural gas as raw materials, and
that wood or other biomass used in manufacturing products has no “energy of material
resource”. In the 2006 study which this work extends, the peer review panel noted that
this assumption could affect study findings. In this 2010 update to the 2006 study, EMR
for bio-based resources have been tracked and the decision concerning whether to include
these energies does impact study findings related to energy. This should be clearly
highlighted in the Executive Summary.
Response: Language has been added to the Executive Summary as suggested.
Solid Waste Volume and Mass
The authors have indicated the differences in results associated with reporting solid waste
in volume or mass units. This should be clearly emphasized in the Executive Summary.
Response: Language has been added to the Executive Summary as suggested.
How were the landfill compaction factors established for PLA?
Response: The experimental landfill compaction density factors are from analyses of
classes of products in municipal solid waste (paper, solid plastics, foam plastics, plastic
film, etc.). The factors reflect the rigidity of the products and how samples of products
compact under pressure and moisture conditions in landfills. Separate compaction
factors were not available for products of different materials within each category.
Therefore, the landfill compaction factor used for PLA products was the same
compaction factor used for all solid plastic foodservice products in the analysis.
Greenhouse gas production in landfills
Franklin Associates examined the impact of landfill decomposition of paper based as
complete or not at all, based on published methodologies and results. This is proper.
However, the assumption of equimolar anaerobic generation of carbon dioxide and
Appendix B Peer Review
CLIENTS\PFPG\KC112313.doc
02.04.11 3666.00.003.001 B-11
methane deserves explanation because of the impact of the presence of methane. The
reference is needed, and basis (moles or mass) on page 1-16 for landfill gas assumptions.
Response: Language and references have been added to the decomposition section as
suggested.
Page 2-43 states “The primary three atmospheric emissions reported in this analysis that
contribute over 99.9 percent of the total CO2 eq for each system are fossil fuel-derived
carbon dioxide, methane, and nitrous oxide”, which is inconsistent with the statement on
page 2-54, “For the solid PLA systems, fossil carbon dioxide is also the largest
contributor to the process and fuel-related CO2 eq, but nitrous oxide emissions account
for about 4 percent of the total. The nitrous oxide emissions are mainly associated with
agricultural operations.” It is surprising that agricultural N2O emissions are this small.
The report should indicate the assumptions made about the conversion of nitrogen
fertilizer to N2O.
Response: It is not inconsistent to state that fossil CO2, methane, and nitrous oxide
together account for more than 99 percent of the total CO2 eq for each system, with
nitrous oxide contributing approximately 4 percent of the total CO2 eq for solid PLA
products.
The nitrous oxide emissions for PLA resin are based on process emissions of 0.37 g N2O
per kg of PLA resin, from the cradle-to-PLA data set in the U.S. LCI database. Because
the data set is provided as a rolled-up data set, it is not possible to further examine the
assumptions about N2O emissions from nitrogen fertilizer. The total cradle-to-PLA
product CO2 equivalents include GHG emissions not only for agricultural operations but
also for production and combustion of all process and transportation fuels used to
produce PLA resin and convert it into finished products. Therefore, a 4 percent overall
contribution from nitrous oxide does not seem unreasonable.
FAL has indicated the differences in greenhouse gas emission results are associated with
various levels of landfill methane production. This should be clearly emphasized in the
Executive Summary.
Response: Language has been added as suggested.
Inclusion of Indirect Land Use
As noted in the comments on system boundaries, indirect land use can be a significant
contributor to total greenhouse gas emissions. The authors should note in the Executive
Summary that the choice of whether or not to include these emissions can significantly
impact greenhouse gas emission results.
Response: As described in a previous response, a discussion of indirect land use change
has been added to the System Components Not Included section of Chapter 2. Exclusion
of indirect land use change has also been noted in the Observations and Conclusions
section of the Executive Summary.
Appendix B Peer Review
CLIENTS\PFPG\KC112313.doc
02.04.11 3666.00.003.001 B-12
Differentiation among Water Use, Consumption, and Withdrawal
The authors note on page A-5, “Most sources did not distinguish or define water use,
withdraws, and consumption. Because data on water consumption was only available for
a small number of unit processes, consumptive and non-consumptive use of water is not
reported separately in this study.” The Appendix is where the distinction between water
consumption and withdrawal is noted. “Water use” is the term employed in the rest of the
document. The distinction among use, consumption, and withdrawal needs to be made
clearer throughout the document, and particularly for cooling water use and irrigation,
some indication of whether consumption or withdrawal is being documented needs to be
specified.
Response: Data sources did not distinguish between consumptive use of cooling water
and non-consumptive (recirculating) use of cooling water, so it was not possible to report
separately. Language has been added to the report to clarify this.
Are the sources of data clearly identified and representative?
The sources of data are clearly identified. Panel members offered the following
comments and concerns about them:
• In paragraph 4, Page ES-1 states, “…this study is based primarily on average weight
polystyrene foam and paperboard products from the original PSPC study…” The
product weights assumed probably have the single greatest impact on the study
results. Page ES-19 explains, “Material production burdens for a product are
calculated as the product of the burdens per pound of material multiplied by the
pounds of material used in the product system. Many grades and weights of
disposable foodservice products are available in the marketplace.” How was the
“average” weight developed? Was a sampling plan developed? From how many
manufacturers were samples collected? How many samples were collected per
manufacturer? At the very least table ES-1 should include this information.
Response: As noted in responses to earlier comments, language has been added to
the report to clarify (1) that this analysis is based on the average weight products
from the 2006 study and (2) that the scope of the study did not include updating the
weights of the full range of product weights available in these product categories. The
reader is referred to the publicly available 2006 PSPC report for results covering the
full range of sample weights collected for the original project.
• The treatment of secondary packaging needs clarification. Secondary packaging was
included in the original report, but not in this modification. Some further explanation
for this is needed.
Response: As noted in the last paragraph of the Scope and Boundaries section, “The
focus of this analysis is on the differences in environmental profiles for the products
themselves. Secondary packaging is not included.” Language has been added
referring interested readers to the 2006 PSPC study.
Appendix B Peer Review
CLIENTS\PFPG\KC112313.doc
02.04.11 3666.00.003.001 B-13
• On page ES-6 report contains the following: “The net energy consumption for each
system is calculated as the process and transportation energy minus the energy
content in landfilled products minus the energy recovered at end of life from
combustion of products and combustion of recovered landfill gas from decomposition
of landfilled products.” The energy content of the manufactured product needs to be
included in the definition. It appears the calculations have included the “energy
content of manufactured products”.
Response: The description has been corrected.
• Why were the global warming potentials from the second IPCC assessments used,
rather than the most recent (Page ES-13)?
Response: Although two subsequent updates of the IPCC report with slightly different
GWPs have been published since the second assessment report (SAR), the GWPs
from the SAR are used for consistency with international reporting standards. The
United Nations Framework Convention on Climate Change reporting guidelines for
national inventories continue to use GWPs from the SAR. For this reason, the U.S.
EPA also uses GWPs from the IPCC SAR, as described in the Executive Summary of
the U.S. EPA Inventory of U.S. Greenhouse Gas Emissions and Sinks. Explanation
has been added to the report.
• Page 1-12 states, “Taking into consideration budget considerations and limited
industry participation, the data used in this report are believed to be the best that can
be currently obtained.” How did “budget considerations” and “limited industry
participation” affect the scope of the data collection?
Response: This project was scoped as an extension of the 2006 study, not as a
complete update. Therefore, the scope of work did not include an extensive sample
collection program similar to the sample collection done for the 2006 study. In cases
where we were aware of more recent analyses conducted for manufacturers of certain
products, Franklin did request permission from those manufacturers to use more
recent data on their products; however, not all manufacturers opted to participate.
• Franklin Associates cites Natureworks LCI in the US LCI Database. That study states
that the corn used for PLA comes from established fields close to Blair, Nebraska.
The consequences of land clearing to grow the corn are assumed not relevant. While
this is true for the particular case of PLA from Natureworks, production in other
localities could have other land use assumptions. Franklin Associates needs to more
explicitly state the PLA data, particularly land use and water use, come from the US
LCI Database and the details are not subject to their scrutiny.
Response: Language has been added to the report to note that the PLA data in the
U.S. LCI Database are provided as a rolled-up cradle-to-resin data set, which does
not allow further evaluation of the flows for individual subprocesses. Although
Franklin Associates did not have access to all the underlying data and assumptions
for the PLA data set, it should be noted that the PLA data were peer reviewed by Dr.
Ian Boustead, so the PLA land use and water use modeling have been closely
scrutinized by an experienced LCA practitioner. Furthermore, using information
provided by Dr. Erwin Vink and USDA records, Franklin staff were able to confirm
Appendix B Peer Review
CLIENTS\PFPG\KC112313.doc
02.04.11 3666.00.003.001 B-14
the calculations of irrigation water use for the corn supply chain specific to the Blair
PLA plant.
• One objective was to use publicly available information when possible for the study.
Data sources and methodology sources are clearly identified and publicly available
for PLA and for end-of-life investigations and for the pulp and for the polyethylene
and for the polystyrene. Private sources are noted, correctly.
No response required.
• Proprietary data sources are also cited, such as for water. As Franklin Associates
notes, there are few standards in water usage data. Franklin correctly notes that the
water data are uncertain; based on literature results; lack details per unit operation,
definition, and methodology; and should be regarded with caution when making
conclusions.
No response required.
Is the report complete, consistent, and transparent?
Overall, the report is generally complete and consistent in its breadth of subject and
detail. It is recognized that much data are taken from other sources and those sources may
be inconsistent in data collection and presentation. While the actual calculations are not
transparent, the reader is generally not interested in those calculations and relies on the
analyst to conduct such calculations properly. A check of values shows correct
calculations.
Are the conclusions appropriate based on the data and analysis?
In general, the findings are appropriate based on the data, assumptions and analyses, with
the following exceptions:
• Page ES-1 states a study goal was to extend the 2006 scope to include “…available
PLA products corresponding as closely as possible to…the original LCI”. Yet some
of the PLA containers studied don’t even exist, but are “estimated” based on
assumptions about similar PS containers. Yet, to the knowledge of the panel
members, PLA has not been foamed commercially. And, these “estimated” PLA
containers were developed without input from the primary PLA resin producer
NatureWorks. Drawing conclusions about containers which don’t exist is of serious
concern to at least one panel member.
Response: Since commercially available foamed PLA products could not be found,
the PLA product results in the report are based on solid PLA products, which are
available in the product categories of cold cups, clamshells, and other rigid food
containers. Hot cups are not made of solid PLA; therefore PLA-coated paper hot
cups are modeled, using actual product weights. Language has been added to the
report to clarify that the PLA cold cups, plates, and clamshells are modeled as solid
PLA, not foam PLA.
Appendix B Peer Review
CLIENTS\PFPG\KC112313.doc
02.04.11 3666.00.003.001 B-15
• In paragraph 4, Page ES-1 states, “Because this study is based primarily on average
weight polystyrene foam and paperboard products from the original PSPC study, plus
a limited number of PLA product samples, the results of this study should not be used
to draw general conclusions about comparative results for the full range of product
weights available in each product category.” However, isn’t that what’s being done
with the conclusions for solid waste on page ES-20 and water use on page ES-21?
Response: Language has been added to the Key Observations and Conclusions
section to more explicitly state that the conclusions apply to the product weights used
in this analysis. See also response to following comment.
• The importance of comparing LCI results in the context of uncertainty has been well
accepted in recent years. However, though this LCI makes reference to uncertainty, it
presents results as point rather than range estimates. For example, the study concludes
that “…the total energy requirements for PS foam products are generally lower
than…(heavier) PLA or paperboard products…” How does “generally” relate to
“significantly”?
Response: In the Observations and Conclusions section, the term “generally” is used
to refer to trends across all four product categories, based on the differences that are
considered significant in individual product comparisons within each product
category. Significant differences between individual products within each product
category are discussed in the results sections of the report. The wording in the
Observations and Conclusions section has been clarified in the report.
• Typically, FAL has assumed 10% uncertainty for energy data compared to 25% for
air emissions. Yet this study repeatedly caveats the high degree of uncertainty in the
water use data. What is FAL’s percent estimate of uncertainty in the water results?
Also, page ES-20 states, “The end-of-life greenhouse gas results presented here
should be considered more uncertain than other emissions data.” If FAL typically
assumes a 25% uncertainty in emissions data, what is the uncertainty of the GHG
data?
Response: Because we do not have access to the underlying data used to develop the
majority of the cradle-to-gate process and cooling water use, we do not have a basis
for estimating the uncertainty of the water results.
For GHG data, the majority of the process and fuel-related GHG emissions are
associated with fuel combustion. Since the fuel-related emissions are directly related
to energy use, the uncertainty of the total process and fuel-related GHG emissions
would be closer to the uncertainty of the energy data (10%) than the uncertainty for
process emissions (25%). Because end-of-life GHG emissions depend on many
assumptions (e.g, degree of decomposition of the material in the landfill, capture rate
of methane generated, management of captured methane, etc.), they have much
higher uncertainty and are thus reported separately from the process and fuel-related
emissions.
Appendix B Peer Review
CLIENTS\PFPG\KC112313.doc
02.04.11 3666.00.003.001 B-16
• As outlined in the “Assumptions” section, the conclusions associated with energy,
solid waste, water use and greenhouse gases are all sensitive to the assumptions made
in the study. This needs to be clearly communicated in the Executive Summary.
Response: Language has been added to the report as suggested.
Additional Comments
• Obviously, water used for growing corn is counted in PLA’s life cycle water use total.
By what convention is the water used to grow trees for paperboard handled?
Response: For paperboard, the water use reported in the model is for converting
wood inputs into paperboard at the mill. The modeling did not include any irrigation
water use for growing trees. Data sets recently added to the U.S. LCI Database show
some water use for growing tree seedlings in greenhouses; however, no water use
was reported for subsequent forestry operations.
• Including a copy of the 2006 study peer review panel’s report would be helpful to the
reader of this latest report.
Response: The report contains references to the peer-reviewed 2006 report,
including a link to the peer-reviewed final report posted at ACC’s website.
• The difference between EPS and foamed GPPS needs to be explained. Otherwise, one
definition should be used. Both terms are used on tables, figures, and in text.
Response: A description has been added to the Systems Studied section in Chapter 2.
• While the important role of NatureWorks is explained in the report body, without
additional information some readers may not understand its importance in the page
ES-4 reference.
Response: Additional information has been added to describe NatureWorks as the
sole commercial producer of PLA in the U.S.
• The inclusion of the “Abbreviations” section on page vii at the start of the report is
very helpful to the reader.
No response required.
• Figure 1-1 also needs to include water inputs.
Response: Water inputs have been added to the figure as suggested.
Appendix B Peer Review
CLIENTS\PFPG\KC112313.doc
02.04.11 3666.00.003.001 B-17
• Page 1-7 notes, “At least one manufacturer uses recycled industrial scrap as the
material feedstock for molded pulp plate production; however, data from this
producer were not available for this analysis.” To understand the true range of
product weights, shouldn’t this data have been sought and included? Why was the
data not available?
Response: The plate samples used to develop the molded pulp plate average weight
include samples of this manufacturer’s product that were purchased for the 2006
study. The manufacturer was contacted but elected not to provide plate
manufacturing data for this study.
• Page 2-42 refers to “International Panel on Climate Change (IPCC)” This should be
the “Intergovernmental Panel”.
Response: Reference has been corrected as suggested.
• The charts with negative elements (energy and greenhouse gas emissions) should
have a net value provided on the chart for each food service item, as provided in
tables in Chapter 2. This would be especially useful in the Executive Summary.
Response: Net values have been added to the energy and greenhouse gas emissions
figures in the Executive Summary, as suggested. Values were not added to the
corresponding figures in Chapter 2, since Chapter 2 has separate figures showing net
results.
• Table 2-1 and Table ES-1, cold cups should say “32 oz PLA cup estimated XX%
heavier than commercial PP cup”. The same applies to plates.
Response: Footnotes have been added to the table to more clearly explain how PLA
product weights were estimated.
• Coloring some PS bars red and others blue needs explanation, or color all blue,
Figures 2-1b, et al.
Response: In the net energy and net GHG figures, red is used for the PS bars to make
them more readily identifiable.
• On page 2-60 the report should note that cooling water can be once through, such as
for some electricity generation, or recirculated through cooling towers or chillers. In
the latter case, the water consumption should be that taken from the environment and
not that circulated in manufacturing equipment per unit of production. Due to the
uncertainty of definition of cooling water in literature references, the uncertainty of
water withdrawn from the environment can be very large.
Response: Cooling water use is generally reported without clearly indicating whether
it is once through or recirculated. It is agreed that the lack of detail about cooling
water use as is a major contributor to the uncertainty in attempting to estimate water
withdrawals from nature. Language has been added as suggested.