Life Cycle Cost Analysis of Extensive Green Roofs in ... · PDF fileLife Cycle Cost Analysis...
12
This peer-reviewed Article is provided free and open-access. 14 Volume 4 Number 1 Pages 14-25 2017 Life Cycle Cost Analysis of Extensive Green Roofs in Switzerland and the Netherlands Davis Kantor 1 Department of Facility Management in conjunction with the Green Roof CompetenceCenter, Zürich University of Applied Sciences, Zürich, Switzerland [This manuscript has been previously published as a conference paper ABSTRACT Extensive green roofs in Switzerland and the Netherlands are economically sustainable when considering the added energy savings, municipal incentives and storm water fee reductions. By combing surveys, interviews, and reviews of municipal regulations for fifteen projects the Life Cycle Cost (LCC) was calculated by discounting green roof cash flows over a 50 year time period to determine a Net Present Value (NPV). This research finds that an extensive green roof NPV in Switzerland costs 27% - 37% less than a conventional flat roof. Similarly in the Netherlands, the NPV of green roofs is determined to be 16% - 26% less than a conventional flat roof. Presented here is summary of the results and the explanation of local influences of municipal incentives. KEY WORDSextensive green roof, Net Present Value, Life Cycle Cost, planned preventative maintenance, Whole Life Cost Please cite as: Kantor, Davis. 2017. Life Cycle Cost Analysis of Extensive Green Roofs in Switzerland and the Netherlands.Journal of Living Architecture.4(1): 14-25
Transcript of Life Cycle Cost Analysis of Extensive Green Roofs in ... · PDF fileLife Cycle Cost Analysis...

This peer-reviewed Article is provided free and open-access.
14
Volume 4 Number 1 Pages 14-25 2017
Life Cycle Cost Analysis of Extensive Green Roofs in
Switzerland and the Netherlands
Davis Kantor1
Department of Facility Management in conjunction with the Green Roof CompetenceCenter,
Zürich University of Applied Sciences, Zürich, Switzerland
[This manuscript has been previously published as a conference paper
ABSTRACT
Extensive green roofs in Switzerland and the Netherlands are economically
sustainable when considering the added energy savings, municipal incentives and storm
water fee reductions. By combing surveys, interviews, and reviews of municipal regulations
for fifteen projects the Life Cycle Cost (LCC) was calculated by discounting green roof cash
flows over a 50 year time period to determine a Net Present Value (NPV). This research finds
that an extensive green roof NPV in Switzerland costs 27% - 37% less than a conventional
flat roof. Similarly in the Netherlands, the NPV of green roofs is determined to be 16% - 26%
less than a conventional flat roof. Presented here is summary of the results and the
explanation of local influences of municipal incentives.
KEY WORDSextensive green roof, Net Present Value, Life Cycle Cost, planned
preventative maintenance, Whole Life Cost
Please cite as: Kantor, Davis. 2017. Life Cycle Cost Analysis of Extensive Green Roofs in Switzerland and the
Netherlands.Journal of Living Architecture.4(1): 14-25
J. of Living Arch 5(1) pp14-24 Ideas at Work
15
INTRODUCTION
Green roofs, as a biophilic design component, are economically evaluated and
summarized in this research brief to better understand investment costs and benefits. The life
cycle cost (LCC) economic analysis presented provides insight on today’s cost associated
with extensive green roofing systems in Switzerland and the Netherlands. Today, the green
roof policies in German speaking cities of Switzerland aim to maximize native biodiversity
whereas cities in the Netherlands do not have the same consistent goals and measures to
incentivize green roof construction. Specifically, the municipality in Amsterdam promotes
holistic sustainable benefits while the municipality in Rotterdam focuses on bringing an
innovative approach to green roof design in order to maximize water storage benefits.
The aim of this research is to answer the question: How are green roofs defined as
successful in Switzerland and the Netherlands and how can these successes be compared in
terms of economic costs and benefits?
Thefindings provide investors in these locations with a realistic expectation for
extensive green roof monetary costs. Green roof design guidelines are well established in
European countries and it’s important to examine this history so that future designers in the
U.S.A have a well informed understanding on the composition and quality of green roofs.
(Werthmann, 2007)The LCC of intensive green roofs is not evaluated in this research due to
a lack of samples and pricing transparency with intensive green roof material providers.
LIFE CYCLE COSTING
Similar to the report done by the United States General Services Administration
(2011) the green roof cash flow considerations from urban agriculture, acoustic insulation,
job generation and increased productivity are not accounted for in the NPV calculation
presented here. These benefits are directly related to social and environmental benefits and
must remain an important consideration for investors due to their affect on employee well-
being and corporate image, both of which contribute to overall corporate sustainability. In
particular, the field of health care has increasing scientific studies focusing on affective
biophilic design for health outcomes and stress. Several studies have found recovering
hospital patients in rooms with a view of nature have the ability to substantially alleviate pain
(Ulrich, 2008). One significant pioneer project in Basel, Switzerland was the construction of
additional clinics at the University of Hospital, all consisting of green roofs. The intent was to
provide patients with a quality view of vegetation in order to benefit the recovery process
(Brenneisen, 2010). Additionally, office workers that can view nature from their desk are
reported to have less work related frustration, more enthusiasm for their job, higher life
satisfaction and overall improved well-being(Kaplan, 1993).All these green roof benefits
have direct cost saving implications but are not considered in the following LCC calculations.
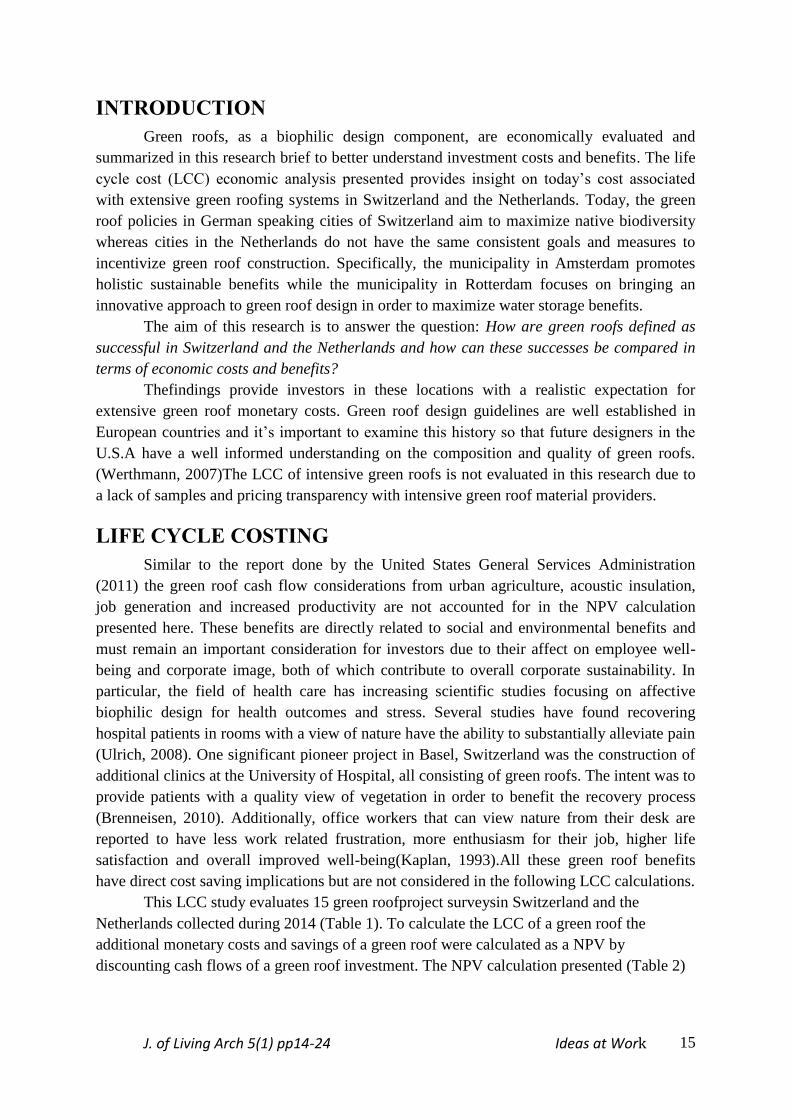
This LCC study evaluates 15 green roofproject surveysin Switzerland and the
Netherlands collected during 2014 (Table 1). To calculate the LCC of a green roof the
additional monetary costs and savings of a green roof were calculated as a NPV by
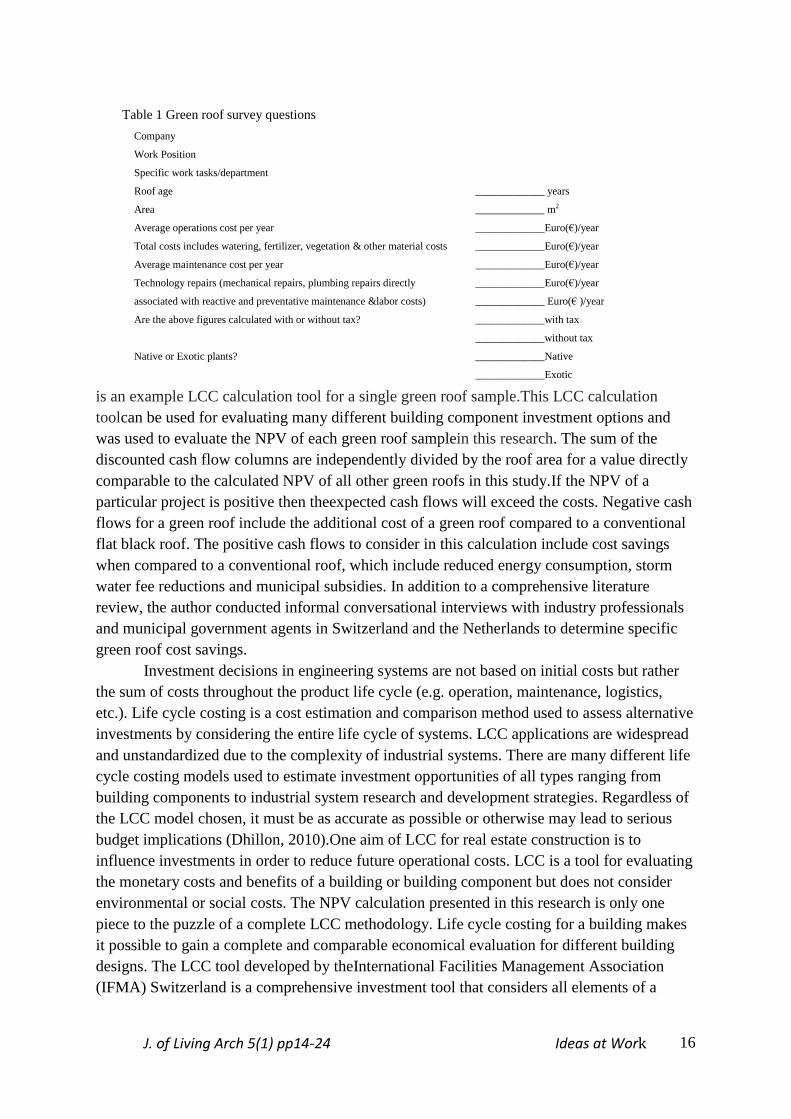
discounting cash flows of a green roof investment. The NPV calculation presented (Table 2)
J. of Living Arch 5(1) pp14-24 Ideas at Work
16
is an example LCC calculation tool for a single green roof sample.This LCC calculation
toolcan be used for evaluating many different building component investment options and
was used to evaluate the NPV of each green roof samplein this research. The sum of the
discounted cash flow columns are independently divided by the roof area for a value directly
comparable to the calculated NPV of all other green roofs in this study.If the NPV of a
particular project is positive then theexpected cash flows will exceed the costs. Negative cash
flows for a green roof include the additional cost of a green roof compared to a conventional
flat black roof. The positive cash flows to consider in this calculation include cost savings
when compared to a conventional roof, which include reduced energy consumption, storm
water fee reductions and municipal subsidies. In addition to a comprehensive literature
review, the author conducted informal conversational interviews with industry professionals
and municipal government agents in Switzerland and the Netherlands to determine specific
green roof cost savings.
Investment decisions in engineering systems are not based on initial costs but rather
the sum of costs throughout the product life cycle (e.g. operation, maintenance, logistics,
etc.). Life cycle costing is a cost estimation and comparison method used to assess alternative
investments by considering the entire life cycle of systems. LCC applications are widespread
and unstandardized due to the complexity of industrial systems. There are many different life
cycle costing models used to estimate investment opportunities of all types ranging from
building components to industrial system research and development strategies. Regardless of
the LCC model chosen, it must be as accurate as possible or otherwise may lead to serious
budget implications (Dhillon, 2010).One aim of LCC for real estate construction is to
influence investments in order to reduce future operational costs. LCC is a tool for evaluating
the monetary costs and benefits of a building or building component but does not consider
environmental or social costs. The NPV calculation presented in this research is only one
piece to the puzzle of a complete LCC methodology. Life cycle costing for a building makes
it possible to gain a complete and comparable economical evaluation for different building
designs. The LCC tool developed by theInternational Facilities Management Association
(IFMA) Switzerland is a comprehensive investment tool that considers all elements of a
Table 1 Green roof survey questions
Company
Work Position
Specific work tasks/department
Roof age _____________ years
Area _____________ m2
Average operations cost per year
Total costs includes watering, fertilizer, vegetation & other material costs
_____________Euro(€)/year
_____________Euro(€)/year
Average maintenance cost per year
Technology repairs (mechanical repairs, plumbing repairs directly
associated with reactive and preventative maintenance &labor costs)
_____________Euro(€)/year
_____________Euro(€)/year
_____________ Euro(€ )/year
Are the above figures calculated with or without tax? _____________with tax
_____________without tax
Native or Exotic plants? _____________Native
_____________Exotic

J. of Living Arch 5(1) pp14-24 Ideas at Work
17
Table 2 Example Calculation of Life Cycle Costing Net Present Value for one green roof (420 m2)
Year Initial Cost
Subsidy Repair Maintenance Energy Savings
Discount Factor
No Energy Savings
Discounted Cash Flow
Disc.Cash Flow Incl. Energy
Savings
-13,000 12,600 0 0 0 1 -4 -400
1
-400 -700 281.4 0.917485063 -1053.6398 -784.0996169
2
-400 -700 281.4 0.87881711 -1009.233 -751.0532729
3
-400 -700 281.4 0.841778841 -966.69882 -719.3996866
4
-400 -700 281.4 0.806301572 -925.95672 -689.0801596
5
-400 -700 281.4 0.806301572 -886.93172 -660.0384671
6
-400 -700 281.4 0.772319514 -849.5514 -632.2207539
7
-400 -700 281.4 0.739769649 -813.7466 -605.5754348
8
-400 -700 281.4 0.708591618 -779.45077 -580.0530984
9
-400 -700 281.4 0.678727603 -746.60036 -555.6064161
10
-400 -700 281.4 0.650122225 -715.1344 -532.1900538
11
-400 -700 281.4 0.622722438 -684.9946 -509.7605879
12
-400 -700 281.4 0.596477431 -656.12517 -488.2764252
13
-400 -700 281.4 0.571338536 -628.47238 -467.6977253
14
-400 -700 281.4 0.547259134 -601.98504 -447.9863269
15
-400 -700 281.4 0.524194573 -576.61402 -429.1056771
16
-400 -700 281.4 0.502102081 -552.31228 -411.0207635
17
-400 -700 281.4 0.480940691 -529.03475 -393.6980493
18
-400 -700 281.4 0.46067116 -506.73827 -377.1054112
19
-400 -700 281.4 0.4412559 -485.38149 -361.2120797
20
-400 -700 281.4 0.422658908 -464.92479 -345.9885821
21
-400 -700 281.4 0.404845697 -445.33026 -331.4066879
22
-400 -700 281.4 0.387783235 -426.56155 -317.4393562
23
-400 -700 281.4 0.37143988 -408.58386 -304.060686
24
-400 -700 281.4 0.355785326 -391.36385 -291.2458678
25
-400 -700 281.4 0.340790542 -374.86959 -278.9711378
26
-400 -700 281.4 0.326427722 -359.07049 -267.2137335
27
-400 -700 281.4 0.312670232 -343.93725 -255.951852
28
-400 -700 281.4 0.299492559 -329.44181 -245.1646092
29
-400 -700 281.4 0.286870268 -315.55729 -234.8320011
30
-400 -700 281.4 0.27477995 -302.25794 -224.934867
31
-400 -700 281.4 0.263199186 -289.5191 -215.4548534
32
-400 -700 281.4 0.2521065 -277.31714 -206.3743807
33
-400 -700 281.4 0.241481322 -265.62945 -197.6766099
34
-400 -700 281.4 0.186500737 -205.15081 -152.6695032
35
-400 -700 281.4 0.221555506 -243.71105 -181.3653369
36
-400 -700 281.4 0.212217917 -233.4397 -173.7215871
37
-400 -700 281.4 0.203273867 -223.60125 -166.3999876
38 -400 -700 281.4 0.194706769 -214.17744 -159.3869613
39
-400 -700 281.4 0.186500737 -205.15081 -152.6695032
40 -194544
-400 -700 281.4 0.178640553 -3671.8493 -3621.579922

J. of Living Arch 5(1) pp14-24 Ideas at Work
18
Year Initial Cost
Subsidy Repair Maintenance Energy Savings
Discount Factor
No Energy Savings Disc Cash Flow
Disc.Cash Flow Incl. Energy
Savings
41
-400 -700 281.4 0.17111164 -188.222804 -140.0719888
42
-400 -700 281.4 0.163900039 -180.29004 -134.1685716
43
-400 -700 281.4 0.156992374 -172.69161 -128.5139575
44
-400 -700 281.4 0.150375837 -165.41342 -123.0976605
45
-117.9096365
46
-400 -700 281.4 0.137967585 -151.7643431 -112.9402648
47
-400 -700 281.4 0.132152859 -145.3681448 -108.1803303
48
-400 -700 281.4 0.126583198 -139.241518 -103.621006
49
-400 -700 281.4 0.121248274 -133.3731015 -99.25383717
50
-400 -700 281.4 0.116138194 -127.7520129 -95.07072526
No energy
savings
Project NPV 25971.88993
Project NPV/ m2 -61.83783316
Incl. energy
savings
Project NPV
-20319.19192
Project NPV/ m2 -48.37902838
building. This method for LCC calculations was developed by the IFMA Switzerland in
conjunction with German Facility Management Association (GEFMA) and is based on
international standards (ISO 15686-52008). By entering specific product information for a
particular future building design, the tool will automatically calculate the total LCC of the
building. A lower LCC indicates the preferred option for economic sustainability aspects of
the building (Ulrich, 2008).
According to the Swiss Chapter of International Facilities Management
Association(2011) the NPV method is a form of dynamic LCC analysis that accounts for the
effects of time on money over the life cycle of a building or building component. A NPV is
calculated by estimating all future cash flows of a particular project and is discounted back to
a one single price relative to the present day using the present value formula. One way to
think of the present value equation is to multiply the future cash flow by a discount rate and
the NPV is then the sum of all present values over the time period in consideration. The
resulting NPV calculations consider the additional cost premium of adding a green roof
installation. This can be visualized as everything above the waterproofing because a
conventional roof also consists of a waterproofing layer. Thus, the cash flows include
installation costs (materials, labor, etc.), maintenance costs, repair costs, municipal subsidies,
storm water tax fee reductions and energy savings.
Based on a similar study of green roofs by the United States General Services
Administration (2011), the green roof NPV was calculated using a 4.4% interest rate over a
period of 50 years. A sensitivity analysis was considered by using two different energy
savings estimations. This approach provided a range of values for the NPV estimate. For
comparable figures between Holland and the Netherlands, all NPV figures are presented in
J. of Living Arch 5(1) pp14-24 Ideas at Work
19
Euro currencies. To convert the Swiss NPV figures from Swiss Francs (CHF) to Euros (€),
the average of the currency exchange rates over the past 8 years is determined. A historical
statistical record of currencies and average exchange rates are considered in the data analysis
to account for fluctuations in the economy. Additionally, any increased materials cost due to
the increased cost of goods and labor in Switzerland was accounted for in the NPV
calculations.
RESULTS
Construction Costs
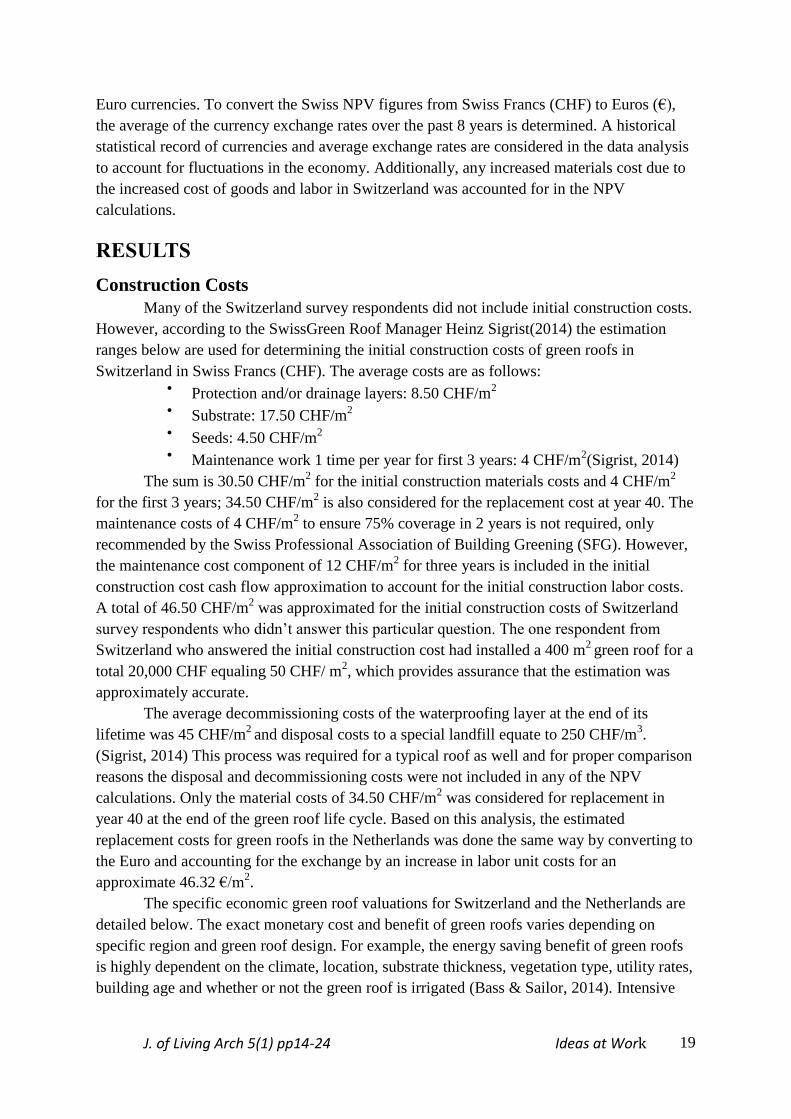
Many of the Switzerland survey respondents did not include initial construction costs.
However, according to the SwissGreen Roof Manager Heinz Sigrist(2014) the estimation
ranges below are used for determining the initial construction costs of green roofs in
Switzerland in Swiss Francs (CHF). The average costs are as follows: Protection and/or drainage layers: 8.50 CHF/m
2
Substrate: 17.50 CHF/m2
Seeds: 4.50 CHF/m2
Maintenance work 1 time per year for first 3 years: 4 CHF/m2(Sigrist, 2014)
The sum is 30.50 CHF/m2 for the initial construction materials costs and 4 CHF/m
2
for the first 3 years; 34.50 CHF/m2 is also considered for the replacement cost at year 40. The
maintenance costs of 4 CHF/m2 to ensure 75% coverage in 2 years is not required, only
recommended by the Swiss Professional Association of Building Greening (SFG). However,
the maintenance cost component of 12 CHF/m2 for three years is included in the initial
construction cost cash flow approximation to account for the initial construction labor costs.
A total of 46.50 CHF/m2 was approximated for the initial construction costs of Switzerland
survey respondents who didn’t answer this particular question. The one respondent from
Switzerland who answered the initial construction cost had installed a 400 m2
green roof for a
total 20,000 CHF equaling 50 CHF/ m2, which provides assurance that the estimation was
approximately accurate.
The average decommissioning costs of the waterproofing layer at the end of its
lifetime was 45 CHF/m2
and disposal costs to a special landfill equate to 250 CHF/m3.
(Sigrist, 2014) This process was required for a typical roof as well and for proper comparison
reasons the disposal and decommissioning costs were not included in any of the NPV
calculations. Only the material costs of 34.50 CHF/m2 was considered for replacement in
year 40 at the end of the green roof life cycle. Based on this analysis, the estimated
replacement costs for green roofs in the Netherlands was done the same way by converting to
the Euro and accounting for the exchange by an increase in labor unit costs for an
approximate 46.32 €/m2.
The specific economic green roof valuations for Switzerland and the Netherlands are
detailed below. The exact monetary cost and benefit of green roofs varies depending on
specific region and green roof design. For example, the energy saving benefit of green roofs
is highly dependent on the climate, location, substrate thickness, vegetation type, utility rates,
building age and whether or not the green roof is irrigated (Bass & Sailor, 2014). Intensive
J. of Living Arch 5(1) pp14-24 Ideas at Work
20
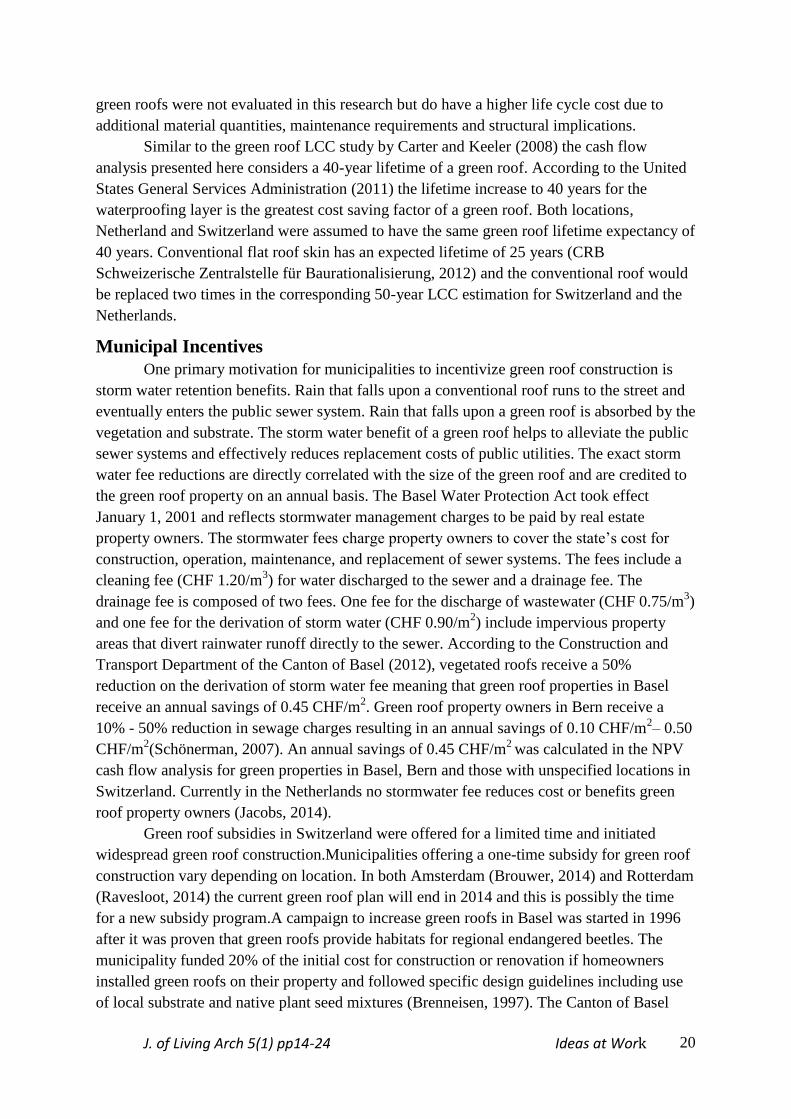
green roofs were not evaluated in this research but do have a higher life cycle cost due to
additional material quantities, maintenance requirements and structural implications.
Similar to the green roof LCC study by Carter and Keeler (2008) the cash flow
analysis presented here considers a 40-year lifetime of a green roof. According to the United
States General Services Administration (2011) the lifetime increase to 40 years for the
waterproofing layer is the greatest cost saving factor of a green roof. Both locations,
Netherland and Switzerland were assumed to have the same green roof lifetime expectancy of
40 years. Conventional flat roof skin has an expected lifetime of 25 years (CRB
Schweizerische Zentralstelle für Baurationalisierung, 2012) and the conventional roof would
be replaced two times in the corresponding 50-year LCC estimation for Switzerland and the
Netherlands.
Municipal Incentives
One primary motivation for municipalities to incentivize green roof construction is
storm water retention benefits. Rain that falls upon a conventional roof runs to the street and
eventually enters the public sewer system. Rain that falls upon a green roof is absorbed by the
vegetation and substrate. The storm water benefit of a green roof helps to alleviate the public
sewer systems and effectively reduces replacement costs of public utilities. The exact storm
water fee reductions are directly correlated with the size of the green roof and are credited to
the green roof property on an annual basis. The Basel Water Protection Act took effect
January 1, 2001 and reflects stormwater management charges to be paid by real estate
property owners. The stormwater fees charge property owners to cover the state’s cost for
construction, operation, maintenance, and replacement of sewer systems. The fees include a
cleaning fee (CHF 1.20/m3) for water discharged to the sewer and a drainage fee. The
drainage fee is composed of two fees. One fee for the discharge of wastewater (CHF 0.75/m3)
and one fee for the derivation of storm water (CHF 0.90/m2) include impervious property
areas that divert rainwater runoff directly to the sewer. According to the Construction and
Transport Department of the Canton of Basel (2012), vegetated roofs receive a 50%
reduction on the derivation of storm water fee meaning that green roof properties in Basel
receive an annual savings of 0.45 CHF/m2. Green roof property owners in Bern receive a
10% - 50% reduction in sewage charges resulting in an annual savings of 0.10 CHF/m2– 0.50
CHF/m2(Schönerman, 2007). An annual savings of 0.45 CHF/m
2 was calculated in the NPV
cash flow analysis for green properties in Basel, Bern and those with unspecified locations in
Switzerland. Currently in the Netherlands no stormwater fee reduces cost or benefits green
roof property owners (Jacobs, 2014).
Green roof subsidies in Switzerland were offered for a limited time and initiated
widespread green roof construction.Municipalities offering a one-time subsidy for green roof
construction vary depending on location. In both Amsterdam (Brouwer, 2014) and Rotterdam
(Ravesloot, 2014) the current green roof plan will end in 2014 and this is possibly the time
for a new subsidy program.A campaign to increase green roofs in Basel was started in 1996
after it was proven that green roofs provide habitats for regional endangered beetles. The
municipality funded 20% of the initial cost for construction or renovation if homeowners
installed green roofs on their property and followed specific design guidelines including use
of local substrate and native plant seed mixtures (Brenneisen, 1997). The Canton of Basel
J. of Living Arch 5(1) pp14-24 Ideas at Work
21
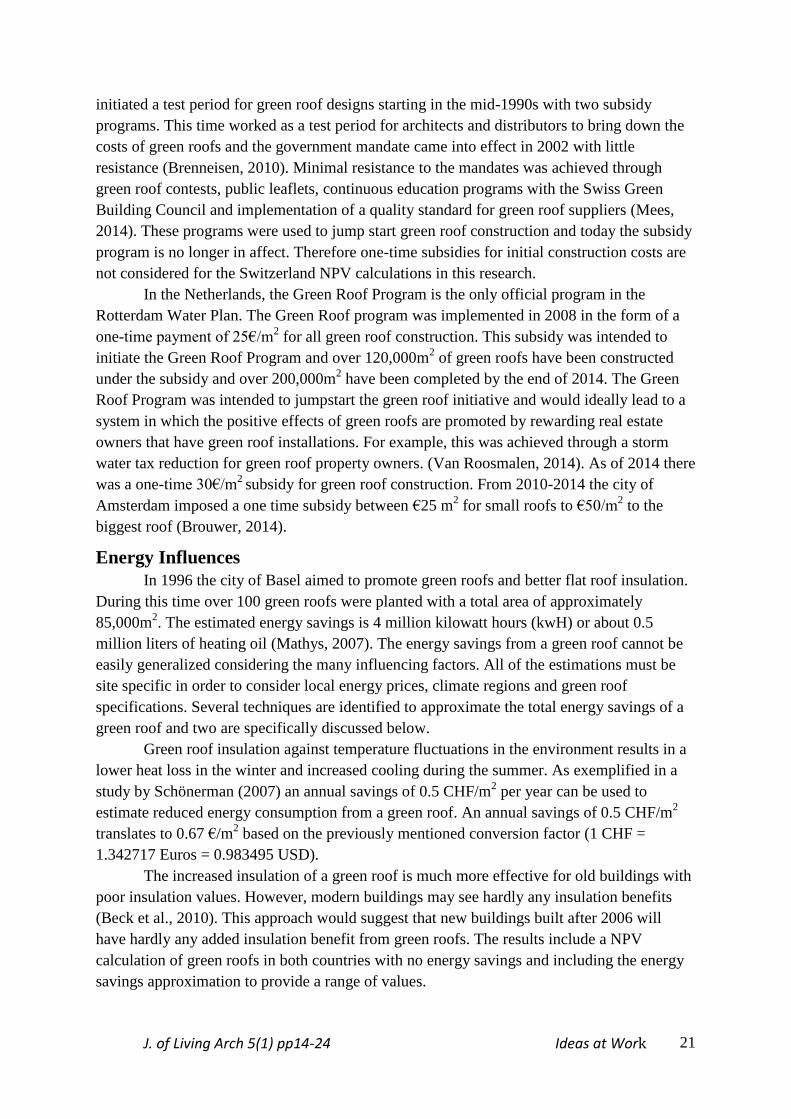
initiated a test period for green roof designs starting in the mid-1990s with two subsidy
programs. This time worked as a test period for architects and distributors to bring down the
costs of green roofs and the government mandate came into effect in 2002 with little
resistance (Brenneisen, 2010). Minimal resistance to the mandates was achieved through
green roof contests, public leaflets, continuous education programs with the Swiss Green
Building Council and implementation of a quality standard for green roof suppliers (Mees,
2014). These programs were used to jump start green roof construction and today the subsidy
program is no longer in affect. Therefore one-time subsidies for initial construction costs are
not considered for the Switzerland NPV calculations in this research.
In the Netherlands, the Green Roof Program is the only official program in the
Rotterdam Water Plan. The Green Roof program was implemented in 2008 in the form of a
one-time payment of 25€/m2 for all green roof construction. This subsidy was intended to
initiate the Green Roof Program and over 120,000m2 of green roofs have been constructed
under the subsidy and over 200,000m2 have been completed by the end of 2014. The Green
Roof Program was intended to jumpstart the green roof initiative and would ideally lead to a
system in which the positive effects of green roofs are promoted by rewarding real estate
owners that have green roof installations. For example, this was achieved through a storm
water tax reduction for green roof property owners. (Van Roosmalen, 2014). As of 2014 there
was a one-time 30€/m2
subsidy for green roof construction. From 2010-2014 the city of
Amsterdam imposed a one time subsidy between €25 m2 for small roofs to €50/m
2 to the
biggest roof (Brouwer, 2014).
Energy Influences
In 1996 the city of Basel aimed to promote green roofs and better flat roof insulation.
During this time over 100 green roofs were planted with a total area of approximately
85,000m2. The estimated energy savings is 4 million kilowatt hours (kwH) or about 0.5
million liters of heating oil (Mathys, 2007). The energy savings from a green roof cannot be
easily generalized considering the many influencing factors. All of the estimations must be
site specific in order to consider local energy prices, climate regions and green roof
specifications. Several techniques are identified to approximate the total energy savings of a
green roof and two are specifically discussed below.
Green roof insulation against temperature fluctuations in the environment results in a
lower heat loss in the winter and increased cooling during the summer. As exemplified in a
study by Schönerman (2007) an annual savings of 0.5 CHF/m2 per year can be used to
estimate reduced energy consumption from a green roof. An annual savings of 0.5 CHF/m2
translates to 0.67 €/m2 based on the previously mentioned conversion factor (1 CHF =
1.342717 Euros = 0.983495 USD).
The increased insulation of a green roof is much more effective for old buildings with
poor insulation values. However, modern buildings may see hardly any insulation benefits
(Beck et al., 2010). This approach would suggest that new buildings built after 2006 will
have hardly any added insulation benefit from green roofs. The results include a NPV
calculation of green roofs in both countries with no energy savings and including the energy
savings approximation to provide a range of values.

J. of Living Arch 5(1) pp14-24 Ideas at Work
22
Today, the LCC of extensive green roofs in Switzerland and the Netherlands is less
than a conventional flat roof. This research found that an extensive green roof in Switzerland
costs between 37% - 27% less than a conventional flat roof. In the Netherlands, green roofs
were determined to be 16% - 26% less than a conventional flat roof. These findings provide
confirmation that extensive green roofs in Switzerland and the Netherlands are economically
sustainable. Over a 50-year period the calculated mean NPV of extensive green roofs in
Switzerland is between -85.92€/m2 and-100.65€/m
2; a conventional flat roof in Switzerland
costs approximately -137.09€/m2. The calculated mean NPV of green roofs in the
Netherlands is between are between -94.55 €/m2
and -107.93 €/m2; a conventional flat black
roof costs approximately -128.18€/m2.
FUTURE OUTLOOK
The field of construction and property management is rapidly changing along
with technology for cost reduction. Green roofs are a building component making them
intimately tied with emerging trends in building and construction. The Swiss Chapter of
International Facilities Management Association 2011) defines LCC as one component of a
whole life costing (WLC) which is an emerging approach to sustainable construction. For
example, one major environmental cost consideration for WLC in the construction industry is
the reduction of carbon emissions. Building Information Modelling (BIM) has the potential to
enable accurate carbon costing and support many other aspects of WLC. According to
Caplehorn (2012) the emergence of BIM has the potential to significantly support WLC
throughout a building’s life cycle by considering maintenance schedules and resolving design
issues prior to the construction phase. The United Kingdom government has deemed BIM
crucial to its 2025 sustainability goals and will mandate BIM implementation on all federal
construction projects no later than 2016. This mandate aims to bring modern green building
competence and awareness to the general public (HM Government, 2013; Manning, & Brew,
2015). With the use of BIM building operators can track LCC data of a building for cost
optimization. A BIM can be continuously updated to estimate, track and budget lifecycle
costs in regards to a specific building component. This is an example of how facility
managers can use BIM to schedule preventative maintenance services and optimize building
performance. Autodesk Revit is versatile software developed by Autodesk and is capable of
economically evaluating a building over its lifetime (Hore, Kehily, & Woods, 2014).
Successful green roofs and conventional roofs are not maintenance free and
require planned preventative maintenance schedules. For a high quality biodiverse extensive
green roof the Swiss Professional Association of Building Greening (SFG) recommends 75%
of the roof area to be covered with at least 20 different indigenous plant species within two
years for maintenance purposes. Bare patches that are several square meters must be
reseeded. One or two surveys per year should be conducted to keep the gravel strips, roof
borders and other roof outlets clear of vegetation (Schmid, 2007). Building Information
Modeling facilitates the notification of maintenance schedules, enables maintenance
budgeting and improves overall building management with the convenience of a virtual, data
rich computer model.

J. of Living Arch 5(1) pp14-24 Ideas at Work
23
CONCLUSION
The Netherlands and Switzerland have different priorities for green roof incentives.
Switzerland prioritizes the ecological benefits of green roofs. Major cities such as Zurich and
Basel enforced green roof mandates due to the benefit of the natural environment (Green
Zurich City, 2014; Mees, 2014). Also, cities like Basel and Bern in Switzerland have
developed a technicality in the storm water fees to provide a monetary savings for green roof
property owners. These cities mandate green roof installations on all flat, unoccupied new or
renovated roofs, which has a noticeable, beneficial effect on the economic costs (Brenneisen,
2010).According to Boer et al. (2013) the city of Rotterdam is leading the way in the
Netherlands to develop innovative strategies for water storage and delayed storm water
runoff to prepare for the likelihood of climate change. Rotterdam has developed two subsidy
programs in the past decade to initiate green roof construction. According to Brouwer (2014)
in Amsterdam, green roofs are subsidized in order to improve biodiversity, well-being of
people as well as water retention benefits.
Switzerland has a lower NPV for green roofs compared to the Netherlands for two
potential reasons. First, green roof construction costs decrease as the roof area increases.
Switzerland survey respondents maintained green roof areas that were on average 1450%
larger than survey respondents from the Netherlands.
Secondly, the experienced installation methods of contractors in Switzerland due to
green roof mandates has driven down the costs of green roof construction. The green roof
mandates in major cities such as Basel and Zurich have seen dramatic drops in green roof
costs as a result of increased contractor installation experience (Brenneisen, 2010). The same
time effects on green roof construction practices can be predicted in the future for Holland
and United States of America where green roofs are limited due to investor uncertainty. A
comparison of small roofs (less than 1000 m2) shows that the NPV of small green roofs in the
Netherlands is 9.2% less than small green roofs in Switzerland. This shows that the
Netherlands has the potential to further decrease costs of green roof construction. This
research determined that extensive green roofs in Switzerland and the Netherlands are
economically preferable compared to conventional roofs. Additionally, partially
accessible,biodiverse extensive green roofs provide optimal environmental benefits as well as
many social benefits, making them more sustainable from a holistic viewpoint.
ACKNOWLEDGEMENTS
Thanks to Stephan Brenneissenand CarstenDruhmann for the mentorship throughout
the research process.
LITERATURECITED
Bau- und Verkehrsdepartement des Kantons Basel-Stadt Tiefbauamt. 2012. Wegleitung über die
Abwassergebühren. Basel: Tiefbauamt. [Construction and Transport Department of the
Canton of Basel City.2012. Guidelines on the sewage charges. Basel: Civil Engineering.]
J. of Living Arch 5(1) pp14-24 Ideas at Work
24
Brenneisen, S. 2007. SFG- Gründach- Label: Hat Qualität in der Dachbegrünung eine Perspektive?
[SFG Green roof label: Does quality of green roofs have a perspective?] Hochschule
Wädenswil. Wädenswil: Hochschule Wädenswil.
Brenneisen, S. 2009. Ökologisches Ausgleichspotenzial von Extensiven Dachbegrünungen:
Bedeutung des Ersatz-Ökotops für den Arten- und Naturschutz und die
Stadtentwicklungsplanung [The potential of ecological compensation of extensive green
roofs: Importance of compensational ecotopes for species and nature conservation and
urban development planning.] (Vol. 41). Basel, Switzerland: Physiogeographica.
Brenneisen, S. 2010. From Pilot to Mainstream: Green roofs in Basel, Switzerland. Wadenswil:
Zürcher Hochschule für Angewandte Wissenscafte.
Brenneisen, S. 1997. The Benefits of Biodiversity from Green Roofs - Key Design Consequences.
Zurich University of Applied Sciences. Wadenswil: Zürcher Hochschule für Angewandte
Wissenscafte.
Brouwer, A. 2014, November 13. Urban Ecologist. (D. Kantor, Interviewer) Amsterdam, Holland.
Caplehorn, P. 2012. Whole Life Costing: A New Approach. London: Routledge.
Castleton, H., V. Stovin, S. Beck, J. Davison. 2010). Green roofs; building energy savings and the
potential for retrofit. Energy and Buildings, 42:1582-1591.
CRB Schweizerische Zentralstelle für Baurationalisierung. 2012). LCC Handbuch Instandhaltung und
Instandsetzung von Bauwerken. Zürich, Switzerland: CRB Schweizerische Zentralstelle für
Baurationalisierung. [CRB Swiss Central Office for Construction Rationalization.2012). LCC
Manual of maintenance and restoration of buildings. Zürich, Switzerland: CRB Suisse Center
for Rationalization in Construction.]
Dhillon, B. S. 2010. Life Cycle Costing for Engineers. Boca Raton, Florida, U.S.A.: CRC Press.
Green Zurich City. 2014, May 9. Green Roofs. (B. Tschander, Editor) Retrieved November 24, 2014,
from Civil Engineering and Waste Department:
https://www.stadtzuerich.ch/ted/de/index/gsz/angebote_u_beratung/beratung/
dachbegruenungen.html
Sigrist, H. 2014, December 3. GeschäftsführerDachbegrünungen. [Green Roof Manager]. (D. Kantor,
Interviewer)
HM Government. 2013. Industrial Strategy: government and industry in partnership Construction
2025. London: Crown.
Hore, A. V., D. Kehily,T. Woods. 2014. Building Information Modeling for Facility Cost
Optimisation: Implications for the QS Profession. Revit Technology Conference Europe 2014.
Dublin: Dublin Insitute of Technology.
Jacobs, J. 2014 December 3. Strategic Advisor. Water Department Strategic Advisor. (D. Kantor,
Interviewer) Rotterdam, Holland.
J. of Living Arch 5(1) pp14-24 Ideas at Work
25
Kaplan, R. 1993. The role of nature in the context of the workplace. Landscape and urban planning,
26 (1):193-201.
Keeler, A., T. Carter. 2008. Life-cycle cost-benefit analysis of extensive vegetated roof systems.
Journal of Environmental Management, 87:350-363.
Kellert, S. R. 2008. Dimensions, Elements, and Attributes of Biophilic Design. In S. R. Kellert, J. H.
Heerwagen, & M. L. Mador, Biophilic Design (pp. 3-19). Hoboken, New Jersey, USA: John
Wiley & Sons, Inc.
Manning, R., M. Brew.2015. NBS National BIM Report 2015. New Castle: RIBA Enterprises Ltd
2015.
Mathys, C. 2007. Projektbericht "das bessere Flachdach" 05/06 Basel . Wadenswil: Hochshule
Wädenwsil
Mees, H. 2014. Responsible climate change adaptation. Exploring, analysing and evaluating public
and private responsibilities for urban adaptation to climate change. Utrecht: Utrecht
University.
Ravesloot, C. 2014, November 10. Professor of Applied Sciences at Rotterdam University and
INholland University . (D. Kantor, Interviewer)
Sailor, D. J., B. Bass.2014. Development and features of the Green Roof Energy Calculator. Journal
of Living Architecture, 1(3):36-58.
Schönerman, S. 2007. Von der Inverstition zur Rendite: Kosten-Nutzen-Rechungen von
Dachbegrünungen. [From the investment to positive return: cost-benefit calculations of green
roofs.]Wadenswil: Hochshule Gruental.
Schmid, T. 2007. Pflege gut- alles gut? Unterhalt von begrünten Dachflächen. [All’s well that ends
well? Maintenance of green roofs.] Wädenswil: Hochshule Wädenswil.
Swiss Chapter of International Facilities Management Association. 2011. Life Cycle Costing of Real
Estate Part 1: Model. Zürich: IFMA Swizerland.
Ulrich, R. S. 2008. Biophilic Theory and Research for Healthcare Design. In S. R. Kellert, J. H.
Heerwagen, & M. L. Mador, Biophilic Design (pp. 87-106). Hoboken, New Jersey, United
States of America: John Wiley & Sons, Inc.
United States General Services Administration. 2011. The Benefits and Challenges of Green Roofs on
Public Buildings. Suitland: United States Genergal Services Administration.
van Peijpe, D., F. Boer, J. Hurtado, J. Jorritsma, E. Marin, A. Wissing, 2013. Rotterdam Adaptation
Strategy. Rotterdam, Holland: City of Rotterdam.
Van Roosmalen, P. 2014, September 29. Municipality of Rotterdam Department of Project
Management and Engineering, Programme Manager of Green Roofs. (D. Kantor, Interviewer)
Werthmann, C. 2007. Green Roof - A Case Study. New York: Princeton Architectural Press.
Wilson, E. 1984. Biophilia. Cambridge, Massachusetts, USA: Harvard Press University.