
LIFE CYCLE ASSESSMENT (LCA) OF TOTO SANITARY FITTING … · All information in the report reflects...
55
LIFE CYCLE ASSESSMENT (LCA) OF TOTO SANITARY FITTING PRODUCTS Status Final report after third party review Client TOTO USA Date August 2014 Author(s) Naji Kasem, Kristen Girts, Gary Soe and Joep Meijer
Transcript of LIFE CYCLE ASSESSMENT (LCA) OF TOTO SANITARY FITTING … · All information in the report reflects...
LIFE CYCLE ASSESSMENT (LCA) OF TOTO SANITARY FITTING PRODUCTS
Status
Final report after third party review
Client
TOTO USA
Date August 2014
Author(s) Naji Kasem, Kristen Girts, Gary Soe and Joep Meijer

Page | 3
Contents
1 INTRODUCTION ................................................................................................... 5 1.1 Opportunity ................................................................................................... 5 1.2 Life Cycle Assessment ................................................................................. 5 1.3 Status ........................................................................................................... 6 1.4 Team ............................................................................................................ 6 1.5 Structure ....................................................................................................... 7
2 GOAL AND SCOPE ............................................................................................... 8 2.1 Intended application and audience ............................................................... 8 2.2 TOTO products ............................................................................................. 8 2.3 Functional units ........................................................................................... 11 2.4 System boundaries ..................................................................................... 12
2.4.1.Production stage [A1-A3] ................................................................... 13 2.4.2.Construction stage [A4-A5] ................................................................ 18 2.4.3.Use stage [B1-B5] .............................................................................. 19 2.4.4.End-of-life stage [C1-C4] ................................................................... 21 2.4.5.Recovery stage [D] ............................................................................ 22
3 INVENTORY ........................................................................................................ 24 3.1 Data categories ........................................................................................... 24 3.2 Data selection and quality ........................................................................... 24 3.3 Limitations................................................................................................... 25 3.4 Criteria for the exclusion of inputs and outputs ........................................... 26 3.5 Allocation .................................................................................................... 26
4 IMPACT ASSESSMENT ...................................................................................... 28 4.1 Impact assessment ..................................................................................... 28 4.2 Normalization and weighting ....................................................................... 29
5 INTERPRETATION.............................................................................................. 30 5.1 TET1LN ...................................................................................................... 30 5.2 TEU1LN & TEU1UN ................................................................................... 33 5.3 TEL3LS10 & TEL5LS10 ............................................................................. 36 5.4 Sensitivity analysis ...................................................................................... 39 5.5 Discussion on data quality .......................................................................... 41 5.6 Recommendations ...................................................................................... 42
6 SOURCES ........................................................................................................... 43
ACRONYMS ................................................................................................................ 44
GLOSSARY ................................................................................................................. 44
APPENDIX A. LCI AND OTHER STARTING POINTS FOR THE FITTINGS MANUFACTURING PROCESS ................................................................................................................... 47

Page | 4
APPENDIX B. ADDITIONAL RESULTS ...................................................................... 56
APPENDIX C. IMPACT CATEGORIES ....................................................................... 56
APPENDIX D. USED DATASHEETS .......................................................................... 56
APPENDIX E. LCI........................................................................................................ 56
APPENDIX F. LCIA METHOD ..................................................................................... 56
APPENDIX G. PROCESS FLOW DIAGRAMS ............................................................ 56

Page | 5
1 INTRODUCTION
1.1 Opportunity
TOTO USA is committed to innovating products that make people’s lives better, protect the environment and keep our water pure. To honor our commitment to sustainability, it is important that we conduct Life Cycle Assessments to evaluate the environmental impacts of our products in all stages of life, from raw materials, to manufacturing, through to disposal. The goal of conducting a Life Cycle Assessment is to explore the full range of environmental impacts our products have and to identify ways to improve processes and lessen any negative effects. This project is critical to TOTO’s PeoplePlanetWater mission of innovating products for the benefit of people, the planet and our water supply. TOTO is interested in having Life Cycle Assessment (LCA) data available for the most important products to be able to obtain a SM Transparency Report, a type III environmental declaration, that can be used for communication with and amongst other companies, architects and consumer communication and also can be utilized in whole building LCA tools. TOTO commissioned Sustainable Minds to help develop LCA’s for the most important fitting products. TOTO wants to develop the internal capacity to develop LCAs. This means an effort has been made to gather data and to train TOTO staff to model LCAs and how to report on them. TOTO wants to learn from the results and is looking forward to having guidance for future product improvements that can be deduced from the results.
1.2 Life Cycle Assessment
Performing a life cycle assessment (LCA) follows the Sustainable Minds Transparency Report Framework, which is based on ISO 14040-44 & 14025 standards. Such an LCA includes the following phases:
• Goal and Scope • Inventory Analysis • Impact Assessment • Interpretation
This report includes all phases. According to the Framework, a stakeholder procedure is required when LCA results are intended to be used for external communication and a comparison is made to products that are not produced by the commissioning party. This report concerns products from

Page | 6
TOTO only; therefore a critical review is not required. An ISO 14044 third party review and a third part report certification for transparency reports are options in the Framework in order to be able to use it as a Type III Environmental Declaration. Both of these reviews will be completed in this project.
1.3 Status
All information in the report reflects the best possible inventory by TOTO at the time it was collected and best practice of Sustainable Minds to transform this information into this LCA report was conducted. The data covers annual manufacturing data for the time period between the years 2012 and 2014. This study includes primary data from the processes at TOTO, secondary data from suppliers that have been contracted and literature data to complete the inventory and fill the gaps. TOTO relies on vendors for the components and assembly of some of the fittings products that are sold under its name. TOTO has chosen to have the LCA data and report go through third party review against Parts A and Part B of the SM Transparency Report framework, which includes compliance with ISO 14025 and ISO 14040/44. A third party review has been performed by Brad McAllister, WAP Director, who was contracted on behalf of NSF to critically review this report. The review concluded that the report is in conformance with ISO 14040-44. Several comments have been made and responses to them have all been included in this final report. A review statement is included in the appendices of this report. TOTO has also chosen to have the Transparency Report third party certified against Parts A and Part B of the SM Transparency Report framework. A third party review has been performed by Brad McAllister, WAP Director, who was contracted on behalf of NSF to critically review this report. . The review concluded that the report is in conformance with the Sustainable Minds Transparency Report Framework. Several comments have been made and responses to them have all been included in this final report. A review statement is included in the appendices of this report.
1.4 Team
This report is based on the work of the following LCA project team members on behalf of TOTO:
• Bill Strang, Project Sponsor • Kristen Girts, Project Manager & Associate Quality Engineer • Gary Soe, Senior Product Engineer
They have been assisted by numerous TOTO employees during the product group definition, data collection, reporting and interpretation. From Sustainable Minds:
• Naji Kasem, LCA Practitioner • Millali Marcano, Project Manager

Page | 7
• Joep Meijer, LCA Technical Expert
1.5 Structure
This report follows the structure of the life cycle assessment methodology defined in the Sustainable Minds Framework as well as the Product Group Definitions (PGDs) of the respective products. It starts with the goals and scope in chapter 2. Chapter 3 includes the inventory and the impact assessment can be found in chapter 4. Chapter 5 details the interpretation phase. This report includes LCA terminology. To assist the reader, special attention has been given to list definitions of important terms used at the end of this report.
Page | 8
2 GOAL AND SCOPE
This chapter lays down the starting points for the LCA. The aim of the goal and scope is to define the products under study and the depth and width of the analysis.
2.1 Intended application and audience
This report intends to define the specific application of the LCA methodology to the life cycle of TOTO fittings. It is intended for both internal and external purposes. A Sustainable Minds Transparency Report, a Type III Environmental Declaration per ISO 14025, will report the results of this study, which is focused on products that are available in the US market.
2.2 TOTO products
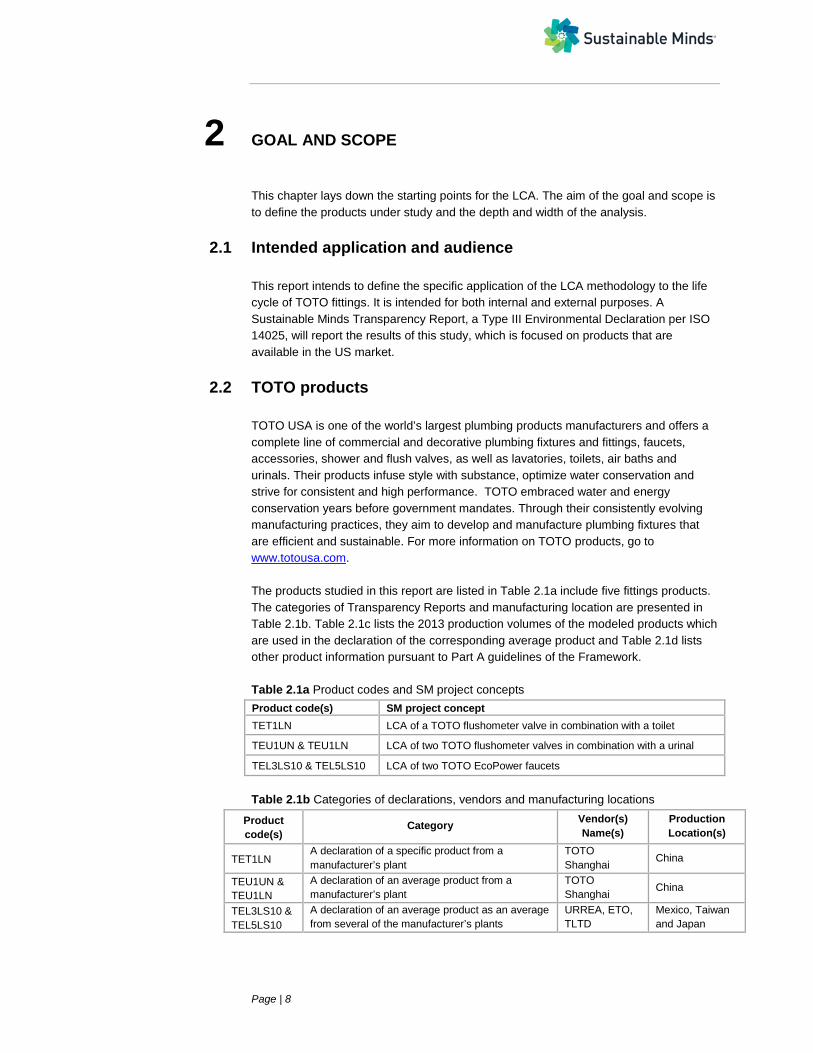
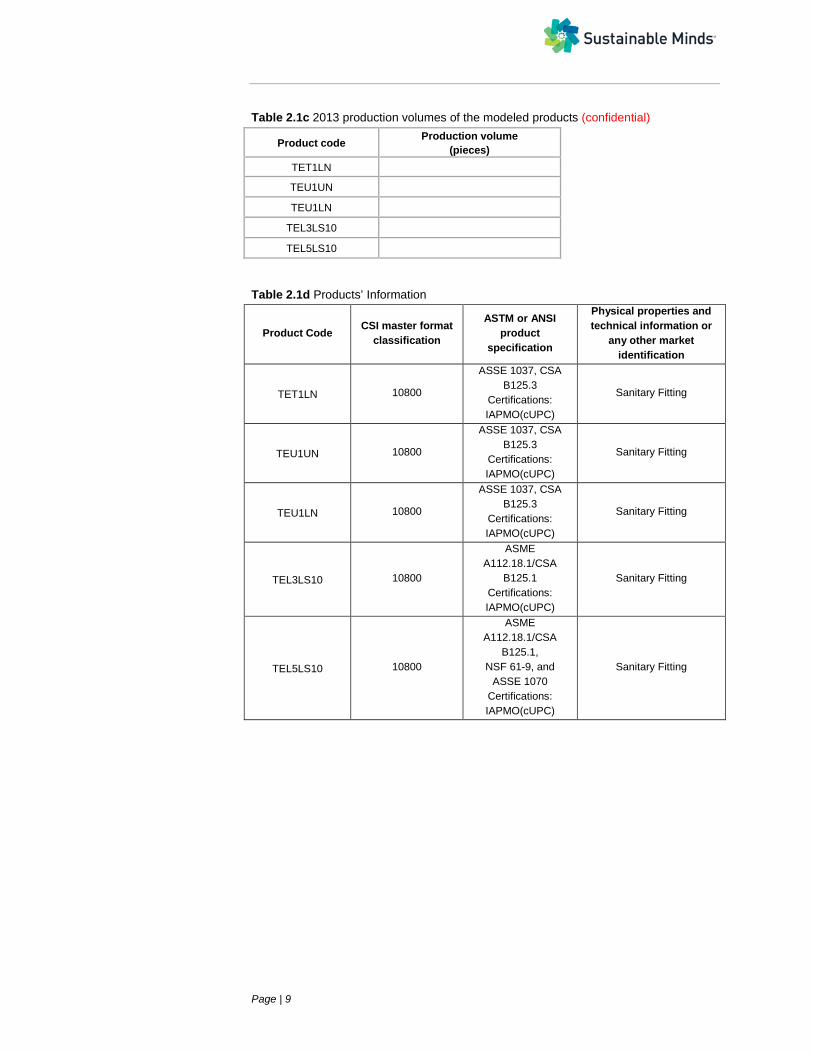
TOTO USA is one of the world’s largest plumbing products manufacturers and offers a complete line of commercial and decorative plumbing fixtures and fittings, faucets, accessories, shower and flush valves, as well as lavatories, toilets, air baths and urinals. Their products infuse style with substance, optimize water conservation and strive for consistent and high performance. TOTO embraced water and energy conservation years before government mandates. Through their consistently evolving manufacturing practices, they aim to develop and manufacture plumbing fixtures that are efficient and sustainable. For more information on TOTO products, go to www.totousa.com. The products studied in this report are listed in Table 2.1a include five fittings products. The categories of Transparency Reports and manufacturing location are presented in Table 2.1b. Table 2.1c lists the 2013 production volumes of the modeled products which are used in the declaration of the corresponding average product and Table 2.1d lists other product information pursuant to Part A guidelines of the Framework. Table 2.1a Product codes and SM project concepts Product code(s) SM project concept TET1LN LCA of a TOTO flushometer valve in combination with a toilet
TEU1UN & TEU1LN LCA of two TOTO flushometer valves in combination with a urinal
TEL3LS10 & TEL5LS10 LCA of two TOTO EcoPower faucets
Table 2.1b Categories of declarations, vendors and manufacturing locations
Product code(s)
Category Vendor(s) Name(s)
Production Location(s)
TET1LN A declaration of a specific product from a manufacturer’s plant
TOTO Shanghai China
TEU1UN & TEU1LN
A declaration of an average product from a manufacturer’s plant
TOTO Shanghai China
TEL3LS10 & TEL5LS10
A declaration of an average product as an average from several of the manufacturer’s plants
URREA, ETO, TLTD
Mexico, Taiwan and Japan
Page | 9
Table 2.1c 2013 production volumes of the modeled products (confidential)
Product code Production volume (pieces)
TET1LN
TEU1UN
TEU1LN
TEL3LS10
TEL5LS10
Table 2.1d Products’ Information
Product Code CSI master format classification
ASTM or ANSI product
specification
Physical properties and technical information or
any other market identification
TET1LN 10800
ASSE 1037, CSA B125.3
Certifications: IAPMO(cUPC)
Sanitary Fitting
TEU1UN 10800
ASSE 1037, CSA B125.3
Certifications: IAPMO(cUPC)
Sanitary Fitting
TEU1LN 10800
ASSE 1037, CSA B125.3
Certifications: IAPMO(cUPC)
Sanitary Fitting
TEL3LS10 10800
ASME A112.18.1/CSA
B125.1 Certifications: IAPMO(cUPC)
Sanitary Fitting
TEL5LS10 10800
ASME A112.18.1/CSA
B125.1, NSF 61-9, and
ASSE 1070 Certifications: IAPMO(cUPC)
Sanitary Fitting

Page | 10
Below are some pictures and descriptions of selected products. Table 2.2 Descriptions of the modeled products TET/U 1LN
EcoPower® toilet and/or urinal flushometer valve only
Revolutionary self-generating hydropower system
Automatic sensor activated piston toilet flush valve
Superior Piston Valve ADA Compliant
EcoPower toilet and/or urinal flushometer valve only, top spud - exposed model, 1.28 gpf for toilet and 0.5 gpf for urinal. Neutral rough-in. Chrome Plated Finish.
TEU1UN
EcoPower® urinal flushometer valve only Revolutionary self-generating hydropower
system Automatic sensor activated piston toilet
flush valve Superior Piston Valve ADA Compliant Watersense
EcoPower urinal flushometer valve only, top spud - exposed model, 0.125 gpf. Neutral rough-in. Chrome Plated Finish.
TEL3LS10 & TEL5LS10
TEL3LS10 – Single Supply Model TEL5LS10 – Thermal Mixing Model Contemporary styling Less than 0.09 gallon/cycle 10 second continuous discharge Cleaner restrooms, significant water
savings Revolutionary self-generating hydropower
system Smart Sensor sets its own range, no
adjustments Easy Access Screen for quick and easy
cleaning ADA Compliant Complies with CA AB1953 and VT S152 CalGreen compliant
Self-adjusting faucet with control box and mounting hardware, less supply lines. Standard spout. Chrome plated. 1/2" water supply male threaded. Single hole mount. ADA compliant. 10-second continuous discharge. EcoPower self-generating hydropower system.

Page | 11
2.3 Functional units
The results of the LCA in this report are expressed in terms of a functional unit as it covers the entire life cycle of the products (Table 2.3). The Transparency Reports of the corresponding products listed in Table 2.1 are expressed in terms of one respective piece of product as well as all life cycle modules, which are presented later in this report. The reference units express the amount of a product and its function as it is applied and/or used in the United States of America and it includes the lifespan of the product. The list of functional units and their corresponding products is presented in Table 2.3. The functional units are taken from the product group definition (PGD) documents pursuant to Part B of the SM Transparency Report Framework [7, 8]. TOTO products comply with the functional performance specifications laid down in the aforementioned PGDs. Table 2.3 Functional units of the modeled products Product code(s) Functional Unit TET1LN (single product)
10 years of use of a flush valve for toilets and urinals in an average U.S. commercial environment.
TEU1LN & TEU1UN (multi product)
10 years of use of a flush valve for toilets and urinals in an average U.S. commercial environment.
TEL3 LS10 & TEL5LS10 (multi product)
3 years of use of a faucet in an average U.S. commercial environment

Page | 12
2.4 System boundaries To define what is and what is not included in an LCA, the so-called system boundaries are drafted. In general, the system boundaries as laid down in Part A [6] are followed. This section details some of the aspects to assist the reader to understand what is included in the models. The system boundaries reflect the life cycle phases that have been modeled. It defines which life cycle phases and processes are included and which are not. The LCA is modeled according to a specific system boundary and is quantified in such a way that they reflect the respective reference units of the modeled products as defined in Section 2.3 herein (Table 2.3). This LCA’s system boundaries include the following life cycle phases:
- Production - Construction - Use - End of life - Recovery
These boundaries apply to all the modeled products and can be referred to as “cradle-to-grave” which means that it includes all life cycle stages and modules as identified in Part A [6]. The system boundaries for TOTO fitting products are detailed below. Figure 2.1 represents a process flow diagram for the entire life cycle of these products.
Figure 2.1 Applied system boundaries for the modeled fitting products.

Page | 13
2.4.1. Production stage [A1-A3] The product stage includes, where relevant, information modules for: - A1: Extraction and processing of raw materials (e.g. mining processes) and
biomass production and processing (e.g. agricultural or forestry operations) - A1: Reuse of products or materials from a previous product system - A1: Processing of secondary materials used as input for manufacturing the product,
but not including those processes that are part of the waste processing in the previous product system
- A1: Generation of electricity, steam and heat from primary energy resources, including extraction, refining and transport thereof
- A1: Energy recovery and other recovery processes from secondary fuels, but not including those processes that are part of waste processing in the previous product system
- A2: Transportation up to the factory gate in addition to internal transport - A3: Production of ancillary materials or pre-products - A3: Manufacturing of packaging - A1-A3: Processing up to the end-of-waste state or disposal of final residues
including any packaging not leaving the factory gate with the product. A description of the most important modeling parameters is included below. 2.4.1.1. Raw Materials Table 2.4 Fitting products’ weights Product Code TET/U 1LN TEU1UN TEL3LS10 TEL5LS10 Total weight (kg, excluding packaging) 3.69 3.47 2.09 2.93
The metal components make up the largest portion of the body of a fitting. Inputs to the production system of the modeled fitting products are comprised of the following, showing all the parts that have a contribution > 0.15% weight of the total bill of materials
Table 2.5 Fitting products’ raw materials (confidential)
Constituent / Material type
Mater-ials (%)
Recycled content
%
Mater-ials (%)
Recycled content
%
Mater-ials (%)
Recycled content
%
Mater-ials (%)
Recycled content
%
TET/U 1LN TEU1UN TEL3LS10 TEL5LS10 AA Li-ion battery
ABS Brass Brass (C360000)
Brass (crovalent coating)
Brass Pb free Bronze Bronze (C836000)
Copper Copper alloy

Page | 14
Double wall EPDM Epoxy resin Magnet NBR Nickel titanium alloy
Paper Surface mount, Pb containing
Polyacetal polyethylene PP PPO PPS PU rigid PVC Steel Surfacemount Stainless steel, SUS303
Stainless steel, SUS304
Stainless steel, SUS305
Zinc Die cast The recycled content is particularly relevant for the metal components. The values of the recycled content provided by the vendors are presented. A more detailed raw materials definition of the products as required by Part A is presented in appendix A (Tables A.1 through A. 5). The modeling involved the usage of datasets from Ecoinvent, US-Ecoinvent or a modification both to meet geographical boundaries. Included are all materials that together contribute over 99% of the weight of all fitting parts, excluding packaging materials. The specific numbers of completeness are listed below (Table 2.6). Table 2.6 Completeness of the parts with 0.15% weight cut-off Product code %wt covered TET/U 1LN 99.79 TEU1UN 99.80
TEL3LS10 99.70 TEL5LS10 99.69 2.4.1.2. Packaging The finished product is packaged and ready for transportation to the US market. The specific numbers of the packaging materials’ weights are listed below (Table 2.7).

Page | 15
Table 2.7 Packaging information for fittings
Product code Total weight (g) Cardboard (g) Others (g)* TET/U 1LN 832.72 681.07 151.64 TEU1UN 832.72 681.07 151.64
TEL3/5 LS10 841.91 751.21 90.71 * Others are manuals (paper) and bags (PE) and stickers (Aluminum)
2.4.1.3. Transportation The transportation of the materials to the manufacturing sites and/or to the warehouse (FAP1) were either provided by vendors or estimated. The totals per product are presented below (Table 2.8a&b). Table 2.8a Transportation of materials to manufacturing sites (confidential)
Means tkm TET/U 1LN TEU1UN TEL3LS10 TEL5LS10
Truck Rail Ocean freighter UPS Truck
Table 2.8b Transportation of finished products to FAP (confidential)
Means tkm TET/U 1LN TEU1UN TEL3LS10 TEL5LS10
Truck Rail Ocean freighter UPS Truck
2.4.1.4. Manufacturing The process flow for fittings products is as follows: Raw materials, such as ores petroleum byproducts, are purchased and utilized in
the manufacturing of intermediates (materials with certain engineering properties). Intermediates include metal alloys such as brass, steel, bronze, etc. Others include non-metals such as rubbers and thermoplastics.
Often, the intermediates are manufactured in the same facility in which the fitting’s sub-assemblies are manufactured. If not, the intermediates are purchased and transported to the facility.
The intermediates are manufactured into various fittings’ sub-assemblies, each designated for a specific function. The primary methods used for shaping sub-assemblies include, but are not limited to: Die casting Sheet rolling Turning Injection molding Wire drawing Tempering Extrusion
1 FAP = TOTO Fairburn Assembly Plant
Page | 16
Potting Soldering
Depending on their function, some components undergo the following secondary and tertiary processes to alter aesthetics which include but are not limited to: Polishing, brushing and etching Electroplating and PVD plating
TOTO purchases fittings products from the manufacturer as either finished goods or as sub-assemblies and components. These purchases are shipped to the TOTO Fairburn Assembly Plant (FAP). Finished goods: Finished Goods are visually and dimensionally inspected and
water tested by the manufacturer to ensure that they meet TOTO’s aesthetic and performance criteria. Electrical components are tested for proper function as well. The materials in the pieces that fail inspection are reworked, recycled as scrap metals, or sent to landfill. Pieces that pass are assembled and packaged as finished goods. Finished goods are shipped to FAP and go directly into inventory.
Sub-assemblies: Sub-assemblies and components undergo various levels of inspection by the manufacturer. They are packaged and shipped for further inspection, testing, and assembly by FAP.
Further assembly by FAP may be required to the purchased sub-assemblies. Sub-Assemblies are visually and dimensionally inspected and water tested in FAP
to ensure that they meet TOTO’s aesthetic and performance criteria. The materials in the pieces that fail inspection are reworked, recycled as scrap metals, or sent to landfill. Pieces that pass are assembled and packaged as a finished good and placed into inventory.
To model the manufacturing, the processes involved and the yield percentages of the primary processes were provided by the vendors and modeled. Secondary and tertiary processes were also provided by the vendors and are modeled. An overview of these processes for each corresponding product is included in the tables below (2.9 (a) through 2.9 (f)). The tables list the types of processes, the materials and the average yield percentages for primary processes. The combination of the processes and the materials is used as the basis for the manufacturing model. A more detailed description of the modeled processes as required by Part A is presented in appendix A (Tables A.6 through A. 14). The modeling involved the usage of datasets from Ecoinvent, US-Ecoinvent or a modification both to meet geographical boundaries. Table 2.9 (a): Primary processes, materials and yield for TET1LN and TEU1LN (confidential)
TET1LN and TEU1LN
Primary Process Material(s) Average Yield (%)

Page | 17
Table 2.9 (b): Primary processes, materials and yield for TEU1UN (confidential)
TEU1UN
Primary Process Material(s) Average Yield (%)
Table 2.9 (c): Secondary and tertiary processes and materials for TET1LN, TEU1LN and TEU1UN (confidential)
TET1LN, TEU1LN and TEU1UN Secondary and
Tertiary Process Material(s)
Table 2.9 (d): Primary processes, materials and yield for TEL3LS10 (confidential) TEL3LS10
Primary Process Material(s) Average Yield (%)

Page | 18
Table 2.9 (e): Primary processes, materials and yield for TEL5LS10 (confidential)
TEL5LS10
Primary Process Material(s) Average Yield (%)
Table 2.9 (f): Secondary and tertiary processes and materials for TEL3LS10 and TEL5LS10 (confidential)
TEL3LS10 and TEL5LS10 Secondary or
Tertiary Process Material(s)
* TEL5LS10 only
2.4.2. Construction stage [A4-A5] The construction process stage includes the following information modules: - A4: Transport to the building site - A5: Construction / installation in the building
2.4.2.1. Transportation to site After products are purchased by distributers, dealers, and showrooms for purchase by the end users, they are transported from the FAP warehouse to these purchasers. Transportation and distance would vary and are dependent on the locations of the purchasers and their choice of shipping mode. Transportation of finished packaged products to the warehouse from vendors is done by diesel trucks (average of 30mi). Outbound shipments to customers from FAP are transported by both diesel truck (average of 947mi) and rail (average of 1114mi). These numbers are estimated based on actual 2013 shipment averages. 2.4.2.2. Construction / Installation After customers purchase the fitting products from distribution centers, fittings are installed with other toilets, urinals or sinks. Other than packaging cartons, bags and manual becoming waste, nothing else is required or removed at this stage. Waste processing of the waste from product packaging up to the end-of-waste state or disposal of final residues is included in this module.

Page | 19
2.4.3. Use stage [B1-B5] The use stage includes the following information modules: - B1: Use or application of the installed product - B2: Maintenance - B3: Repair - B4: Replacement - B5: Refurbishment - B6-B7: Operational energy and water use 2.4.3.1. Use or application of the installed product There are no additional activities or construction work needed or associated with the installation of the product during the use phase. Therefore, this is not included in the model. 2.4.3.2. Maintenance The service life is defined in such as way that for a typical installation, no regular maintenance activities other than cleaning of the sanitary facilities as a whole is required. There is no maintenance as such included in the model. 2.4.3.3. Repair The service life is defined in such as way that for a typical installation, no repair is required. Repair would be incidental. There is no repair as such included in the model. 2.4.3.4. Replacement The service life is defined in such as way that for a typical installation, replacing a whole product in order to return product to a condition in which it can perform its required functional or technical performance is not required. Replacements are not relevant and therefore no calculation rules need to be defined. The model does not include replacements. 2.4.3.5. Refurbishment The service life is defined in such as way that for a typical installation, no refurbishment is required. There is no refurbishment as such included in the model. 2.4.3.6. Operational energy and water use The use stage related to the operation of the building includes: - B6: Operational energy use - B7: Operational water use The use phase of the fitting products modeled in this report follow the declared default life cycle use phase scenario in the approved Product Group Definitions (PGDs) of the

Page | 20
Sustainable Minds Transparency Report Framework referenced herein [7,8]. The water usage of the products is calculated and a summary of the same is listed in Table 2.10. Table 2.10 Water usage of the products
Product(s) code(s)
Total number of uses during modeled life
Water Consumption (gal/use)
Total consumption during modeled life (gal)
TET1LN 365 days/year x 10 years x 133 uses/day = 485,450 uses 1.28 621,376
TEU1LN 260 days/year x 10 years x 18 uses/day = 46,800 uses 0.5 23,400
TEU1UN 260 days/year x 10 years x 18 uses/day = 46,800 uses 0.125 5,850
TEL3LS10 & TEL5LS10
365 days/year x 3 years x 133 uses/day = 145,635 uses 0.08 12,136
Water usage in a residential or commercial environment would also include electricity usage for acquisition, treatment and distribution of water to households and collection, conveyance and wastewater treatment of domestic wastewater. Heating for hot water use was not included in the model. Electric Power Research Institute (EPRI) published this type of data in a study on water and sustainability. U.S. EPA data were used to establish weighted average composite factors, to obtain an electricity usage per gallon of water consumed. The foregoing is summarized in Table 2.11 below.
Table 2.11 Average national electricity usage per gallon of water consumed
Activity EPRI factors: kWh / MMgalNote 1
Weighted avg composite factors: kWh / MMgal
Acquisition, treatment and distribution of surface water by a Public Water System (PWS) 1,406
1,540Note 2 Acquisition, treatment and distribution of ground water by a PWS 1,824
Self-supply of drinking water (typically pumping from private wells) 700 700
Collection, conveyance and < secondary treatment of domestic wastewater 661
1,399Note 3
Collection, conveyance and secondary treatment of domestic wastewater 1,212
Collection, conveyance and advanced treatment of domestic wastewater 1,726
Collection, conveyance and zero discharge/other treatment of domestic wastewater
400
Total electricity per million gallons 3,639
Total kWh electricity per 1 gallon 0.0036
Note 1: Source: EPRI, Water & Sustainability (Volume 4): U.S. Electricity Consumption for Water Supply & Treatment -- The Next Half Century, March 2002. Note 2: 63% of population served by PWSs relies on surface water, 37% on ground water. Calculated from http://www.epa.gov/safewater/pws/factoids.html. Note 3: 1.5% of POTW-served population receives < secondary treatment, 43.3% receives secondary treatment, 48.7% receives advanced treatment, and 6.5% receives zero discharge or other treatment. Source: EPA, 2004 Clean Watersheds Needs Survey. The summary of the use phase data for the fittings over their respective reference service life is provided in Table 2.12 below.
Page | 21
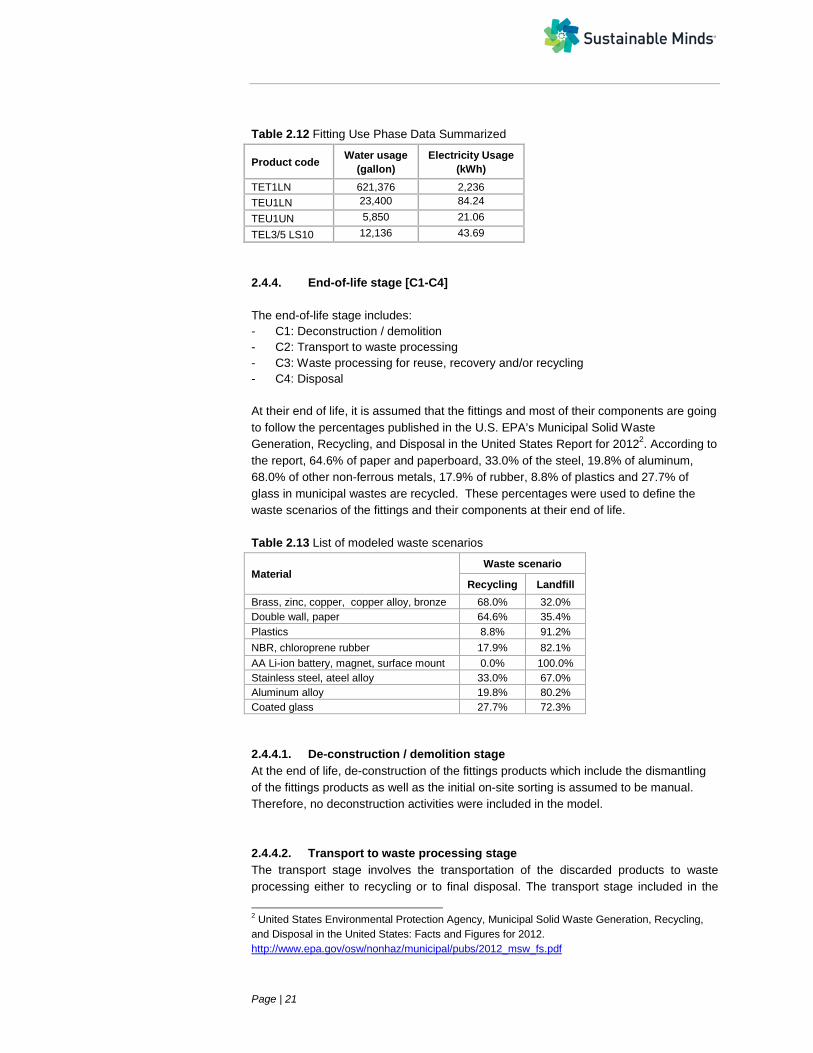
Table 2.12 Fitting Use Phase Data Summarized
Product code Water usage (gallon)
Electricity Usage (kWh)
TET1LN 621,376 2,236 TEU1LN 23,400 84.24
TEU1UN 5,850 21.06 TEL3/5 LS10 12,136 43.69 2.4.4. End-of-life stage [C1-C4] The end-of-life stage includes: - C1: Deconstruction / demolition - C2: Transport to waste processing - C3: Waste processing for reuse, recovery and/or recycling - C4: Disposal At their end of life, it is assumed that the fittings and most of their components are going to follow the percentages published in the U.S. EPA’s Municipal Solid Waste Generation, Recycling, and Disposal in the United States Report for 20122. According to the report, 64.6% of paper and paperboard, 33.0% of the steel, 19.8% of aluminum, 68.0% of other non-ferrous metals, 17.9% of rubber, 8.8% of plastics and 27.7% of glass in municipal wastes are recycled. These percentages were used to define the waste scenarios of the fittings and their components at their end of life. Table 2.13 List of modeled waste scenarios
Material Waste scenario
Recycling Landfill Brass, zinc, copper, copper alloy, bronze 68.0% 32.0% Double wall, paper 64.6% 35.4% Plastics 8.8% 91.2% NBR, chloroprene rubber 17.9% 82.1% AA Li-ion battery, magnet, surface mount 0.0% 100.0% Stainless steel, ateel alloy 33.0% 67.0% Aluminum alloy 19.8% 80.2% Coated glass 27.7% 72.3% 2.4.4.1. De-construction / demolition stage At the end of life, de-construction of the fittings products which include the dismantling of the fittings products as well as the initial on-site sorting is assumed to be manual. Therefore, no deconstruction activities were included in the model. 2.4.4.2. Transport to waste processing stage The transport stage involves the transportation of the discarded products to waste processing either to recycling or to final disposal. The transport stage included in the
2 United States Environmental Protection Agency, Municipal Solid Waste Generation, Recycling, and Disposal in the United States: Facts and Figures for 2012. http://www.epa.gov/osw/nonhaz/municipal/pubs/2012_msw_fs.pdf

Page | 22
model is based on the assumption that the product will travel 100 km on a truck either to a landfill as a final disposal or to a recycling site. 2.4.4.3. Waste processing stage The waste processing of material flows transported to a recycling site following the waste scenarios of materials as listed in Table 2.13 were assumed to be intended for recycling and were included in the model. All processing including pre-sorting, crushing, and shredding were modeled. 2.4.4.4. Disposal stage The disposal of material flows transported to a landfill following the waste scenarios of materials as listed in Table 2.13 was included in the model. 2.4.5. Recovery stage [D] Module D reports the environmental benefits or loads resulting from net flows of reusable products, recyclable materials and/or useful energy carriers leaving a product system (e.g. as secondary materials or fuels). It includes recycling potentials of materials expressed as net impacts and benefits. All recycled materials as shown in Table 2.13 is processed in the waste processing stage (i.e. Module [C3]). The transportation (500 miles) as well as the recycling processing of all recycled materials into new materials are included in this stage. It was assumed that on average a yield of 90-95% substitutes that amount of primary material (Table 2.14). There is no thermal recovery modeled for end of life as is defined in the scenarios in Table 2.13.
Table 2.14 Substitution in the recovery stageMaterial
% of substitution
Material substituted with
ABS 90% HDPE Brass, primary 95% Brass Brass, secondary 95% Brass Brass, Cr covalent coating 95% Brass Brass, Pb free 95% Brass Brass, C360000 95% Brass Bronze, primary 95% Bronze Bronze, secondary 95% Bronze Bronze, C836000 95% Bronze Copper 95% Copper Copper alloy 95% Copper Cardboard, primary 95% Sulphate pulp Cardboard, recycled 95% Sulphate pulp EPDM 90% HDPE Epoxy resin 90% HDPE NBR 90% HDPE Paper 95% Sulphate pulp Polyacetal 90% HDPE Polyethylene 90% HDPE Polypropylene 90% HDPE PPO 90% HDPE

Page | 23
PVC 90% HDPE Steel 95% Pig iron Stainless steel, SUS304 95% Steel Stainless steel, SUS305 95% Steel Zinc, primary 95% Zinc

Page | 24
3 INVENTORY
This chapter includes an overview of the obtained data and data quality that has been used in this study.
3.1 Data categories
The impacts have been inventoried for the following data categories:
- energy inputs - material inputs - emissions to air, water and soil - production of waste and treatment - produced products
The abovementioned flows are called data categories. They define the scope of the inventory.
3.2 Data selection and quality
Most of the manufacturing data came from primary sources for the calendar year 2013. TOTO Manufacturing Department in Shanghai, China collected the data using electric bill, purchasing orders, TOTO USA’s order volume, info on damaged goods, and production yield and efficiency. TOTO USA Senior Product Engineer, Gary Soe has been to the manufacturing plants/sites supplying TOTO parts, components and products in China. Communications between TOTO USA and TOTO Shanghai was done for all data required and data validation process was done by both TOTO Shanghai and Gary Soe. No materials, components, emissions or energy flows have been left out, except for minor parts where the primary sources’ data was incomplete or contradictory to the average industry data. This follows the general rule that either specific data or average data derived from specific production processes shall be the first choice as outlined in Part A of the Framework. Where products are declared together weighted averages have been used based on the processes and materials for the individual products. Product composition data have been provided by TOTO. Data was pulled off from bills and provided to TOTO USA by the suppliers who calculated data required per TOTO’s consumption during the time period. Data collections were done by manufacturing engineers in Shanghai, China and verification/validation was done by both TOTO Shanghai and Development Engineering Department of TOTO USA using know-how and information on machines’ power ratings of suppliers, sites’ conditions and labor force, electricity prices in the manufacturing cities and yield and production efficiency information, and product consumption rate at TOTO USA. TOTO suppliers have provided primary data for all the manufacturing processes that reflect the actual processes in an accurate and complete fashion. Sustainable Minds has provided

Page | 25
questionnaires and feedback to warrant completeness and consistency. Some data was confidential and is therefore not included in this report, but has been part of a review by Sustainable Minds. We have used publicly available data on composition and manufacturing for upstream and missing data and have supplemented that with literature data that is representative for the products on the US market. Electricity is modeled with country specific grid mixed based on EcoInvent 2.2 definitions. This relates to the country of the vendors and the use phase in America. When transforming the inputs and outputs of combustible material into inputs and outputs of energy, the lower caloric value specific to the material have been applied based on scientifically accepted values. Scenarios have been used to model the use stage, as defined in the PGDs, and end-of-life phase. Details are provided in the description of the life cycle stages earlier on in this report. All used primary data reflects data for the calendar year 2013, with regional specific data. All used background data to model the LCA is reported in the appendix D. Literature data comprises of the best available data from consistent sources, but varies from material to material in geographical, time related and technology coverage due to limited availability of specific data. Data from the US EcoInvent database was aimed to be used mostly. However, this does not warrant full consistency between all data sets. Different data can result in differences per material and that can influence the comparison. By using the US EcoInvent data the report follows the data quality in these datasets as it relates to time period coverage. The main criteria for data selection were the technological coverage as to reflect the physical reality of the declared product or product group as close as possible.
3.3 Limitations
The LCA is limited in the following ways: All vendors have responded to the request for data in great detail. However, this is
the first time the vendors have been contacted with LCA related questions. It is therefore recommended that the vendors will be contacted for future LCA work again and focus on some more details for the most important processes.
Recycled content for the metal parts as provided by vendors were used. No assumption of virgin material was made even when no information was provided by the vendors. This is likely a worst-case scenario. These numbers need to be validated in future LCA projects. There is a significant improvement potential for using more recycled content.
Scenarios have been used to model the use phase as defined by the PGDs. Scenarios have been used for the end of life treatment of the materials. Literature data has been used based on the USLCI database and the US-ecoinvent
database. With future updates and more and more LCA information becoming available, more representative and less generic data should be used for future LCA projects where possible.

Page | 26
3.4 Criteria for the exclusion of inputs and outputs
The time period over which inputs to and outputs from the system are accounted for is 100 years from the year for which the data set is deemed representative. The cut-off criteria on a unit process level can be summarized as follows: - Mass – If a flow is less than 1% of the cumulative mass of the model it may be
excluded, providing its environmental relevance is not a concern. - Energy – If a flow is less than 1% of the cumulative energy of the model it may be
excluded, providing its environmental relevance is not a concern. - Environmental relevance – If a flow meets the above criteria for exclusion, yet is
thought to potentially have a significant environmental impact, it is included. Material flows which leave the system (emissions) and whose environmental impact is greater than 1% of the whole impact of an impact category that has been considered in the assessment have been covered. This judgment is done based on experience and documented as necessary, but also relies on the used literature data.
- The sum of the neglected material flows does not exceed 5% of mass, energy or environmental relevance for flows indirectly related to the process (e.g. operating materials).
In this report almost all flows for the primary data for TOTO and the vendors have been reported, therefore these criteria have been met. The completeness of the bill of materials is reported in the previous chapter (Table 2.6) and satisfies the above defined cut-off criteria. Plant data were not used as they were incomplete or hard to verify. The significance of plant data on LCA results will show up in future LCA studies as TOTO continues to collect more LCA relevant data.
3.5 Allocation
Whenever a system boundary is crossed, environmental inputs and outputs have to be assigned to the different products. Where multi-inputs are considered or where multi-outputs are considered the same applies. Part A prescribes to report where and how allocation occurs in the modeling of the LCA. In this LCA the following rules have been applied: The preferred way to avoid allocation when a system boundary is crossed is to expand the system boundaries, e.g. including the cut-off parts. In this LCA, system boundaries are crossed for the manufacturing processes and reuse or reclaiming components after use. Multi-input, multi-output and recycling allocations are described below. The model used in this report ensures that the sum of the allocated inputs and outputs of a unit process shall be equal to the inputs and outputs of the unit process before allocation. This means that no double counting or omissions of inputs or outputs through allocation is occurring. When allocations have been made, the sum of the allocated inputs and outputs of a unit process shall be equal to the inputs and outputs of the unit process before allocation.

Page | 27
Manufacturing processes: Allocation for the manufacturing processes is done on a process-to-process level, with different processes assigned to different parts. Allocation for upstream processes follows the EcoInvent assumptions, most notably the co-product allocation is either based on value or, if not available, on mass. Multi-input processes: The preferred way to deal with assigning impacts to multi-inputs is to reflect the physical properties of the incoming flows. If a relationship can be established that is more suitable than mass, it should be used. Waste treatment at the end-of-life: Waste treatment is typically a multi-input process. Several waste streams come together and are processed. Where specific data are available the composition of the waste flows has been used to model the contribution to the impacts from the waste treatment, this includes substitution benefits for energy utilization for combustion processes where relevant. Where no specific data are at hand average values are used. Multi-output processes: Where multiple products are produced allocation is needed. Usually allocation is done by mass, unless another relation is more relevant. Allocation of the manufacturing data in this LCA includes the weight of the finished product and the yield of the specific product. Reuse and recycling: Recycled content is used in some of the metal parts and the cardboard for the boxes. All processes needed to be able to utilize recycled content in the used materials after collecting and sorting are assigned to the product utilizing the recycled content. However, the previous use is cut off. Some process waste and parts of the finished product after use are also recycled. An example is the metal parts after the use of the product. Life cycle stage end-of-life includes transportation to sorting facilities and processing is included up to the point of material that is ready for recycling, such as shredded metal or granulated plastic. All processes and transportation needed to actually recycle the materials are assigned to the recovery stage. This includes a credit given for the manufacturing of the primary material that is prevented by doing so. The credit varies for the different materials and is typically the scrap material that is used to make new product consistent with any other scenario for waste processing and is based on current average technology or practice. An example would be recycled fiber for cardboard. This is referred to as “up to the point of functional equivalence where the secondary material or fuel substitutes primary production and subtracting the impacts resulting from the substituted production of the product or substituted generation of energy from primary sources”.

Page | 28
4 IMPACT ASSESSMENT
4.1 Impact assessment
The environmental indicators (global warming, ozone layer depletion, summer smog, acidification and eutrophication and abiotic depletion for non fuel and fuel resources) as required by ISO 14025 are included as well as other indicators required by Part A of the Framework (see Table 4.1). The impact indicators are derived by using the time horizon3 factors, where relevant, as defined by TRACI 2.1 classification and characterization4. Long-term emissions (> 100 years) are not taken into consideration in the impact estimate. This follows the approach from Part A of the Framework. Table 4.1 Selected impact categories and units
Impact category Unit Ozone depletion CFC-11 eq Smog O3 eq (ozone) Acidification SO2 eq (sulfur dioxide) Fossil fuel depletion MJ surplus Eutrophication N eq (nitrogen) Respiratory effects PM2.5 eq (fine particulates) Non carcinogenics CTUh Carcinogenics CTUh Ecotoxicity CTUe Global warming CO2 eq (carbon dioxide) A definition of these impact categories is included in appendix C. During the impact assessment stage of the modeling, the list of impacts, LCI, for substances that may have not been recognized by the impact assessment method were checked. SimaPro was used to perform the impact assessment. The results from the impact assessment indicate potential environmental effects and do not predict actual impacts on category endpoints, the exceedance of thresholds or safety margins or risks.
3 The 100 year period relates to the period in which the environmental impacts are modeled. This is different from the time period of the functional unit. The two periods are related as follows: all environmental impacts that are created in the period of the functional unit, are modeled through life cycle impact assessment using a 100 year time horizon to understand the impacts that take place. 4 J. Bare (2011) TRACI 2.0: the tool for the reduction and assessment of chemical and other environmental impacts 2.0. Clean Technologies and Environmental Policy. 13(5); United States Environmental Protection Agency (2012). Tool for the Reduction and Assessment of Chemical and Other Environmental Impacts (TRACI) User's Manual. Document ID: S-10637-OP-1-0.

Page | 29
4.2 Normalization and weighting
To arrive to the single score indicator, normalization5 and weighting6 conforming to Part A of the Framework was applied. Table 4.2 Normalization and Weighting factors Impact category Normalization Weighting (%) Ozone depletion 6.20 2.4 Smog 7.18E-4 4.8 Acidification 1.10E-2 3.6 Fossil fuel depletion 5.79E-5 12.1 Eutrophication 4.63E-2 7.2 Respiratory effects 4.12E-2 10.8 Non carcinogenics 952 6.0 Carcinogenics 19,706 9.6 Ecotoxicity 9.05E-5 8.4 Global warming 4.13E-5 34.9
5 A. Lautier, et al. (2010). Development of normalization factors for Canada and the United States and comparison with European factors. Science of the Total Environment. 409: 33-42. 6 Bare, Jane; Gloria, Tom and Norris, Greg, Development of the Method and U.S. Normalization Database fro Life Cycle Impact Assessment and Sustainability Metrics, Environmental Science and Technology, / VOL. 40, NO. 16, 2006

Page | 30
5 INTERPRETATION
This chapter includes the results from the LCA for all the products studied. It details the results per product, outlines the sensitivity analyses and concludes with recommendations.
5.1 TET1LN
Cradle-to-gate Figure 5.1 shows the results for the finished product. It shows that the brass and zinc parts, together with the printed wiring board have significant material contribution and that other manufacturing processes such as polishing and potting have a significant processing contribution to the results.
Figure 5.1 Cradle-to-gate impacts for TET1LN – relative results Variations Not relevant. Full life cycle Figure 5.2 and Table 5.1 show the results for the full life cycle of the product. It shows that the use phase [B1-B7] is dominating the results for all impact categories. This is

Page | 31
mostly due to the electricity used for the water supply and operation of the product (60-90%) [B1-B7] and the remainder is related to the water used. The product itself [A1-A3] has a significant contribution to eutrophication (mostly defined by emissions from copper mining), non carcinogens (emissions from the production of coal, copper and zinc) and ecotoxicity (mostly from disposal of steel slag’s and bottom ashes from coal fired power plants and barium emissions to water from the extraction process of natural gas). The impacts for the product itself [A1-A3] are discussed above in the cradle-to-gate section. The end-of-life scenario [D] includes recycling and benefits from this by preventing the need to primary materials. It shows up as a relevant factor for some of the impact categories offsetting part of the impacts caused by making the parts of the product. Transportation to site [A4] for the delivery, [A5] for the construction and the processes for dismantling and final waste treatment [C1-C4] of the product do not have a significant impact.
Figure 5.2 Life cycle impacts for TET1LN – relative results Table 5.1 Life cycle impacts for TET1LN – absolute results
Impact category Unit Total Production Construction Use End of life Recovery Ecological damage
Acidification kg SO2 eq 1.61E+01 1.65E+00 4.00E-03 1.45E+01 2.03E-03 -9.47E-02 Ecotoxicity CTUe 1.67E+03 5.13E+02 1.63E+00 1.19E+03 3.24E-01 -4.11E+01 Eutrophication kg N eq 1.24E+00 9.70E-01 6.34E-04 3.03E-01 2.16E-04 -3.00E-02 Global warming kg CO2 eq 2.27E+03 9.55E+01 9.87E-01 2.17E+03 6.31E-01 -4.79E+00 Ozone depletion kg CFC-11 eq 1.11E-04 6.90E-06 1.16E-08 1.04E-04 2.34E-08 -3.96E-07
Human health damage
Carcinogenics CTUh 4.74E-05 2.43E-06 8.93E-09 4.51E-05 3.34E-09 -1.60E-07 Non carcinogenics CTUh 4.95E-04 3.23E-04 8.54E-08 2.03E-04 3.09E-08 -3.15E-05 Respiratory effects kg PM2.5 eq 1.19E+00 2.11E-01 7.57E-05 9.92E-01 2.20E-04 -1.06E-02 Smog kg O3 eq 1.19E+02 1.12E+01 1.09E-01 1.09E+02 4.01E-02 -1.22E+00
Resource depletion
Fossil fuel depletion MJ surplus 1.33E+03 5.45E+01 1.16E+00 1.28E+03 4.15E-01 -4.96E+00

Page | 32
Variations Not relevant. SM results The SM millipoint score by life cycle phase for this product is presented below (Table 5.2). They confirm the trends in the results using the impact assessment results prior to normalization and weighting. Table 5.2 SM millipoint scores for TET/U1LN by life cycle phase – absolute results
Impact category Unit Total Production Construction Use End of life Recovery
SM single figure mPts 192.51 33.91 0.06 161.25 0.03 -2.75

Page | 33
5.2 TEU1LN & TEU1UN
This section includes the weighted averaged results based on production volumes. Cradle-to-gate Figure 5.3 shows the results for the finished product. It shows that the brass and zinc parts, together with the printed wiring board have significant material contribution and that other manufacturing processes such as polishing and potting have a significant processing contribution to the results.
Figure 5.3 Cradle-to-gate impacts for the average of TEU1LN & TEU1UN – relative results Variations The variation in the bill of materials is presented in the Table 5.3 below. It shows many similarities, but also many differences. However, the variations in the results due to averaging are less than 10% in any category. Table 5.3 Variations in the bill of materials for TEU1LN & TEU1UN (confidential) Full life cycle Figure 5.4 and Table 5.4 show the results for the full life cycle of the product. It shows that the use phase [B1-B7] is less dominant than for the TET1LN, but it is still significant for most of the impact categories. This is mostly due to the electricity used for the water supply and operation of the product (60-90%) [B6-B7] and the remainder is related to the water used. The product itself [A1-A3] is more important than that for TET1LN. It shows the same major contributions though. It has the most significant contributions to eutrophication (mostly defined by emissions from copper mining), non carcinogens (emissions from the production of copper and zinc) and ecotoxicity (mostly from

Page | 34
emissions during mining of copper, gold and zinc). The impacts for the product itself [A1-A3] are discussed above in the cradle-to-gate section. The end-of-life scenario [D] includes recycling and benefits from this by preventing the need to primary materials. It shows up as a relevant factor for some of the impact categories offsetting part of the impact caused by making the parts of the product. Transportation to site [A4] for the delivery, [A5] for the construction and the processes for dismantling and final waste treatment [C1-C4] of the product do not have a significant impact.
Figure 5.4 Life cycle impacts for the average of TEU1LN & TEU1UN – relative results Table 5.4 Life cycle impacts for average of TEU1LN & TEU1UN – absolute results
Impact category Unit Total Production Construction Use End of life Recovery Ecological damage
Acidification kg SO2 eq 2.08E+00 1.66E+00 3.98E-03 5.07E-01 2.03E-03 -9.50E-02 Ecotoxicity CTUe 5.16E+02 5.14E+02 1.62E+00 4.17E+01 3.23E-01 -4.12E+01 Eutrophication kg N eq 9.55E-01 9.73E-01 6.37E-04 1.06E-02 2.16E-04 -3.01E-02 Global warming kg CO2 eq 1.69E+02 9.63E+01 9.88E-01 7.60E+01 6.30E-01 -4.82E+00 Ozone depletion kg CFC-11 eq 1.02E-05 6.90E-06 1.15E-08 3.63E-06 2.34E-08 -3.98E-07
Human health damage
Carcinogenics CTUh 3.87E-06 2.44E-06 8.89E-09 1.58E-06 3.33E-09 -1.61E-07 Non carcinogenics CTUh 2.99E-04 3.24E-04 8.50E-08 7.10E-06 3.08E-08 -3.17E-05 Respiratory effects kg PM2.5 eq 2.37E-01 2.13E-01 7.55E-05 3.47E-02 2.20E-04 -1.07E-02 Smog kg O3 eq 1.40E+01 1.13E+01 1.08E-01 3.79E+00 4.00E-02 -1.22E+00
Resource depletion
Fossil fuel depletion MJ surplus 9.58E+01 5.46E+01 1.16E+00 4.46E+01 4.15E-01 -4.97E+00 Numbers shown in orange have a variation of 10 to 20% Numbers shown in red have a variation greater than 20%

Page | 35
Variations There are no variations of 10 to 20%. The deviations above 20% are in the use phase. The product TEU1LN consumes four times more water than TEU1UN over the same use phase (23,400 gallons vs. 5,850 gallons). The life cycle impacts for the average of TEU1LN & TEU1UN excluding use phase are not reported as the only variation is in the use phase only. SM results The SM millipoint score by life cycle phase for this product is presented below (Table 5.5). They confirm the trends in the results using the impact assessment results before normalization and weighting. Table 5.5 Averaged SM millipoint scores for TEU1LN & TEU1UN by life cycle phase – absolute results
Impact category Unit Total Production Construction Use End of life Recovery
SM single figure mPts 36.98 34.02 0.06 5.63 0.03 -2.76
Numbers shown in orange have a variation of 10 to 20% Numbers shown in red have a variation greater than 20%

Page | 36
5.3 TEL3LS10 & TEL5LS10
Cradle-to-gate Figure 5.6 shows the results for the finished product. It shows that the brass and the printed wiring board have significant material contribution and that manufacturing processes such as turning and electroplating have a significant processing contribution to the results.
Figure 5.5 Cradle-to-gate impacts for the average of TEL3L10 & TEL5L10 – relative results Variations The variation in the bill of materials is presented in Table 5.6 below. It shows many similarities, but also so differences. Variations are in almost every category and that is mainly due to the 0.84kg difference between the weights of the two products excluding packaging (TEL3L10 is 2.09 kg while TEL5L10 is 2.93 kg) and due to the difference in the magnitude of the processes and materials used in manufacturing the two products. TEL3L10 is smaller and as such its electronics parts (i.e. printed wiring boards) are smaller. Printed wiring board (both lead containing and lead free) are significant contributors to every impact category.

Page | 37
Table 5.6 Variations in the bill of materials for TEL3L10 & TEL5L10 (confidential) Full life cycle Figure 5.6 and Table 5.7 show the results for the full life cycle of the product. The impacts for the product itself [A1-A3] are discussed above in the cradle-to-gate section. The product itself [A1-A3] is more important. It shows that the use phase [B1-B7] is less dominant, but it is still significant for most of the impact categories. This is mostly due to the electricity used for the water supply and operation of the product (60-90%) [B6-B7] and the remainder is related to the water used. It has the most significant contributions to eutrophication (mostly defined by emissions from copper mining used in the product and the wiring board), non carcinogens (emissions from the production of copper and zinc) and ecotoxicity (mostly from emissions during mining of copper, gold and zinc). The end-of-life scenario [D] includes recycling and benefits from this by preventing the need to primary materials. It shows up as a relevant factor for some of the impact categories offsetting part of the impact caused by making the parts of the product. Transportation to site [A4] for the delivery, [A5] for the construction and the processes for dismantling and final waste treatment [C1-C4] of the product do not have a significant impact.
Figure 5.6 Life cycle impacts for the average of the average of TEL3L10 & TEL5L10 – relative results
Table 5.7 Life cycle impacts for the average of TEL3L & TEL5L – absolute results Impact category Unit Total Production Construction Use End of life Recovery
Ecological damage
Acidification kg SO2 eq 9.56E-01 7.06E-01 2.91E-03 2.83E-01 1.53E-03 -3.75E-02

Page | 38
Ecotoxicity CTUe 2.90E+02 2.81E+02 1.17E+00 2.33E+01 2.25E-01 -1.59E+01
Eutrophication kg N eq 5.78E-01 5.80E-01 6.61E-04 5.91E-03 7.84E-04 -9.41E-03
Global warming kg CO2 eq 9.55E+01 5.30E+01 8.82E-01 4.25E+01 1.07E+00 -1.94E+00
Ozone depletion kg CFC-11 eq 7.49E-06 5.61E-06 8.81E-09 2.03E-06 1.86E-08 -1.83E-07 Human health damage
Carcinogenics CTUh 3.38E-06 2.99E-06 6.47E-09 8.81E-07 2.94E-09 -4.92E-07
Non carcinogenics CTUh 1.08E-04 1.12E-04 6.19E-08 3.97E-06 2.39E-08 -8.36E-06
Respiratory effects kg PM2.5 eq 1.00E-01 8.72E-02 5.73E-05 1.94E-02 1.60E-04 -6.57E-03
Smog kg O3 eq 7.40E+00 5.51E+00 7.85E-02 2.12E+00 2.84E-02 -3.43E-01 Resource depletion
Fossil fuel depletion MJ surplus 8.81E+01 6.51E+01 8.39E-01 2.50E+01 2.96E-01 -3.12E+00
Numbers shown in orange have a variation of 10 to 20% Numbers shown in red have a variation greater than 20% Variations The deviations are across all phases of the life cycle of the two products except the use phase. The deviations in the LCA results are highly correlated to the cradle-to-gate. These variations are mainly due to the 0.84kg difference between the weights of the two products excluding packaging (TEL3L10 is 2.09kg while TEL5L10 is 2.93kg) and due to the difference in the magnitude of the processes and materials used in manufacturing the two products. TEL3L10 is smaller and as such its electronics parts (i.e. printed wiring boards) are smaller. Printed wiring board (both Pb containing and Pb free) are significant contributors to every impact category. TEL3L10 utilizes less brass, stainless steel SUS304, polyacetal, bronze and EPDM in its components. The foregoing, as expected, affects the remaining LCA phases of the two products except the use phase because the more materials, the more end of life processes and the more recovery. SM results The SM millipoint score by life cycle phase for this product is presented below. They confirm the trends in the results using the impact assessment results before normalization and weighting. Table 5.8 Averaged SM millipoint scores for TEL3L10 & TEL5L10 by life cycle phase – absolute results
Impact category Unit Total Production Construction Use End of life Recovery SM single figure mPts 19.76 18.20 0.05 3.15 0.03 -1.67
Numbers shown in orange have a variation of 10 to 20% Numbers shown in red have a variation greater than 20%

Page | 39
5.4 Sensitivity analysis
Part A mandates that a sensitivity analysis must be performed using the highest and lowest values for the most important choices and assumptions to check the robustness of the results of the LCA (disregarding outliers is appropriate). Identifying which choices or assumption influence the results in any environmental parameter by more than 20% shall be reported. The previous section includes the variations within the product groups which are dominated by the use phase and the product composition as indicated. Additionally, the chosen approach for the following parameters must also be reported: The impact of the geographical and technological variation on various production locations;
This is covered for the multiproduct reports by averaging both products and indicating the variations in section 5.3
The variation due to using average composition;
This is covered for the multiproduct reports by averaging both products and indicating the variations in section 5.3
The variation due to using a group-average using the highest and lowest values in the sensitivity analysis. Outliers can be disregarded.
This does not apply as only Toto products are included.
Allocation of recycling processes A sensitivity analyses is included below in this section.
Allocation of multi-input and multi-output processes.
Allocations follow a mass based approach in the collected data which is the most appropriate for the unit processes modeled. Allocation approaches in the background data follow the ecoinvent methodology.
Fittings and allocation for recycling and recycled content

Page | 40
Metals are an important part of the fitting products and recycled content is a relevant factor in many LCA studies. Recycled content is modeled using scrap that is processed to make new materials in this study. After use recycling is credited to the offset of virgin metals up to the point of intermediate metals before they are finished into products. This is a substitution based approach and it complies with Part A. Another approach could be to model a full cut off and not to include the substitution at the end of use and only model the recycling benefits at the manufacturing stage by means of using recycling content and hence less virgin content. The impact of this allocation choice can be seen by looking at the graphs in the previous section. In essence this would eliminate the benefits that show up in the recovery stage. The impact is in the order of 1-10% for most products and most impact categories. The only instances where the impact is greater than 10% are: - TEU1LN & TEU1UN 10.4% difference for no-carcinogenics - TEL3L10 & TEL5L10: 15% difference for carcinogenics. A note will be included on the Transparency Report as outlined in Part A of the Framework.

Page | 41
5.5 Discussion on data quality
Discussion of the role of excluded elements This study followed the completeness criteria stated in Section 3.2 herein. Small amounts of input materials have not been included based on the mass criteria. These materials (i.e. excluded materials) were identified and evaluated on the environmental relevance and are of similar nature to the included materials and hence are deemed to have an small impact in the results of the LCA in line with their weight. The exclusions have been made to streamline the data collection, validation and modeling process and fit well within the defined cut-off criteria. Examples are the adhesive glue placed on stickers, grease on o-rings and washers for secured tightening, less than 0.01 ml of locktite, minute amount (less/more than 0.05mg) of variation for sealing materials. The impact from these minute amounts of materials on final LCA results is marginal and as such excluded. Discussion of the precision, completeness and representativeness of data The inventory mostly relies on primary data for the TOTO and the supplier data, but it also includes estimated data for different reasons. For example, not all vendors have responded to the same level of detail as the request for data entailed. For example, some vendors declined to cooperate, stating confidentiality and proprietary policy. In that case, missing data was estimated from other products whose data are known from other vendors in consultation with TOTO’s experts. Another example was that incomplete data on the recycled content of the components of the modeled products was provided. To model this, a worst-case scenario was applied assuming no recycled content. The impact of this assumption is important because the material inputs are major drivers of the LCA results for the modeled products. This study used literature data where supplier data was not made available based on the USLCI database and the US-ecoinvent database. With future updates and more and more LCA information becoming available, more representative and less generic data should be used where possible. The impact of this limitation could be relevant as it relates to recycled content, yield and processing energy which are relevant drivers of the LCA results. It is recommended that vendors shall be contacted and engaged for future LCA work especially as TOTO moves towards a more integrated People, Planet, Profit strategy. The study used scenarios for the use phase and end of life. Since the use phase is important for the results of the LCA, it is recommended to discuss and validate the

Page | 42
approach with industry stakeholders to establish a common practice. This has been established by use of the PGDs. Discussion related to the impact of value judgments The Sustainable Minds indicator expressed in millipoints is a part of the reporting requirements. However, it is important to note that the indicator is not only based on scientific impact assessment and normalization, but also on weighting which is based on expert judgment. This last step is a value judgment and can change between different experts and will likely change over time since environmental priorities change over time. This change is not annual but rather it takes a decade. With the limited validation of any LCA and the 3 years validity of a Transparency Report, any changes in these value judgments will be reflected in future updates.
5.6 Recommendations
During the process of compiling this report with the help of many TOTO employees, an insight into the environmental performance of a selection of TOTO products was gained. Additionally, the major contributions and differences were also learned. Based on these insights we make the following recommendations to TOTO:
• Create a process for LCI data collection for the manufacturing process at the vendors. This should streamline the data collection for the different locations defining the primary sources for the data, and alignment of the reported data. There is a need for better data processing data, like energy consumption and yield. One topic within this is the amount of recycled content which provides an opportunity for environmental performance improvement.
• Evaluate improvement options for the major contributions against required investments to drive down in the impact. Good candidates are the recycled content of the metals.
• Continue the reduction of the use of water for the products during the use phase.
• As a general approach, evaluate changes in the manufacturing process or supply chain using LCA technologies to choose the best alternative before making a purchasing or investment decision. This will inform the decision making process with upfront insight in how it will impact the LCA.

Page | 43
6 SOURCES
[1] ISO 14044, “Environmental management - Life cycle assessment - Requirements and guidelines”, ISO14044:2006
[2] ISO 14025, “Environmental labels and declarations -- Type III environmental declarations -- Principles and procedures”, ISO14025:2006
[3] J. Bare (2011) TRACI 2.0: the tool for the reduction and assessment of chemical and other environmental impacts 2.0. Clean Technologies and Environmental Policy. 13(5); United States Environmental Protection Agency (2012). Tool for the Reduction and Assessment of Chemical and Other Environmental Impacts (TRACI) User's Manual. Document ID: S-10637-OP-1-0.
[4] A. Lautier, et al. (2010). Development of normalization factors for Canada and the United States and comparison with European factors. Science of the Total Environment. 409: 33-42.
[5] Bare, Jane; Gloria, Tom and Norris, Greg, Development of the Method and U.S. Normalization Database for Life Cycle Impact Assessment and Sustainability Metrics, Environmental Science and Technology, / VOL. 40, NO. 16, 2006
[6] Sustainable Minds Transparency Report™ Framework, Part A: LCA calculation rules and report requirements. July 31, 2014, Draft for Friendly Review
[7] Product Group Definition, Commercial Faucets. July 06, 2014, Draft for public comment [8] Product Group Definition, Commercial Flush Valves. July 06, 2014, Draft for public
comment

Page | 44
ACRONYMS
EPD Environmental Product Declaration ISO International Standardization Organization LCA life cycle assessment LCI life cycle inventory LCIA life cycle impact analysis LHV Low Heating Value PCR Product Category Rule document LW Lakewood, TOTO manufacturing facility MW Morrow. TOTO manufacturing facility TMX TOTO Mexico, manufacturing facility
GLOSSARY
For the purposes of this report, the terms and definitions given in ISO 14020, ISO 14025, ISO 14040, ISO 14041, ISO 14042, ISO 14043, ISO 14044 and ISO 21930 apply. The most important ones are included here:
aggregation aggregation of data allocation partitioning the input or output flows of a process or a product system between the
product system under study and one or more other product systems ancillary input material input that is used by the unit process producing the product, but does not
constitute part of the product capital good Means, for instance ancillary input needed for activities, and all handling equipment
during the life cycle that can be characterized by a relative long lifespan and can be (re)used many times
category endpoint attribute or aspect of natural environment, human health, or resources, identifying an environmental issue giving cause for concern
characterization factor factor derived from a characterization model which is applied to convert an assigned life cycle inventory analysis result to the common unit of the category indicator
comparative assertion environmental claim regarding the superiority or equivalence of one product versus a competing product that performs the same function
completeness check process of verifying whether information from the phases of a life cycle assessment is sufficient for reaching conclusions in accordance with the goal and scope definition
consistency check process of verifying that the assumptions, methods and data are consistently applied throughout the study and are in accordance with the goal and scope definition performed before conclusions are reached
co-product any of two or more products coming from the same unit process or product system critical review process intended to ensure consistency between a life cycle assessment and the
principles and requirements of the International Standards on life cycle assessment

Page | 45
cut-off criteria specification of the amount of material or energy flow or the level of environmental significance associated with unit processes or product system to be excluded from a study
data quality characteristics of data that relate to their ability to satisfy stated requirements elementary flow material or energy entering the system being studied that has been drawn from the
environment without previous human transformation, or material or energy leaving the system being studied that is released into the environment without subsequent human transformation
energy flow input to or output from a unit process or product system, quantified in energy units environmental aspect element of an organization's activities, products or services that can interact with the
environment environmental measure series of certain quantities, based on economic flows and weighing of environmental
effects. environmental mechanism
system of physical, chemical and biological processes for a given impact category, linking the life cycle inventory analysis results to category indicators and to category endpoints
environmental profile a series of environmental effects evaluation element within the life cycle interpretation phase intended to establish confidence in
the results of the life cycle assessment feedstock energy heat of combustion of a raw material input that is not used as an energy source to a
product system, expressed in terms of higher heating value or lower heating value functional lifespan the period or time during which a building or a building element fulfils the
performance requirements functional unit quantified performance of a product system for use as a reference unit impact category class representing environmental issues of concern to which life cycle inventory
analysis results may be assigned impact category indicator
quantifiable representation of an impact category
Input product, material or energy flow that enters a unit process interested party individual or group concerned with or affected by the environmental performance of
a product system, or by the results of the life cycle assessment intermediate flow product, material or energy flow occurring between unit processes of the product
system being studied intermediate product output from a unit process that is input to other unit processes that require further
transformation within the system life cycle consecutive and interlinked stages of a product system, from raw material
acquisition or generation from natural resources to final disposal life cycle assessment LCA
compilation and evaluation of the inputs, outputs and the potential environmental impacts of a product system throughout its life cycle
life cycle impact assessment LCIA
phase of life cycle assessment aimed at understanding and evaluating the magnitude and significance of the potential environmental impacts for a product system throughout the life cycle of the product
life cycle interpretation phase of life cycle assessment in which the findings of either the inventory analysis or the impact assessment, or both, are evaluated in relation to the defined goal and scope in order to reach conclusions and recommendations
life cycle inventory analysis LCI
phase of life cycle assessment involving the compilation and quantification of inputs and outputs for a product throughout its life cycle
life cycle inventory analysis result LCI result
outcome of a life cycle inventory analysis that catalogues the flows crossing the system boundary and provides the starting point for life cycle impact assessment

Page | 46
multi-input process a unit process where more than one flow enters from different product systems for combined processing
multi-output process a unit process that results in more than one flow used in different product systems output product, material or energy flow that leaves a unit process performance behavior based on use primary material a material produced from raw materials primary production a production process that produces primary material process set of interrelated or interacting activities that transforms inputs into outputs process energy energy input required for operating the process or equipment within a unit process,
excluding energy inputs for production and delivery of the energy itself product any goods or service product flow products entering from or leaving to another product system product system collection of unit processes with elementary and product flows, performing one or
more defined functions, and which models the life cycle of a product raw material primary or secondary material that is used to produce a product recycling all processes needed to recycle a material, product or element as a material input reference flow measure of the outputs from processes in a given product system required to fulfill
the function expressed by the functional unit releases emissions to air and discharges to water and soil return system a system to collect waste material from the market for the purpose of recycling or
reuse reuse all processes needed to reuse a material, product or element in the same function secondary material material input produced from recycled materials secondary production production process that produces secondary material sensitivity analysis systematic procedures for estimating the effects of the choices made regarding
methods and data on the outcome of a study system boundary set of criteria specifying which unit processes are part of a product system third party person or body that is independent of the involved parties, and as such recognized transparency open, comprehensive and understandable presentation of information type -III-environmental declaration
quantified environmental data of a product with a predefined set of categories based on the ISO 14040 standards, without excluding the presentation of supplementing relevant environmental data, provided within the scope of a type-III-environmental declaration framework
type -III-environmental declaration framework
voluntary process of an industrial sector or independent body to develop a type- III-environmental declaration, including a framework that defines the essential requirements, the selection of categories or parameters, the level of involvement of third parties and a template for external communication
uncertainty analysis systematic procedure to quantify the uncertainty introduced in the results of a life cycle inventory analysis due to the cumulative effects of model imprecision, input uncertainty and data variability
unit process smallest element considered in the life cycle inventory analysis for which input and output data are quantified
waste substances or objects which the holder intends or is required to dispose of
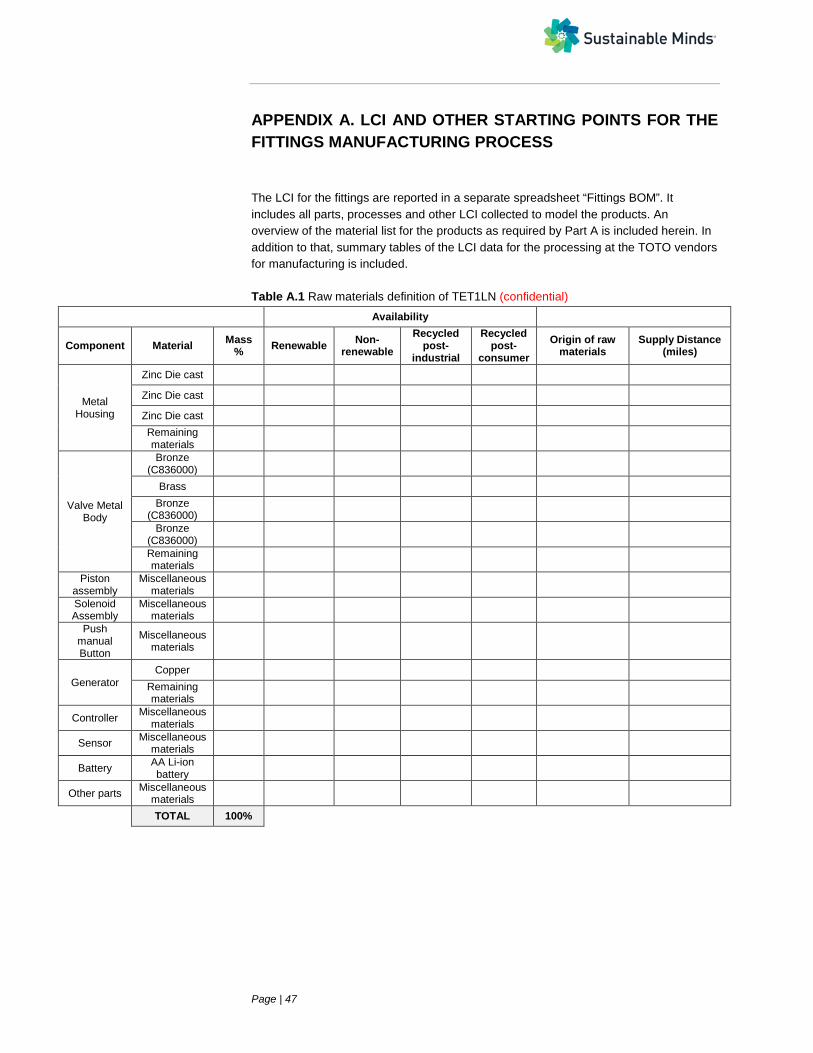
Page | 47
APPENDIX A. LCI AND OTHER STARTING POINTS FOR THE FITTINGS MANUFACTURING PROCESS
The LCI for the fittings are reported in a separate spreadsheet “Fittings BOM”. It includes all parts, processes and other LCI collected to model the products. An overview of the material list for the products as required by Part A is included herein. In addition to that, summary tables of the LCI data for the processing at the TOTO vendors for manufacturing is included. Table A.1 Raw materials definition of TET1LN (confidential)
Availability
Component Material Mass % Renewable Non-
renewable Recycled
post-industrial
Recycled post-
consumer Origin of raw
materials Supply Distance
(miles)
Metal Housing
Zinc Die cast
Zinc Die cast
Zinc Die cast Remaining materials
Valve Metal Body
Bronze (C836000)
Brass Bronze
(C836000)
Bronze (C836000)
Remaining materials
Piston assembly
Miscellaneous materials
Solenoid Assembly
Miscellaneous materials
Push manual Button
Miscellaneous materials
Generator Copper
Remaining materials
Controller Miscellaneous materials
Sensor Miscellaneous materials
Battery AA Li-ion battery
Other parts Miscellaneous materials
TOTAL 100%

Page | 48
Table A.2 Raw materials definition of TEU1LN (confidential)
Availability
Component Material Mass % Renewable Non-
renewable Recycled
post-industrial
Recycled post-
consumer Origin of raw
materials Supply Distance
(miles)
Metal Housing
Zinc Die cast
Zinc Die cast
Zinc Die cast Remaining materials
Valve Metal Body
Bronze (C836000)
Brass Bronze
(C836000)
Bronze (C836000)
Remaining materials
Piston assembly
Miscellaneous materials
Solenoid Assembly
Miscellaneous materials
Push manual Button
Miscellaneous materials
Generator Copper
Remaining materials
Controller Miscellaneous materials
Sensor Miscellaneous materials
Battery AA Li-ion battery
Other parts Miscellaneous materials
TOTAL 100%

Page | 49
Table A.3 Raw materials definition of TEU1UN (confidential)
Availability
Component Material Mass % Renewable Non-
renewable Recycled
post-industrial
Recycled post-
consumer Origin of raw
materials Supply Distance
(miles)
Metal Housing
Zinc Die cast
Zinc Die cast
Zinc Die cast Remaining materials
Valve Metal Body
Bronze (C836000)
Brass Bronze
(C836000)
Remaining materials
Solenoid Assembly
Miscellaneous materials
Push manual Button
Miscellaneous materials
Generator Copper
Remaining materials
Controller Miscellaneous materials
Sensor Miscellaneous materials
Battery AA Li-ion battery
Other parts Miscellaneous materials
TOTAL 100%

Page | 50
Table A.4 Raw materials definition of TEL3LS10 (confidential)
Availability
Component Material Mass% Renewable Non-renewable
Recycled post-
industrial
Recycled post-
consumer Origin of raw
materials Supply
Distance (miles)
Spout Assembly
Brass (C360000)
SUS304
Polyacetal
Polyacetal
NBR
Brass
Brass
SUS303
PVC
Steel
Remaining materials
Sensor Miscellaneous materials
Solenoid Assembly Polyacetal
Remaining materials
Generator
PPO
Copper
Brass (covalent coating)
Remaining materials
Controller box parts
Brass, Pb free
ABS
SUS303
Remaining materials
Controller box (circuit board)
ABS
Surface mount, Pb containing
Epoxy resin
Remaining materials
Battery Miscellaneous materials
Flow regulator Miscellaneous materials
TOTAL 100%
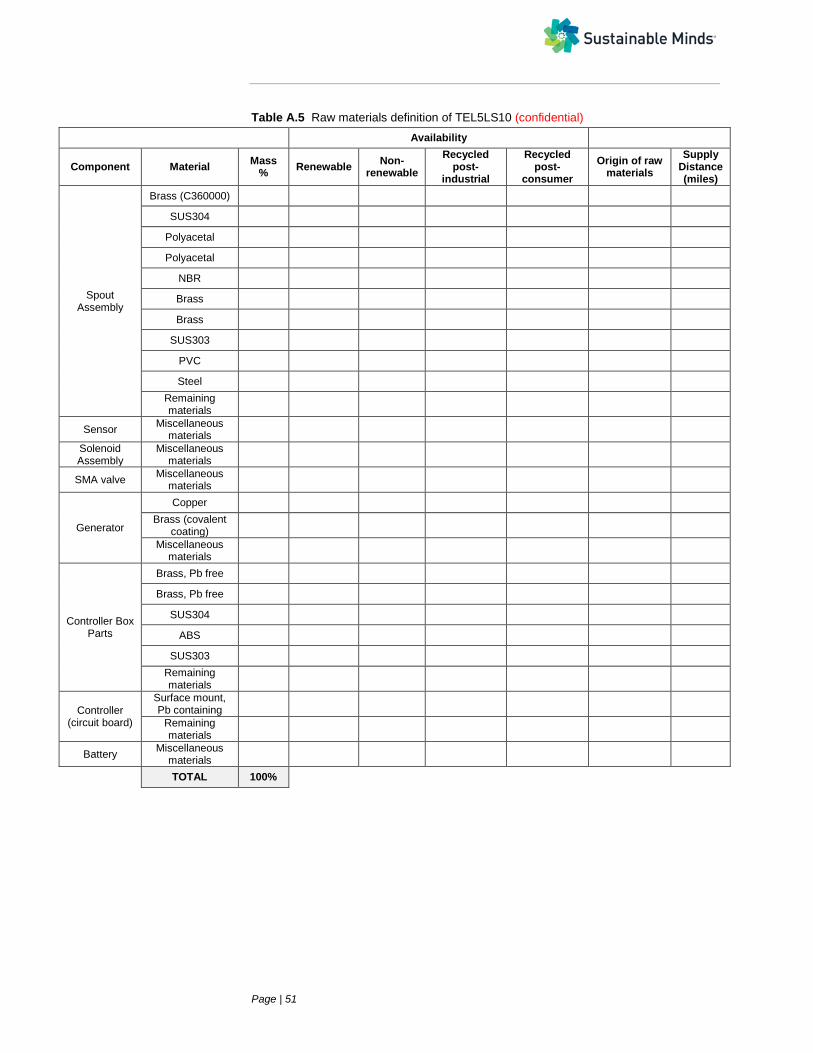
Page | 51
Table A.5 Raw materials definition of TEL5LS10 (confidential)
Availability
Component Material Mass % Renewable Non-
renewable Recycled
post-industrial
Recycled post-
consumer Origin of raw
materials Supply
Distance (miles)
Spout Assembly
Brass (C360000)
SUS304
Polyacetal
Polyacetal
NBR
Brass
Brass
SUS303
PVC
Steel Remaining materials
Sensor Miscellaneous materials
Solenoid Assembly
Miscellaneous materials
SMA valve Miscellaneous materials
Generator
Copper Brass (covalent
coating)
Miscellaneous materials
Controller Box Parts
Brass, Pb free
Brass, Pb free
SUS304
ABS
SUS303 Remaining materials
Controller (circuit board)
Surface mount, Pb containing
Remaining materials
Battery Miscellaneous materials
TOTAL 100%

Page | 52
Table A.6 LCI data for zinc die casting process
Die casting, zinc 1 kg Operating temperature is slightly higher than casting of brass and bronze. A small amount of zinc evaporates. The evaporation losses are estimated at 0.1%wt. Adapted from EcoInvent LCI for die casting of brass and bronze.
Materials/fuels Aluminum casting, plant 4.9E-11 p Electricity, medium voltage, production 0.0205 kWh Heat, heavy fuel oil, at industrial furnace 1MW 0.2952 MJ Heat, natural gas, at industrial furnace >100kW 0.369 MJ Emissions to air Heat, waste 0.0708 MJ Zinc 0.001 kg
Table A.7 LCI data for turning brass CNC process
Turning, brass, CNC, average 1 kg
This dataset encompasses the direct electricity consumption of the machine as well as compressed air and lubricant oil. Furthermore, the metal removed is included. Machine as well as factory infrastructure and operation are considered as well. The disposal of the lubricant oil is also included while the metal removed is assumed to be recycled.
Materials/fuels Electricity, low voltage, production 0.992 kWh Compressed air, average installation, >30kW, 7 bar gauge, at supply network 1.28 m3 Lubricating oil, at plant 0.00382 kg Metal working machine, unspecified, at plant 0.000174 kg Metal working factory 2.02E-09 p Metal working factory operation, average heat energy 4.41 kg Brass, at plant 1 kg Emissions to air Heat, waste 3.57 MJ Waste to treatment Disposal, used mineral oil, 10% water, to hazardous waste incineration 0.00382 kg

Page | 53
Table A.8 LCI data for turning steel CNC process
Turning, steel, CNC, average 1 kg This dataset encompasses the direct electricity consumption of the machine as well as compressed air and lubricant oil. Furthermore, the metal removed is included. Machine as well as factory infrastructure and operation are considered as well. The disposal of the lubricant oil is also included while the metal removed is assumed to be recycled. Materials/fuels
Electricity, low voltage, production 1.78 kWh
Compressed air, average installation, >30kW, 7 bar gauge, at supply network 1.28 m3
Lubricating oil, at plant 0.00382 kg
Metal working machine, unspecified, at plant 0.000174 kg
Metal working factory 2.02E-09 p
Metal working factory operation, average heat energy 4.41 kg
Steel, low-alloyed, at plant 1 kg
Emissions to air
Heat, waste 6.39 MJ
Waste to treatment
Disposal, used mineral oil, 10% water, to hazardous waste incineration 0.00382 kg Table A.9 LCI data for injection molding process
Injection molding 1 kg This process contains the auxiliaries and energy demand for the mentioned conversion process of plastics. The converted amount of plastics is NOT included into the dataset.
Resources Water, cooling, unspecified natural origin/m3 0.011 m3 Materials/fuels Lubricating oil, at plant 0.00303 kg Solvents, organic, unspecified, at plant 0.0447 kg Chemicals organic, at plant 0.0128 kg Titanium dioxide, production mix, at plant 0.00199 kg Pigments, paper production, unspecified, at plant 0.00756 kg EUR-flat pallet 0.00146 p Solid bleached board, SBB, at plant 9.94E-05 kg Polyethylene, LDPE, granulate, at plant 0.00169 kg Polypropylene, granulate, at plant 0.00358 kg Electricity, medium voltage, production 1.48 kWh Heat, natural gas, at industrial furnace >100kW 4.21 MJ Heat, heavy fuel oil, at industrial furnace 1MW 0.229 MJ Packaging box production unit 1.43E-09 p Transport, lorry 3.5-16t, fleet average 0.142 tkm Emissions to air Heat, waste 5.33 MJ Emissions to water COD, Chemical Oxygen Demand 9.28E-06 kg Suspended solids, unspecified 6.63E-06 kg Waste to treatment
Disposal, plastics, mixture, 15.3% water, to municipal incineration 0.00567 kg

Page | 54
Disposal, hazardous waste, 0% water, to underground deposit 3.31E-05 kg
Disposal, municipal solid waste, 22.9% water, to sanitary landfill 0.000895 kg Table A.10 LCI data for M&K potting process
M&K Potting 0.5 g This dataset models an M&K Potting Machine with typical production volume of 150 circuit board per 1 kWh. A circuit board is estimated to consume 0.5g of Epoxy resin. Source: TOTO Shanghai
Materials/fuels Electricity, medium voltage, production 0.006667 kWh Epoxy resin, liquid, at plant 0.5 g Emissions to air Heat, waste 0.10374 MJ
Table A.11 LCI data for turning bronze CNC process
Turning, bronze, CNC, average 1 kg This dataset encompasses the direct electricity consumption of the machine as well as compressed air and lubricant oil. Furthermore, the metal removed is included. Machine as well as factory infrastructure and operation are considered as well. The disposal of the lubricant oil is also included while the metal removed is assumed to be recycled.
Materials/fuels Electricity, low voltage, production 0.992 kWh Compressed air, average installation, >30kW, 7 bar gauge, at supply network 1.28 m3 Lubricating oil, at plant 0.00382 kg Metal working machine, unspecified, at plant 0.000174 kg Metal working factory 2.02E-09 p Metal working factory operation, average heat energy 4.41 kg Bronze, at plant 1 kg Electricity/heat Emissions to air Heat, waste 3.57 MJ Waste to treatment
Disposal, used mineral oil, 10% water, to hazardous waste incineration 0.00382 kg Table A.12 LCI data for polishing process
Polishing 1 kg This dataset includes the materials, energies and emissions related to the polishing machines used for polishing metal products. This is mainly electricity, compressed air and solvents. Process heat is from average sources. The consumables are polishing discs and abrasive paste. Source: TOTO Shanghai Materials/fuels Solvents, organic, unspecified, at plant 0.0014 kg Lubricating oil, at plant 0.000867 kg
Compressed air, average installation, >30kW, 7 bar gauge, at supply network 0.291 m3
Light fuel oil, burned in industrial furnace 1MW, non-modulating 2.6 MJ
Heavy fuel oil, burned in industrial furnace 1MW, non-modulating 0.0328 MJ
Natural gas, burned in boiler modulating >100kW 2.03 MJ Electricity, low voltage, production 1.15 kWh

Page | 55
Polishing 1 kg
Textile, woven cotton, at plant 0.0272 kg Ethylene glycol, at plant 0.002 kg Emissions to air Hydrocarbons, aliphatic, alkanes, unspecified 0.000558 kg Ethane, tetrachloro- 7.51E-05 kg Water 1.12 kg Heat, waste 4.13 MJ Waste to treatment
Disposal, used mineral oil, 10% water, to hazardous waste incineration 0.000867 kg
Table A.13 LCI data for TAMURA wave soldering process
TAMURA Wave Soldering 0.1 kg This dataset models a TAMURA wave soldering machine with typical production volume of 100 circuit board per 1kWh. A circuit board is estimated to consume 100g of lead-free wave bars. Source: TOTO Shanghai
Materials/fuels Electricity, medium voltage, production 4.323 kWh Soft solder, Sn97Cu3, at plant 0.1 kg Emissions to air Heat, waste 15.561 MJ
Table A.14 LCI data for electroplating process
Electroplating 1 kg
This dataset models an electroplating machine with typical production volume of 90 metal parts per 1 kWh. The consumable are mainly degreasing solvents, activator substances and additive substances. Source: TOTO Shanghai
Materials/fuels Electricity, low voltage, production 0.011 kWh Natural gas, burned in industrial furnace low-NOx >100kW 0.00863 MJ
Degreasing Solvent (8% Ammonium Metatungstate, 7% Trichloroethylene, 5% DTPA Pentasodium Solution, 3% Sodium Mono Floro Phosphate)
0.089 kg
Additive Substance (6% Ammonium Metatungstate, 5% Trichloroethylene, 3% Fluoboric acid, 5% Sodium Mono Floro Phosphate) 0.342 kg
Activator Substance (5% Nickel Sulfate NiSO4.6H2O, 5% Sodium Acetate, 7% Trichloroethylene, 3% DTPA Pentasodium Solution)
0.089 kg

Page | 56
APPENDIX B. ADDITIONAL RESULTS
No additional result view have been reported at this point.
APPENDIX C. IMPACT CATEGORIES
The impact assessment is based on the TRACI methodology and is reported in [Bare, 2011]. The contents of this publication are presented in this appendix. A definition of the impact categories within TRACI is available in the appendices of Part A [6]. APPENDIX D. USED DATASHEETS
To model the LCA different data sources have been used. This appendix includes a list of all datasheets that have been used. The list is included in a separate spreadsheet “LCA of TOTO fittings LCI-LCA modeling data and results 08-2014.xlsx”.
APPENDIX E. LCI
The LCI results per functional unit for all products are included in a separate “LCA of TOTO fittings LCI-LCA modeling data and results 08-2014.xlsx”.
APPENDIX F. LCIA METHOD
The LCIA characterization factors are included in a separate spreadsheet “LCA of TOTO fittings LCI-LCA modeling data and results 08-2014.xlsx”.
APPENDIX G. PROCESS FLOW DIAGRAMS
A process flow diagram per functional unit of product is included in a separate spreadsheet “LCA of TOTO fittings LCI-LCA modeling data and results 08-2014.xlsx”. It shows the modeled materials and energy flows.