Life Cycle Assessment (LCA) of ICT in Sweden · Life Cycle Assessment (LCA) of ICT in Sweden ......
33
Life Cycle Assessment (LCA) of ICT in Sweden WS @ ICT4S 2014 Jens Malmodin, Ericsson Research Dag Lundén, TeliaSonera
Transcript of Life Cycle Assessment (LCA) of ICT in Sweden · Life Cycle Assessment (LCA) of ICT in Sweden ......

Life Cycle Assessment (LCA) of ICT in Sweden
WS @ ICT4S 2014
Jens Malmodin, Ericsson Research
Dag Lundén, TeliaSonera

Public | Ericsson AB / © TeliaSonera AB | [email protected] | Dag.Lundé[email protected] | 2014-08-22 | Page 2
› Improve the understanding of the energy consumption and carbon footprint of the ICT sector.
It will elaborate on the probably most comprehensive scientific research presented in the scientific Journal of Industrial Ecology (http://dx.doi.org/10.1111/jiec.12145).
› In addition the actual trends related to CO2 and energy consumption between 1990 – 2010 will be revealed.
› The findings and results presented is based on data originating from a Swedish context but the ambition is to elaborate on a global perspective.
Ambition with the presentation

Public | Ericsson AB / © TeliaSonera AB | [email protected] | Dag.Lundé[email protected] | 2014-08-22 | Page 3
Journal of industrial ecologyarticle

Public | Ericsson AB / © TeliaSonera AB | / [email protected] / Dag.Lundé[email protected] | 2014-06-30 | Page 4
› This presentation is based on many years of research and include large volumes of data and information.
› It’s highly addictive and might keep you busyfor years to come
› Several of the slides are very detailed and contains too much information to be good for your reading at the WS, so please do not even try! The intention to include the data is to spread the figures to be used afterwards.
› You will receive a copy of the presentation in paper or digital.
Warning

Public | Ericsson AB / © TeliaSonera AB | / [email protected] / Dag.Lundé[email protected] | 2014-06-30 | Page 5
About the speakers
Jens Malmodin works at Ericsson as an Senior environmental researcher. Life cycle assessments and energy efficiency has always been an important part of his work and he has been active in standardization of LCA. He’s is a member of the Sustainability Research Team at Ericsson Research.
Jens holds an MSc in material engineering from the Royal Institute of Technology (KTH), Stockholm, Sweden.
Dag Lundén work as environmental manager with in TeliaSonera. The work contains more or less the whole spectrum in the environmental field including corporate strategy, research, legislation and product development all the way to recycling and waste treatment. During the last couple of years the main focus has been on RoD within the area of energy efficiency and Life Cycle Assessment.
Dag holds an MSc in Land surveying from the Royal Institute of Technology (KTH), Stockholm, Sweden.

Public | Ericsson AB / © TeliaSonera AB | [email protected] | Dag.Lundé[email protected] | 2014-08-22 | Page 6
About Ericsson
Public | Ericsson AB / © TeliaSonera AB | / [email protected] / Dag.Lundé[email protected] | 2014-06-30 | Page 7
#1
#1
#1
#1
#1
#2
#2
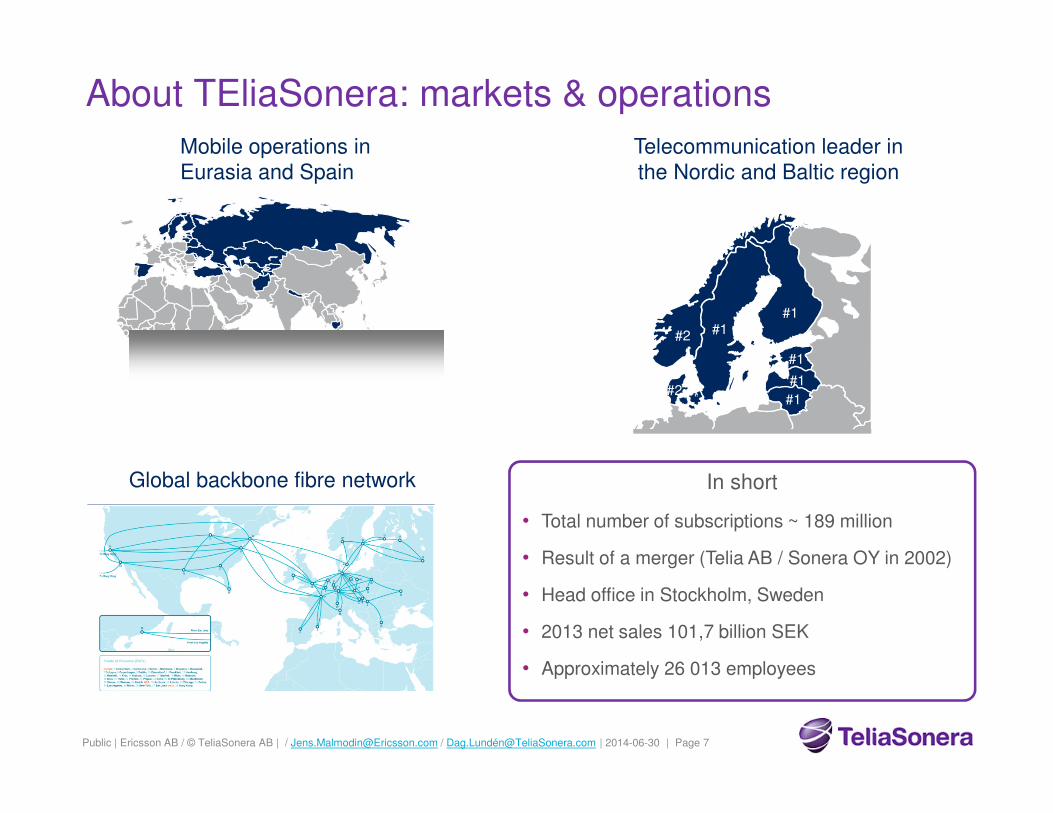
Global backbone fibre network
Mobile operations in
Eurasia and Spain
Telecommunication leader in
the Nordic and Baltic region
About TEliaSonera: markets & operations
In short
• Total number of subscriptions ~ 189 million
• Result of a merger (Telia AB / Sonera OY in 2002)
• Head office in Stockholm, Sweden
• 2013 net sales 101,7 billion SEK
• Approximately 26 013 employees

Public | Ericsson AB / © TeliaSonera AB | / [email protected] / Dag.Lundé[email protected] | 2014-06-30 | Page 8
Introduction
1970 2007 2050
Direct CO2
CO2e = CO2 equivalentemissions & effects
1900
Sources: IPCC, UN, WRI, WBC, WEF, IEA, Swedish Environmental Institute
Other CO2e
Annual global
CO2e emissions
Total CO2e 2007:
47 Gtonnes or
7 tonnes/capita
400 ppm
280 ppm (pre-industrial level)
300 ppm
1950
CO2 level in the atmosphere
230 ppm (∼ last million years)
Global warming: A seriousproblem for our civilization
450 ppm
2050
9 billion people
< 9 billion
tonne CO2e
< 1 tonne
per capita
To stabilize CO2 level
at about 450 ppm (equal
to about +2°C) require
large (50%-80%) emission
reductions 2007-2050.
Exact % 2050 is not important
for actions now, see curves
-50%
-80%
Public | Ericsson AB / © TeliaSonera AB | / [email protected] / Dag.Lundé[email protected] | 2014-06-30 | Page 9
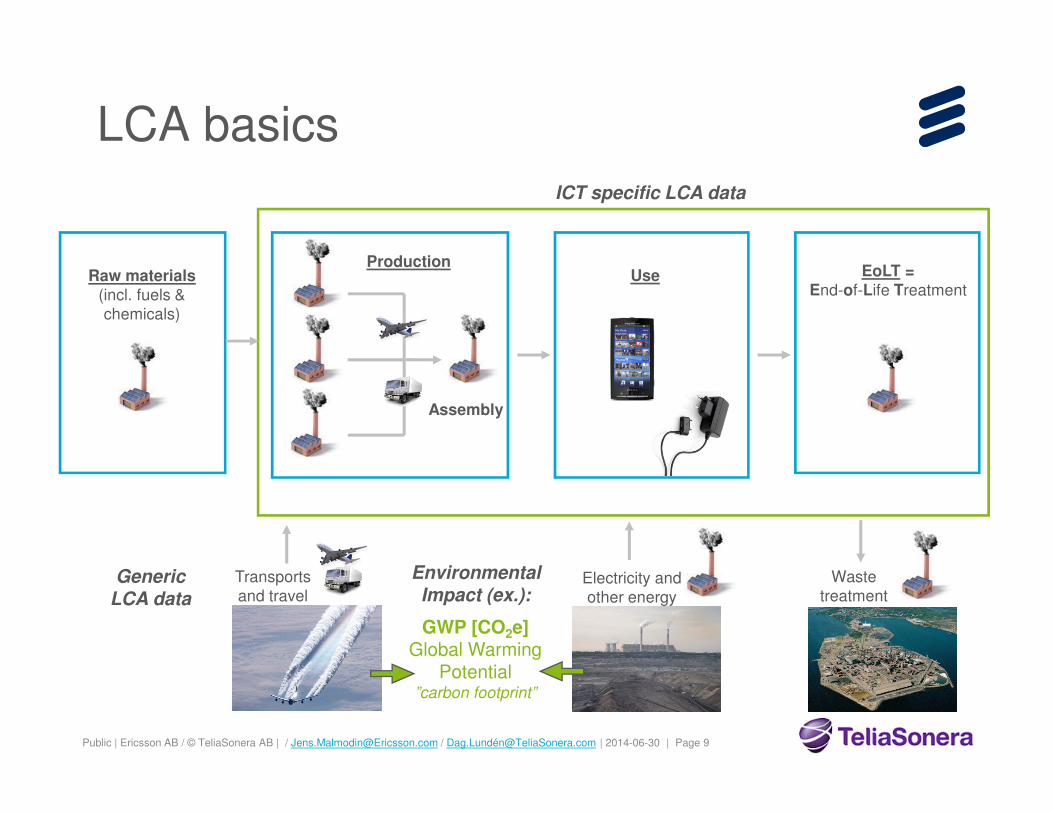
LCA basics
Raw materials(incl. fuels &chemicals)
Use EoLT =End-of-Life Treatment
Production
Assembly
ICT specific LCA data
Electricity andother energy
Wastetreatment
Transportsand travel
GenericLCA data
GWP [CO2e]Global Warming
Potential”carbon footprint”
Environmental Impact (ex.):
Public | Ericsson AB / © TeliaSonera AB | / [email protected] / Dag.Lundé[email protected] | 2014-06-30 | Page 10
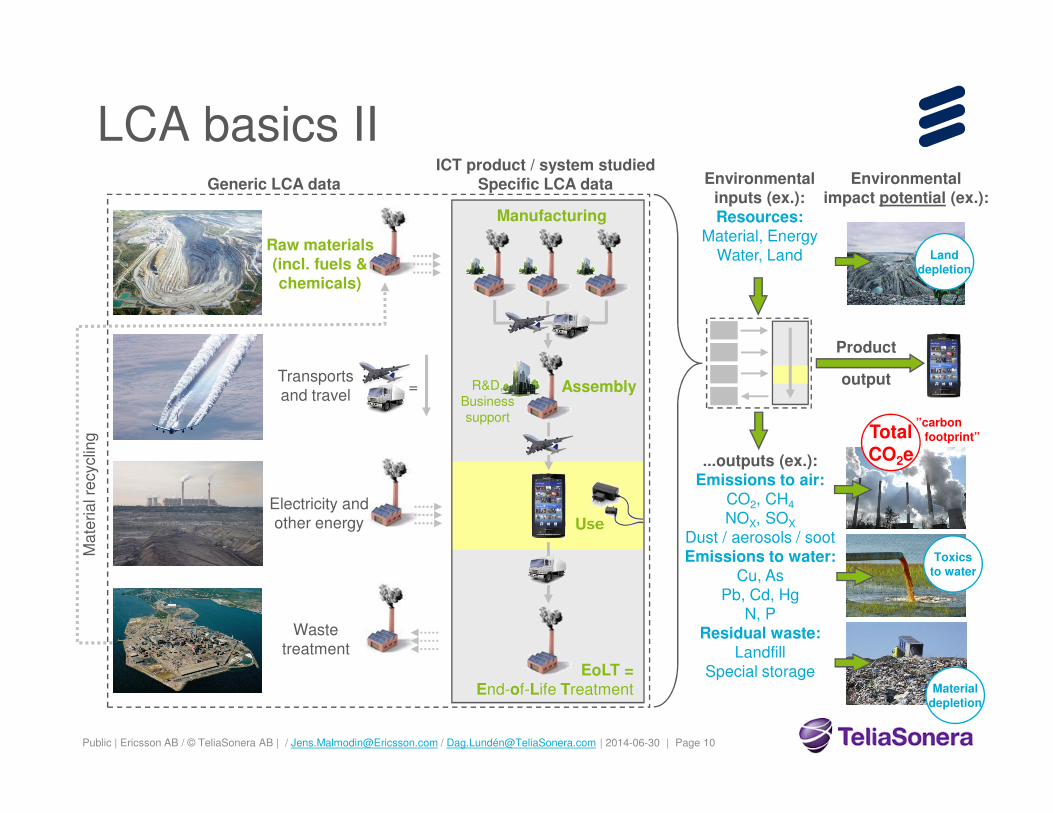
LCA basics II
Use
Manufacturing
EoLT =End-of-Life Treatment
Assembly
ICT product / system studied
Specific LCA data
R&D,
Business
support
Wastetreatment
Transportsand travel
=
Electricity andother energy
Ma
teria
l re
cyclin
g
Raw materials(incl. fuels &chemicals)
Generic LCA data Environmental
inputs (ex.):Resources:
Material, EnergyWater, Land
...outputs (ex.):Emissions to air:
CO2, CH4
NOX, SOX
Dust / aerosols / sootEmissions to water:
Cu, AsPb, Cd, Hg
N, PResidual waste:
LandfillSpecial storage
Product
output
TotalCO2e
Environmental
impact potential (ex.):
Materialdepletion
Toxicsto water
Landdepletion
”carbonfootprint”

Public | Ericsson AB / © TeliaSonera AB | / [email protected] / Dag.Lundé[email protected] | 2014-06-30 | Page 11
EX: “FULL” LCA of ICs
› Semiconductors (ICs) is one of the most important parts in LCA of electronics
– Energy consumption, especially in the wafer fab
– Ultra pure chemicals and gases (energy...)
– Yields, hazardous waste, F-gases etc.
– Site construction (materials, energy...)
Semiconductors (ICs)
Wafer production Wafer fab Encapsulation
EoLT, recycling and waste
Energy and transports
Materials,
chemicals
and gases

Public | Ericsson AB / © TeliaSonera AB | [email protected] | Dag.Lundé[email protected] | 2014-08-22 | Page 12
Ericsson / TeliaSonera: Long tradition of LCA studies
Ericsson
› First LCA of a radio base station (1994)
› Detailed studies on ICs and PCBs (1995)
› First network-wide ”LCA-like” study (1996)
› LCA of cables (Ericsson Cables) (1998)
› LCA project with Telia Mobile and AT&T (1998)
› LCA of 3G (2001)
› Updates of 3G LCA study (2004-2007) + GSM network studies
› The first study of fixed broadband/PC (2007)
› LCA of a mobile phone (Sony Ericsson) including new data for IC, PCB, LCD, battery etc (2008)
› LCA of antenna towers (2008)
› LCA of fibre optic submarine cable system (2009)
› LCA of Smartphone with Sony (2013)
TeliaSonera
› LCA of a video conference system (1998)
› LCA of a mobile subscription (2G) (1998)
› LCA of construction of fixed line (1998)
› LCA of virtual exchange service (1999)
› LCA of radio link vs. optical fiber systems (1999)
› LCA of a telephone answering machine vs. a virtual answering service (1999)
› LCA of IP telephony (1999)
› LCA of fixed telephony in Sweden (2000)
› LCA of Data Center cooling solutions. TeliaSonera Green room concept (2012, 2 studies)

Public | Ericsson AB / © TeliaSonera AB | [email protected] | Dag.Lundé[email protected] | 2014-08-22 | Page 13
Methodology: ICT networks LCA, scope & context
Title: “Life cycle assessment of ICT – carbon footprint and operational electricity use from the operator, national and subscriber perspective in Sweden.”Published in the scientific Journal of Industrial Ecology. dx.doi.org/10.1111/jiec.12145
Public | Ericsson AB / © TeliaSonera AB | [email protected] | Dag.Lundé[email protected] | 2014-08-22 | Page 14
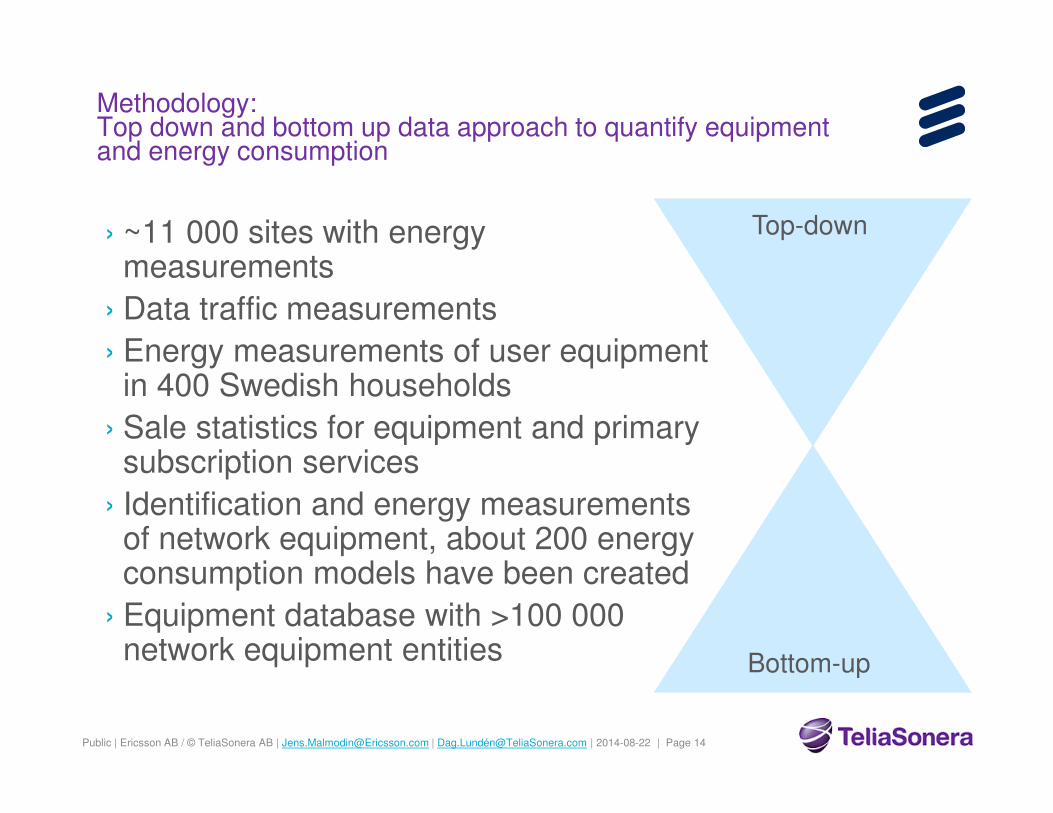
› ~11 000 sites with energymeasurements
› Data traffic measurements
› Energy measurements of user equipment in 400 Swedish households
› Sale statistics for equipment and primary subscription services
› Identification and energy measurements of network equipment, about 200 energy consumption models have been created
› Equipment database with >100 000 network equipment entities
Methodology: Top down and bottom up data approach to quantify equipment and energy consumption
Top-down
Bottom-up
Public | Ericsson AB / © TeliaSonera AB | [email protected] | Dag.Lundé[email protected] | 2014-08-22 | Page 15
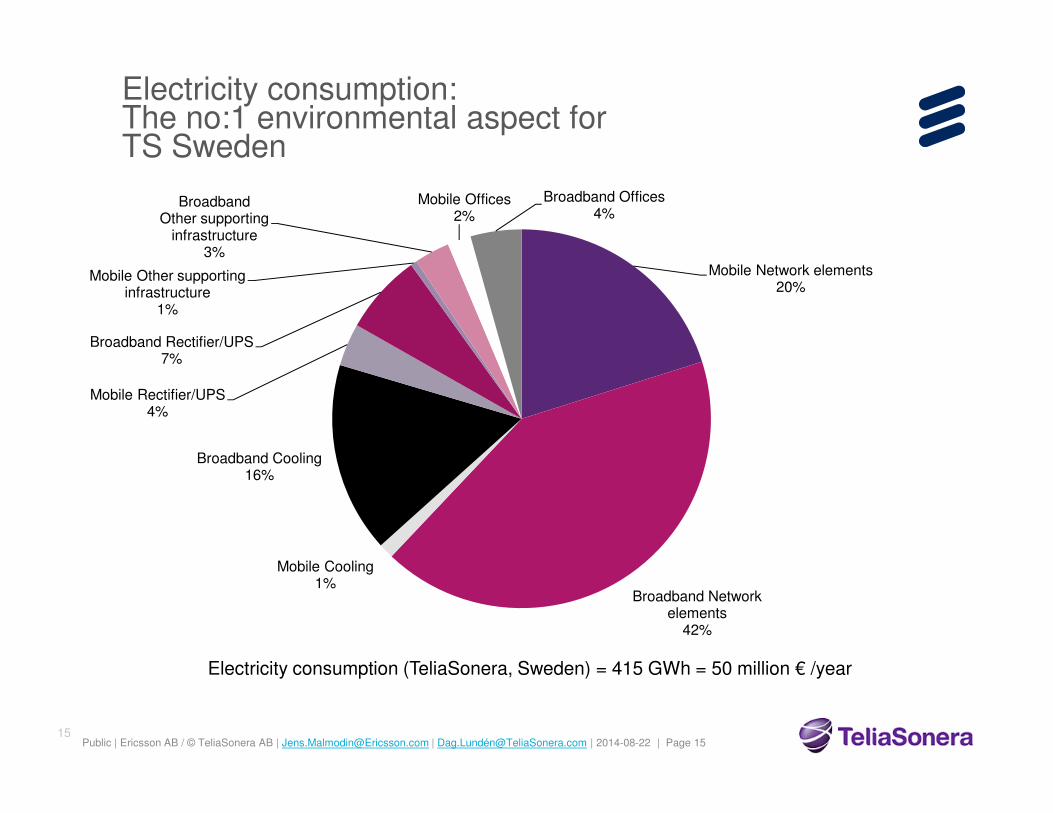
Electricity consumption: The no:1 environmental aspect for TS Sweden
15
Mobile Network elements20%
Broadband Network elements
42%
Mobile Cooling1%
Broadband Cooling16%
Mobile Rectifier/UPS4%
Broadband Rectifier/UPS7%
Mobile Other supporting infrastructure
1%
BroadbandOther supporting
infrastructure3%
Mobile Offices2%
Broadband Offices4%
Electricity consumption (TeliaSonera, Sweden) = 415 GWh = 50 million € /year
Public | Ericsson AB / © TeliaSonera AB | [email protected] | Dag.Lundé[email protected] | 2014-08-22 | Page 16
Foto’s from the IndustryPICTUres

Public | Ericsson AB / © TeliaSonera AB | [email protected] | Dag.Lundé[email protected] | 2014-08-22 | Page 17
Data and measurementsICT sector parts 2010 in Sweden Amount and description Electricity consumption Production
User equipment
Fixed phones~ 11 million
(5,4 million active lines)150 GWh 12 ktonnes CO2e
Mobile phones~ 10,5 million
(one per active subscription)30 GWh 84 ktonnes
PCs ~ 8,5 million 1 850 GWh 790 ktonnes
Fixed modems, routers and gateways ~ 4 million 330 GWh 16 ktonnes
TVs and set-top-boxes (IPTV only) ~ 0,35 million 95 GWh 17 ktonnes
Network equipment and operators’ operation and maintenance
Fixed phone network 5,4 million active phone lines, including local
and central phone switches 145 GWh 39 ktonnes
Mobile network (3 national GSM
networks and 2 national 3G networks,
including smaller ones
29 000 base stations but fewer physical base
station sites, also including central mobile
nodes
306 GWh
(172 GWh GSM
and 134 GWh 3G)
37 ktonnes
Broadband access 2,8 million active lines 90 GWh 3 ktonnes
Core networks (IP networks and data
transport networks)
Ten of thousands nodes and hundreds of
thousands different links130 GWh 19 ktonnes
Operator activities
and their data centers
4 operators including offices, stores, own data
centers, business trips and service cars
140 GWh (+250 GWh
other primary energy =
+78 ktonnes CO2e)
Not included
All other data centers including local
networks and other ICT office
equipment
2,1 million fixed active LAN ports with a
connected PC, 330 000 active servers plus
projectors and equipment for online
conferences
1 300 GWh
(of which data centers are
1 130 GWh)
90 ktonnes
TOTAL
12,1 million mobile subscriptions
10,5 million active mobile phones,
5,4 million active phone lines,
2,8 million active fixed broadband
4 600 GWh
(+250 GWh other
primary energy = +78
ktonnes CO2e)
1 100 ktonnes

Public | Ericsson AB / © TeliaSonera AB | [email protected] | Dag.Lundé[email protected] | 2014-08-22 | Page 18
User equipment studies over time
0
500
1000
Mobile phone
1995
Mobile phone
2002
Mobile phone
2008
Smartphone
2012
Tablet 2012
0
500
1000
1500
2000
2500
3000
3500
Workstation
1993
Desktop 2007 Laptop 2007 Ultra/Note
book 2012
Tablet 2012
kg
CO
2e
kg
CO
2e
Use (PCs 4 years andmobile devices 3 years)
Manufacturing
Same tablet data (is it a PC or a mobile device?)
PCs 1993-2012
Mobile phones 1995-2012
Public | Ericsson AB / © TeliaSonera AB | [email protected] | Dag.Lundé[email protected] | 2014-08-22 | Page 19
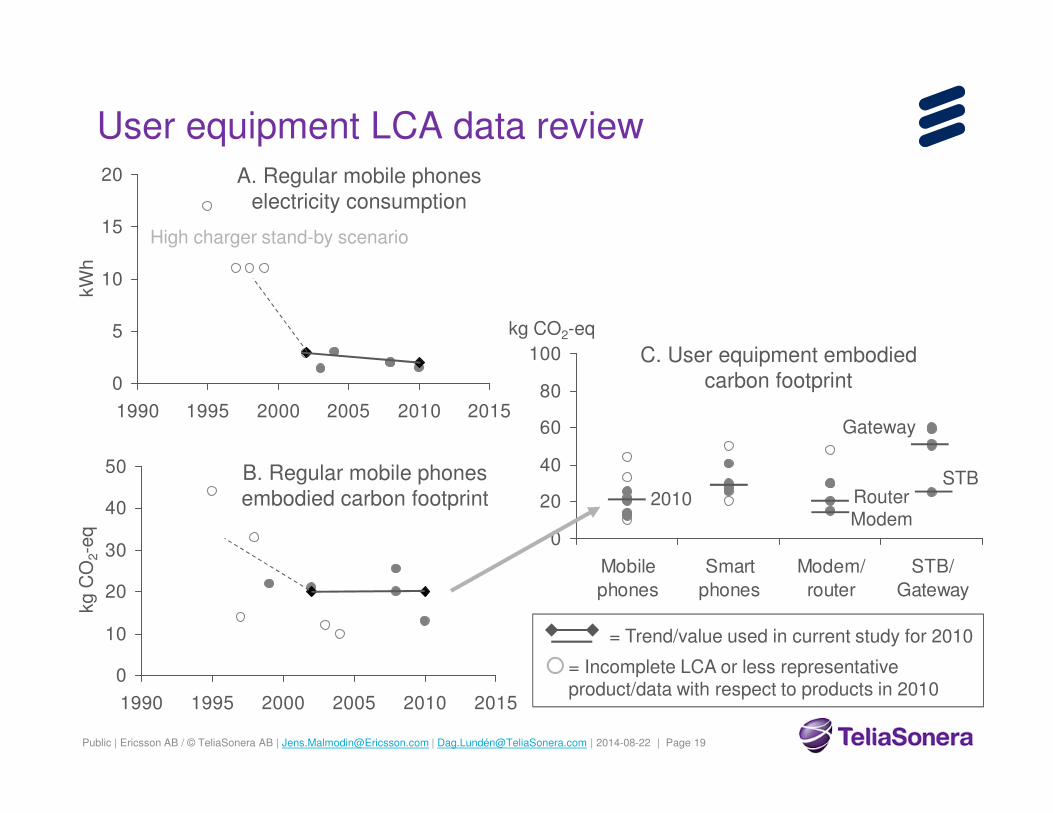
User equipment LCA data review
0
5
10
15
20
1990 1995 2000 2005 2010 2015
kW
h
A. Regular mobile phones
electricity consumption
High charger stand-by scenario
0
10
20
30
40
50
1990 1995 2000 2005 2010 2015
B. Regular mobile phones
embodied carbon footprint
kg C
O2-e
q 0
20
40
60
80
100
Mobile
phones
Smart
phones
Modem/
router
STB/
Gateway
C. User equipment embodied
carbon footprint
kg CO2-eq
2010 RouterModem
STB
Gateway
= Trend/value used in current study for 2010
= Incomplete LCA or less representativeproduct/data with respect to products in 2010

Public | Ericsson AB / © TeliaSonera AB | [email protected] | Dag.Lundé[email protected] | 2014-08-22 | Page 20
Results: Electricity consumption
0
200
400
600
800
1000
1200
1400
1600
1800
2000
Accessnetworks
IP corenetwork
Operatoractivities
Other userequipment
UserPCs
and datatransmission
offices, stores,data centers
incl. control & core,and dedicated trans.
Data centers& LANs (3rd party)
desktops, laptops,extra monitors
CPE, phones etc.
user equipmentreported separately
GW
h
Total ICT in Sweden 2010
Fixed broadbandPSTN and VoIP
3rd party data centers (internal use)3rd party PCs, office equipment and LANs(includes also all “offline” PCs)
3G mobile broadband2G mobile communication

Public | Ericsson AB / © TeliaSonera AB | [email protected] | Dag.Lundé[email protected] | 2014-08-22 | Page 21
0
200
400
600
800
1000
1200
1400
1600
1800
2000
Accessnetworks
IP corenetwork
Operatoractivities
Other userequipment
UserPCs
and datatransmission
buildings, travel,data centers
incl. control & coreand dedicated trans.
Data centers& LANs (3rd party)
desktops, laptops,extra monitors
CPE, phones etc.
‘00
0 t
on
ne
CO
2-e
q
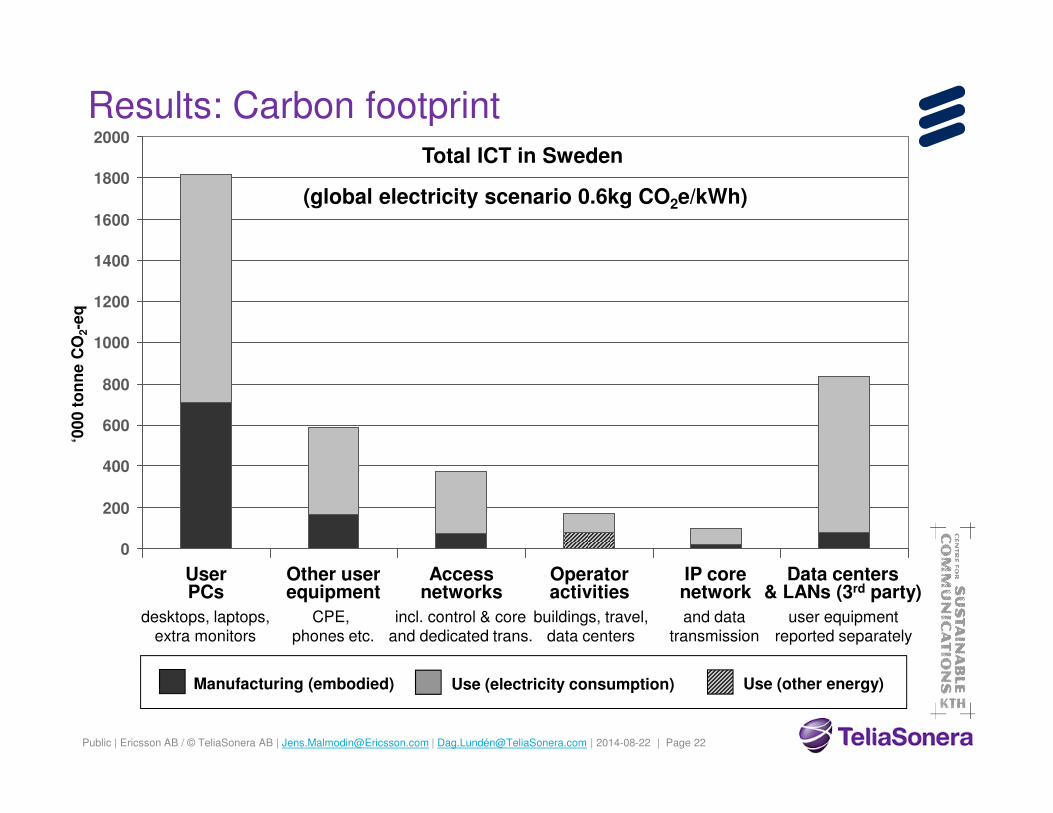
Use (electricity consumption)Manufacturing (embodied) Use (other energy)
user equipmentreported separately
Results: Carbon footprint
Total ICT in Sweden
(actual Swedish electricity 0.06 CO2e/kWh)
Public | Ericsson AB / © TeliaSonera AB | [email protected] | Dag.Lundé[email protected] | 2014-08-22 | Page 22
0
200
400
600
800
1000
1200
1400
1600
1800
2000
Accessnetworks
IP corenetwork
Operatoractivities
Other userequipment
UserPCs
and datatransmission
buildings, travel,data centers
incl. control & coreand dedicated trans.
Data centers& LANs (3rd party)
desktops, laptops,extra monitors
CPE, phones etc.
‘00
0 t
on
ne
CO
2-e
q
Use (electricity consumption)Manufacturing (embodied) Use (other energy)
user equipmentreported separately
Results: Carbon footprint
Total ICT in Sweden
(global electricity scenario 0.6kg CO2e/kWh)

Public | Ericsson AB / © TeliaSonera AB | [email protected] | Dag.Lundé[email protected] | 2014-08-22 | Page 23
0
100
200
300
2G mobilecom
1 subscription1 mobile phone
3G mobilebroadband1 subscription
1 mobile device(incl. PCs)
Classictelephony
1 subscription/line
Broadbandtelephony
(3-play share)
Fixed DSLbroadband
1 subscription/line1.5 home PCs
1.5 CPE “boxes”
OfficeLAN PC
(LAN share,incl. office equip.)
1 office PC
IPTV(high use)(3-play share)
1 TV+STB0.43 gateway
0
100
200
300
400
500
600
Average subscription, Sweden
[kg
CO
2-e
q]
Average subscription, global scenario
[kg
CO
2-e
q]
1 cordless and 1 analogphone per telephony subscription
Use (electricity consumption)Manufacturing Use (other energy)
1 year subscription
∼∼∼∼
1-2 hour driving
Results: Carbon footprint per subscription type

Public | Ericsson AB / © TeliaSonera AB | [email protected] | Dag.Lundé[email protected] | 2014-08-22 | Page 24
Bone stretcher!
*Fika = Common Swedish expression that can be translated as “Coffe breake”
Public | Ericsson AB / © TeliaSonera AB | [email protected] | Dag.Lundé[email protected] | 2014-08-22 | Page 25
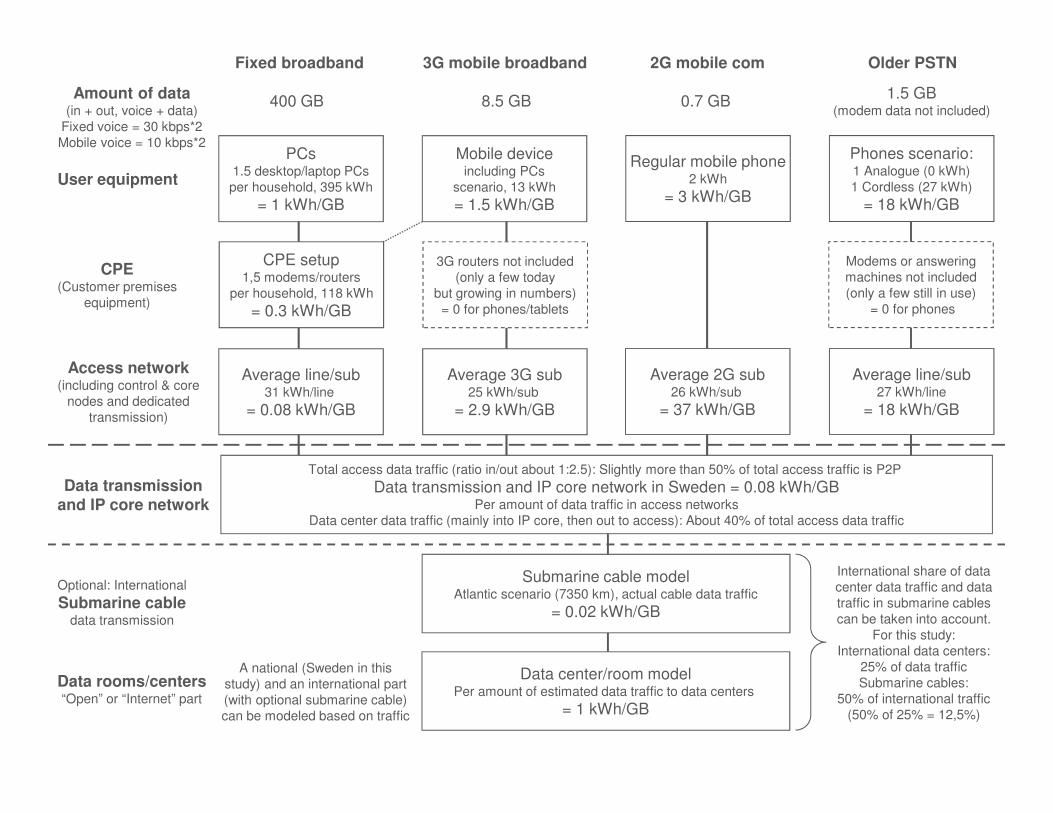
Total access data traffic (ratio in/out about 1:2.5): Slightly more than 50% of total access traffic is P2P
Data transmission and IP core network in Sweden = 0.08 kWh/GBPer amount of data traffic in access networks
Data center data traffic (mainly into IP core, then out to access): About 40% of total access data traffic
CPE setup1,5 modems/routers
per household, 118 kWh
= 0.3 kWh/GB
PCs1.5 desktop/laptop PCs
per household, 395 kWh
= 1 kWh/GB
Average line/sub31 kWh/line
= 0.08 kWh/GB
3G routers not included
(only a few today
but growing in numbers)
= 0 for phones/tablets
Mobile deviceincluding PCs
scenario, 13 kWh
= 1.5 kWh/GB
Average 3G sub25 kWh/sub
= 2.9 kWh/GB
Modems or answering
machines not included
(only a few still in use)
= 0 for phones
Phones scenario:1 Analogue (0 kWh)
1 Cordless (27 kWh)
= 18 kWh/GB
Average line/sub27 kWh/line
= 18 kWh/GB
Regular mobile phone2 kWh
= 3 kWh/GB
Average 2G sub26 kWh/sub
= 37 kWh/GB
CPE(Customer premises
equipment)
User equipment
Access network(including control & core
nodes and dedicated
transmission)
400 GB 8.5 GBAmount of data
(in + out, voice + data)
Fixed voice = 30 kbps*2
Mobile voice = 10 kbps*2
0.7 GB1.5 GB
(modem data not included)
Data center/room modelPer amount of estimated data traffic to data centers
= 1 kWh/GB
Submarine cable modelAtlantic scenario (7350 km), actual cable data traffic
= 0.02 kWh/GB
Data rooms/centers“Open” or “Internet” part
Optional: International
Submarine cabledata transmission
Data transmissionand IP core network
Fixed broadband 3G mobile broadband 2G mobile com Older PSTN
International share of data
center data traffic and data
traffic in submarine cables
can be taken into account.
For this study:
International data centers:
25% of data traffic
Submarine cables:
50% of international traffic
(50% of 25% = 12,5%)
A national (Sweden in this
study) and an international part
(with optional submarine cable)
can be modeled based on traffic

Public | Ericsson AB / © TeliaSonera AB | [email protected] | Dag.Lundé[email protected] | 2014-08-22 | Page 26
Results - Development over time 1990 – 2010: The TeliaSonera ICT sector share of emissions in Sweden (Summarized per user category)
Not measured IT environment
Telecom + IT “ICT”

Public | Ericsson AB / © TeliaSonera AB | [email protected] | Dag.Lundé[email protected] | 2014-08-22 | Page 27
0
200
400
600
800
1000
2007
2008
2009
2010
2011
2012
2013
2014
2015
2016
2017
2018
2019
2020
PCs (all types, excluding tablets)
Home devices (fixed phones, CPE)
Fixed access networks
Data centers, data transmission and IP core
Fixed partFrom 2-2.7 billion users in 2007 to 3-5 billion users in 2020
(depending on definitions and prognoses)
Total GHG emissions (carbon footprint) [Mt CO2e]
ICT sector carbon footprint
1.1% of global 1.4% of global
0
200
400
600
800
1000
2007
2008
2009
2010
2011
2012
2013
2014
2015
2016
2017
2018
2019
2020
Connected devices scenario
Mobile devices (including tablets)
PCs (all types, excluding tablets)
Mobile access networks
Data centers, data transmission and IP core
Mobile partFrom 2.95 billion users in 2007 to 7.6-9.5 billion users
in 2020 (depending on definitions and prognoses)
Total GHG emissions (carbon footprint) [Mt CO2e]
0.2% of global
0.5% of global
Sources:
Malmodin et al. 2010
Malmodin et al. 2013
Ericsson 2013

Public | Ericsson AB / © TeliaSonera AB | [email protected] | Dag.Lundé[email protected] | 2014-08-22 | Page 28
Mobile broadband data
0
2
4
6
8
10
12
14
16
2006 2007 2008 2009 2010 2011 2012 2013
0
50
100
150
200
250
300
350
400Energy consumption [GWh]
Total subs* [millions]
3G/4G subs* [millions]
0
20
40
60
80
100
2006 2007 2008 2009 2010 2011 2012 2013
3G/4G only
Energy/sub* [kWh/sub]
* M2M subs are not included
GSM + 3G/4G
GSM only and GSM users only
GSM only and all GSM users (also 3G/4G subs)
0
50000
100000
150000
200000
250000
300000
350000
2006 2007 2008 2009 2010 2011 2012 2013
Mobile data traffic
Voice traffic
Mobile data and voice traffic [TB]
Data > voice
in 2007
4% of total data
>10% of total data
0
25
50
75
100
125
150
2006 2007 2008 2009 2010 2011 2012 2013
Energy/data [kWh/GB]
3G/4G only
GSM + 3G/4G
<1 kWh/GB
Public | Ericsson AB / © TeliaSonera AB | [email protected] | Dag.Lundé[email protected] | 2014-08-22 | Page 29
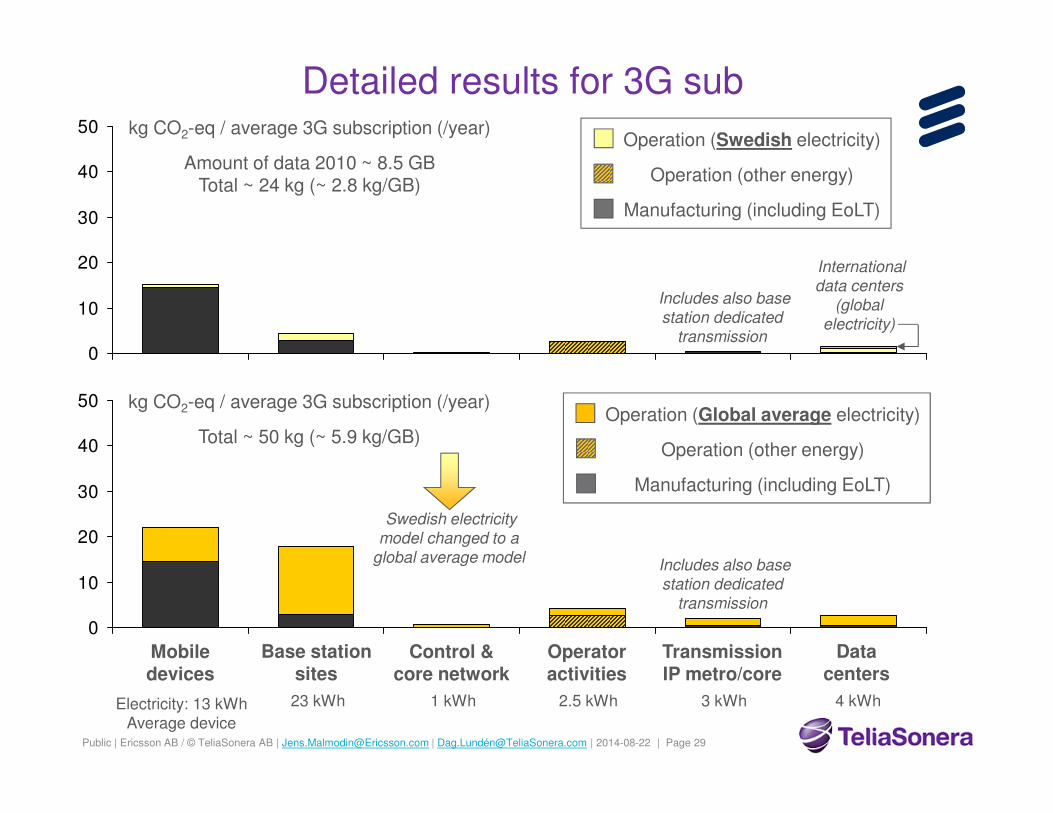
Detailed results for 3G sub
0
10
20
30
40
50
TransmissionIP metro/core
Base stationsites
Mobiledevices
Operatoractivities
Datacenters
Control &core network
Operation (Swedish electricity)
Operation (other energy)
Manufacturing (including EoLT)
0
10
20
30
40
50Operation (Global average electricity)
Operation (other energy)
Manufacturing (including EoLT)
Includes also base
station dedicated
transmission
Includes also base
station dedicated
transmission
kg CO2-eq / average 3G subscription (/year)
Amount of data 2010 ~ 8.5 GBTotal ~ 24 kg (~ 2.8 kg/GB)
kg CO2-eq / average 3G subscription (/year)
Total ~ 50 kg (~ 5.9 kg/GB)
3 kWh23 kWh 2.5 kWh 4 kWh1 kWhElectricity: 13 kWh
Average device
Swedish electricity
model changed to a
global average model
International
data centers
(global
electricity)

Public | Ericsson AB / © TeliaSonera AB | [email protected] | Dag.Lundé[email protected] | 2014-08-22 | Page 30
Results: Electricity consumption 2010 vs 2013
0
200
400
600
800
1000
1200
1400
1600
1800
2000
Accessnetworks
IP corenetwork
Operatoractivities
Other userequipment
UserPCs
and datatransmission
offices, stores,data centers
incl. control & core,and dedicated trans.
Data centers& LANs (3rd party)
desktops, laptops,extra monitors
CPE, phones etc.
user equipmentreported separately
GW
h
Total ICT in Sweden 2010
Fixed broadbandPSTN and VoIP
3rd party data centers (internal use)3rd party PCs, office equipment and LANs(includes also all “offline” PCs)
3G mobile broadband2G mobile communication
2013: More laptops and less overall use?
(less desktops and more tablet / smart
phone use)
2013: Improvements of existing data centers?
2013: New base station equipment (+) and
modernization of existing sites (-): +100 GWh
2013: About 4 million
new tablets: +60 GWh
2013: New data
centers: +300 GWh
2013: Energy saving activities
in operator data centers and
IP core
Public | Ericsson AB / © TeliaSonera AB | [email protected] | Dag.Lundé[email protected] | 2014-08-22 | Page 31
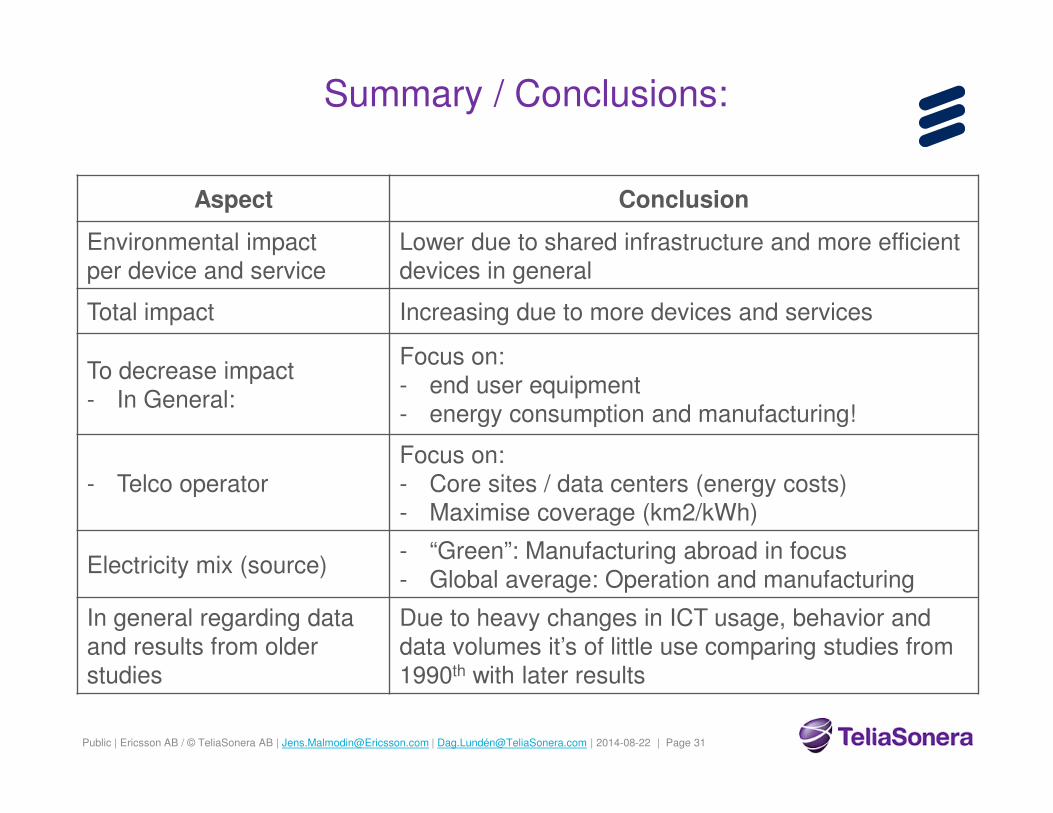
Summary / Conclusions:
Aspect Conclusion
Environmental impact per device and service
Lower due to shared infrastructure and more efficient devices in general
Total impact Increasing due to more devices and services
To decrease impact
- In General:
Focus on:
- end user equipment
- energy consumption and manufacturing!
- Telco operator
Focus on:
- Core sites / data centers (energy costs)
- Maximise coverage (km2/kWh)
Electricity mix (source)- “Green”: Manufacturing abroad in focus
- Global average: Operation and manufacturing
In general regarding data and results from older studies
Due to heavy changes in ICT usage, behavior and data volumes it’s of little use comparing studies from 1990th with later results
Public | Ericsson AB / © TeliaSonera AB | [email protected] | Dag.Lundé[email protected] | 2014-08-22 | Page 32
”Säll är den som har till rättesnöre, att man bör tänka efter före”
”Blessed is he who as guideline follows the rule that you should think before you act”
Tage Danielsson, Samlade dikter 1967 - 1967

Public | Ericsson AB / © TeliaSonera AB | [email protected] | Dag.Lundé[email protected] | 2014-08-22 | Page 33
Thank you for your interest