Life and breath: How air pollution affects public health ...
48
Transcript of Life and breath: How air pollution affects public health ...


Acknowledgements
Primary Authors Minnesota Pollution Control Agency David Bael Minnesota Department of Health Jeannette Sample
Contributors Minnesota Pollution Control Agency Dorian Kvale Greg Pratt Mary Williams
Minnesota Department of Health Jean Johnson Paula Lindgren Naomi Shinoda
Acknowledgements We are grateful to the following people who served as technical consultants, reviewers and advisors to the authors as well as technical review by external representatives of other organizations.
Minnesota Pollution Control Agency Ned Brooks Mary Dymond Kristie Ellickson MaryJean Fenske Lisa Herschberger Frank Kohlasch Margaret McCourtney Cassie McMahon Kari Palmer
Minnesota Department of Health Wendy Brunner Jim Kelly Kathy Norlien Kristin Raab Chuck Stroebel Dan Symonik Linden Weiswerda
New York City Department of Health and Mental Hygiene Iyad Kheirbek U.S. Environmental Protection Agency, Region 5 George Bollweg U.S. Environmental Protection Agency, Office of Air Quality Planning and Standards Neal Fann
Editing and graphic design Minnesota Pollution Control Agency Risikat Adesaogun Ralph Pribble
Minnesota Department of Health Kitty Hurley Sara Maaske Doug Schultz
aq1-61
1
Table of Contents Executive Summary ....................................................................................................................................... 4
What’s the issue? ...................................................................................................................................... 4
Twin Cities-area annual* health impacts attributable to PM2.5 .......................................................... 4
Who is affected? ....................................................................................................................................... 5
Twin Cities-area annual* health impacts attributable to ground-level ozone .................................... 5
What are the health benefits of improving air quality? ........................................................................... 5
How do we improve health for people vulnerable to air pollution? ........................................................ 5
More about the study ............................................................................................................................... 6
Introduction .................................................................................................................................................. 7
Background ................................................................................................................................................... 8
Air pollution sources ................................................................................................................................. 8
Air pollution and health .......................................................................................................................... 10
Methods ...................................................................................................................................................... 12
Change in air quality ............................................................................................................................... 12
Health and death data ............................................................................................................................ 16
Health effect of pollution estimates ....................................................................................................... 17
Population data ....................................................................................................................................... 19
Results ......................................................................................................................................................... 22
1. Metro-wide pollution-attributable health impacts ............................................................................ 22
2. Geographic analysis of Twin Cities metro-area pollution-attributable health impacts ...................... 24
Fine particles (PM2.5) ........................................................................................................................... 24
Ozone .................................................................................................................................................. 29
3. Air pollution exposure among population subgroups ........................................................................ 32
4. Demographic analysis of Twin Cities metro-area pollution-attributable health impacts .................. 33
Age ...................................................................................................................................................... 33
Poverty and Race ................................................................................................................................ 36
Limitations .................................................................................................................................................. 39
Air quality data ........................................................................................................................................ 39
Health and death data ............................................................................................................................ 40
Health effect of pollution estimates ....................................................................................................... 40
Population data ....................................................................................................................................... 41
2

Conclusion ................................................................................................................................................... 42
Appendix ..................................................................................................................................................... 44
Health impact estimation.................................................................................................................... 44
Fine particle studies ............................................................................................................................ 44
Ozone studies ...................................................................................................................................... 45
Bibliography ................................................................................................................................................ 46
3

Executive Summary It’s only fair that all Minnesotans live in conditions that support a healthy and fulfilling life. One important part of this is living in an environment with clean air. The goal of this report by the Minnesota Pollution Control Agency (MPCA) and Minnesota Department of Health (MDH) is to inform decisions on how to improve health for all residents of the state of Minnesota by reducing air pollution that contributes to the development of various diseases.
What’s the issue? Breathing polluted air can cause a variety of health problems. While air quality in Minnesota currently meets federal standards, even low and moderate levels of air pollution can contribute to serious illnesses and early death. This report estimates that in 2008 in the Twin Cities:
· About 6 to13 percent of all residents who died, and about 2 to 5 percent of all residents who visited the hospital or emergency room for heart and lung problems, did so partly because of fine particles in the air or ground-level ozone.
· This roughly translates to about 2,000 deaths, 400 hospitalizations, and 600 emergency room visits.
Twin Cities-area annual* health impacts attributable to PM2.5 (adapted from Table 4)
Health Effect Age Group Number ** Percent of Total Events Attributable rate per 100,000 people
All-cause deaths 25 and older 2,152 (1,108 – 3,123)
12.6% (6.5% - 18.3%)
110.5 (56.9 – 160.4)
Asthma hospitalizations Under 18 17
(0 – 86) 2.1%
(0% - 10.6%) 2.3
(0 – 11.5)
Asthma and COPD hospitalizations 18 to 64 47
(16 – 77) 2.3%
(0.8% - 3.8%) 2.4
(0.8 – 3.9)
All respiratory hospitalizations 65 and older 166
(96 – 235) 2.1%
(1.2% - 3.0%) 53.0
(30.7 – 75.0)
Asthma emergency department visits All ages 402
(112 – 684) 2.9%
(0.8% - 4.9%) 13.6
(3.8 – 23.2)
Cardiovascular hospitalizations 65 and older 91
(35 – 146) 0.7%
(0.3% - 1.1%) 28.9
(11.0 – 46.6)
* 2008 annual average PM2.5 levels minus natural background levels **95% confidence intervals. These reflect the range within which one can be 95% confident that the true value lies.
4

Who is affected? Everyone can be affected by breathing polluted air, but the sick, the elderly, and children with uncontrolled asthma are affected more than others.
· There is little difference in average air pollution levels between ZIP codes in the Twin Cities; however ZIP codes with larger populations of people of color and American Indians and residents living in poverty are more vulnerable to air pollution. Because these populations already have higher rates of heart and lung conditions, they experience more hospitalizations, asthma emergency department visits, and death related to air pollution.
· The impacts of air pollution fall disproportionately on the elderly (65 and older), who have higher rates of heart and lung conditions, and children under 18, who have higher rates of asthma. The elderly experience much higher rates of hospitalization for heart and lung problems and death due to air pollution. Children experience much higher rates of emergency department visits for asthma due to air pollution than adults.
Twin Cities-area annual* health impacts attributable to ground-level ozone (adapted from Table 5)
Health Effect Age Group Number ** Percent of Total Events Attributable rate per 100,000 people
Cardiopulmonary deaths All Ages 23
(9 – 38) 1.1%
(0.4% - 1.8%) 0.8
(0.3 – 1.3)
Asthma hospitalizations All Ages 47
(29 – 64) 4.9%
(3.0% - 6.7%) 1.6
(1.0 – 2.2)
Asthma emergency department visits All ages 185
(0 – 402) 3.2%
(0% - 7.0%) 6.3
(0 – 13.7)
* 2008 May-September annual average ozone levels minus natural background levels. **95% confidence intervals. These reflect the range within which one can be 95% confident that the true value lies.
What are the health benefits of improving air quality? Improving air quality can provide significant public health benefits. If we reduce fine particles and ground-level ozone by 10 percent from 2008 levels, we can prevent hundreds of deaths, hospitalizations, and emergency department visits due to heart and lung conditions every year that are attributed to these pollutants. Everyone can help reduce air pollution by paying more attention to its causes and reducing our individual contributions. Actions such as driving less, walking and biking more, and minimizing recreational fires help reduce air pollution in Minnesota communities.
How do we improve health for people vulnerable to air pollution? Addressing the high underlying rates of heart and lung disease, particularly among people of color and American Indians and those in poverty, can reduce the impact of air pollution on health. If we can better prevent chronic obstructive pulmonary disease (COPD) and heart disease, and help children control their asthma, we can help these groups avoid hospitalizations, emergency department visits, and live longer, healthier lives.
5

More about the study This report is the result of work done jointly by the Minnesota Pollution Control Agency and Minnesota Department of Health as part of the Urban Air Quality and Respiratory Health Initiative. When the project was started, 2008 was the most current year of air quality data available for every ZIP code in the Twin Cities metro area. Therefore, 2008 is the baseline for tracking future progress in reducing air pollution and its impacts. Because the report provides a general population-level snapshot of the impacts of air pollution for the Twin Cities area in 2008, it does not address individual exposure and health impacts related to higher or lower exposures within ZIP codes or changes that occur in air pollution over time.
To estimate health impacts related to air pollution, the agencies used mathematical modeling software that estimates what portion of disease is due to pollution. The software was developed by the United States Environmental Protection Agency and is used for estimating the health impacts and economic value of changes in air quality. It uses published estimates of the relationship between air pollution and health from peer-reviewed scientific studies. The estimates used in this report carry many uncertainties and should not be taken as exact measures of impacts. However, they are useful for demonstrating the general size and scope of the problem and confirm that air pollution poses a serious health threat.
6

Introduction Minnesota state legislators and urban communities have expressed concern over the role air quality plays in respiratory health in the Twin Cities region. Breathing polluted air can cause a variety of illnesses and even death (US Environmental Protection Agency, 2012). Although Minnesota and the U.S. have made great strides in reducing air pollution, health experts are finding adverse health impacts at ever-lower pollutant levels. While air quality in Minnesota meets health-based federal standards, differences exist in environmental exposures and health outcomes. Compared to rural areas of the state, levels of fine particles and other pollutants are elevated in the Twin Cities metro area and other Minnesota cities. Baseline rates of asthma emergency department visits and hospitalizations are also greater in the Twin Cities metro area compared to the rest of the state.
To address concerns about air pollution and health effects, the Minnesota Pollution Control Agency and Minnesota Department of Health created the Urban Air Quality and Respiratory Health Initiative. The goals of the initiative include using data to inform communities about air quality issues in the Twin Cities urban area, promoting coordination between state government agencies, and demonstrating the use of a Health Impact Assessment (HIA) as a tool to inform public health decisions. The initiative will work to understand health and environmental disparities that affect Minnesotans. The Minnesota Pollution Control Agency (MPCA) and Minnesota Department of Health (MDH) are collaborating on this initiative.
As one part of the Urban Air Quality and Respiratory Health Initiative, this report assesses ZIP code-level data from MPCA and MDH on air quality and health outcomes in the Twin Cities seven-county metro area (Anoka, Carver, Dakota, Hennepin, Ramsey, Scott, and Washington Counties; Figure 1).
Figure 1: Map of Minnesota with the Twin Cities seven-county metro area
7
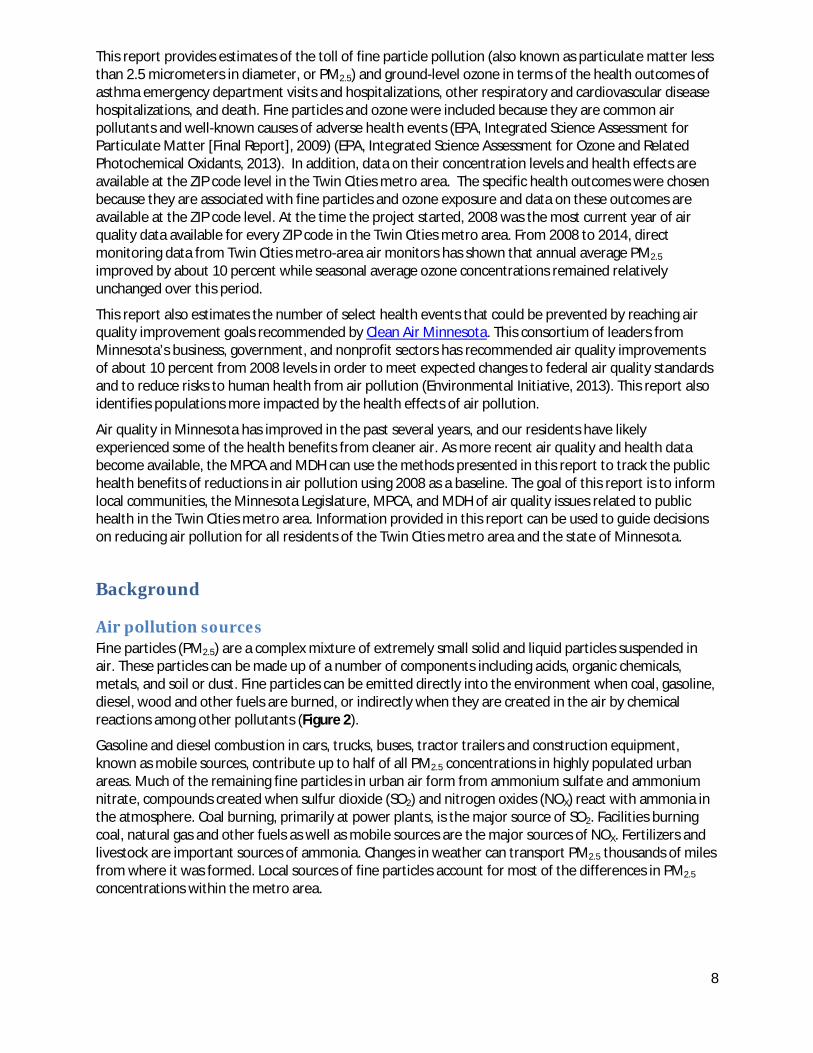
This report provides estimates of the toll of fine particle pollution (also known as particulate matter less than 2.5 micrometers in diameter, or PM2.5) and ground-level ozone in terms of the health outcomes of asthma emergency department visits and hospitalizations, other respiratory and cardiovascular disease hospitalizations, and death. Fine particles and ozone were included because they are common air pollutants and well-known causes of adverse health events (EPA, Integrated Science Assessment for Particulate Matter [Final Report], 2009) (EPA, Integrated Science Assessment for Ozone and Related Photochemical Oxidants, 2013). In addition, data on their concentration levels and health effects are available at the ZIP code level in the Twin Cities metro area. The specific health outcomes were chosen because they are associated with fine particles and ozone exposure and data on these outcomes are available at the ZIP code level. At the time the project started, 2008 was the most current year of air quality data available for every ZIP code in the Twin Cities metro area. From 2008 to 2014, direct monitoring data from Twin Cities metro-area air monitors has shown that annual average PM2.5
improved by about 10 percent while seasonal average ozone concentrations remained relatively unchanged over this period.
This report also estimates the number of select health events that could be prevented by reaching air quality improvement goals recommended by Clean Air Minnesota. This consortium of leaders from Minnesota’s business, government, and nonprofit sectors has recommended air quality improvements of about 10 percent from 2008 levels in order to meet expected changes to federal air quality standards and to reduce risks to human health from air pollution (Environmental Initiative, 2013). This report also identifies populations more impacted by the health effects of air pollution.
Air quality in Minnesota has improved in the past several years, and our residents have likely experienced some of the health benefits from cleaner air. As more recent air quality and health data become available, the MPCA and MDH can use the methods presented in this report to track the public health benefits of reductions in air pollution using 2008 as a baseline. The goal of this report is to inform local communities, the Minnesota Legislature, MPCA, and MDH of air quality issues related to public health in the Twin Cities metro area. Information provided in this report can be used to guide decisions on reducing air pollution for all residents of the Twin Cities metro area and the state of Minnesota.
Background
Air pollution sources Fine particles (PM2.5) are a complex mixture of extremely small solid and liquid particles suspended in air. These particles can be made up of a number of components including acids, organic chemicals, metals, and soil or dust. Fine particles can be emitted directly into the environment when coal, gasoline, diesel, wood and other fuels are burned, or indirectly when they are created in the air by chemical reactions among other pollutants (Figure 2).
Gasoline and diesel combustion in cars, trucks, buses, tractor trailers and construction equipment, known as mobile sources, contribute up to half of all PM2.5 concentrations in highly populated urban areas. Much of the remaining fine particles in urban air form from ammonium sulfate and ammonium nitrate, compounds created when sulfur dioxide (SO2) and nitrogen oxides (NOX) react with ammonia in the atmosphere. Coal burning, primarily at power plants, is the major source of SO2. Facilities burning coal, natural gas and other fuels as well as mobile sources are the major sources of NOX. Fertilizers and livestock are important sources of ammonia. Changes in weather can transport PM2.5 thousands of miles from where it was formed. Local sources of fine particles account for most of the differences in PM2.5 concentrations within the metro area.
8
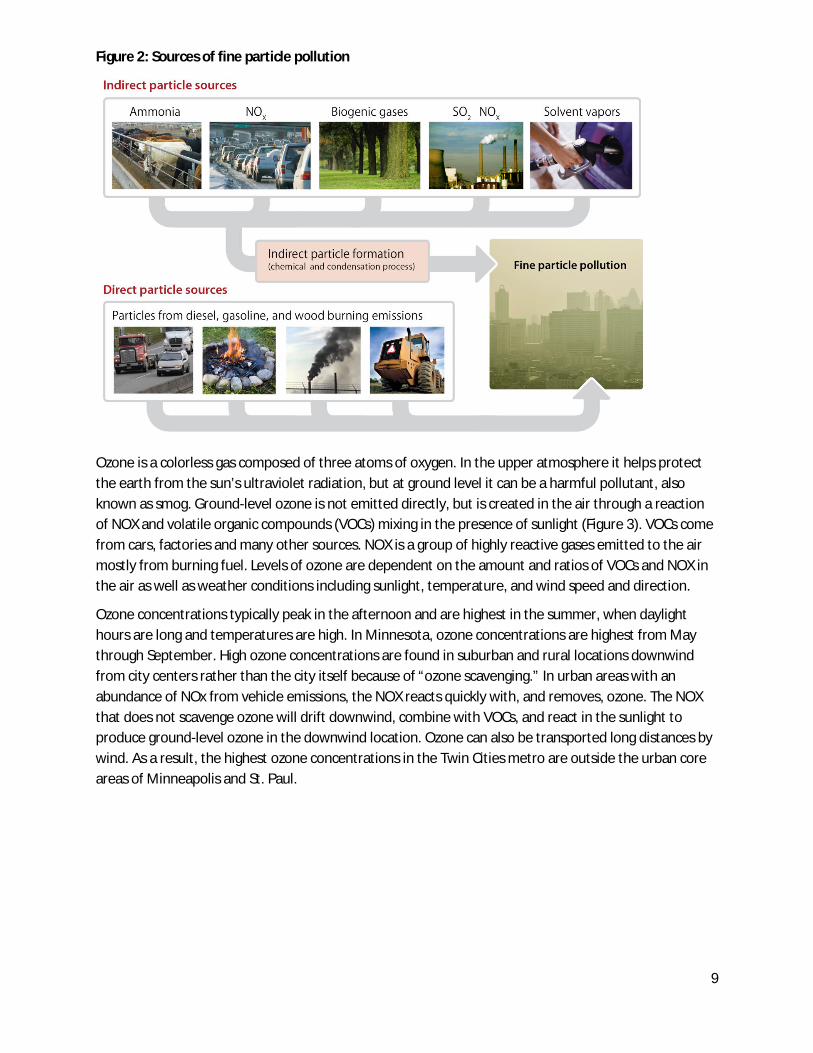
Figure 2: Sources of fine particle pollution
Ozone is a colorless gas composed of three atoms of oxygen. In the upper atmosphere it helps protect the earth from the sun’s ultraviolet radiation, but at ground level it can be a harmful pollutant, also known as smog. Ground-level ozone is not emitted directly, but is created in the air through a reaction of NOX and volatile organic compounds (VOCs) mixing in the presence of sunlight (Figure 3). VOCs come from cars, factories and many other sources. NOX is a group of highly reactive gases emitted to the air mostly from burning fuel. Levels of ozone are dependent on the amount and ratios of VOCs and NOX in the air as well as weather conditions including sunlight, temperature, and wind speed and direction.
Ozone concentrations typically peak in the afternoon and are highest in the summer, when daylight hours are long and temperatures are high. In Minnesota, ozone concentrations are highest from May through September. High ozone concentrations are found in suburban and rural locations downwind from city centers rather than the city itself because of “ozone scavenging.” In urban areas with an abundance of NOx from vehicle emissions, the NOX reacts quickly with, and removes, ozone. The NOX that does not scavenge ozone will drift downwind, combine with VOCs, and react in the sunlight to produce ground-level ozone in the downwind location. Ozone can also be transported long distances by wind. As a result, the highest ozone concentrations in the Twin Cities metro are outside the urban core areas of Minneapolis and St. Paul.
9

Figure 3: Sources of ground-level ozone
Air pollution and health Air pollution is associated with a variety of harmful respiratory and cardiovascular effects. Illnesses caused or worsened by air pollution can also be caused by other risk factors. As a result, most health events triggered by air pollution cannot be identified directly as having air pollution causes. Research has shown that increases in the risks of certain health impacts are related to higher air pollutant concentrations, and these increased risks can be quantified. This relationship between an air pollutant concentration and the risk of a health impact is called a “concentration-response function” (referred to in this report as an “effect estimate”).
High levels of fine particles and ground-level ozone are the two primary causes of poor air quality in much of the US, including Minnesota; these pollutants are also of concern because of their likely health impacts (EPA, Integrated Science Assessment for Particulate Matter [Final Report], 2009) (EPA, Integrated Science Assessment for Ozone and Related Photochemical Oxidants, 2013).
Due to their small size, fine particles can be inhaled deep into the lungs and some of the smallest particles can reach the bloodstream. The particles can accumulate in the respiratory system and cause serious health effects. Short-term exposure (hours, days) can result in asthma attacks, heart attacks, and death. Long-term exposure (months, years) can result in heart and lung diseases, cancers, and death. The elderly and people with heart or lung diseases are more susceptible than others to the effects of PM2.5. Children are also vulnerable to PM2.5 exposure because their lungs are still developing and they spend more time outdoors compared to adults. (EPA, Integrated Science Assessment for Particulate Matter [Final Report], 2009)
10

Ground-level ozone is a lung irritant. Ozone affects the lungs by causing inflammation of the airways and by reducing lung function so that breathing becomes difficult. Breathing ozone can trigger a variety of health problems including chest pain, coughing, throat irritation, and congestion. It can worsen bronchitis, emphysema and asthma, and may play a role in the development of asthma (US Environmental Protection Agency, Integrated Science Assessment for Ozone and Related Photochemical Oxidants, 2013). Exposure to ozone is also linked to death from respiratory and cardiovascular causes (US Environmental Protection Agency, 2014a). People with lung disease, children, older adults, and people who are active outdoors may be particularly sensitive to the effects of ozone. (EPA, Integrated Science Assessment for Ozone and Related Photochemical Oxidants, 2013).
11
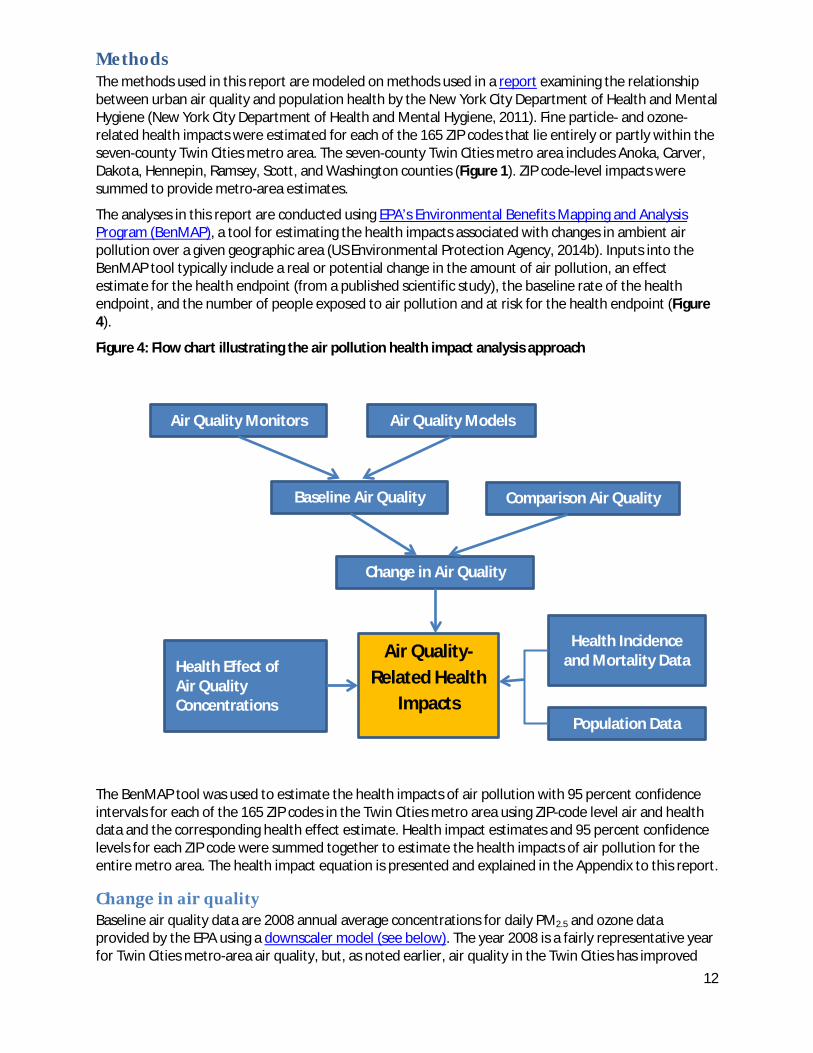
Methods The methods used in this report are modeled on methods used in a report examining the relationship between urban air quality and population health by the New York City Department of Health and Mental Hygiene (New York City Department of Health and Mental Hygiene, 2011). Fine particle- and ozone-related health impacts were estimated for each of the 165 ZIP codes that lie entirely or partly within the seven-county Twin Cities metro area. The seven-county Twin Cities metro area includes Anoka, Carver, Dakota, Hennepin, Ramsey, Scott, and Washington counties (Figure 1). ZIP code-level impacts were summed to provide metro-area estimates.
The analyses in this report are conducted using EPA’s Environmental Benefits Mapping and Analysis Program (BenMAP), a tool for estimating the health impacts associated with changes in ambient air pollution over a given geographic area (US Environmental Protection Agency, 2014b). Inputs into the BenMAP tool typically include a real or potential change in the amount of air pollution, an effect estimate for the health endpoint (from a published scientific study), the baseline rate of the health endpoint, and the number of people exposed to air pollution and at risk for the health endpoint (Figure 4).
Figure 4: Flow chart illustrating the air pollution health impact analysis approach
The BenMAP tool was used to estimate the health impacts of air pollution with 95 percent confidence intervals for each of the 165 ZIP codes in the Twin Cities metro area using ZIP-code level air and health data and the corresponding health effect estimate. Health impact estimates and 95 percent confidence levels for each ZIP code were summed together to estimate the health impacts of air pollution for the entire metro area. The health impact equation is presented and explained in the Appendix to this report.
Change in air quality Baseline air quality data are 2008 annual average concentrations for daily PM2.5 and ozone data provided by the EPA using a downscaler model (see below). The year 2008 is a fairly representative year for Twin Cities metro-area air quality, but, as noted earlier, air quality in the Twin Cities has improved
Air Quality Monitors Air Quality Models
Baseline Air Quality Comparison Air Quality
Change in Air Quality
Health Incidence and Mortality Data
Population Data
Health Effect of Air Quality Concentrations
Air Quality-Related Health
Impacts
12

(particularly PM2.5 concentrations) since 2008 and was improving before then. Both PM2.5 and ozone concentrations were slightly lower in 2008 compared to the previous few years. The downscaler model combines air quality data from air monitors (daily fine particle [24-hour average] and ozone [8-hour maximum] concentrations) with modeled air quality data (US Environmental Protection Agency, 2014c). Monitored and modeled data were used because these can provide air quality estimates for the entire seven-county Twin Cities metro area, including areas that do not have monitoring stations nearby. Although more recent monitoring data are available, modeling relies on emission estimates for which 2008 data are the most recent available.
Using geographic information system techniques, census tract-level data provided by EPA were aggregated to the 165 Twin Cities ZIP codes. Aggregating air quality results to ZIP codes “smooths out” more localized variation (for example, higher pollutant concentrations along major roadways). ZIP codes were chosen as the geographical units of analysis because the health data were only available by ZIP code.
Figure 5 shows 2008 baseline levels of fine particles (PM2.5) by ZIP code, calculated by taking the average of the 365 daily values for each ZIP code, and mapped using natural breaks. Although averaging smooths out daily and seasonal changes in air quality, it was necessary in order to match with health data (which due to small counts can only be shown as an annual average). The highest concentrations of PM2.5 are found in the urban core of the Minneapolis/St. Paul area. This is due in large part to the urban core’s greater traffic density. PM2.5 concentrations are generally lower further outward from the core cities. Also, due to wind patterns, PM2.5 concentrations tend to be slightly higher to the south and east of the core cities than they are in the north and west. PM2.5 concentrations are relatively uniform throughout the metro area, with a range of 9.7 to 11.6 micrograms per cubic meter. These levels are below most similarly sized cities in the US.
13
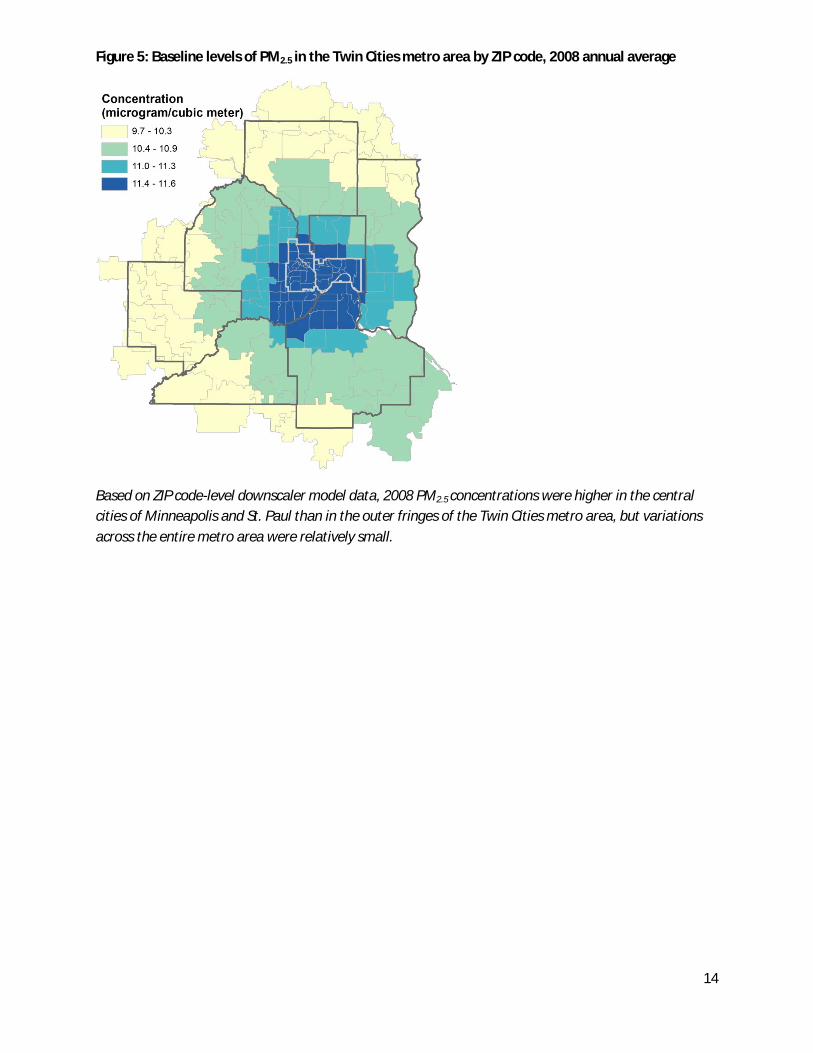
Figure 5: Baseline levels of PM2.5 in the Twin Cities metro area by ZIP code, 2008 annual average
Based on ZIP code-level downscaler model data, 2008 PM2.5 concentrations were higher in the central cities of Minneapolis and St. Paul than in the outer fringes of the Twin Cities metro area, but variations across the entire metro area were relatively small.
14

Figure 6 shows 2008 baseline levels of ozone by ZIP code, calculated by taking the average of the daily values from May 1 to September 30 (warm season, when ozone pollution and its health impacts are higher) for each ZIP code, and mapped using natural breaks. Although averaging smooths out daily changes in air quality, it was necessary in order to match with health data (which due to small counts can only be shown as an annual average). In contrast with PM2.5, the highest ozone concentrations are not in the urban core, but occur in the outlying suburban parts of the metro area. This is due to how ozone forms and travels. Ozone concentrations are relatively uniform throughout the metro area, with a range of 40.3 to 43.9 parts per billion. These levels are below most similarly sized cities in the US.
Figure 6: Baseline levels of ozone (average daily 8-hour maximums) for the Twin Cities metro area by ZIP code, 2008 warm season average (May – September)
Based on ZIP code-level downscaler model data, 2008 ozone concentrations were higher in the outer fringes of the Twin Cities metro area (particularly in the southeast portion of the region) compared to the central cities of Minneapolis and St. Paul, but, as with PM2.5, variations across the entire metro area were relatively small.
Health impact analyses in this report were calculated by comparing baseline air quality data to two comparison air quality scenarios:
1) Baseline, excluding natural background levels. Natural background levels are estimates, based on air pollution models, of the PM2.5 and ozone concentrations that would exist without sources of air pollution from human activity. These levels cannot be affected by emission-control efforts. This scenario is used to estimate the overall health burden from exposure to human-generated fine particles. o The natural PM2.5 background level for the Twin Cities metro area is 0.84 micrograms per cubic
meter (US Environmental Protection Agency, 2012), which is on average 7.7 percent of the 2008 baseline average PM2.5 concentrations in the metro area.
15

o The natural ozone background level for the Twin Cities metro area is 27.7 parts per billion (Fann, Lamson, Anenberg, Wesson, Risley, & Hubbell, 2012), which is on average 66 percent of the 2008 baseline average ozone concentrations in the metro area, and a smaller proportion of the concentration on days with poor air quality.
2) 10 percent reduction from baseline. A 10 percent reduction in air pollution, relative to 2008 levels, corresponds to air quality improvement targets recommended by Clean Air Minnesota (Environmental Initiative, 2013). This scenario is used to estimate the health benefits that would result if PM2.5 and ozone concentrations were 10 percent lower throughout the Twin Cities metro area, relative to 2008 baseline concentrations.
Health and death data Baseline health and death data are 2006-2010 annual average counts of each outcome for each of the 165 ZIP codes included in this study. The period2006-2010 was selected so that air quality data from 2008 would lie at the midpoint of the period. Health and death data were averaged over a five-year time period due to small counts that can occur at small geographic levels. Annual average health and death counts were summarized by full year (for PM2.5 impacts) or by warm season May-September (for ozone impacts).
Outcomes included are asthma emergency department visits and hospitalizations, other respiratory and cardiovascular disease hospitalizations, and deaths. Hospitalization and emergency department visit data are from hospital discharge data that MDH obtains from the Minnesota Hospital Association. Hospital discharge data includes billing information from all Minnesota hospitals reporting hospital discharge data to the Minnesota Hospital Association. It does not include data from federal and sovereign hospitals, such as Veterans Administration and Indian Health Service facilities. MDH receives hospital discharge data that are de-identified and only contain billing ZIP code, date of birth, and gender. Death data are from death certificates from the Minnesota Department of Health’s Center for Health Statistics. Billing ZIP code (health outcomes) or residential ZIP code (death data) were used to select cases from any of the 165 ZIP codes that lie entirely or partly within the seven-county Twin Cities Metro Area.
Hospitalization and emergency department records were selected based on primary diagnosis as follows: total respiratory hospitalizations (International Classification of Diseases, Ninth Revision, Clinical Modification [ICD-9-CM] codes 460-519; only cases admitted to the hospital from the emergency department), chronic obstructive pulmonary disease (COPD) hospitalizations (ICD-9-CM codes 490-496), asthma hospitalizations (children: ICD-9-CM code 493, all ages: ICD-9-CM codes 493, 786.07; only cases admitted to the hospital from the emergency department), asthma or wheeze ED visits (ICD-9-CM codes 493, 786.07; cases treated and released from ED plus cases seen in ED and admitted to the hospital), and total cardiovascular hospitalizations (ICD-9-CM codes 426-427, 428, 430-438, 410-414, 429, 440-448; cases admitted to the hospital from the emergency department plus cases transferred from an emergency department to another hospital). Death certificates were selected based on all-cause death (International Classification of Diseases, Tenth Revision [ICD-10] all codes) and cardiopulmonary death (ICD-10 codes I00-I79, J10-J18, J40-J47, J69). Table 1 defines all health effects that were evaluated. For each health effect, age and either diagnostic codes or underlying cause of death codes were matched to case definitions from the epidemiology studies used as the source of the effect estimates.
To protect patient privacy, hospitals and emergency departments which reported under 6 visits over the 5-year period were not included in the analysis. For outcomes where a sizable number of ZIP codes could not be reported due to small numbers, the Geographic Aggregation Tool (New York State Department of Health, 2009) was used to join neighboring geographic areas together until counts of 6 or more over the 5-year period were reached to avoid health data suppression.
16
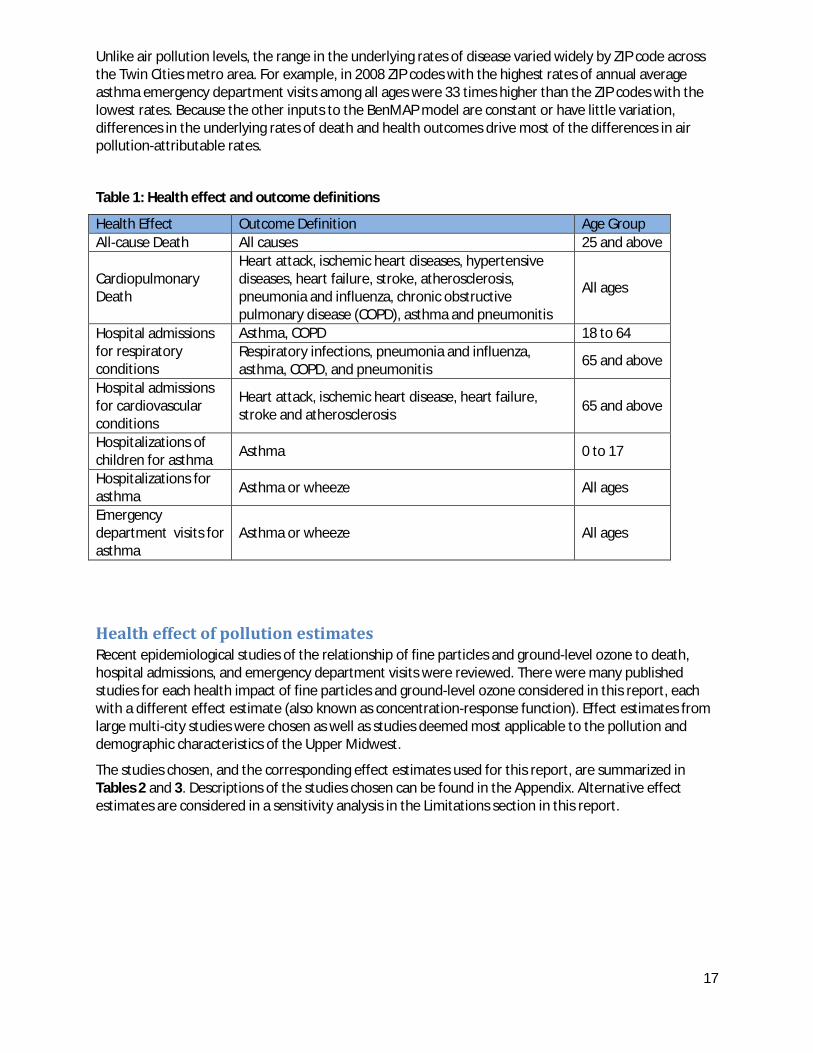
Unlike air pollution levels, the range in the underlying rates of disease varied widely by ZIP code across the Twin Cities metro area. For example, in 2008 ZIP codes with the highest rates of annual average asthma emergency department visits among all ages were 33 times higher than the ZIP codes with the lowest rates. Because the other inputs to the BenMAP model are constant or have little variation, differences in the underlying rates of death and health outcomes drive most of the differences in air pollution-attributable rates.
Table 1: Health effect and outcome definitions
Health Effect Outcome Definition Age Group All-cause Death All causes 25 and above
Cardiopulmonary Death
Heart attack, ischemic heart diseases, hypertensive diseases, heart failure, stroke, atherosclerosis, pneumonia and influenza, chronic obstructive pulmonary disease (COPD), asthma and pneumonitis
All ages
Hospital admissions for respiratory conditions
Asthma, COPD 18 to 64 Respiratory infections, pneumonia and influenza, asthma, COPD, and pneumonitis 65 and above
Hospital admissions for cardiovascular conditions
Heart attack, ischemic heart disease, heart failure, stroke and atherosclerosis 65 and above
Hospitalizations of children for asthma Asthma 0 to 17
Hospitalizations for asthma Asthma or wheeze All ages
Emergency department visits for asthma
Asthma or wheeze All ages
Health effect of pollution estimates Recent epidemiological studies of the relationship of fine particles and ground-level ozone to death, hospital admissions, and emergency department visits were reviewed. There were many published studies for each health impact of fine particles and ground-level ozone considered in this report, each with a different effect estimate (also known as concentration-response function). Effect estimates from large multi-city studies were chosen as well as studies deemed most applicable to the pollution and demographic characteristics of the Upper Midwest.
The studies chosen, and the corresponding effect estimates used for this report, are summarized in Tables 2 and 3. Descriptions of the studies chosen can be found in the Appendix. Alternative effect estimates are considered in a sensitivity analysis in the Limitations section in this report.
17
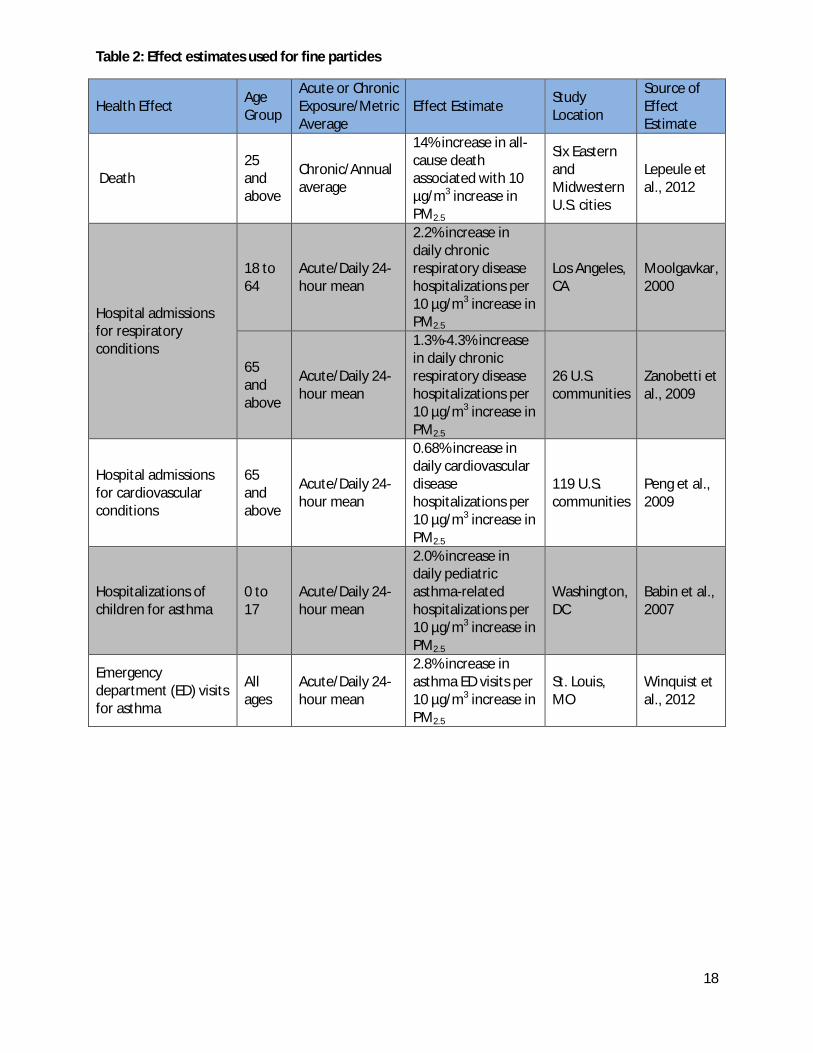
Table 2: Effect estimates used for fine particles
Health Effect Age Group
Acute or Chronic Exposure/Metric Average
Effect Estimate Study Location
Source of Effect Estimate
Death 25 and above
Chronic/Annual average
14% increase in all-cause death associated with 10 µg/m3 increase in PM2.5
Six Eastern and Midwestern U.S. cities
Lepeule et al., 2012
Hospital admissions for respiratory conditions
18 to 64
Acute/Daily 24-hour mean
2.2% increase in daily chronic respiratory disease hospitalizations per 10 µg/m3 increase in PM2.5
Los Angeles, CA
Moolgavkar, 2000
65 and above
Acute/Daily 24-hour mean
1.3%-4.3% increase in daily chronic respiratory disease hospitalizations per 10 µg/m3 increase in PM2.5
26 U.S. communities
Zanobetti et al., 2009
Hospital admissions for cardiovascular conditions
65 and above
Acute/Daily 24-hour mean
0.68% increase in daily cardiovascular disease hospitalizations per 10 µg/m3 increase in PM2.5
119 U.S. communities
Peng et al., 2009
Hospitalizations of children for asthma
0 to 17
Acute/Daily 24-hour mean
2.0% increase in daily pediatric asthma-related hospitalizations per 10 µg/m3 increase in PM2.5
Washington, DC
Babin et al., 2007
Emergency department (ED) visits for asthma
All ages
Acute/Daily 24-hour mean
2.8% increase in asthma ED visits per 10 µg/m3 increase in PM2.5
St. Louis, MO
Winquist et al., 2012
18

Table 3: Effect estimates used for ozone
Health Effect Age Group
Acute Exposure/Metric Average
Effect Estimate Study Location
Source of Effect Estimate
Death All ages
Acute, 24-hour daily mean
1.3% increase in cardiovascular and respiratory death per 10 ppb increase in ozone over the previous week
19 U.S. cities
Huang et al., 2005
Hospital admissions for asthma
All ages
Acute, daily 8-hour maximum
3.7% increase in asthma hospitalizations per 10 ppb increase in ozone
St. Louis, MO
Winquist et al., 2012
Emergency department visits for asthma
All ages
Acute, daily 8-hour maximum
2.4% increase in asthma ED visits per 10 ppb increase in ozone
St. Louis, MO
Winquist et al., 2012
Population data Baseline health and death rates by geography and age group were calculated using five-year population estimates by ZIP Code Tabulation Area from the American Community Survey (ACS). Population estimates were from 2007-2011, the first time period ACS began providing data by ZIP code. Population estimates are period estimates and are interpreted as the average values over the five-year period.
ACS data were used to assign percent of population in poverty and percent residents of color for each Twin Cities metro area ZIP code. Poverty percentages assigned to ZIP codes were 0-19 percent, 20-39 percent, and 40 percent or more residents in a ZIP code with incomes less than or equal to 185 percent of the federal poverty line1. Percentages of residents of color assigned to ZIP codes were 0-24 percent, 25-49 percent, and 50 percent or more residents in a ZIP code that do not identify as White non-Hispanic. Poverty and populations of color definitions were based on those used by the Metropolitan Council’s Choice, Place and Opportunity: An Equity Assessment of the Twin Cities to create Racially Concentrated Areas of Poverty, defined as areas where more than 50 percent of the residents are people of color and more than 40 percent of the residents have incomes less than or equal to 185 percent of the federal poverty line (Metropolitan Council, 2014).
Population-weighted average exposure levels were calculated for ZIP code-level populations of poverty and populations of color. The methodology used for this analysis can be found in a recent study on national patterns of exposure to air pollution for different racial groups (Clark, Millet, & Marshall, 2014).
1 The federal poverty threshold varies by family size. In 2015 the federal poverty guideline for a family of four is a household income of $24,250; 185 percent of poverty was about $44,863. (http://aspe.hhs.gov/poverty/15poverty.cfm). Many federal assistance programs, such as the Free and Reduced Price Lunch program and the Women, Infants and Children program, consider residents with family incomes less than 185 percent of the federal poverty threshold eligible for financial assistance.
19

Figure 7 shows the poverty classifications of all 165 ZIP codes in the Twin Cities metro area in 2008. Each ZIP code was categorized based on the percentage of its residents in poverty: less than 20% in poverty, 20% to 39% in poverty, and 40% or more in poverty.
Figure 7: Percent of residents in poverty by ZIP code
20

Figure 8 shows the percent of residents of color for all 165 ZIP codes in the Twin Cities metro area in 2008. Each ZIP code was categorized based on the percentage of residents of color: less than 25% residents of color, 25% to 49% residents of color, and 50% or more residents of color.
Figure 8: Percent of residents of color by ZIP code
The following analyses were conducted to estimate the annual health impacts of each pollutant-health endpoint combination in the Twin Cities metro area:
1. Metro-wide analysis: The total Twin Cities metro-area health impact from baseline pollution levels (2008 levels minus the natural background levels) and the total Twin Cities metro-area benefit of a 10 percent reduction from baseline levels of pollution. All maps were classified using four natural breaks.
2. Geographic analysis: Mapped rates (natural break classification) of baseline air pollution-attributable health events for all 165 Twin Cities metro-area ZIP codes.
3. Demographic exposure levels: Population-weighted average exposure levels for ZIP code-level populations of poverty and populations of color.
4. Demographic analysis: Rates of baseline air pollution-attributable health events for different age groups, and ZIP code-level populations of poverty and populations of color and American Indians.
21

Results
1. Metro-wide pollution-attributable health impacts Each year in the Twin Cities, fine particle pollution (2008 baseline minus natural background) is estimated to cause more than 2,100 deaths, more than 200 respiratory hospitalizations, 91 cardiovascular hospitalizations, and about 400 emergency department (ED) visits for asthma (Table 4). The biggest estimated impact from PM2.5 pollution is death, of which over 12 percent is attributable to PM2.5 pollution. About 2-3 percent of all respiratory hospitalizations and emergency visits are due to PM2.5 pollution, while less than one percent of cardiovascular hospitalizations are due to PM2.5 pollution. A 10 percent reduction in PM2.5 concentrations from 2008 baseline levels could prevent more than 200 deaths, more than 30 hospital admissions, and more than 40 ED visits every year.
Table 4. Twin Cities metro-area annual health impacts attributable to PM2.5 air pollution in 2008 and estimated avoided health impacts from air quality improvements
Annual estimated Health Impacts Attributable to PM2.5*
Annual estimated Health Impacts
Avoided from 10% Reduction in
PM2.5**
Health Effect Age Group
Number (95% confidence interval***)
Percent of Total Events
Attributable rate per
100,000 people Number
Mortality
All-cause 25 and older
2,152 (1,108 – 3,123)
12.6% (6.5% - 18.3%)
110.5 (56.9 – 160.4)
247 (123 – 369)
Respiratory Effects
Asthma hospitalizations
Under 18
17 (0 – 86)
2.1% (0% - 10.6%)
2.3 (0 – 11.5)
2 (0 -10)
Asthma and COPD hospitalizations
18 to 64
47 (16 – 77)
2.3% (0.8% - 3.8%)
2.4 (0.8 – 3.9)
5 (2 – 8)
All respiratory hospitalizations
65 and older
166 (96 – 235)
2.1% (1.2% - 3.0%)
53.0 (30.7 – 75.0)
18 (10 – 26)
Asthma emergency department visits All ages 402
(112 – 684) 2.9%
(0.8% - 4.9%) 13.6
(3.8 – 23.2) 44
(12 – 76)
Cardiovascular Effects
Cardiovascular hospitalizations
65 and older
91 (35 – 146)
0.7% (0.3% - 1.1%)
28.9 (11.0 – 46.6)
10 (4 – 16)
* 2008 annual average PM2.5 levels minus natural background levels **From 2008 annual average PM2.5 levels ***95% confidence intervals reflect the range within which one can be 95% confident that the true value lies
22

Each year in the Twin Cities, baseline ground-level ozone pollution (2008 May-September levels minus natural background) is estimated to cause about 20 deaths, 47 hospitalizations for asthma, and 185 ED visits for asthma (Table 5). Ozone pollution has a large impact on asthma, causing an estimated five percent of all asthma hospitalizations and three percent of all asthma ED visits. Ozone pollution causes about one percent of all deaths due to cardiopulmonary causes. A 10 percent reduction in ozone concentrations could prevent an estimated seven deaths, 14 hospital admissions, and 57 ED visits.
Table 5. Twin Cities metro-area annual health impacts attributable to ozone air pollution in 2008 and estimated avoided health impacts from air quality improvements
Annual Health Impacts Attributable to
Ozone*
Annual Health Impacts Avoided
from 10% Reduction in Ozone**
Health Effect Age Group
Number (95%
confidence interval***)
Percent of Total Events
Attributable rate per 100,000 people
Number
Death
Cardiopulmonary causes
All Ages
23 (9 – 38)
1.1% (0.4% - 1.8%)
0.8 (0.3 – 1.3)
7 (3– 12)
Respiratory Effects
Asthma hospitalizations
All Ages
47 (29 – 64)
4.9% (3.0% - 6.7%)
1.6 (1.0 – 2.2)
14 (9 – 20)
Asthma emergency department visits All ages 185
(0 – 402) 3.2%
(0% - 7.0%) 6.3
(0 – 13.7) 57
(0 – 126)
* 2008 May-September annual average ozone levels minus natural background levels **From 2008 May-September annual average ozone levels ***95% confidence intervals reflect the range within which one can be 95% confident that the true value lies
23

2. Geographic analysis of Twin Cities metro-area pollution-attributable health impacts
Fine particles (PM2.5)
All-cause death An estimated 110 deaths from all causes per 100,000 people ages 25 years of age and older are attributable to PM2.5 (2008 baseline minus natural background levels) in the Twin Cities metro area every year (Table 4). The PM2.5-attributable death rate varies considerably across ZIP codes, with a range of 26 to over 630 per 100,000 people (Figure 9, left), with higher rates in and around Minneapolis and St. Paul. PM2.5-attributable death rates follow the same geographic pattern as the underlying death rate (Figure 9, right).
24

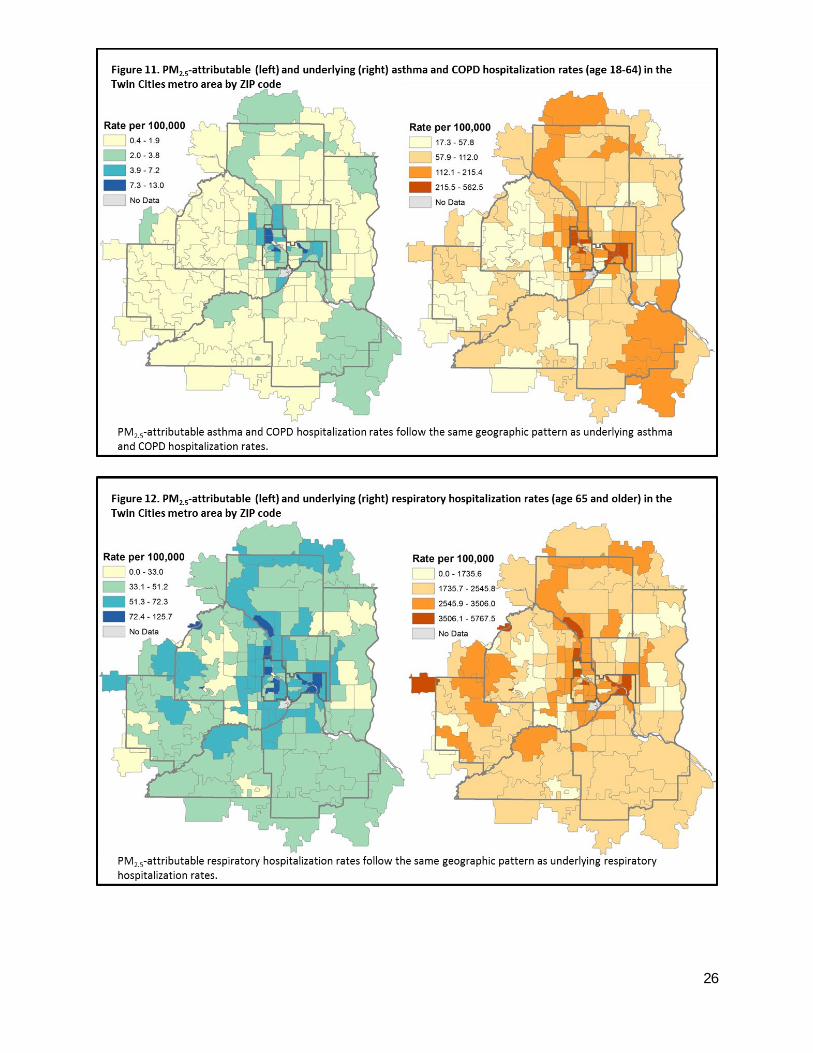
Asthma hospitalizations for children An estimated 2.3 asthma hospitalizations per 100,000 children under age 18 are attributable to PM2.5 (2008 baseline minus natural background levels) in the Twin Cities metro area every year (Table 4). Rates of PM2.5-attributable asthma hospitalizations for children range across ZIP codes from 0.5 to 27.5 per 100,000 individuals (Figure 10, left). The two ZIP codes with the highest attributable rates are in downtown Minneapolis and downtown St. Paul. Many of the highest attributable rates are in Minneapolis. PM2.5-attributable asthma hospitalization rates among children follow the same geographic pattern as the underlying rate of childhood asthma hospitalizations (Figure 10, right).
Respiratory hospitalizations An estimated 2.4 asthma and COPD hospitalizations per 100,000 adults age 18 to 64 are attributable to PM2.5 (2008 baseline minus natural background levels) in the Twin Cities metro area every year (Table 4). Adults 65 and older are far more vulnerable to PM2.5-attributable respiratory hospitalizations, with rates more than 20 times higher than for the younger adult population. An estimated 53 hospitalizations due to respiratory conditions per 100,000 adults ages 65 and older are attributed to PM2.5 (2008 baseline minus natural background levels) in the Twin Cities metro area every year. The ZIP codes with the highest attributable rates for both age groups are in Minneapolis and St. Paul (Figures 11, left and 12, left). Respiratory hospitalizations for adults 65 and older are more widely distributed throughout the metro area. PM2.5-attributable respiratory hospitalization rates among adults 18-64 follow the same geographic pattern as the underlying rate of respiratory hospitalizations in this age group (Figure 11). Underlying respiratory hospitalization rates among adults 65 and older are higher in the western and northern parts of the metro area compared to the PM2.5-attributable rate of respiratory hospitalization, although many of the highest underlying rates are still in Minneapolis and St. Paul (Figure 12).
25
26

Cardiovascular hospitalizations An estimated 28.9 cardiovascular hospitalizations per 100,000 adults age 65 and older are attributable to PM2.5 (2008 baseline minus natural background levels) in the Twin Cities metro area every year (Table 4). Across metro-area ZIP codes, the attributable rate of cardiovascular hospitalizations among adults 65 and older ranges from about nine to 53 hospitalizations per 100,000 individuals (Figure 13, left). The highest attributable rates are in St. Paul, Minneapolis, suburbs of Minneapolis, and western Carver County.

Asthma emergency department visits An estimated 13.6 asthma emergency department visits per 100,000 people (all ages) are attributable to PM2.5 (2008 baseline minus natural background levels) in the Twin Cities metro area every year (Table 4). Attributable rates vary by ZIP code from two to 85 per 100,000 individuals, with the highest rates in Minneapolis and St. Paul (Figure 14, left). PM2.5-attributable asthma emergency department rates follow the same geographic pattern as the underlying rate of asthma emergency department visits (Figure 14, right).
28

Ozone
Cardiopulmonary disease (CPD) death An estimated 0.8 cardiovascular deaths per 100,000 people (all ages) are attributable to ozone (May-September 2008 baseline minus natural background levels) in the Twin Cities metro area every year (Table 5). Ozone-attributable death rates range by ZIP code from 0.1 to seven per 100,000 individuals (Figure 15, left). Unlike the general pattern seen with PM2.5-attributable health impact rates, the areas with the highest burden are generally not in the central cities (see page 12). High ozone-attributable death rates are found around the borders of Minneapolis and St. Paul as well as the westernmost ZIP codes of Scott and Carver Counties. Ozone-attributable death rates follow the same geographic pattern as the underlying death rate by ZIP code (Figure 15, right).
29
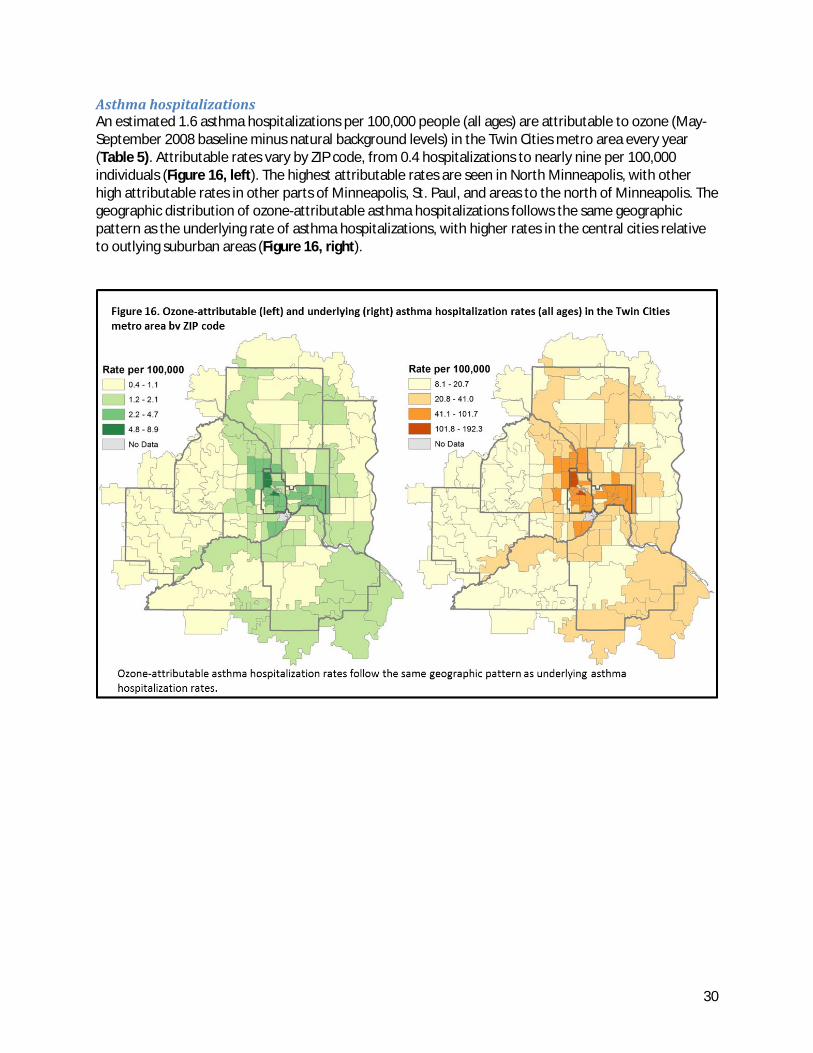
Asthma hospitalizations An estimated 1.6 asthma hospitalizations per 100,000 people (all ages) are attributable to ozone (May-September 2008 baseline minus natural background levels) in the Twin Cities metro area every year (Table 5). Attributable rates vary by ZIP code, from 0.4 hospitalizations to nearly nine per 100,000 individuals (Figure 16, left). The highest attributable rates are seen in North Minneapolis, with other high attributable rates in other parts of Minneapolis, St. Paul, and areas to the north of Minneapolis. The geographic distribution of ozone-attributable asthma hospitalizations follows the same geographic pattern as the underlying rate of asthma hospitalizations, with higher rates in the central cities relative to outlying suburban areas (Figure 16, right).
30

Asthma emergency department visits An estimated 6.3 asthma ED visits per 100,000 people (all ages) are attributable to ozone (May-September 2008 baseline minus natural background levels) in the Twin Cities metro area every year (Table 5). Attributable rates vary by ZIP code, from 1.4 to nearly 40 ED visits per 100,000 individuals (Figure 17, left). The geographic pattern for ozone-attributable asthma ED visits is similar to the pattern for ozone-attributable asthma hospitalizations, with the highest rates found in the central cities. Ozone-attributable asthma ED rates follow the same geographic pattern as the underlying rate of asthma ED visits (Figure 17, right).
31

3. Air pollution exposure among population subgroups Population-weighted annual average exposure levels were calculated for ZIP code-level populations of poverty and populations of color (Table 6). ZIP codes with higher percentages of the population in poverty or higher percentages of residents of color have slightly higher average levels of PM2.5 pollution. For ozone pollution the pattern is reversed: ZIP codes with higher percentages of the population in poverty or higher percentages of residents of color have lower average levels of ozone pollution. The differences in average pollutant concentrations among categories are small, and reflect the relatively low variation in air quality concentrations across the Twin Cities metro area (Figures 5 and 6).
Table 6: Population-weighted average air quality concentrations by poverty and racial concentrations
Group of ZIP codes Average PM2.5 concentration (micrograms per cubic meter)
Average ozone concentration (parts per billion)
All ZIP codes 11.1 41.5 ZIP codes with:
0-19 percent residents in poverty 10.9 41.8
20-39 percent 11.3 41.1 40 percent or more 11.5 40.8
ZIP codes with:
0-24 percent residents of color 11.0 41.7 25-49 percent 11.3 41.2 50 percent or more 11.4 40.8
32

4. Demographic analysis of Twin Cities metro-area pollution-attributable health impacts
Age All outcomes by age follow the same patterns as the underlying rates for all causes (Table 7). With the exception of PM2.5-attributable respiratory hospitalizations, which use different effect estimates by age, there are no differences in the fraction of disease attributable to air pollution by age. For each outcome, PM2.5 pollution has a much bigger impact than ozone pollution.
PM2.5-attributable death rates (Figure 18) and PM2.5-attributable respiratory hospitalization rates (Figure 19) are higher among the elderly (ages 65 and older), while PM2.5-attributable asthma ED visit rates are higher among children (under age 18; Figure 20). Both the elderly and children experience high ozone-attributable respiratory hospitalization rates (Figure 19). Like PM2.5, ozone-attributable ED visit rates are highest among children (Figure 20).
Table 7. Health impacts in the Twin Cities metro area by age group
Age Group
PM2.5 Ozone
Rate per 100,000 people
Attributable Rate per 100,000 people
Attributable Fraction
Rate per 100,000 people
Attributable Rate per 100,000 people
Attributable Fraction
Death All-cause (ages 25 and older) Cardiopulmonary causes (all ages) 0-17 years 1.0 0.0 1.1% 25-44 or 18-44 years 88.7 11.2 12.6% 4.2 0.0 1.1% 45-64 years 418.0 52.7 12.6% 40.6 0.4 1.1% 65 years and older 4,156.1 524.5 12.6% 555.7 6.2 1.1% Respiratory Hospitalizations
Asthma, Asthma plus COPD, all respiratory Asthma
0-17 years 113.3 2.3 2.1% 53.0 2.6 4.9% 18-44 years 52.1 1.2 2.3% 17.9 0.9 4.9% 45-64 years 189.5 4.3 2.2% 29.8 1.4 4.9% 65 years and older 2,515.7 28.9 1.1% 41.9 2.1 4.9% Asthma Emergency Department Visits 0-17 years 1,697.4 49.1 2.9% 701.3 22.8 3.2% 18-44 years 43.2 1.2 2.9% 17.9 0.6 3.2% 45-64 years 75.8 2.2 2.9% 29.8 1.0 3.2% 65 years and older 120.3 3.5 2.9% 41.9 1.4 3.3%
33
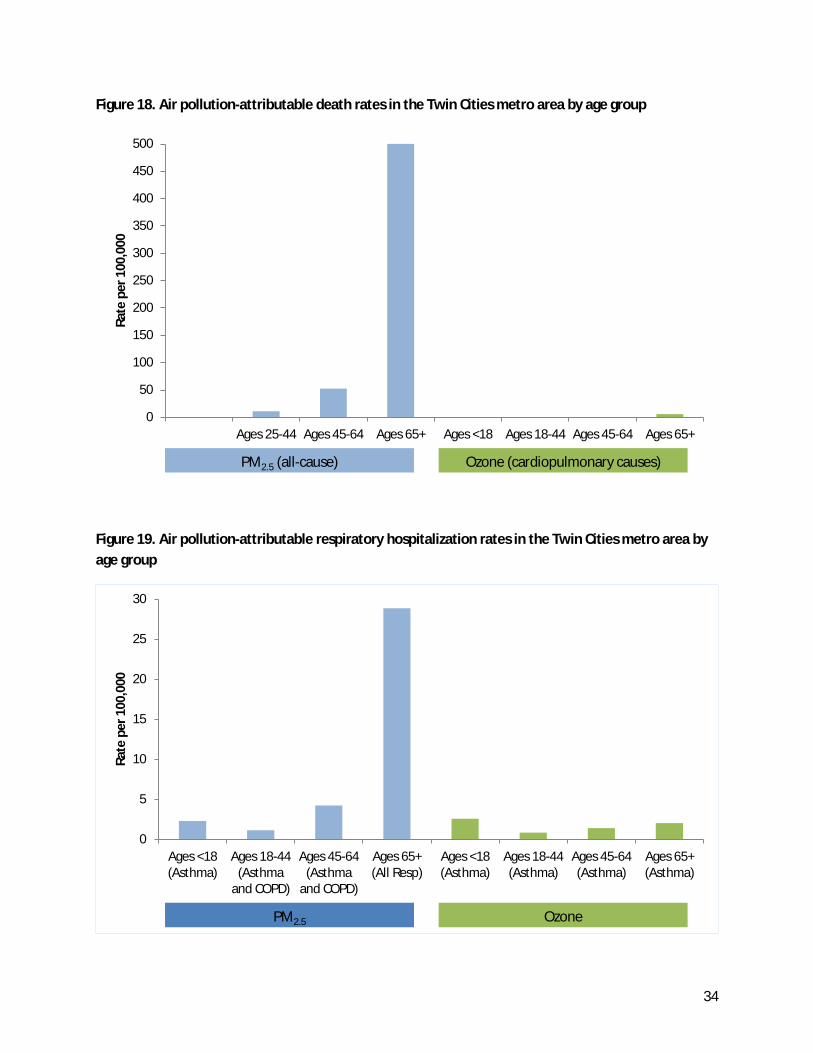
Figure 18. Air pollution-attributable death rates in the Twin Cities metro area by age group
Figure 19. Air pollution-attributable respiratory hospitalization rates in the Twin Cities metro area by age group
0
50
100
150
200
250
300
350
400
450
500
Ages 25-44 Ages 45-64 Ages 65+ Ages <18 Ages 18-44 Ages 45-64 Ages 65+
Rate
per
100
,000
Axis Title PM2.5 (all-cause) Ozone (cardiopulmonary causes)
0
5
10
15
20
25
30
Ages <18(Asthma)
Ages 18-44(Asthma
and COPD)
Ages 45-64(Asthma
and COPD)
Ages 65+(All Resp)
Ages <18(Asthma)
Ages 18-44(Asthma)
Ages 45-64(Asthma)
Ages 65+(Asthma)
Rate
per
100
,000
Axis Title PM2.5 Ozone
34
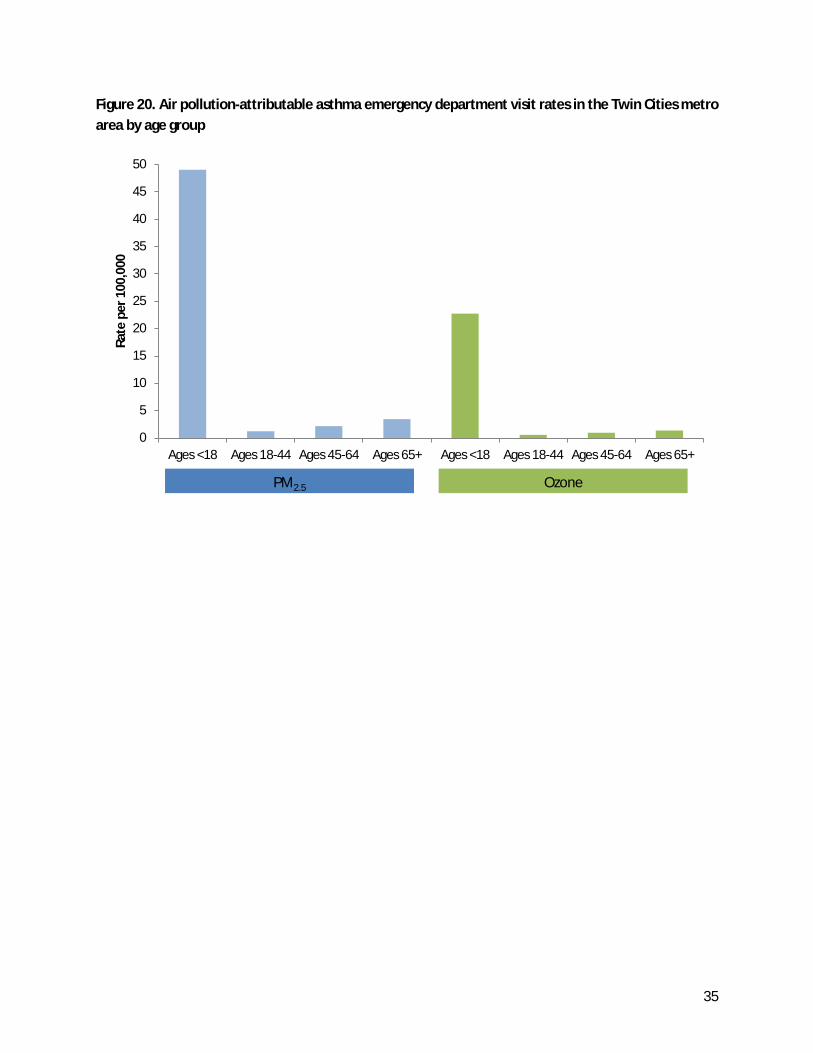
Figure 20. Air pollution-attributable asthma emergency department visit rates in the Twin Cities metro area by age group
0
5
10
15
20
25
30
35
40
45
50
Ages <18 Ages 18-44 Ages 45-64 Ages 65+ Ages <18 Ages 18-44 Ages 45-64 Ages 65+
Rate
per
100
,000
Axis Title PM2.5 Ozone
35

Poverty and Race Air pollution impacts were calculated by ZIP code poverty level and populations of color for all outcomes. Tables 8-11 show results for the four age-specific outcomes with the highest attributable rates: death among the elderly ages 65 and older, asthma emergency department visits among children under age 18, respiratory hospitalizations among the elderly, and cardiovascular hospitalizations among the elderly.
ZIP codes with higher percentages of residents in poverty or more residents of color have both higher underlying and higher air pollution-attributable rates of all outcomes. The fraction of all cases attributable to PM2.5 increase with increasing ZIP code poverty levels and residents of color for death (Table 8), asthma respiratory hospitalizations (Table 9), and asthma emergency department visits (Table 10). In contrast, the fraction of all cases attributable to ozone decreases with increasing ZIP code poverty levels and residents of color for respiratory (asthma) hospitalizations (Table 9) and asthma emergency department visits (Table 10). The fraction of all deaths attributable to ozone (Table 8) and the fraction of all cardiovascular hospitalizations attributable to PM2.5 (Table 11) is the same for all ZIP codes.
Table 8. Air pollution-attributable death (ages 65 and above) in the Twin Cities metro area by ZIP code poverty level and ZIP code populations of color
ZIP Code Group
PM2.5 (all-cause) Ozone (Cardiopulmonary causes)
Rate per 100,000 people
Attributable Rate per 100,000 people
Attributable Fraction
Rate per 100,000 people
Attributable Rate per 100,000 people
Attributable Fraction
Poverty 0-19 percent 3,677.9 455.9 12.4% 481.6 5.5 1.1% 20-39 percent 4,845.7 622.5 12.8% 657.0 7.1 1.1% 40 percent or more 5,074.8 661.3 13.0% 729.5 7.8 1.1% Populations of Color 0-24 percent 3,931.8 491.4 12.5% 521.4 5.8 1.1% 25-49 percent 4,668.8 601.1 12.9% 625.5 6.8 1.1% 50 percent or more 5,034.6 651.7 12.9% 714.8 7.6 1.1% All population (ages 65 and above) 4,156.1 524.5 12.6% 555.7 6.2 1.1%
36
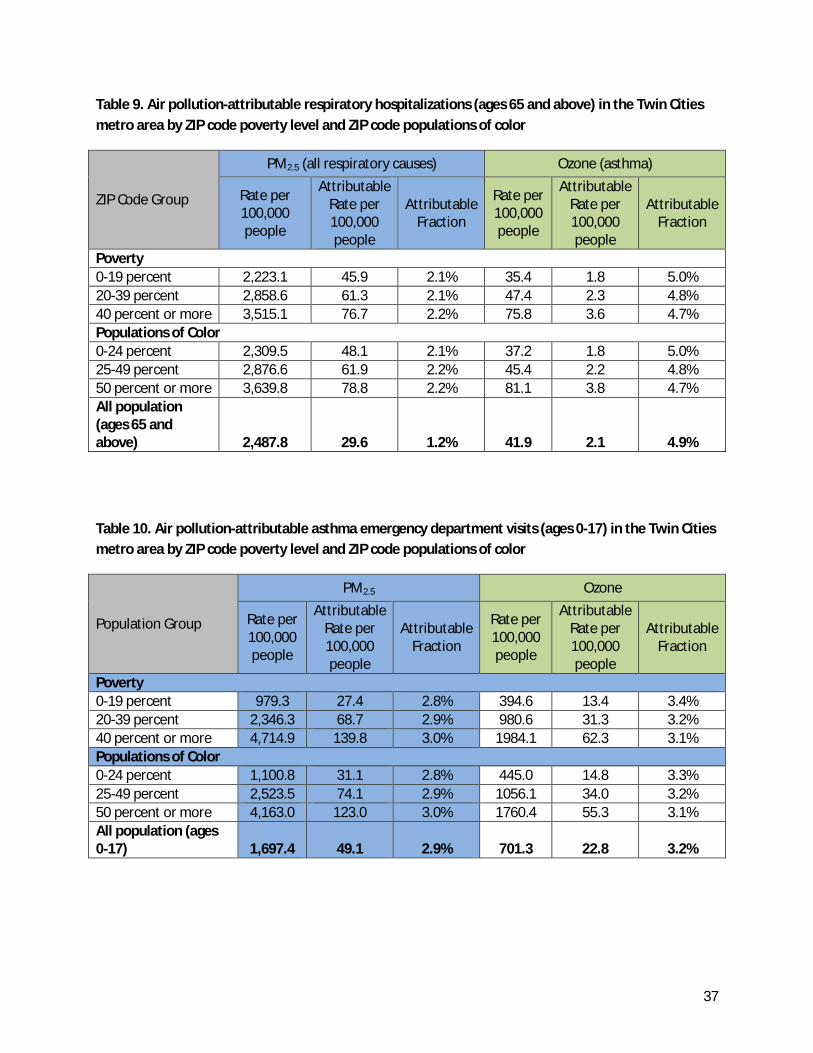
Table 9. Air pollution-attributable respiratory hospitalizations (ages 65 and above) in the Twin Cities metro area by ZIP code poverty level and ZIP code populations of color
ZIP Code Group
PM2.5 (all respiratory causes) Ozone (asthma)
Rate per 100,000 people
Attributable Rate per 100,000 people
Attributable Fraction
Rate per 100,000 people
Attributable Rate per 100,000 people
Attributable Fraction
Poverty 0-19 percent 2,223.1 45.9 2.1% 35.4 1.8 5.0% 20-39 percent 2,858.6 61.3 2.1% 47.4 2.3 4.8% 40 percent or more 3,515.1 76.7 2.2% 75.8 3.6 4.7% Populations of Color 0-24 percent 2,309.5 48.1 2.1% 37.2 1.8 5.0% 25-49 percent 2,876.6 61.9 2.2% 45.4 2.2 4.8% 50 percent or more 3,639.8 78.8 2.2% 81.1 3.8 4.7% All population (ages 65 and above) 2,487.8 29.6 1.2% 41.9 2.1 4.9%
Table 10. Air pollution-attributable asthma emergency department visits (ages 0-17) in the Twin Cities metro area by ZIP code poverty level and ZIP code populations of color
Population Group
PM2.5 Ozone
Rate per 100,000 people
Attributable Rate per 100,000 people
Attributable Fraction
Rate per 100,000 people
Attributable Rate per 100,000 people
Attributable Fraction
Poverty 0-19 percent 979.3 27.4 2.8% 394.6 13.4 3.4% 20-39 percent 2,346.3 68.7 2.9% 980.6 31.3 3.2% 40 percent or more 4,714.9 139.8 3.0% 1984.1 62.3 3.1% Populations of Color 0-24 percent 1,100.8 31.1 2.8% 445.0 14.8 3.3% 25-49 percent 2,523.5 74.1 2.9% 1056.1 34.0 3.2% 50 percent or more 4,163.0 123.0 3.0% 1760.4 55.3 3.1% All population (ages 0-17) 1,697.4 49.1 2.9% 701.3 22.8 3.2%
37

Table 11. Air pollution-attributable cardiovascular hospitalizations (ages 65 and above) in the Twin Cities metro area by poverty and race
Population Group
PM2.5
Rate per 100,000 people
Attributable Rate per 100,000 people
Attributable Fraction
Poverty Low 3,873.9 26.4 0.7% Medium 4,550.1 32.3 0.7% High 4,726.3 34.1 0.7% Populations of Color Low 4,000.1 27.5 0.7% Medium 4,453.6 31.7 0.7% High 4,898.3 35.1 0.7% All population (ages 65 and above) 4,155.3 28.9 0.7%
38

Limitations Each input used to estimate the health impacts of air pollution on the Twin Cities’ population has limitations to consider. Numbers in this report are estimates. The 95 percent confidence intervals in the results reported above mean that one can be 95 percent confident that the true value lies somewhere within the specified range. However, it’s important to note that these confidence intervals only take into account the variability and uncertainty in the health effect estimates. The health effect estimates and the standard error of the estimates are assumed to be constant over all ZIP codes. Other sources of uncertainty—in the air quality data, in population data, and in health and death data—are not factored in. Although all the estimates in this report are derived from the best current scientific understanding of air pollution and health, they should be viewed as approximations and caution should be used when comparing estimates as they are not precise enough to know if differences are real.
Air quality data The 2008 air pollution data used to estimate health impacts are seven years old at the time of writing. There are more recent air monitoring data, but PM2.5 and ozone monitors are not located throughout the Twin Cities metro area at a sufficient density to create an air quality map that covers the entire area. The available monitoring data shows that Twin Cities metro area air quality (particularly PM2.5 pollution) has generally improved since 2008. Downscaler modeled air quality data from 2008 combines air monitoring data and photochemical air dispersion models to estimate pollutant concentrations in areas where no monitors are present. At the time of this study, 2008 was the most recent modeled data available.
This analysis is based on annual average air pollutant concentrations, which have several limitations. Temporal averaging smooths out daily changes in air quality. While average pollutant concentrations are used in health studies, they do not provide a good spatial representation of the highest daily concentrations. For example, the peak daily (8-hr maximum) ozone concentrations tend to occur north of the Twin Cities urban core, but taking the seasonal average of ozone concentrations shows higher concentrations south of the Twin Cities urban core. Examining the spatial distribution of peak pollution levels and their health impacts may be material for further studies.
Even though a credible source of air quality data was selected for this study, there is inherent uncertainty in any model. This report assumes single values for PM2.5 and ozone for each Twin Cities metro area ZIP code for the year; any temporal or spatial variability in air quality within a ZIP code is not accounted for. This report does not take into account that most people do not spend all their time in the ZIP codes in which they live. This report does not include indoor air pollution, which may also contribute to poor health.
Average air quality conditions in a particular zip code may not be an accurate measure of an individual’s actual exposure to air pollution. In reality, a person’s exposure is the integration of time spent in multiple locations—indoors and outdoors—as the person moves through daily life. Within a ZIP code population, some individuals live and spend time in high exposure areas such as near busy roadways.
In this report, the burden of air pollution is defined as the difference between 2008 levels and theoretical natural background levels, or the concentrations of PM2.5 and ozone that are believed to exist in the absence of human activity. By subtracting natural background levels, this analysis underestimates the total health impacts of air pollution. The rationale for using human-generated causes of air pollution is to assess the health impacts of air pollution that are theoretically under our control and can be impacted by policy.
39
The results in this report were all derived from single pollutant models. However, numerous studies have shown that PM2.5 and ozone are not only harmful in themselves, but that they coexist with other harmful pollutants that are influenced by the same sources and weather patterns. Multi-pollutant models distinguish the health effects of one pollutant while controlling for co-pollutants that tend to vary with the pollutant under study. These studies are less useful, however, in estimating the benefits of reducing pollution because measures to reduce PM2.5 emissions will often reduce emissions of other harmful pollutants. Therefore, studies on concentrations of individual air pollutants and the risk of health effects that do not control for other pollutants (single pollutant models) are more appropriate for estimating the impact of increasing or decreasing PM2.5 concentrations and other pollutants that tend to vary with PM2.5.
Health and death data Data included in this report were limited to data available by ZIP code: death, hospitalizations, and emergency department visits. These health outcomes are direct and measureable. Other important outcomes such as lost work days, school absences, or respiratory symptoms not requiring an emergency department visit or hospitalization are not included in this report because data are not available. This report does not address whether exposure to air pollution can cause new cases of chronic lung and heart diseases. The report may be underestimating the health impact of air pollution by limiting the outcomes to only certain endpoints.
The hospital discharge data used in this study do not include data from federal and sovereign hospitals (e.g., Veterans Administration, Indian Health Service). Hospital discharge data lack information on the patient’s race and ethnicity. Hospital discharge data billing ZIP code or the ZIP code listed on a death record do not necessarily indicate the same location where exposure occurs.
Health effect of pollution estimates This analysis assumes the relationships between pollutant levels and health outcomes remain the same at all absolute levels of pollutant concentration, including below the lowest measurable level. Although this assumption is generally supported by the research on the health impacts of air pollution, a non-linear relationship would lead to higher or lower impacts across the range of pollutant levels.
There were many respected, peer-reviewed studies and valid effect estimates (also known as concentration-response functions) for each health impact of fine particles and ground-level ozone considered in this report. The choice of study and effect estimate can produce different air pollution-attributable health impact estimates. All the studies used in this report were done outside of the Twin Cities metro area. Conducting a local-scale health impact assessment using national-scale data or transferring data from a different location introduces additional uncertainty into the results (Hubbell, Fann, & Levy, 2009). This uncertainty has been minimized (but not eliminated) by careful selection of effect estimates based on cities that are similar to the Twin Cities metro area. The estimates provided in this report provide a general sense of the magnitude of the health impact and should not be interpreted as exact numbers. Health impact estimates reported here can be used as a baseline from which to track progress in reducing the health impacts of air pollution in the Twin Cities metro area.
A sensitivity analysis was conducted to evaluate the air-quality related health impacts that result when an alternative effect estimate is chosen for PM2.5 pollution and death. There are two respected long-term cohort studies that examined the death impacts of fine particle pollution: the Harvard 6-Cities (or “H6C”) study (LePeule, Laden, Dockery, & Schwartz, 2012) and the American Cancer Society (or “ACS”) study (Krewski, et al., 2009). This report used effect estimates from the H6C study because it was both the study using the most recent data and the study that followed a racially- and economically-diverse
40
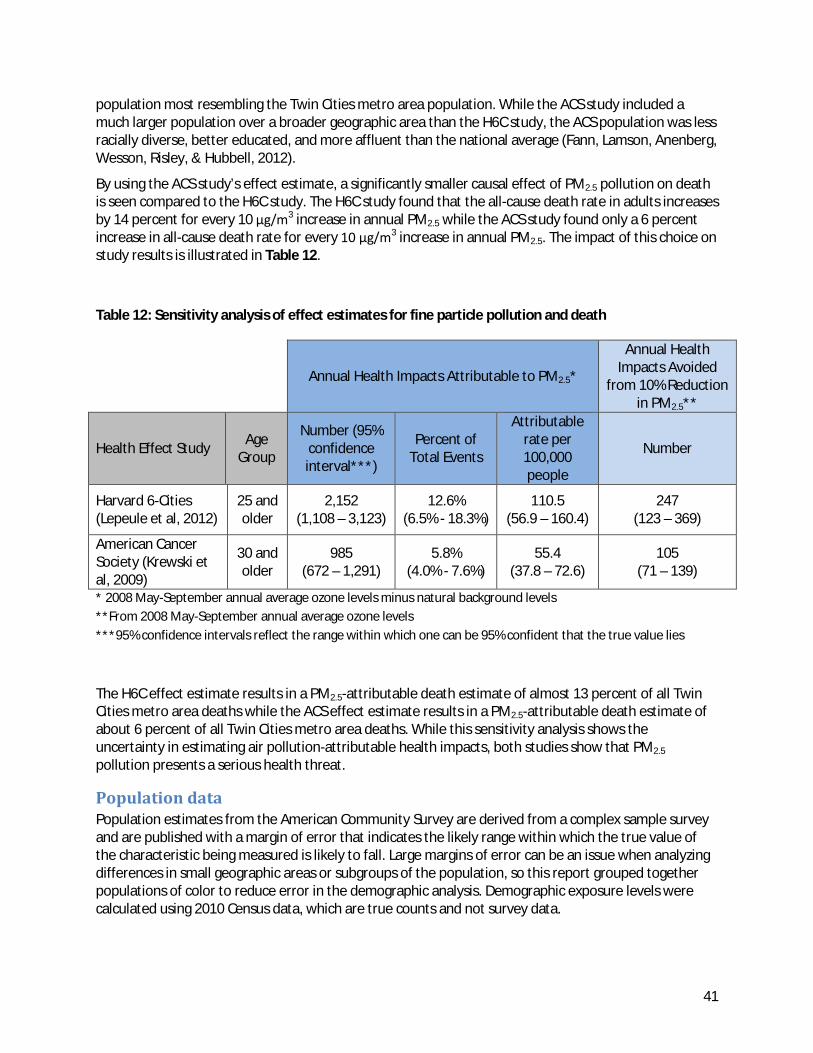
population most resembling the Twin Cities metro area population. While the ACS study included a much larger population over a broader geographic area than the H6C study, the ACS population was less racially diverse, better educated, and more affluent than the national average (Fann, Lamson, Anenberg, Wesson, Risley, & Hubbell, 2012).
By using the ACS study’s effect estimate, a significantly smaller causal effect of PM2.5 pollution on death is seen compared to the H6C study. The H6C study found that the all-cause death rate in adults increases by 14 percent for every 10 μg/m3 increase in annual PM2.5 while the ACS study found only a 6 percent increase in all-cause death rate for every 10 μg/m3 increase in annual PM2.5. The impact of this choice on study results is illustrated in Table 12.
Table 12: Sensitivity analysis of effect estimates for fine particle pollution and death
Annual Health Impacts Attributable to PM2.5*
Annual Health Impacts Avoided
from 10% Reduction in PM2.5**
Health Effect Study Age Group
Number (95% confidence interval***)
Percent of Total Events
Attributable rate per 100,000 people
Number
Harvard 6-Cities (Lepeule et al, 2012)
25 and older
2,152 (1,108 – 3,123)
12.6% (6.5% - 18.3%)
110.5 (56.9 – 160.4)
247 (123 – 369)
American Cancer Society (Krewski et al, 2009)
30 and older
985 (672 – 1,291)
5.8% (4.0% - 7.6%)
55.4 (37.8 – 72.6)
105 (71 – 139)
* 2008 May-September annual average ozone levels minus natural background levels **From 2008 May-September annual average ozone levels ***95% confidence intervals reflect the range within which one can be 95% confident that the true value lies
The H6C effect estimate results in a PM2.5-attributable death estimate of almost 13 percent of all Twin Cities metro area deaths while the ACS effect estimate results in a PM2.5-attributable death estimate of about 6 percent of all Twin Cities metro area deaths. While this sensitivity analysis shows the uncertainty in estimating air pollution-attributable health impacts, both studies show that PM2.5 pollution presents a serious health threat.
Population data Population estimates from the American Community Survey are derived from a complex sample survey and are published with a margin of error that indicates the likely range within which the true value of the characteristic being measured is likely to fall. Large margins of error can be an issue when analyzing differences in small geographic areas or subgroups of the population, so this report grouped together populations of color to reduce error in the demographic analysis. Demographic exposure levels were calculated using 2010 Census data, which are true counts and not survey data.
41

Conclusion This report estimates the overall burden of air pollution and its distribution across the metro area and identifies populations vulnerable to the effects of air pollution.
In the Twin Cities metro area, air quality meets federal ambient air standards, with relatively low variation in 2008 annual average pollutant levels by ZIP code. However, scientists are finding health impacts at air pollution concentrations less than the federal ambient air standards. In the Twin Cities metropolitan area in 2008, air pollution caused around 2-5 percent of respiratory and cardiovascular hospitalizations and emergency room visits, and between 6-13 percent of deaths. With nearly three million people living in the Twin Cities metro area, these causal fractions of disease add up to significant numbers of health impacts. In 2008 in the Twin Cities metro area, fine particle pollution caused an estimated 2,152 deaths, 321 hospitalizations for heart and lung conditions, and 402 emergency department visits for asthma. Ground-level ozone pollution in the Twin Cities metro area caused an estimated 23 deaths, 47 hospitalizations for asthma, and 185 emergency department visits for asthma.
The finding that an estimated 13 percent of 2008 Twin Cities metro area deaths were attributable to air pollution is a stark finding, but not inconsistent with other studies that have looked at the health impacts of air pollution in other urban areas of the U.S. For example, studies in Los Angeles, Philadelphia, and Chicago have estimated that approximately 10 percent of all deaths are attributable to air pollution (Fann, Lamson, Anenberg, Wesson, Risley, & Hubbell, 2012). To put these results in perspective, about 5 percent of all deaths in the U.S. can be attributed to accidents (based on 2005 data) and about 3 percent to Alzheimer’s disease (Fann, Lamson, Anenberg, Wesson, Risley, & Hubbell, 2012).
Because pollutant level differences by ZIP code were small, geographic differences in air pollution-attributable health impacts largely reflect differences in the underlying disease rates. Differences in the air pollution-attributable rates of disease and death by age also reflect patterns seen in the underlying rates. Although small exposure differences were found between ZIP codes with different levels of poor and residents of color, the fraction of disease caused by air pollution changed very little by category. Differences in the air pollution-attributable rates of disease and death by poverty and race are largely due to disparities seen in the underlying rates of disease.
Because many of the air pollution-attributable disparities found in this report reflect patterns in the underlying rates of disease and deaths, efforts to address health disparities will also have an impact on air pollution-attributable health impacts. MDH is working to address health disparities and health inequities in Minnesota though the recommendations found in the Advancing Health Equity in Minnesota: Report to the Legislature.
Air pollution affects everyone and improving air quality can have real and measurable health benefits across the Twin Cities. Reducing air pollution levels by 10 percent, a goal of Clean Air Minnesota, is estimated to result in hundreds of fewer deaths, hospitalizations, and emergency department visits. Reducing fine particles (PM2.5) by 10 percent could prevent over 247 deaths and about 79 hospitalizations and emergency visits every year. Reducing ozone by 10 percent could prevent 7 deaths, 14 asthma hospitalizations, and 57 asthma emergency department visits. Clean Air Minnesota has recommended 24 initiatives to reduce emissions associated with fine particles and ozone pollution in Minnesota (Environmental Initiative, 2013). These recommendations encompass initiatives to reduce both area and point sources of air pollution; address energy efficiency and increase renewable energy sources; and address specific sources of air pollution significant in Minnesota, from diesel-powered vehicles to residential wood burning. Efforts are already underway to act on many of the Clean Air Minnesota recommendations.
42

This report is a collaboration between the Minnesota Pollution Control Agency (MPCA) and Minnesota Department of Health (MDH), as part of the Urban Air Quality and Respiratory Health Initiative. Findings will be used to inform communities about air quality issues in the Twin Cities urban area and to understand health and environmental disparities that impact Minnesotans. As more current air quality and health data become available, the MPCA and MDH can use the methods presented in this report to track the public health benefits of reductions in air pollution from 2008 baseline levels.
43
Appendix
Health impact estimation The core of the analysis for this report is health impact estimation, which was presented visually in Figure 4. The inputs into health impact estimation for a particular ZIP code and a particular health impact are the air quality concentration in that ZIP code, the size of the ZIP code’s population, the baseline number of health events in that population, and the effect estimate (or the relationship between exposure to air pollution and the expected health response as determined by epidemiological studies). Based on all these inputs, a health impact equation is used to predict the number of health impacts that are attributable to air pollution in that ZIP code. This was done for each health impact considered (see Table 2 and Table 3) and for each of the 165 ZIP codes in the Twin Cities metro area. The general form of the health impact equation used to estimate health impacts of air pollution is (US Environmental Protection Agency, 2014):
ΔY = Y0(1-e-βΔAQ)*Pop
Where: ΔY = the predicted number of health impacts attributable to the level of air pollution in the ZIP code, a measure of health impact
Y0 = the baseline number of health events in the ZIP code, i.e., the 2006-2010 number of hospitalizations, ED visits or deaths
β = the effect estimate as determined by epidemiological studies
ΔAQ = the air pollutant concentration in the ZIP code (either PM2.5 or ozone), which was calculated as 2008 average concentration minus naturally occurring background
Pop = the size of the population in the ZIP code of the relevant age group (e.g., 65 and older for estimating cardiovascular hospitalizations)
BenMAP was used to estimate 95% confidence intervals for each of its impact (ΔY) estimates at the ZIP code level. The estimate is based on the standard error for the effect estimate (β). These confidence intervals take into account the uncertainty in the effect estimate only, and do not take into account other sources of uncertainty in the impact estimate (e.g. uncertainty in the air pollutant model estimates for the ZIP code, or uncertainties in the age distribution of the population). To estimate 95% confidence intervals around impact estimates for the entire metro area, the lower and upper limits of the confidence intervals for each individual ZIP code were summed (i.e., all the lower bounds of the ZIP code estimates were added together to get the lower bound for the whole metro area, and all the upper bounds of ZIP code estimates were summed to get the upper bound for the metro area). This is possible because the health effect estimate and the standard error do not vary but are constant across all ZIP codes in this analysis.
Fine particle studies There are two long-term cohort studies that have examined the death impacts of fine particles pollution. One study, generally referred to as the “Harvard 6-Cities” or “H6C” study, began following randomly selected adults in six Eastern and Midwestern cities in the mid-1970s (LePeule, Laden, Dockery, & Schwartz, 2012). In each of these cities, annual average PM2.5 concentrations were measured from 1979 through 2009 and assigned to each participant in the study along with deaths amongst the selected
44
participants. The risk of death among the cohort was estimated in relation to the city’s annual average PM2.5 concentrations. All-cause death rates in adults increased by 14% for every 10 micrograms per cubic meter (μg/m3) increase in annual PM2.5. Due to the recent update of this study and the general resemblance to population and air quality characteristics of the Twin Cities metro area, it was chosen to examine the relationship between PM2.5 pollution and death in the Twin Cities metro area.
Other studies have examined the relationship between PM2.5 concentrations and other health outcomes. A study from Los Angeles County of adults 18 to 64 years of age was used to analyze respiratory hospital admissions associated with PM2.5 concentrations (Moolgavkar, 2000). This study estimated the association between PM2.5 and daily hospital admissions for chronic obstructive pulmonary disease and found a 2.2% increase in these admissions for every 10 μg/m3 increase in average daily PM2.5. A larger national study analyzed hospital admissions for all respiratory causes among adults 65 years and older living in 26 U.S. communities (Zanobetti, Franklin, Koutrakis, & Schwartz, 2009). The authors found increases in daily respiratory admissions ranging from 1.3% in the summer to 4.3% in the spring for every 10 μg/m3 increase in average daily PM2.5.
Peng et al. investigated the relationship between hospital admissions for cardiovascular disease and PM2.5 concentrations among 12 million Medicare enrollees aged 65 and older across 119 U.S. Communities from 2000-2006 (Peng, et al., 2009). They found a 0.68% increase in daily admissions for every 10 μg/m3 increase in average daily PM2.5. Babin et al. examined the relationship between pediatric asthma-related hospital admissions and PM2.5 concentrations in Washington, DC from 2001-2004 (Babin, et al., 2007). They found a 2.0% increase in admissions for every 10 μg/m3 increase in average daily PM2.5. Winquist et al. examined the relationship of asthma-related emergency department (ED) visits and PM2.5 concentrations over a 6.5 year period in the St. Louis metro area (Winquist, Klein, Tolbert, Flanders, Hess, & Sarnat, 2012).They found that a 10 μg/m3 increase in average daily PM2.5 is associated with a 2.8% increase in asthma-related ED visits.
Ozone studies Two studies were selected to provide effect estimates for ozone and death, hospital admission for asthma, and emergency department visits for asthma. Both studies provided estimates across all age groups.
One study showed a 1.3% increase in daily cardiovascular and respiratory deaths for every 10 parts per billion increase in daily 24-hour average ozone concentrations over the week before death. (Huang, Dominici, & Bell, 2005) The other study (Winquist et al., described above in Particulate Matter Studies) of all age groups in the St. Louis metro area found a 3.7% increase in asthma-related hospitalizations and a 2.4% increase in asthma-related ED visits for every 10 parts per billion increase in daily 8-hour maximum ozone concentrations (Winquist, Klein, Tolbert, Flanders, Hess, & Sarnat, 2012).
45

Bibliography Babin, S. M., Burkom, H. S., Holtry, R. S., Tabernero, N. R., Stokes, L. D., Davies-Cole, J. O., et al. (2007).
Pediatric patient asthma-related emergency department visits and admissions in Washington, DC, from 2001-2004, and associations with air quality, socio-economic status and age group. Environmental Health.
Batterman, S., Chambliss, S., & Isakov, V. (2014). Spatial resolution requirements for traffic-related air pollutant exposure evaluations. Atmospheric Environment, 518-528.
Clark, L. P., Millet, D. B., & Marshall, J. D. (2014). National patterns in environmental injustice and inequality: outdoor NO2 air pollution in the United States. PLOS One.
Environmental Initiative. (2013). Minnesota’s Clean Air Dialogue: A Collaborative Plan to Reduce Emissions. Retrieved from http://www.environmental-initiative.org/images/files/MnCAD/*MnCADFinalReport24Apr13.pdf
EPA, U. (2009). Integrated Science Assessment for Particulate Matter (Final Report). Washington, DC: U.S. Environmental Protection Agency.
EPA, U. (2013). Integrated Science Assessment for Ozone and Related Photochemical Oxidants. Washington, DC: U.S. Environmental Protection Agency.
Ezzati, M., Vander Hoorn, S., Lopez, A. D., Danaei, G., Rogers, A., Mathers, C. D., et al. (2006). Comparative Quantification of Mortality and Burden of Disease Attributable to Selected Risk Factors. In Global Burden of Disease and Risk Factors (pp. 241-396).
Fann, N., Lamson, A. D., Anenberg, S. C., Wesson, K., Risley, D., & Hubbell, B. J. (2012). Estimating the National Public Health Burden Associated with Exposure to Ambient PM2.5 and Ozone. Risk Analysis, 81-95.
Huang, Y., Dominici, F., & Bell, M. L. (2005). Bayesian hierarchical distributed lag models for summer ozone exposure and cardio-respiratory mortality. Environmetrics, 547-562.
Hubbell, B. J., Fann, N., & Levy, J. I. (2009). Methodological considerations in developing local-scale health impact assessments: balancing national, regional, and local data. Air Qualtiy Atmospheric Health, 99-110.
Krewski, D., Jerrett, M., Burnett, R. T., Ma, R., Hughes, E., Shi, Y., et al. (2009). Extended Follow-up and spatial analysis of the American Cancer Society Study linking particulate air pollution and mortality. Boston: Health Effects Institute.
LePeule, J., Laden, F., Dockery, D., & Schwartz, J. (2012). Chronic exposure to fine particles and mortality: an extended follow-up of the Harvard Six Cities Study from 1974-2009. Environmental Health Perspectives, 965-970.
46

Metropolitan Council. (2014, March). Choice, Place and Opportunity: An equity assessment of the Twin Cities region. Retrieved from http://www.metrocouncil.org/Planning/Projects/Thrive-2040/Choice-Place-and-Opportunity.aspx
Moolgavkar, S. H. (2000). Air pollution and hospital admissions for chronic obstructive pulmonary disease in three metropolitan areas in the United States. Inhalation Toxicology, 75-90.
New York City Department of Health and Mental Hygiene. (2011). Air Pollution and the Health of New Yorkers: The Impact of Fine Particles and Ozone. Retrieved from http://www.nyc.gov/html/doh/downloads/pdf/eode/eode-air-quality-impact.pdf
New York State Department of Health. (2009). Geographic Aggregation Tool, SAS Beta Version 4. Troy.
Peng, R. D., Bell, M. L., Geyh, A. S., McDermott, A., Zeger, S. L., Samet, J. M., et al. (2009). Emergency admissions for cardiovascular and respiratory diseases and the chemical composition of fine particle air pollution. Environmental Health Perspectives, 957-963.
US Environmental Protection Agency. (2012). Integrated Science Assessment for Particulate Matter.
US Environmental Protection Agency. (2014a). EPA Proposes Smog Standards to Safeguard Americans from Air Pollution.
US Environmental Protection Agency. (2014b). Environmental Benefits Mapping and Analysis Program (BenMAP). Retrieved from http://www.epa.gov/air/benmap/
US Environmental Protection Agency. (2014c). Fused Air Quality Surfaces Using Downscaling. Retrieved from http://www.epa.gov/esd/land-sci/lcb/lcb_faqsd.html
Williams, J. (2011). Tge 2010 decennial census: Background and issues. www.census.gov.
Winquist, A., Klein, M., Tolbert, P., Flanders, W., Hess, J., & Sarnat, S. (2012). Comparison of emergency department and hospital admissions data for air pollution time-series studies. Environmental Health.
Zanobetti, A., Franklin, M., Koutrakis, P., & Schwartz, J. (2009). Fine particle air pollution and its components in association with cause-specific emergency admissions. Environmental Health.
47