LICHENS AS BIOINDICATORS OF AIR POLLUTION BY S0 IN … · •The publication of this study has been...
74
STUDIA GEOBOTANICA I!: 3-76, 1901 LICHENS AS BIOINDICATORS OF AIR POLLUTION BY S0 2 IN THE VENETO REGION (NE ITALY)* P.L. NIMIS, A. & G. LAAR, D. GASPARO Keywords: Air pollution, Air quality, Bioindicators, Biomonitoring, Lichens, ltaly, Veneto. Abstract: This paper presents the results of a study on air pollution by S0 2 in the Veneto Region (north eastern ltaly), using the "Calibrated Lkhen lndex of Air Quality" (I.A.P.) proposed by Liebendoerfer et al. (1988). This index, based on the equency of epiphytic lichen species within a sampling grid of 10 units, has been tested by the authors in two preliminary studies carried out in two different areas of northern l taly (the town of La Spezia and the northern part of the province of Vicenza), revealing a high degree of correlation with pollution by S0 2 , measured by automatic recording gauges. The index has been computed for 662 stations scattered throughout the Region of Veneto, whose surface area is of 18.364 km 2 . The average number of relevés in each station is 3.7, with a total number of 2.49 levés. The tree genus selected for mpling is Til. Altogether, 80 lichen species have been recorded during the survey, with a prevalence of nitrophytic and neutro-basiphytic lichens indicating a diffuse condary eutrophication of the bark by agricultural activities. Pollution maps for the seven provinces and for the entire region are presented. The evaluation of pollution levels is based on the correlations between the index and S0 2 levels found in the preliminary studies. All maps have been drawn by programs of automatic mapping. The results show that in 93.7 % of the regional territory there is a very low probability of the occurrence of S0 2 concentrations higher than the thresholds established by law; this part of the region has yearly means of the 98th percentiles lower than T µg/m 3 . 9 % of the region has moderate pollution levels, 23.4 % a low pollution, and 44.9 % a very low air pollution. The most polluted areas are located in the southwestern part of the region. The pollution pattern agrees very well with the location of the main sources of pollution, and with the directions of the prevailing winds. The study presents also the computerized distribution maps of eight selected species (Canderia concolor, Canrl nthostigma, Hypogymn physodes, Parmel esפratula, Parmel sulta, Physcia adscendens, Psc orbicuris, nthor partina), that are discussed in relation with the main pollution patterns. The lichens species can be subdivided into three main groups, according to their distribution patterns. The main • The publication of this study has been finand by a grant of e Consiglio Naonale delle Ricerche to the first author. 3
Transcript of LICHENS AS BIOINDICATORS OF AIR POLLUTION BY S0 IN … · •The publication of this study has been...

STUDIA GEOBOTANICA I!: 3-76, 1901
LICHENS AS BIOINDICATORS OF AIR POLLUTION
BY S02 IN THE VENETO REGION (NE ITALY)*
P.L. NIMIS, A. & G. LAZZARIN, D. GASP ARO
Keywords: Air pollution, Air quality, Bioindicators, Biomonitoring, Lichens, ltaly, Veneto.
Abstract: This paper presents the results of a study on air pollution by S02 in the VenetoRegion (north eastern ltaly), using the "Calibrated Lkhen lndex of Air Quality" (I.A.P.) proposed by Liebendoerfer et al. (1988). This index, based on the frequency of epiphytic lichen species within a sampling grid of 10 units, has been tested by the authors in two preliminary studies carried out in two different areas of northern ltaly (the town of La Spezia and the northern part of the province of Vicenza), revealing a high degree of correlation with pollution by S02, measured by automatic recording gauges. The index has been computed for 662 stations scattered throughout the Region of Veneto, whose surface area is of 18.364 km2. The average number of relevés in each station is 3.7, with a total number of 2.425 relevés. The tree genus selected for sampling is Tilia. Altogether, 80 lichen species have been recorded during the survey, with a prevalence of nitrophytic and neutro-basiphytic lichens indicating a diffuse secondary eutrophication of the bark by agricultural activities.
Pollution maps for the seven provinces and for the entire region are presented. The evaluation of pollution levels is based on the correlations between the index and S02 levels found in the preliminary studies. All maps have been drawn by programs of automatic mapping.
The results show that in 93.7 % of the regional territory there is a very low probability of the occurrence of S02 concentrations higher than the thresholds established by law; this part of the region has yearly means of the 98th percentiles lower than 84 µg/m3. 25 % of the region has moderate pollution levels, 23.4 % a low pollution, and 44.9 % a very low air pollution. The most polluted areas are located in the southwestern part of the region. The pollution pattern agrees very well with the location of the main sources of pollution, and with the directions of the prevailing winds.
The study presents also the computerized distribution maps of eight selected species (Candelaria concolor, Candelariella xanthostigma, Hypogymnia physodes, Parmelia exasperatula, Parmelia sulcata, Physcia adscendens, Physcia orbicularis, Xanthoria parietina), that are discussed in relation with the main pollution patterns. The lichens species can be subdivided into three main groups, according to their distribution patterns. The main
• The publication of this study has been financed by a grant of the Consiglio Nazionale delle
Ricerche to the first author.
3

factors affecting the distribution of lichens in the survey area are air pollution and the eutrophication of bark by agricultural activities.
A monitoring strategy where bioindicators and instrumental recording of air pollution are used jointly is proposed as a good solution to air pollution mapping aver vast areas.
Riassunto breve: LICHENI COME BIOINDICATORI DI INQUINAMENTO ATMOSFERICO NELLA REGIONE DEL VENETO (ITALIA NORD ORIENTALE). -Questo lavoro presenta i risultati di uno studio sull'inquinamento da S02 nella Regione del Veneto, svolto utilizzando l' "Indice lichenico calibrato di qualità dell' Aria" (I.A.P.) proposto da Liebendoerfer et al. (1988). Tale indice, basato sulla somma delle frequenze delle specie licheniche epifite in un reticolo di 10 unità, è stato preliminarmente saggiato in due diverse aree dell' Italia settentrionale (città di La Spezia ed Alto Vicentino), rivelando un'alta grado di predittività rispetto alla contaminazione da anidride solforosa, misurata da apposite centraline. L'indice è stato calcolato per 662 stazioni (per un totale di 2425 rilievi) sparse per un'area di 18.364 km2
. Tutti i rilievi sono stati effettuati su Tiglio in un periodo di un anno, compreso tra il Settembre del 1989 ed il Settembre del 1990. Sono state rinvenute 80 specie di licheni, la maggior parte dei quali cresce di norma su substrati eutrofizzati, a reazione neutro-basica, ed è caratteristica dell'alleanza Xanthorion parietinae. Ciò indica una diffusa eutrofizzazione dei substrati dovuta in primo luogo all'intensa attività agricola.
Vengono presentate carte della contaminazione dell'aria da anidride solforosa per le sette provincie amministrative, e per l'intera Regione del Veneto. La stima dei livelli d'inquinamento si basa sulle correlazioni, ottenute negli studi preliminari, tra i valori di I.A.P. e le effettive concentrazioni di S02 in atmosfera rilevate da centraline. Le carte sono state ottenute attraverso programmi di cartografia automatica.
I risultati dimostrano che nel 93.7 % del territorio regionale la probabilità di superamento delle soglie di SO2 stabilite per legge è bassa o molto bassa (medie annuedei 981 percentili minori di 84 µg/m3). Il 25 % del territorio regionale presenta un moderato inquinamento atmosferico, il 23.4 % un inquinamento modesto, il 44.9 % ha livelli di inquinamento trascurabili. Le aree maggiormente inquinate, quelle cioè in cui maggiore è la probabilità del superamento delle soglie previste dalla legge, si trovano nella porzione sudoccidentale del Veneto, nelle provincie di Padova, Rovigo e Verona. L' andamento generale dell'inquinamento evidenziato dalle carte è in buon accordo con la localizzazione delle principali fonti inquinanti e con la direzione dei venti prevalenti.
Lo studio include anche le carte di distribuzione di otto specie licheniche (Candelaria concolor, Candelariella xanthostigma, Hypogymnia physodes, Parmelia exasperatula, Parmelia sulcata, Physcia adscendens, Physcia orbicularis, Xanthoria parietina), anch'esse ottenute per via automatica, che vengono discusse in relazione alla distribuzione spaziale dell'inquinamento atmosferico nel territorio regionale. Si possono distinguere tre gruppi principali di specie, con differenti patterns di distribuzione nell' ambito della regione. I fattori principali che condizionano la distribuzione dei licheni nella Regione Veneto sono l'inquinamento atmosferico e l'eutrofizzazione delle scorze conseguente all'attività agricola.
L'utilizzazione congiunta di bioindicatori e del rilevamento strumentale viene proposta come la strategia più appropriata al monitoraggio dell'inquinamento atmosferico su vasta scala.
4

INTRODUCTION
The aim of this paper is to present the results of a study on air pollution by sulphur dioxide in the Veneto Region (NE Italy) using epiphytic lichens,as bioindicators.
This study, commissioned by the Veneto Region to the Department of Biology of the University of Trieste, is the first large-scale project on lichens as bioindicators in Italy, covering a surface area of 18.364 km2. The field data were obtained in 662 sampling stations, for a total of 2.425 relevés of lichen vegetation, based on the method proposed by Liebendoerfer et al. (1988).
The survey, directed by the first author with the collaboration of Co.Ge.V. s.r.l. (Verona) and Ecothema s.r.l. (Trieste), has been completed within one year, from September 1989 to September 1990.
The maps presented in this paper can be used to detect high-risk areas, i.e. areas where the probability of concentrations of SO2 higher than thethresholds established by law is greatest, and to optimize the positioning of theautomatic recording gauges.
Air quality and air pollution
The terms "air quality" and "air pollution" have a different meaning. Air quality refers to the effects of different pollutants on a variety of subjects, including man, animals, plants and even inorganic substrates such as monuments, whereas air pollution is defi�ed in terms of concentrations of pollutants in the atmosphere. As discussed by Nimis (1990), "air quality" is much more difficult to define on an operational basis than "air pollution", for four main reasons; these are: a) scarce knowledge on the effects of severa} pollutants on man, animals andplants,b) the fact that injury does not always depend on average pollution values, butalso on peak levels and on the duration of exposure,e) scarce knowledge of the synergic effects of different pollutants on differentorganisms,d) scarce knowlegde on the transfer of pollutants in the ecosystems.
The difficulties in establishing reliable air quality indices on a quantitative basis often led to search for "air quality indicators", which are parameters indicating the degree of air quality of a given site. In the absence of a clear operational definition of the term "air quality" the indicators become the only way to define it. This may involve circular reasoning.
5

Although the term "air pollution" is much easier to define on an operational basis, the monitoring of air pollution is far from being an easy task. The main reasons are: 1) The threshold levels established by law for the single pollutants are e;�pressedas actual concentrations in the atmosphere. This requires a monitoring strategybased on direct instrumental recording.2) The concentrations of pollutants in the air are highly variable in time andspace. Monitoring must be based on a statistica! approach, requiring a highdensity of sampling points both in time and space.3) The high costs of instrumental monitoring are a strong constraint on thedensity of sampling points. Hence, data by instrumental nets often have a poorstatistica! quality, in spite of the apparent precision of the single measurements.
To overcome these problems, many different "pollution indicators" have been proposed. Their use is conceptually easier than that of air quality indicators, since air pollution is easily defined in a quantitative way. An indicator of air pollution is any kind of parameter which is known to be related to pollution levels. If this relation can be expressed by a highly significant mathematical relation the indicator can be used as a "monitor".
This study is based on lichens used as indicators. In the following we shall try to clarify what kind of information, relative to air quality and/or air pollution, can be obtained by our data.
Bioindicators of air pollution and air quality
The use of bioindicators of air pollution is based on the estimation of the effects of environmental changes due to air pollution on living organisms. An organism is considered as a bioindicator when it presents identifiable reactions to different degrees of pollution. It may react specifically to a certain pollutant or unspecifically to a mixture of toxicants. A bioindicator is optimal when it can be used as a biomonitor. Most studies dealing with bioindicators have a serious handicap: they do not provide quantitative pollution data since most bioindicators cannot be used as biomonitors. For this reason their use for regulatory decision-making may be problematic, since the maximum acceptable pollution levels are usually defined by law in terms of concentrations of the pollutants in the atmosphere.
Organisms may be also used as indicators of air quality. Their use is based on the assumption that the reaction of living organisms to pollution phenomena is a better estimate of damage to man or other animals than quantitative data on the concentrations of single pollutants. In this case the exact nature of pollution, the concentration of substances involved and the duration of pollution incidents are not determined, but real potentialities for damage will be identified. Although this is probably true in most cases, such an approach may
6

be subject to severe criticisrn: often there is no experirnental evidence that the effects of pollution will have the sarne intensity on the bioindicator and on man, other anirnals, or other plants. When the use of a bioindicator of air quality is the only way to define air quality itself the approach, involving circular reasoning, cannot easily be accepted as scientifically valid.
Lichens as bioindicators - some problems
Epiphytic lichens are generally known as very good indicators of air pollution and/or air quality, and as such they have been extensively used throughout the world. For references on the very abundant literature on the subject we refer to Ferry et al. (1973), Lackovicova et al. (1988,1989), and Nirnis et al. (1991). There are different techniques for the use of lichens as bioindicators; arnong the rnost widely used is the approach based on Indices of Atrnospheric Purity (I.A.P.). Severa! different indices have been proposed; rnost of thern associate a toxitolerance factor to each species. This factor is often calculated on a rather subjective basis, and it appears as one of the rnain weakpoints of severa! indices. When reliable, direct pollution data are not available, i.e. just in the case where a biornonitoring study is rnost useful, the attribution of toxitolerance values to each species rnay even involve circular reasoning; this happens when new sensitivity values towards pollution are used to obtain a nurnber which is clairned to be related to pollution itself. Furtherrnore, lichens are very sensitive to climatic conditions, and in particular to air hurnidity. The "drought effect" (Beschel 1958, Rydzak 1969), i.e. the drier rnicroclirnate of la.ge towns, rnay not be a severe lirniting factor in regions with an oceanic-suboceanic clirnate, such as western Europe (see Barkrnan 1969, Coppins 1973), but its irnportance increases with increasing continentality of the generai clirnate (Nirnis, 1986). There is evidence that the tolerance of a given species to air pollution rnay differ according to the genera! clirnatic conditions. Thus, even in the rare cases where a toxitolerance factor for calculating an I.A.P. index is based on experirnental data, its extension to another area, with different clirnatical conditions, is not always justified.
Recent studies in Switzerland by Herzig et al. (1985, 1987), Wanner et al. (1986), Liebendoerfer et al. (1988), Arnrnann et al. (1989), Urech et al. (1990) and Herzig (1990) led to the development of a new biornonitoring technique, based on epiphytic lichens, that proved to held very good results. These authors tested 20 different I.A.P. forrnulas against real pollution data. Tue surn of the frequencies of all species within a sarnpling grid of 10 subunits proved to have the highest statistica! correlation with the cornbined concentrations of different pollutants. This sirnple index, called "Calibrated Lichen Index of Air Quality", has a great advantage over other I.A.P. indices, since it does not need the
7

attribution of toxitolerance values to each species. For these reason, this study is based on the 1.A.P. index proposed by the above cited Swiss authors.
Predictive value of the adopted I.A.P. index
Liebendoerfer et al. (1988) tested the I.A.P. index later adopted in this study on the basis of direct pollution data derived from two independent measuring networks in Switzerland, one located in the town of Biel-Bienne, the other in the Swiss Mittelland. In Biel-Bienne these authors found a highly significant statistical correlation between the index and the sum of 8 different pollutants (dust, S02, N03, Cd, Cu, Pb, Cl, Zn). The predictability of the index decreased when some of the pollutants were excluded from the analysis. In the Swiss Mitteland the mixture of pollutants consisted of S02, NO, N02, 03; also in this case the I.A.P. index proved to have a very high statistica} correlation with the pollution data, and the significance of the correlations decreased when some pollutants were excluded from the analysis. The authors concluded that lichens are sensitive not only to S02, as it was generally assumed by most authors, but to a mixture of toxicants. As such, they can be utilized as monitors of air quality. In this case "air quality" is defined in terms of probability of recording concentrations of some pollutants that are above the threshold levels established by law. This definition does not involve circular reasoning, being based on a sound experimental design and on a statistical analysis of both lichen and pollution data.
Testing the method in ltaly
Before adoption of the methodology proposed by the Swiss authors in the survey of the Region of Veneto, we decided to test it in a narrower area located within the north Italian territory. The area chosen was the town of La Spezia (Liguria) and its surroundings. The available pollution data were limited to S02, recorded by 8 gauges. Data on metal deposition have been obtained indirectly in 34 stations, using a lichen (Parmelia caperata) as a bioaccumulator. The results were as follows: 1) Regardless of the fact that in the immediate surroundings of the 8 gauges itwas not possible to carry out all relevés in optimal standard conditions (absenceof suitable trees), the I.A.P. showed a good statistical correlation with the S02
data (Nimis et al. 1990).2) Some metals were highly correlated with the I.A.P. values, while othersshowed no statistically significant correlation. The correlation between I.A.P.values and the sum of S02 plus all metals was lower than that against S02 dataalone (Nimis et al., unpubl.).
8

A still lower statistica} correlation between I.A.P. and metal deposition patterns was found by us in a further test study, carried out in the northern part of the province of Vicenza, using lichens as bioindicators, and Parmelia
subrudecta as a bioaccumulator of 10 metals (Nimis et al. 1991). This area is characterized by a very scattered occurrence of pollution sources within a mainly agricultural landscape: the use of lichens as bioaccumulators allowed the detection of the main sources for specific metals with a very high degree of accuracy, and the I.A.P. map was well in agreement with the location of the main sources of S02, and with the direction of the prevailing winds. However, there was a low correlation between I.A.P. index and the sum of the concentrations of all metals.
These results confirm the high predictive value of the Index with respect to S021 but do not agree completely with the model found by the Swiss authors. This might depend on two main reasons: 1) Different pollutants have different effects on lichen species; some species areable to tolerate high concentrations of some metals without apparent damage,but are much more sensitive to other gaseous pollutants.2) When the emitting sources are concentrated in a relatively narrow space (e.g.an urban area and an adjacent industria! zone) the sum of their distributionpatterns may reflect well the air quality situation, including possible synergiceffects. On the other hand, when the emitting sources have a scattereddistribution, some parts of the survey area may have high concentrations of aspecific pollutant, while all other pollutants have low values. The effects ofthese concentrations on the I.A.P. values obviously depend mainly on thespecific toxicity (for lichens) of the pollutant with the highest concentration.
In other words, it is more probable that the I.A.P. will show a highly significant correlation with the sum of severa! pollutants when their deposition patterns are similar. When this is not the case, such a situation cannot always be expected. Our knowledge on the toxicity of different pollutants for lichens is not yet sufficient to allow the assignement of a weight to every single pollutant, in order to evaluate its possible effect on the I.A.P. value.
In conclusion, the evidence which is available to date allows the use of the I.A.P. index adopted in this study as a reliable tool to estimate pollution by S02 and/ or other phytotoxic gases. In the interpretation of our maps we have used the relation between I.A.P. index and S02 concentrations, as established at La Spezia (Nimis et al. 1990), to estimate the main pollution levels within the region. We think, however, that the index should be re-calibrated with pollution data relative to the Veneto Region, owing to climatica! differences with La Spezia. Therefore, the translation of the index values into pollution values should be considered just as a first attempt to use lichens as biomonitors of S02
pollution in the region, and could be improved with further research. There are a few data available on S02 concentrations within the Veneto Region; these,
9

however, concem rnostly areas located within the lichen desert, or with a very poorly developed lichen vegetation, and hence they do not allow a good calibration of the I.A.P. values. However, as far as the lowest I.A.P. values are concemed, there is a very good correspondence between the SO2 concentrations recorded at La Spezia and those recorded within the Veneto Region.
lt rnust be underlined that there is sufficient evidence to state that the index is linearly related to pollution by SO2; the effect of a new calibration should be to rnodify slightly the slope of the regression line obtained at La Spezia. Considering that secondary eutrophication of the bark is rnuch more pronounced throughout the Veneto Region than at La Spezia, and given that this factor rnay counterbalance the acidification of the bark due to air pollution, it is probable that a new calibration in the Region of Veneto will reveal somewhat higher pollution levels than those reported in this paper.
The rnaps which are presented here reflect the rnain distribution pattems of SO2 pollution within the Region of Veneto.
Advantages of using bioindicators
One of the rnain advantages of the techniques based on bioindicators is their relatively low cost. This allows the adoption of sarnpling strategies with a relatively high density of sampling points, which, considering the nature of pollution phenomena, greatly enhances the data quality. The degree of error intrinsic in the variability of biological data is compensated by the density of sampling points. This perrnits the drawing of reliable pollution maps of large areas, that could not have been obtained by instrurnental recording owing to the scarcity of sampling points.
However, the use of bioindicators should not always be considered as an alternative to instrurnental recording. Its greatest advantages are evident when the two approaches are used jointly. One of the main problems of instrurnental recording is the positioning of the recording instruments. Considering their generally low number, this is a rnost fundarnental point, with a great influence on the results of the instrumental rnonitoring net. A large-scale survey of the area to be rnonitored by instrurnental recording, using an appropriate bioindicator, can result in the relatively rapid production of a map shovving high-risk areas, i.e. areas where the highest pollution levels are most probable. These areas can be selecteè for the positioning of recording gauges. In this way the use of rnonitoring instrurnents, which are necessary to measure the real extent of pollution levels, can be optirnized.
An integrated approach, where bioindicators, bioaccumulators and recording instruments are used jointly, is probably the most appropriate solution for air pollution rnonitoring.
10

SURVEYAREA
The Region of Veneto, in north eastern ltaly, has a surface area of 18.364 km2 and a population of 4.380.252 inhabitants, with a density of 238 inhabitants/km2.
The region is subdivided into 7 administrative provinces. The provincia} capitals are: Belluno (population: 36.000), Padova (population: 222.150), Rovigo (population: 52.484), Treviso (population: 84.500), Venezia-Mestre (population 324.270), Verona (population: 258.700), and Vicenza (population: 109.500).
The northern part of the region is occupied mainly by mountains: the Dolomites in the province of Belluno, the Asiago Plateau in the province of Vicenza and the Lessinian Mountains in the province of Verona. The mountain area has the lowest population density: it hosts only 8.1 % of the population, although it covers 29 % of the regional territory.
A low belt of hills connects the Alps and pre-Alps with the Venetian plain, which is interrupted by two other chains of hills of volcanic origin (Colli Euganei and Monti Berici); altogether the hills occupy 14.5 % of the regional territory and host 15 % of the population.
Most of the population (76.6 %) lives in the plain, where there is also the highest concentration of industries and an intensive agricultural activity; 56.4 % of the regional territory is located in lowland areas.
The main industriai areas are located in the lowlands, near MestreMarghera (mainly chemical industries), in the surroundings of Padova, Vicenza and Verona; large parts of the plains have a scattered, diffuse distribution of small industries, so that industriai and agricultural landscapes are often intermingled.
The main climatic features of the survey area are presented in fig. 1, that reports the climatic diagrams (according to Walter & Lieth 1960) of 17 selected localities, whose location is shown in fig. 2. Three main climatic types can be recognized:
1) Temperate climate (from Agordo to Cortina in fig. 1) : this climatic type ischaracteristic of mountain stations. Average yearly temperatures are lower than13 ·c and precipitation is the highest within the region, with yearly meansalways higher than 1000 mm. There is no sign of a decrease in water availabilityduring summer months, precipitations being high from spring to autumn.2) Intermediate climate (from Castelfranco to Vicenza in fig.1): this climatic typeis clearly intermediate between types 1) and 3), and corresponds to the "esalpicclimate" of Del Favero et al. (1990): it is characteristic of localities situated in thewestern and in the northem plains: there is a clear decrease of precipitation
11

·e
40
30
20
10
AGORDO
(25-30)
·e
40
30
20
BELLUNO
(30-30)
PORTOGRUARO
(19-30)
9,3• 1366
611 m
80
60
40
20
u,r 1254
400m
mm
100
80
60
40
20
12,6° 1121
6m
mm ·e100
80 40
60 30
40 20
20 10
ASIAGO 6,7°
1407 BASSANO DEL GRAPPA12,1· 1177 (30-34) 999m (29-36) 129m
·emm ·e 100 mm
100
40
80 40
80
30 60 30
60
20
40 20
40
20
20
CORTINA D'AMPEZZO 1159 6,s·
(18-30) 1275m
CASTELFRANCO VENETO 13,5• 915
(21-30) 44m
mm ·e100 mm
100
40
80 40
80
30
60 30
60
20
40 20
40
20 10
20
TREVISO 13,4°
938 VICENZA 13,7°
10J7 (30-30) 15m (30-30) 42m
mm ·e
mm 100
100
80 •o 80
60 30
60
40 20
40
20 10
20
12

•e
BADIA POLESINE (RO) 12,9' 676
(17-30) 11 m
CHIOGGIA (VE) 14,0' 696
(18-30) 2 m
COLOGNA VENETA (VR) 13,1' 769
(20-30) 24 m
mm ·e100
\�
:
'C mm
100
80
·e
MONSELICE (PD) 12,9'
(21-30)
80 40
717
15m
'mm •e
100
BO
60 30
20
20 10
PADOVA
(30-30)
SAN NICOLO' DI LIDO (VE) VERONA 13,7' 788
(30-28) 2m (30-30)
mm •e·e100
80 40
60 30
40 20
20 10
13,1'
13,3'
13
60 60
40
20 20
846 ROVIGO 13.3' 645
12m (30-30) 4m
mm mm ·e
100 100
BO 80 40
60 60 30
40 40
20 20
644
60m
mm
100
Fig. 1: climatic diagrams 80 (following Walter & Lieth
60 1960) of 17 stations in the Region of Veneto; their
40
locations are shown in fig.2. 20 Further explanations in the
main text.
�Verona
•
•
Asiago
Cologne Veneta •Monselice
�Rovigo
Fig. 2: location of the metereological stations whose climatic diagrams are shownin fig. 1, and directions of the winds in the Venetian Plain. 14

during summer, with two maxima in spring and autumn, but water availability is good throughout the year. 3) Mediterranean-like climate (from Badia Polesine to Verona in fig.1): it ischaracteristic of the southem plains. Average yearly temperatures are around13 ·e, and precipitation is generally lower than 800 mm. A brief period ofsummer drought is evident in all climatic diagrams, but a real water deficit doesnot occur. For this reason this climatic type cannot be considered as tipicallyMediterranean. The stations of Rovigo and Badia Polesine, the only ones wherethere is a short period of water deficit in summer, are located in areas with avery high water table. This explains the rarity in the region of truemediterranean vegetation, which is confined to coastal sand dunes. Animportant point, which is not visible in the climatic diagrams, is the stagnationof fog: this is a very frequent phenomenon during the colder seasons,particularly in the southem plains and in the province of Rovigo, and constitutesan important additional source of water for lichens.
Winds are an important factor in the dispersion of pollutants. Fig. 2 reports the main wind directions for 7 selected localities. The eastern plains are still under the influence of the Bora-winds, which are strong, dry, cold winds blowing from NE, particularly during the cold season. In the high plains (e.g. station of Bassano) locai northern winds blowing from the pre-Alpine valleys can play a relevant role. In generai, the direction and intensity of the winds in mountain areas are very variable, depending on the locai morphology, and on the orientation of the main valleys. Near the coasts (e.g. station of S. Nicolò di Lido), there is a clear prevalence of southeastern winds coming from the Adriatic sea. The area around Padova is characterized by the prevalence of northern winds, whereas the three stations located in the western part of the region (Verona, Vicenza and Rovigo) have different wind patterns: Verona is characterized by the prevalence of eastern and western winds, Vicenza has a slight prevalence of northern winds, and Rovigo is still under the effect of the Bora winds from NE, which is much weaker than in the eastem stations. On the whole, the low plain is characterized by a counterclockwise rotation of the main wind directions.
DATAANDMETHODS
Sampling
All relevés of lichen vegetation were on Tilia sp. This tree has been chosen for sampling since it is widespread throughout the region, both in natural stands (on the hills and lower mountains) and in urban areas.
15

. . .
. .. .
. . .
. .
. . .
. . • • .
Fig. 3: location of the 662 sarnpling stations within the regional territory.
16

Furthermore, the bark of Tilia has a subacid pH, ranging from 4.8 to 5.6, with an average of 5.2, and is of mesotrophic type (Barkman, 1958), which is ideal to estimate the compositional variations of epiphytic lichen vegetation due to acidification induced by SO2•
The relevés have been carried out only in stations satisfying the following criteria: 1) At least 4 trees satisfying the standard features (see below) shoud be present.2) The trees must have a circumference between 80 and 230 cm.3) The trunks must not have an inclination higher than 10· (possibly below 3 °).4) The trees should be neither in closed natural stands, nor located adjacent topossible sources of disturbance, such as high-traffic roads, garbage cans, etc.
A total of 2.425 relevés was carried out in 662 stations, the location of which is shown in fig. 3.
The distribution of the stations in the 7 administrative provinces of the Region of Veneto is as follows: Province of Belluno: 30 stations. Province of Padova: 80 stations. Province of Rovigo: 65 stations. Province of Treviso: 80 stations. Province of Venezia: 60 stations Province of Verona: 120 stations. Province of Vicenza: 227 stations.
The higher density of stations in the northern part of the province of Vicenza is due to the fact that in this area we carried out a preliminary survey to test the methodology which was later extended to the entire region, and in particular to estimate the optimal sampling density. The results of this survey, which show the degree of accuracy that can be reached by a higher sampling density, have been published by Nimis et al. (1991).
The sampling strategy was as follows: 1) The choice of the stations was based on preferential sampling because of theuneven distribution of suitable stations. A large amount of time was spent inthe research of suitable stations, and in large parts of the survey area all stationsfulfilling the standard features have been sampled.2) In each station relevés were carried out on at least four randomly selectedtrees.3) Relevés were taken using a sampling grid of 30 x 50 cm, subdivided into tenrectangles, placed on the boles at an height of 1.2 m. The centre of the grid waspositioned in the part of the bole with highest lichen coverage.4) A relevé listed all species found within the grid, with the number of grid unitsin which every species occurred (frequency value) being computed.5) The sum of the frequency values of all species is the I.A.P. of the relevé.
17

6) When the I.A.P. values of the four relevés of a station were widely different,more relevés were carried out, until the distribution of the values fitted a bellshaped curve. When no more trees were available, the station point wasconsidered as a "low data-quality point".7) The I.A.P. of the station is the average of the I.A.P. values of all relevés withinthe same station.8) Low data-quality points were disregarded in the analysis unless no othersuitable station was present within a radius of at least 10 km from the next highdata-quality point. In any case, the number of low data-quality points does notexceed 5 % of the total number of stations.
Prior to sampling, the performance of the operators has been checked during a training period, so that the results obtained by different people were comparable.
A card has been compiled for each station, with the following information: 1) Geographical coordinates of the station and its location on a topographic mapat a scale of 1: 25.000.000.
2) Schematic drawing of the sampling site with the exact location of the treeswhere relevés were carried out.3) Colour picture of the sampling site.4) Diameter and inclination of each tree, and exposure of the relevés on thetrunks.5) Total cover of lichen vegetation within the sampling area of each relevé.
The information in 1-3 will allow further repetitions to be made at a later date, to monitor the temporal variation of pollution phenomena throughout the region. These data are not reported here for reasons of space. They are available upon request to the Region of Veneto.
Data Analysis
In order to study the compositional variation of epiphytic lichen vegetation in the survey area the data have been processed by programs of multivariate analysis (classification and ordination). The analysis has been carried out in two steps: 1) Por each station, the frequency data of each species in each sampling grid(relevé) have been averaged. A station vector is defined by the averagefrequency values of all species occurring in the relevés of the same station. Thestation vectors of each province have been separately subjected to numericalclassification, in order to obtain groups of stations with similar floristiccomposition. The algorithm used was Complete Linkage Clustering withEuclidean Distance, using the program package of Wildi & Orloci (1983). These
18

results have been used to comrnent briefly on the main features of lichen vegetation within each province. 2) To obtain a genera! synthesis, a second matrix has been constructed, wherethe rows are species and the columns report the station groups obtained in theprevious step; for each species the matrix reports its percentage occurrencewithin a station group. This matrix has been processed by numerica!classification and reciproca! ordination, to detect the main trends of floristicvariation within the survey area, and to discuss the main factors which areresponsable of this variation. In this case also, the program package by Wildi &Orloci (1983) has been used.
The choice to subdivide the entire data set into 7 subsets (one for each province), and to use for the synthesis the contingency table of the groups obtained by numerica} classification of the subsets, was based solely on the ground that it was necessary to reduce the computing load to perform multivariate analyses of the matrices.
Mapping procedures
Two types of maps are presented in this paper: 1) I.A.P. maps, showing the spatial distribution of the I.A.P. values within eachof the seven provinces, and within the entire Veneto Region. These are based onthe I.A.P. values of the different stations.2) Maps showing the distribution patterns of selected species. These are basedon the average frequencies of each species within each station.
All maps have been obtained by computerized automatic mapping in order to avoid subjectivity in the cartographic expression of the results. We have utilized the program package SURFER (Golden Software Inc., Golden, Colorado, U.S.A.). The programs are based on a grid, whose mesh size depends on the minimum and maximum values of the input data. The interpolation method utilized to create a regular grid starting from points (stations) irregularly distributed on the survey area is based on the I.A.P. values of the 10 stations nearest a given point. Tue influence of a given station on the others is inversely proportional to their distances.
In interpreting the maps, one should be aware that their reliability is not the same for each part of the map, since it depends on the density of sampling points. Tue density should be higher in mountain areas with a rugged morphology. However, it is just the mountain area that has been sampled with lowest intensity in our study. Tue main reason for this choice is that we have preferred to attain a higher sampling intensity in the more densely populated areas of the Venetian Plain. The maps of the mounfain areas, and in particular that of the province of Belluno, are mostly valid only for sites located in the main valleys. No station was located above 1.300 m.
19

Taxonomical remarks
Since all relevés have been carried out in the field, some species presented identification problems that cannot always be solved without analysis in the laboratory. In most cases, dubious materiai was collected in the field, and identified later in the laboratory. In the following we list a few cases in which the adopted nomenclature, which mostly follows Nimis & Poelt (1987) needs clarification. - Buellia punctata: the epiphytic forms of the B. punctata complex are still verypoorly known, and in need of revision. Here the species is meant in a very broadsense.- Lecanora gr. hagenii: this name includes two lichens, L. hagenii s.str., whichoccurs mainly on eutrophic bark in relatively unpolluted areas, and anotherlichen, belonging to the same group, which, however, differs from L. hagenii s.str. in the non-pruinose apothecia with entire margin. The latter is most commonin polluted areas, and sometimes is the only species which occurs within urbansettlements; perhaps it corresponds to forms which are sometimes treated asLecanora umbrina auct.- Lecidella elaeochroma: this species belongs to a difficult group, where severa}species have been recognized on the basis of characters whose taxonomicsignificance is still not clear; in the survey area Lecidella elaeochroma s.str. is themost frequent taxon, but also Lecidella achristotera and Lecidella euphorea havebeen recorded sometimes. Since these three species are difficult to distinguish inthe field, they have not been distinguished in the relevés, and here L. elaeochromais meant sensu lato.- Nectriacea sp.: with this name we designate a conidiophoral lichenized funguswith small bright yellow pycnidia and a poorly developed greenish thallus,which appears to be relatively frequent in some parts of the region, even inrather polluted areas. The identification at genus and species levels has not yetbeen possible (Poelt, in litt.).- Physcia vitii: with this name we designate a Physcia resembling Physciaadscendens, but with a more robust thallus lacking fibrils. It corresponds wellwith the description of P. vitii, but we have no reference material to check thisidentification.- Rinodina exigua: this is the most common epiphytic Rinodina throughout thesurvey area. However, some samples identified in the laboratory proved tobelong to R. pyrina. Since the two species are difficult to distinguish without theobservation of the spores, some citations of R. exigua might actually refer to R.
exigua.
20
- Usnea subfloridana aggr.: the thalli of Usnea found throughout the survey areaare always very poorly developed; this identification cannot be other than an"educated guess" and it might be that more taxa are involved here.- Xanthoria fallax: according to J. Poelt (in litt.), who is preparing a revision ofXanthoria fallax s. lat., the materiai identified as X. fallax by Europeanlichenologists includes at least three distinct species: of these, Xanthoria fallax s.str. Xanthoria fulva, and another taxon provisionally named Xanthoria bella occurin our survey area; they have not been distinguished in the relevés, so that hereXanthoria fallax is treated in the old sense, including the three species.
RESULTS
The results of this study are presented in this chapter, according to the following scheme: 1) Numerica} analysis (classification and ordinations) of the matrix of speciesand station vectors, relative to all provinces.1) For each of the seven provinces: (a) classification of the station vectors intogroups, and (b) I.A.P. maps of the provinces.3) I.A.P. map of the entire region.4) Distribution maps of selected species.
The basic data (2.425 relevés and the exact location of each station) are not presented in this paper for reasons of space. They are available upon request to the first author.
The lichen vegetation within the region
Altogether, 80 species have been recorded during the survey. The most common are, in order or decreasing frequency (see tab. 1): Physcia orbicularis, Physcia tenella, Lecidella elaeochroma, Physcia adscendens, Xanthoria parietina, Lecanora chlarotera, Parmelia exasperatula; all them have their optimum within communities of the Xanthorion parietinae, which, considering the physicochemical properties of Tilia bark, indicates a strong secondary eutrophication of the substrates throughout the region. This remark concerns the whole flora, since most of the rare species are also Xanthorion elements: the eutrophication of the bark is mainly due to the intense agricultural activity.
The frequency vectors of all groups of stations obtained by the numerica! classification of the 7 stations sets (one for each province, tab. 1) have been submitted to classification and ordination, in order to: 1) obtain a synthetic view on the lichen vegetation on Tilia in the survey area;2) detect the main trends of compositional variation, and analyze the mainfactors underlying this variation.
21

Groupn°
Province
Station group n·
Candelariella xanthostigma Physcia stellaris Xanthoria fallax Parmelia subargentifera Rinodina exigua Chaenotheca furfuracea Physcia aipolia Lecanora carpinea Lecanora gr. hagenii Caloplaca cerina Usnea subfloridana Evernia prunastri Hypogymnia physodes Physcia vitii Parmelia subrudecta Lecanora subfuscata Lecanora allophana Candelariella vitellina Parmelia tiliacea Parmelia pastillifera Caloplaca ferruginea Parmelia quercina Parmelia glabra Caloplaca flavorubescens Parmelia saxatilis Anaptychia ciliaris Cliostomum corrugatum Ramalina farinacea Normandina pulchella Physconia detersa Collema nigrescens Physconia perisidiosa Parmelia glabratula Hypogymnia bitteriana Physconia distorta Opegrapha lichenoides Arthopyrenia lapponina Physcia clementei Scoliciosporum umbrinum Pertusaria amara
111222233333333333344444444444444
VVVVVTTTTTBBBVVVWVVVWVPPPPRRRRR
RRRRRVVVVVLLLIIIIIIIEEEEDDDDOOOOO
123451234512312345671234123412345
22
233 33
2441 33 1
2322122
231 12
112122
121333
4541222
4551114 1
3341 2
2351 1
21133511
11 1 1111
11 11
11 1 1 1 11
1 1 1
1 1
111112 11
1 2 111 12 1
1 1 11111 1
1111 1 1111111 11 1
111111 21112221 11
1 1 11 1
111 12 1
12334111212221 13
1221354212111111 12
1 1 111 1
11121121
2111212111114 11 12
12 23
23 1 2
33 1 1
34
3 1111
11 211111 3 31 11231112 1
111
1 11 1
14 11 31 1
11 1
1
1
22
11111 1 1
12
12
12
21
112
1 1
1
1
1
1
11
1
11
1
1
1
1
1
1 1
1
1
1
1
1 1
1
111

Heterodennia speciosa Physconia enteroxantha Buellia punctata Catillaria nigroclavata Opegrapha atra Arthrosporum accline Graphis scripta Nectriacea sp. Parmelia exasperata Lecanora conizaeoides Candelariella lutella Caloplaca holocarpa Arthopyrenia punctiformis Parmelia subaurifera Lecanora symmicta Ramalina fastigiata Lecidella flavosorediata Bryoria furcellata Scoliciosporum chlorococcum Parmeliopsis ambigua Physcia hirsuta Parmelia acetabulum Pseudevernia furfuracea Parmelia caperata Physcia biziana Arthopyrenia antecellens Physconia grisea Physcia orbicularis Lecidella elaeochroma Physcia tenella Parmelia sulcata Parmelia exasperatula Xanthoria parietina Lecanora chlarotera Physcia adscendens Candelaria concolor Hyperphyscia adglutinata Arthonia radiata Candelariella xanthostigma Candelariella reflexa
1
11
1
11
1 1
1 1
111
12 12
1 21 1 1
3 2
1 4 11
21 22
22
22
2
2
2
1 2
1 2
11
11 2
2
211 4 1
1111 2 2
22111
1221 111
12 12 21
111
1 1
1111
1
1
1
1
1 1
1 21 11
1 1 1
1
1
111 111
1
1 11
1 1 1
2 11
1
1
1
1
1
1151111221211 1
2 1 121111
5111 32211 15
53555531134534221235555554554555
555445325442442225345334443452342
354243431155555555555555555553424
1453555114 122211 532 2122113112
35435552142242222244423244234111
53511231 232222221255444434224353
4553332 132221122255342122123354
555554422221121221 54332533122142
5555533 1122211 55555524245354
4334212 111111 55233212114134
2223323 11 111 532322 1 14241
1354235 1111111 55231211121111
45512 21 1 111111 25422334341 12
Tab.1: Station vectors obtained by numerica! classification of the 7 matrices of stations and species (one for each province), ordered as in the dendrogram of fig. 4. The numbers refer to 5 frequency classes, with intervals of 20 % each. Four groups are distinguished, as in fig.4. Provinces: BL (Belluno), PD (Padova), RO (Rovigo), TV (Treviso), VE (Venezia), VI (Vicenza), VR (Verona). Further explanations in text.
23

;.,
VR2
VR1
VI?
BL3
BL2
ElL1
Vl1
RO3
RO1
VE4
RO5
PD3
PD1
VE3
P02
VR5
R02
R04
1V2
VE1
Vl3
PD4
1V4
Vl2
TV3
VR3
VIS
VIS
TV5
TV1
VE2
Vl4
Fig. 4: dendrogram obtained by numerica} classification of the matrix of station groups and species (tab.1). The station groups have been obtained by numerical classification of 7 matrices of stations and species, one for each province. The abbreviations of the provinces are as in the caption of tab.1. Further explanations in the main text.
24

The dendrogram of the frequency vectors is shown in fig. 4: four main groups are formed (1,2,3,4); tab 1 reports the species and the frequency vectors, ordered as in the respective dendrograms.
In the following, each group will be briefly discussed, referring also to the pollution pattern shown by the I.A.P. map (fig. 21), that will be commented on later.
Group 1: it includes only three groups of stations, located on the low hills of the provinces of Verona and Vicenza. In this group the number of highfrequency species is great. Strongly acidophytic species are less frequent than in the following group, whereas nitro- and neutro-basiphytic species, such as Candelariella reflexa, Xanthoria parieHna and Xanthoria fallax are more frequent.Also in this case Xanthorion species are prevalent: some of them, however, arecharacteristic of moderately eutrophiated, subneutral-subacid bark (e.g. Physcia stellaris, Physconia distorta, Pannelia subargentifera). Also some species ofPannelion occur in this group, that represents well developed stands in relativelypollution-free areas with a moderate impact of agricultural activity (slight eutrophication of the bark).
Group 2: it includes four groups of stations, located in relatively undisturbed sites of the provinces of Belluno and Vicenza, mostly in the mountains. It has a large number of high-frequency species, and the greatest frequency of acidophytic and relatively anitrophytic lichens, such as Chaenotheca furfuracea, Usnea subfloridana aggr., Evernia prunastri, Hypogymnia physodes, Pannelia sulcata. The majority of the most frequent species, however, areelements of Xanthorion vegetation. This group represents well developed standsin relatively pollution-free areas where the impact of agriculture, and hence the secondary eutrophication of the bark, are low.
Group 3: this group includes 12 frequency vectors, relative to stations located in the provinces of Treviso, Venezia, Padova, Verona and Rovigo. Most of the stations are located in heavily urbanized areas, often dose to industria! centres. This group is characterized by a low number of species, the most frequent ones being Physcia orbicularis, Physcia tenella, and Lecidella elaeochroma. Furthermore, there is a sporadic occurrence of acidophytic species such as Hypogymnia physodes, Evernia prunastri, Usnea subfloridana, Lecanora conizaeoides, Pannelia exasperatula, that are absent or much less frequent in the followinggroup. This group represents a very impoverished epiphytic vegetation in urban or industria! areas where the impact of air pollution is high. The low frequency of highly nitrophytic species, such as Candelariella reflexa, Hyperphyscia adglutinata, Candelaria concolor, and the presence of a set ofacidophytic species, indicates a lower impact of agricultural activities and a secondary acidification of the bark by air pollution.
Group 4: this group includes 14 frequency vectors, relative to stations located in all provinces except Belluno and Rovigo. lts floristic composition very
25

a) 11
Hyperphyacia adglu!inata C#ldelariaconc:olor •
Candelariella raftexa • Xanlhoriaparietina
Lecanora ri'llarotera • Physcia biziana
Atlhoniaradiata • •
Phy1mnia grisea •
•
Caloplaca oerir\8
. • • Candela.tiella vitellina •
Physciaalpolia
,
Phyacia adacendens 1 , . ... .
, lecanora carpinea
\
Phyaciavitii I **"* �· Physda stell,...is
. • Phy1coniadi1torta Parmelia subrudecta -·- -·�
.,,.
.,,.lecano�a symmicta
Parmelia subaurif&ra
.
Phy1da orblrulari1
Ptlyada taneHa
b)
4
LecideHa elaeochro ma
/ I
11
'
\
Vl3 \ Vl4 ',
. • • rvs,
VE2 v.
A3 ',
Vl2 TV4 •
' . TV3
',, TV1 I - '
,
,..., -, ',v1s1 ,,.
• '
\ \
/ A02 '<' �,VAS , I
• ,,•, I 8 \ I • PDo ,PD2 V�4 ' \ •
A05 VE3 • • • R01l
\ • P01 R03 • I R04 VE4
3 I
I
I
' TV2 1 I
I
Lecanora coniza&Oide1
Parmelie exasperatula
Evwnia pruna111i
' '
' ' I
, V16 I ! , • I I
', I I
� • BL2 '
' '
/
I
\ '
'
P1eudevernia furfuraoea
Chaenotheca lurfuraoea
• Usnea subf1oridana
Parmelia suk:ata • • Hypogymnia physodes
'
VR2
' '
2
1
VI?
' '\ VR1 • \
I I
I I
I /
/
V11 • ) • BL1
Fig. 5: Reciproca} ordination of the species (a) and of the station groups (b) based on the data in tab.l. In Fig. Sa the species with low scores on either axis are not discrirninated, in fig. 5b the station groups obtained by numerica} classification are designated by numbers, as in fig.4.
26

much resembles that of group 1, with the difference that most of the species have lower frequency values. This group represents relatively disturbed Xanthorion stands in areas with intense agricultural activity and a moderate air pollution.
The reciprocai ordination of frequency vectors and species, based on the data of tab. 1 is shown in fig. Sa (vectors), and Sb (species). In fig. Sa the clusters of vectors obtained by numerica! classification mainly occupy four distinct quadrants in the space defined by the first two canonica! variates. The first variate can be interpreted as a diversity axis, with species-rich vectors having positive scores, and species-poor vectors negative scores. The second variate reflects the degree of eutrophication of the substrates: groups 1 and 4, characterized by a high frequency of neutro-basiphytic and nitrophytic species, have positive scores, whereas groups 2 and 3, with a higher frequency of acidophytic and anitrophytic species, have negative scores. This interpretation is confirmed by the ordination of species, which is shown in fig. Sb: the species with low scores on both axes are either low-frequency species, or species not significantly associated with the main floristic variation trends, and are not discriminated in the analysis. The sequence of the indicator species (i.e. those with high scores on at least one canonica! variate) along the first axis reflects a gradient of sensitivity to air pollution, the most resistant species being Physcia tenella and Physcia orbicularis (highest negative scores). At the positive and negative extremes of the second axis are, respectively, three highly nitrophytic species (Candelaria concolor, Hyperphyscia adglutinata and Candelariella reflexa), and a set of anitrophytic and acidophytic species (Evernia prunastri, Parmelia exasperatula, Hypogymnia physodes, Usnea subfloridana aggr.).
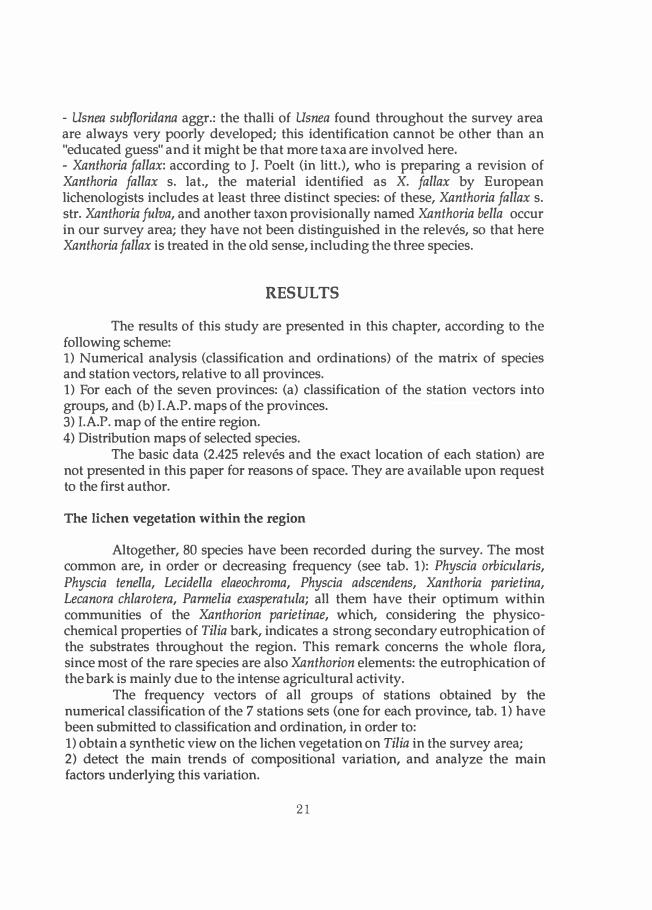
The reciprocai ordination of frequency vectors and species has been carried out also on a reduced matrix, without the groups of vectors 1 and 2, in order to analyze in more detail the floristica! variation trends relative to the stations located in more polluted areas (groups 3 and 4). The results are shown in fig. 6a (groups) and 6b (species). In fig. 6a the groups 4 and 3 are well separated on the first canonica} variate, the former having mostly positive scores, the latter negative scores. The group 3 has a narrower spread on the second variate, which is mainly due to the lower number of species, and hence to its higher within-group homogeneity. The arrangement of the indicator species in the space defined by the first two variates is shown in Fig. 6b: it is evident that the first canonica! variate reflects a gradient of increasing acidity of the substrate, from positive to negative scores: acidophytic species, such as Evernia prunastri, Parmelia sulcata. Parmelia exasperatula, Hypogymnia physodes, Usnea subfloridana, Chaenotheca furfuracea, Lecanora conizaeoides, have negative scores on the first axis. The two pollution-resistant species evident in the ordination based on the entire data set, i.e. Physcia tenella and Physcia orbicularis, have a slightly different position in the ordination of fig. 6b: Physcia tenella
27
a) 11
lecanora dilarotara Physoa orblwlan1 •
• Arthonia radiata
• Xanthoriaparietina Hypogymnia physoòes
Physc1a vtfll
• Evern1a prunastr1 Parmella sub1udecta
Physoa tanella Physoa adscendens
Candalaria concolor
Parmel1asulcata Lecanora cx,nizaeoides ... - - '
.. \ I
I
Hyperphyscia adglutinata Parmeha Huperacula
HyPD9ymnla phytodel •
b)
3
/
I
\ • TV2 \
\
'
.
Usnea subllondana
I , Chaanothaca lurluraoea I ,
I
\�·
'
R05
PD3
R04
PD1 VE4
• A02
R01 VE3
PD2
• A03
VAS
.
/
I • VIS
I
\
\ .VR4
' .
\
**• I
+•
* /
Candelariella Kanlhostigma
• Physcia biziana
Candelariella raflaxa
Physconia griaea
Il 4 /
/
/
/
/
I
I I I
I • TV1
I I
I • TV4
I
I
I I PD4
I
I • Vl2
I TV3
I
/
• VA3
V\6
' VE1 \
VE2
TV5
V\4
V\3 I
• I /
Fig. 6: Reciproca! ordination of the species (a) and of the station groups (b) based on the data in tab.1, without the groups of stations 1 and 2. In Fig. 6a the species with low scores on either axis are not discriminated.
28

occupies the negative extreme of the first axis, showing a higher resistance to acidification than P. orbicularis. The first canonical variate in the ordinations of Fig 6 shows a gradient of acidification, paralleled by a progressive decrease both in the number of species and in their overall frequency.
These results can be briefly summarized as follows: the most logica! sequence of the groups of frequency vectors is: 2,1,4,3, because this sequence shows the main floristic variation trends along a gradient of increasing disturbance: - Group 2 represents a situation where neither the pollution by phytotoxic gasesnor that by organic and inorganic fertilizers have a great impact on the epiphyticlichen vegetation. This is shown by the relatively great number of highfrequency species (indicating low pollution levels), and by the presence of a setof anitrophytic and acidophytic species (indicating low eutrophication of thebark).- Group 1 represents an intermediate situation, where air pollution byphytotoxic substances is still low (great number of high-frequency species), butthere are slight signs of bark eutrophication by fertilizers (absence ofanitrophytic species).- Group 4 represents a situation where both the pollution by phytotoxicsubstances and by fertilizers have clear effects on the lichen vegetation: thenumber of high-frequency species is strongly reduced, and there is a maximumof nitrophytic lichens.- Group 3 represents the final stage of the process, preluding to the lichen desert:the pollution by phytotoxic substances (chiefly SO2) is so strong that, besides afurther drastic reduction of high-frequency species, there is also a secondaryacidification of the bark; this creates conditions which reduce the presence ofneutro- basiphytic and nitrophytic species and favour the presence of somepollution-tolerant acidophytic species which occur also in group 2.
This scheme seems to be a general rule in the north eastern Italian Plains. Nimis (1986) in his study of the epiphytic lichen vegetation in the town of Udine (high Friulian Plain) described a situation very similar to that discussed above. In Udine a narrow belt of scarcely developed acidophytic species is present all around the lichen desert occupying the town centre. These species are otherwise absent or very rare in the Friulian Plain because of the intense agricultural activity, and the consequent pollution by fertilizers. They start to be common again only in hill and mountain areas where the agricultural activity is less intense. The disjunct distribution of Pseudevernia furfuracea in the northern part of the province of Vicenza (low mountains and main urban settlements), as shown by the map published by Nimis et al. (1991), is another good example of the secondary habitats created by air pollution for acidophytic species.
29

Province of Belluno
The province of Belluno occupies the northernrnost portion of the region, and has a surface area of 3.678 km2, being the largest province in the region. The population is of 215.000 inhabitants with a density of only 58 inhabitants/km2. Most of the provincia! territory lies in mountain areas, and the main urban centres are in the valleys. Industriai activities are scarcely developed, and the main industries are located in the surroundings of the provincia! capitai, Belluno, a town of 36.000 inhabitants.
The province of Belluno has the highest species richness (54 species). The most cornrnon species are Lecidella elaeochroma, Parmelia sulcata, Parmelia exasperatula, Physcia tenella, and Evernia prunastri. The classification of the 30 stations produced 3 main groups (tab. 2): acidophytic species, such as Hypogymnia physodes, Parmelia sulcata, Parmelia exasperatula, Chaenotheca furfuracea, Evernia prunastri tend to decrease from group 1 to group 3, whereas inthe latter there is an higher frequency of neutro-basiphytic and nitrophytic species such as Candelaria concolor, Physcia adscendens, Hyperphyscia adglutinata. The sequence from group 1 to group 3 reflects a gradient of increasing eutrophication of the bark. In this province acidophytic species have the highest frequency, which is probably due to the fact that here there is the lowest agricultural activity in the region.
This is the province where our air quality map has the lowest reliability: the density of sampling stations is very low (see figs. 3 and 7), and it appears to be stili more unreliable considering that most of the provincia! territory is occupied by high mountains (ali relevés have been carried out in the more densely populated valleys). The low density of sampling stations is due to two main reasons: a) the difficulty of finding suitable trees (Tilia becomes rare in mountain areas) and, b) the fact that most of the province has a low population density and a low concentration of industriai activities; we have preferred to give a higher sampling intensity to the densely populated high-risk areas of the plains.
With these lirnitations in rnind, the map of fig.8 can be briefly cornrnented on as follows: the province of Belluno has the highest I.A.P. values within the region, most of them being higher than 30; no area with lichen desert has been detected within the Provincia! territory. The most polluted areas are in the southem part of the province, south of Belluno, and most of the pollution is likely to derive from Belluno itself and from its srnall industriai area. The area with lowest I.A.P. values (lower than 25) has an elliptical shape, with the longer axis oriented in a N-S direction, which accords well with the direction of the prevailing winds in the high Piave valley. A study on lichens as bioindicators in the high Piave Valley has been published by Caniglia et al. (1978) and Spampani (1982).
30

Station group n· 1 2 3
Lecanora lt. hagenii 2 1
Calohla�a ol?c�pa 1
Xant ona f.anetma 2 1 1
Lecidella e aeochroma 5 4 4
Parmelia sulcata 5 5 3
Parmelia exasperatula 5 5 3
Hypogymnia physodes 5 3 1
Pfiysc1a stellans 3 1
Lecanora chlarotera 3 3 3
Physcia tenella 3 4 2
Rinodina exigua 2 2 1
Candelariella reflexa 2 1
Parmelia exasfuerata 2 1
Chaenotheca rfuracea 3 3 1
Physcia vitii 1
Parmelia subaurifera 2
Caloplaca cerina 1 1
Lecanora ca!P.inea 1 1 1
Lecanora suofuscata 2 1
Usnea subfloridana 3 3 1
Parmelia tiliacea 1 1
Lecanora s�micta 2
Arthopyrenia lapponina 1
Evemia prunastn 3 3 2
Physcoma distorta 3
Parmelia subargentifera 1
Pseudevernia furfuracea 1
Lecanora conizaeoides 1
Qpe��pha _lichenoides 1
Grap 1s scnpta 1
Parmelia caperata 1 1
Normandina pulchella 1
Ramalina farinacea 1 1
Parmeliopsis ambi�a 1
Scoliciosporum um rinum 1
Lecanora allophana 1 1
�egrapha atra 1
ctnacea sp. 1 1
Arthop�ma antecellens 1
Physc1a biziana 1 1
PhY.scia aipolia 2 2 1
Arthohyrenia punctiformis 2 1
Parme ia subrudecta 3 2
Xanthoria fallax 2 1 2
Physcia hirsuta 1
Hyperp�ysci!l adglutinata 1 2 4
PfiY.scoma �sea 2 1
Arthonia radiata 2 3 3
Candelariella xanthostigma 3 2 4
Physcia orbicularis 5 5 5
Candelaria concolor 3 5 5
Physcia adscendens 4 5 5
Tab.2: Frequency vectors of the three station groups obtained by numerica! classification of the matrix of species and stations relative to the province of Belluno. Numbers refer to 5 frequency classes of 20 % each.
31

Fig. 7: map of the province of Belluno, with the location of the sampling stations.
32

KM
O 5 10 15 20 25 30
<20 21-25 26-30
31-40 4�50 51-60 61-70 >70
Fig. 8: I.A.P. map of the province of Belluno. Tue province has been subdivided into several zones, characterized by different I.A.P. values.
33

Province of Treviso
The province of Treviso has a surface area of 2.477 km2 and a population of 736.400 inhabitants, with a density of 297 inhabitants/km2
• Most of theterritory (63. 6 %) is located in lowland areas, with the exception of its northwestern part (29.4 %), which is occupied by low hills and mountains, the latter located only at the border with the province of Belluno. The main industriai area lies around the provincia} capital, Treviso, a town of 84.500 inhabitants. Minor industriai areas are located near medium-sized urban centres, such as Conegliano, Montebelluna, Valdobbiadene, Vittorio Veneto (see fig. 9).
This is a rather species-poor province, with only 39 species recorded. The most frequent are Physcia orbicularis (95 % of the stations), Candelaria concolor (82 %), Physcia tenella (76%), Xanthoria parietina (60 %), Lecanora chlarotera (52 %); all of them are linked to Xanthorion vegetation. The numerical classification of the 80 stations produced 5 rnain groups that are shown in tab. 3. The groups of stations 1 and 2 are very species-poor; group 2 differs in the higher frequency of some acidophytic species such as Parmelia sulcata, Hypogymnia physodes, Chaenotheca furfuracea, Usnea subfloridana, Evernia prunastri and Parmelia exasperatula; both groups include stations located near industriai areas or within urban settlements, and represent, respectively, impoverished Xanthorion stands, and a specie_s-poor vegetation characterized by the occurrence of acidophytic species due to secondary acidification of the bark. The remaining three groups of stations have a very sirnilar floristic composition, and can be considered as representing three facies of Xanthorion vegetation in relatively unpolluted areas.
The I.A.P. map (fig. 10) shows that most of the province has relatively high I.A.P. values (25-50) indicating moderate, or low degrees of air pollution. An exception is the area south of Treviso, the largest urban and industriai agglomeration of the province, which includes a narrow lichen desert surrounded by areas with I.A.P. values lower than 20. Furtherrnore, minor areas with low I.A.P. values are evident southwest of Conegliano and Castelfranco Veneto, near Miane, Volpago and S. Biagio (see fig. 9); most of them include industriai agglomerations. It is rather surprising that the surroundings of Vittorio Veneto, a relatively large settlement with an industriai area, show the highest I.A.P. values in the whole province (higher than 40): this rnight be due to the locai rnicroclimate, since Vittorio Veneto is located at the end of a narrow valley with frequent N-S winds, which rnight help the dispersion of pollutants toward the south. The influence of Vittorio Veneto could be evident in the northward extension of the relatively polluted area surrounding Conegliano (I.A.P.: 21-25), which otherwise would be difficult to explain considering the main wind directions.
34

Station group n · 1 2 3 4 5
Physcia orbicularis 5 3 5 5 5
Candelaria concolor 3 5 5 5
Xanthoria parietina 3 2 4 4 4
Lecanora chlarotera 3 2 4 4 4
Parmelia sulcata 1 5 2 2 1
Hypogymnia physodes 2 1 1 1
Chaenotheca furfuracea 1 2 1 1
Lecanora gr. hagenii 1 2 1 1
Caloplaca cerina 1 1 1
Physcia aipolia 1 1
Lecanora carpinea 1 1 1
Usnea subfloridana 2 Evernia prunastri 3 1 1
Xanthoria fallax 1
Physconia grisea 1 1
Physcia stellaris 1
Parmelia exasperata 1
Parmelia caperata 1
Lecanora subfuscata 1
Catillaria nigroclavata 1
Parmelia tiliacea 1 1
Nectriacea sp. 2 Parmelia acetabulurn 1
Arthopyrenia antecellens 1 1
Rinodina exigua 1 1 1
Physcia biziana 1 1 1 1 1
Physcia hirsuta 1
Arthopyrenia punctiforrnis 1 1 1
Candelariella xanthostigrna 1 2 3 1
Parmelia exasperatula 1 4 4 3 1
Candelariella reflexa 3 2 1
Physcia vitii 1 1 1 1
Parmelia subrudecta 2 1 2 Normandina pulchella 1 1
Arthonia radiata 2 2 3 4
Lecidella elaeochrorna 3 3 4 3 2 Hyperphyscia adglutinata 1 2 3 4
Physcia adscendens 1 5 3 2 Physcia tenella 4 5 5 5 3
Tab.3: Frequency vectors of the five station f5fOUps obtained by numerica! classification of the matrix of species and stations relative to the province of Treviso. Numbers refer to 5 frequency classes, with intervals of 20 % each.
35

Fig. 9: rnap of the province of Treviso, with the location of the sarnpling stations.
36

IO
:o � �
...
I I
l,; �
o
�D i � $2 I
I\ V
CO CO ('I)
o
Fig. 10: I.A.P. map of the province of Treviso. The province has been subdivided into several zones, characterized by different I.A.P. values.
37

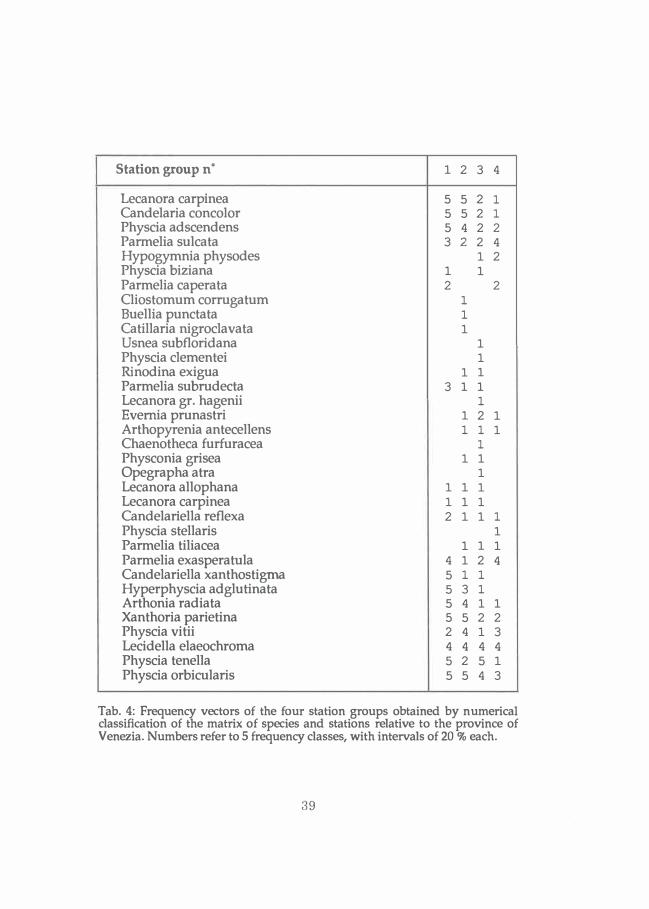
Province of Venezia
The province of Venezia occupies most of the coastal part of the region; it has an area of 2.460 km2, and a population of 833.600 inhabitants, with a density of 338 inhabitants/km2• All of the provincia! territory is below 100 m. In the Mestre-Marghera area, dose to Venice, there is one of the largest industrial agglomerations of ltaly, with a prevalence of chemical industry. Another industrial area, of much smaller size, is located near Portogruaro (see fig. 11).
In this province only 34 species have been recorded; the number of sporadic species, however, is rather low in comparison with other species-poor provinces. The most frequent species are: Physcia orbicularis (80 % of the stations), Physcia tenella (75 %), Lecidella elaeochroma (67 %), Candelaria concolor (53 %), Lecanora carpinea (50 %). AH of them are more or less ;inked to Xanthorion vegetation. The numerica! classification of the 56 stations produced 4 main groups, which are reported in tab. 4. The groups of stations 1 and 2 are very similar, and are characterized by the high frequency of Lecanora carpinea, Candelaria concolor, Physcia adscendens, Hyperphyscia adglutinata, Arthonia radiata and Xanthoria parietina: they represent relatively well developed Xanthorion stands; group 1 differs from group 2 in the higher frequency of Parmelias, such as P. caperata, P. sulcata. P. subrudecta, P. exasperatula. The groups of stations 3 and 4 have no clear differential species: they are characterized by having, in general, lower frequencies for most species, and represent impoverished Xanthorion stands; group 4 differs from group 3 in the higher frequency of some acidophytic species, such as Parmelia sulcata, Hypogymnia physodes, Parmelia exasperatula, and represent an impoverished Xanthorion vegetation in which secondary acidification by air pollution starts to become evident (most of these stations are located near industria! areas or large urban settlements).
Tha I.A.P. map (fig. 12) shows a marked difference between the eastern and western parts of the province. The eastem part is characterized by relatively high I.A.P. values (mostly between 30 and 50) indicating a moderate degree of air pollution; an exception is given by an area south of Portogruaro, corresponding to an industria! agglomeration, where there is even a small lichen desert, and which extends its influence to the easternmost part of the province. On the contrary, in the western part of the province the I.A.P. values are mostly lower than 20. An extended lichen desert occurs soutwest of the huge industria! agglomeration of Marghera, which is certainly the most important pollution source. lts effects extend to the Lido of Venice, and most probably also to the provinces of Padova and even Rovigo. The only areas which are relatively less polluted are the surroundings of Chioggia, in the southern part of the province, along the coasts.
38
Station group n o
1 2 3 4
Lecanora carpinea 5 5 2 1
Candelaria concolor 5 5 2 1
Physcia adscendens 5 4 2 2 Parmelia sulcata 3 2 2 4
Hypogymnia physodes 1 2 Physcia biziana 1 1
Parmelia caperata 2 2 Cliostornurn corrugaturn 1
Buellia punctata 1
Catillaria nigroclavata 1
Usnea subfloridana 1
Physcia clernentei 1
Rinodina exigua 1 1
Parmelia subrudecta 3 1 1
Lecanora gr. hagenii 1
Evemia prunastri 1 2 1
Arthopyrenia antecellens 1 1 1
Chaenotheca furfuracea 1
Physconia grisea 1 1
Opegrapha atra 1
Lecanora allophana 1 1 1
Lecanora carpinea 1 1 1
Candelariella reflexa 2 1 1 1
Physcia stellaris 1
Parmelia tiliacea 1 1 1
Parmelia exasperatula 4 1 2 4
Candelariella xanthostigrna 5 1 1
Hyperphyscia adglutinata 5 3 1
Arthonia radiata 5 4 1 1
Xanthoria parietina 5 5 2 2 Physcia vitii 2 4 1 3 Lecidella elaeochrorna 4 4 4 4
Physcia tenella 5 2 5 1
Physcia orbicularis 5 5 4 3
Tab. 4: Frequency vectors of the four station groups obtained by numerica! classification of the matrix of species and stations relative to the province of Venezia. Numbers refer to 5 frequency classes, with intervals of 20 % each.
39

Fig. 11: map of the province of Venezia, with the location of the samalingstations.
40

o o v
I I
�
in
"i r ....
i;; ....
o
io o in
<D "
o
io o
Il) in
N
� o N
:E ��
5!
Il)
o
(<l
Fig. 12: I.A.P. map of the province of Venezia. The province has been subdivided into several zones, characterized by different I.A.P. values.
41

Province of Padova
The province of Padova has a surface area of 2.142 km2, and a population of 818.650 inhabitants, with a density of 382 inhabitants/km2, the highest within the region.
Most of the provincia} territory (94.2 %) is below 100 m, with the exception of its southwestern part, west of Monselice (5.8 %), that is occupied by a chain of low hills (Colli Euganei). There is intense agricultural activity throughout the province, while most of the industries are concentrated around the city of Padova and along the highways connecting Padova with Monselice (see fig. 13).
This is a very species-poor province, with 27 species, most of which have been recorded only within a few of the 75 stations. The most frequent species are Physcia tenella, Physcia orbicularis and Lecidella elaeochroma, which occur in more than 50 % of the stations, followed by other Xanthorion species such as Candelaria concolor, Xanthoria parietina, Candelariella reflexa and Lecanora chlarotera, occurring in more than 20 % of the stations.
The numerica} classification of the stations produced 4 main groups, reported in tab. 5. The groups have a very sirnilar floristic composition, differing chiefly in the presence of a set of acidophytic species such as Parmelia sulcata, Evernia prunastri, Hypogymnia physodes, Parmelia exasperatula, Pseudevernia furfuracea, Usnea subfloridana, and Lecanora conizaeoides, their frequencies decreasing from group 1 to group 4, whereas nitrophytic species such as Physcia orbicularis, Candelaria concolor, Xanthoria parietina, Candelariella reflexa, Hyperphyscia adglutinata and Physcia adscendens have an apposite behavior. This may reflect the opposing effects on lichen vegetation of the secondary acidification of the bark in heavily polluted areas, and of the eutrophication due to agricultural activity.
The I.A.P. map of the province is shown in fig. 14. In generai, the I.A.P. values are low, which indicates a moderate to high air pollution. The northem part of the province, and part of the Colli Euganei east of Monselice, are the only areas with I.A.P. values higher than 20. This is well in accordance with the direction of the winds which prevail over the city of Padova; they are mostly corning from the north (see fig. 2), and transport southwards the pollution produced by Padova and its industriai area. The srnall areas with I.A.P. values lower than 20, located in the northem part of the province, reflect the influence of the neighbouring towns of Bassano (Vicenza) and Castelfranco Veneto (Treviso) and of their industriai areas, both located north of the province of Padova.
The effects of the large industriai agglomeration surrounding the city of Padova are evident in the pronounced lobe of lichen desert running in a N-S
42

Station group n°
1 2 3 4
Pannelia sulcata 2 2 1
Evernia prunastri 2 2 1
Hypogymnia physodes 1 1 1
Pannelia exasperatula 4 2 2 2 Pseudevernia furfuracea 1
Lecanora carpinea 1 1 1
Xanthoria fallax 1
Usnea subfloridana 1 1
Pannelia subrudecta 1 1 1
Physconia distorta 1
Lecanora allophana l
Lecanora conizaeoides 1
Lecanora gr. hagenii 1 1 1
Arthonia radiata 1 1 2 Candelariella xanthostigma 1 1 1 2 Physcia biziana 1 1
Physcia vitii 1 1 1 1
Physconia grisea 1 1 1
Physcia adscendens 1 1 1 3 Hyperphyscia adglutinata 1 1 1 2 Lecanora chlarotera 2 1 2 3 Candelariella reflexa 1 1 1 4
Xanthoria parietina 2 2 2 4
Candelaria concolor 2 1 2 5 Lecidella elaeochroma 4 2 2 3 Physcia orbicularis 3 2 5 5 Physcia tenella 5 5 5 5
Tab 5: Frequency vectors of the four station groups obtained by numerica! classification of the matrix of species and stations relative to the province of Padova. Numbers refer to 5 frequency classes, with intervals of 20 % each.
direction, towards the province of Rovigo, which starts immediately south of Padova. A chain of hills (Colli Euganei) marks the western lirnit of this desert area; these hills act as a barrier to the dispersion of pollutants towards the southwest by the main winds (see fig.2); the barrier effect is evident in the southernmost portion of the province, where the absence of hills allows a much wider extension of the desert area towards the west. Considering the main wind directions shown in fig.2, it is probable that the pollutants ernitted in the province of Venezia, and particularly in the large industria! area of Marghera, also contribute to the pollution stream flowing towards the province of Rovigo.
43

Fig. 13: map of the province of Padova, with the location of the sampling stations.
44

KM
o 5 10 15
i6-10
20 25 30
11-15 16-20
D26-30
>30
Fig. 14: I.A.P. map of the province of Padova. The province has been subdivided into several zones, characterized by different I.A.P. values.
45

Province of Vicenza
The province of Vicenza has a surface area of 2.722 km2, and a
population of 741.200 inhabitants, with a density of 238 inhabitants/krn2• The centra! and northern parts of the province (47. 4% of the total surface), up to a line connecting Bassano and Schio, are below 100 m; its northem part (38.9 %) is occupied by a narrow belt of hills followed by a vast plateau with peaks reaching 1600 m. A srnall portion of the Lessinian Mountains occupies the central-westem part of the province, west of Schio (13.7 % of the territory). The agricultural and industria! activities are very intense throughout the lowlands; the industries are generally scattered, with some rnain agglomerations around Vicenza. An important power station is located near Montorso, SW of Vicenza (see fig. 15).
This is the province with the highest number of recorded species (66). The most frequent are:Physcia tenella (85 % of the stations), Physcia orbicularis (82 %), Candelaria concolor (74 %), Lecidella elaeochroma (74 %), Xanthoria parietina (55 %) and Candelariella reflexa (52 %). This indicates a prevalence of Xanthorionvegetation. The numerica! classification is based on the 90 stations not reported in the prelirninary survey (Nirnis et al. 1991); it produced 7 main groups, which are reported in tab. 6. Group 1 includes only 4 stations, which differ markedly from all others in the high frequency of acidophytic species such as Evernia prunastri, Hypogymnia physodes, Usnea gr. subfloridana, Pseudevernia furfuracea, Parmeliopsis ambigua, Scoliciosporum chlorococcum, Lecanora symmicta etc., and in the low frequency of nitrophytic Xanthorion species: the relevés of this group, representing a Parmelion- vegetation, have all been taken on the hills north of Vicenza and on the Asiago Plateau, in a relatively undisturbed, pollution-free area. The group of stations 7 is also well characterized by the higher frequency of crustose lichens, such as Lecanora carpinea, Caloplaca holocarpa, C. cerina, C. flavorubescens, and Lecanora hageni, and represents a pioneer cornrnunity leading towards Xanthorion vegetation. The other relevé groups have only slight floristic differences, and rnight be considered as different facies of Xanthorion vegetation.
As far as the distribution of the I.A.P. values is concerned (fig. 16), the province of Vicenza is characterized by marked differences. A true lichen desert is present only in the urban area of Vicenza, and dose to an industria! area south of Thiene. Other areas with low I.A.P. values are located south of Bassano and near Montorso, in correspondence with two industria! zones. The highest I.A.P. values (more than 70) are reached on the Asiago Plateau and on the Lessinian Mountains. Also the areas lying east and south of Vicenza have relatively high I.A.P. values (30-50), which rnight be related to the prevailing northeasternwinds. A much more detailed I.A.P. rnap of the Schio-Breganze area has beenpublished by Nirnis et al. (1991).
46

Station group n' l 2 3 4 S 6 7
Physconia grisea 2 l S s 2 l Hypelhysda adglutinata 2 3 S 4 l l 3 Parme · a exasperatula s 2 4 3 4 4 Candelariella xanthostigma s l s l l 2 s Xanthoria cfuarietina 3 4 s 3 2 2 s Physda a scendens 4 2 4 2 l 2 S Physda aipolia 2 l l l 4 Lecanora chlarotera 2 2 S 4 l 2 S Lecanora carpinea 4 l l l s Hypo� physodes 4 l l 2 2 Everrua prunastri 4 l l l Usnea subfloridana s l Parmelia sulcata s l 2 1 3 S Cltaenotheca furfuracea 3 l l 2 2 Parme!ia subaurifera 2 l Parmelia acetabulum 2 l Parmelia tiliacea 3 l 1
�sconia distorta 3 l l 1 3 op!aca holocarpa l 4 Caloplaca cerina 1 s Lecanora gr. hagenii 1 2 l 4 Ramalina fastigiata 2 Leddella flavosorediata 2 Physda stellaris 3 l l l 4 Xanthoria fallax 2 1 l 1 2 Physda hirsuta 2 l 1 l Physda biziana l S 1 1 2 l Parmelia subrudecta 1 l 1 l Pseudevernia furfuracea 4 l l Parme!iopsis ambigua 2 Bryoria furcellata 2 Lecanora subfuscata l l l Arthopyrenia punctiformis 2 1 1 1 l 2 Pannella exasperata 1 1 Normandina pulchella 1 Graphis scripta 1 l 1 Parmelia caperata 2 l 1 l Calili
!aca flavorubescens 1 2 Bue ·a punctata 1 Physconia enteroxantha 1 Physconia detersa 1 Sco!idosporum chlorococcum 2 Lecanora =eta 2 Rama!ina arinacea 1 Pertusaria amara 1 Parmelia saxatilis 1 Parme!ia quercina l
�gr'%ha atra 1 ero ermia speciosa 1 Oiostomum corrugatum 1 Arthrosporum accline 1 1 Catillaria nigroclavata 1 Candelariella lu !ella 2 3 Anapt chia dliaris 1 Parmeha subargentifera 2 1 1 1 Nectriacea sp. l 1 l 1 Parmelia glabra 1 1 Physda vitii 2 2 1 1 l Arthopyrenia antecellens 1 2 1 1 2 2 Arthonia radiata 3 2 3 l 1 2 Rinodina exigua 1 1 1 2 2 Candelariella ref!exa 2 2 S 2 3 4 S Lecidella elaeochroma 3 4 S 2 4 s s Physda orbicularis 3 s s S 4 s Candelaria concolor 3 s S 4 2 4 s Physda tenella 4 S S 4 S S 4
Tab. 6: Table of species and station groups obtained by classification of the data relative to the province of Vicenza. Numbers refer to 5 frequency classes of20% each.
47

Fig. 15: rnap of the province of Vicenza, with the location of the sarnpling stations.
48

N.
KM o*,
o 5 10 15 20
<10 11-15 16-20 21-3 0 31-35 36-4
- - D
41-50 51-60 61-70 >70
Fig. 16: I.A.P. rnap of the province of Vicenza. The province has been subdivided into several zones, characterized by different I.A.P. values.
49

Province of Verona
The province of Verona has a surface area of 3.096 km2, and a population of 741.244 inhabitants, with a density of 272 inhabitants/km2. Most of the provincia! territory (79.7 %) is occupied by lowlands, 16.1% by hills, and only 4.2% by mountains, located in the northem part of the province.
This is a species-rich province, with 56 species recorded. The most frequent ones are Physcia tenella (87 % of the stations), Physcia orbicularis (74 %),
Lecidella elaeochroma (62 %), Candelariella reflexa (59 %), Xanthoria parietina (57 %),
Parmelia exasperatula (51 %). With the exception of the latter, all of them are linked to Xanthorion vegetation. The numerica! classification of the 118 stations produced 5 main groups, that are shown in tab. 7. Groups 1 and 2 have the highest species richness, and represent very well developed Xanthorion stands; the relevés have been taken in relatively undisturbed, pollution-free areas on the hills north of Verona; the group of stations 1 differs in the higher frequency of some Parmelion-species, such as Parmelia quercina, P. tiliacea, P. sulcata, P. pastillifera, Pseudevernia furfuracea, Usnea subfloridana, and represents a transition towards Parmelion-communities. The remaining three station groups are more species-poor, and show only slight compositional differences: they can be interpreted as three different facies of impoverished Xanthorion stands in more polluted areas; in particular, group 4 is characterized by the higher frequency of some acidophytic species, such as Parmelia sulcata, Usnea subfloridana. Hypogymnia physodes, Lecanora conizaeoides, Parmelia exasperatula, which indicates a secondary acidification of the bark due to air pollution, whereas group 5 is very species-poor, and the only constant species is Physcia tenella.
The I.A.P. map (fig. 18) shows wide differences within the provincia! territory. The areas with the highest I.A.P. values (higher than 40 with single values reaching 70) are on the Lessinian Mountains, in the northem part of the province. An extended lichen desert occurs south of Verona; this city is located at the centre of a belt running in a E-W direction, characterized by I.A.P. values lower than 20; this belt includes the main highways connecting Verona with Vicenza eastwards, Mantova soouthwestwards and Brescia eastwards: along these highways there is a diffuse settlement of industria! activities. The dispersa! of pollution east- and westwards from Verona agrees very well with the directions of the prevailing winds, as shown in fig. 2. The northern winds from the Adige Valley are responsible of the pronounced pollution lobe south of Verona, and the lower part of the Adige valley is also interested by pollution phenomena. Another belt with I.A.P. values mostly ranging between 20 and 30,
separates this area from the southem part of the province where air pollution tends to worsen, with some areas of lichen desert occurring in its southernmost portion. In this case the pollution is allochtonous, deriving from sources located mainly in the province of Padova.
50

Station group n· 1 2 3 4 5
Lecidella elaeochroma 5 5 3 4 2
Canqelaria concolor 5 5 4 2 1
Physcia aiP.?lia 5 4 1 1 1
Candelariella vitellina 4 3 2 2 1
Physcia stellaris 4 2
Candelariella xanthostigma 3 1 1 1
Rinodina exigua 1 1 1 1
Physcia biziana 2 2 2 2 1
Physcia vitii 1 1 1 2
Parmelia exasperata 2 1
Parmelia quercina 2 1
Parmelia liliacea 4 1 1 1
Parmelia subargentifera 3 2
Parmelia acetaoulum 1 1 1
Parmelia sulcata 4 1 1 2 1
Parmelia glabra 2
Arthohyrenia antecellens 2 1
Calop aca cerina 3 2 1
Chaenotheca furfuracea 1
Parmelia pastillifera 2 1
Pseudevernia furfuracea 2
Catillaria nigroclavata 1
Nectriacea sp. 1
Parmelia caperata 1
Collema n�scens 1
Usnea sub oridana 2 1
Scoliciosporum chlorococcum 1
HFo
o�nia bitteriana 1
C op aca ferru�inea 2 1
Parmelia glabra ula 1
Evernia prunastri 1 1
Lecanora subfuscata 3 2 1 1
Hypogymnia_ phys_odes 2 1 1 2 1
Lecanora coruzaeo1des 1
Parmelia subrudecta 2 1 1 3 1
Caloplaca flavorubescens 1 1 1
Caloplaca holocarpa 1 1
Arthonia radiata 2 2 1
Physconia enteroxantha 1
Xanthoria fallax 3 2 1 1
Physconia perisidiosa 1
Physconia aistorta 3 2 1 1 1
Lecanora allol\éhana 3 3 1 1 1
Lecanora gr. agenii 3 3 2 2 1
Parmelia exasperatula 5 3 2 4 2
Lecanora chlarotera 5 4 2 2 1
Lecanora carpinea 5 4 1 1
Physcia adscendens 5 5 3 3 2
Xanthoria �arietina 3 5 4 3 2
Candelarie la reflexa 5 4 4 3 1
Hfuperpl}ysci!l adglutinata 3 4 2 1 1
P yscoma �sea 2 1 2 3 1
Physcia tenella 5 3 5 5 5
Physcia orbicularis 3 5 5 4 2
Tab 7: Table of species and station groups obtained by classification of the data relative to the Province ofVerona.
51

Fig. 17: map of the province of Verona, with the location of the sampling stations.
52

<5 6-10 11-15 16-20 2 1-25 26-30 31-40
41-50 51-60 61-70 >70
KM
o 5 10 15 20 25 30
Fig. 18: I.A.P. map of the province of Verona. The province has been subdivided into severa! zones, characterized by different I.A.P. values.
53
Province of Rovigo
The province of Rovigo occupies the southwestem portion of the region; it has a surface area of 1789 km2, and a population of 250.000 inhabitants, with a density of 139 inhabitants/km2.
All of the province is occupied by lowlands, and the provincia} territory is mainly exploited by intensive agriculture. Natural or seminatura} vegetation are present only in a few coastal sites and along the main watercourses.
This is the province where the lowest number of species has been recorded (23 species); the most frequent are Physcia tenella and Lecidella elaeochroma, that occur in more than 50 % of the stations, followed by Parmelia exasperatula (30%), Physcia orbicularis (25 %) and Physcia adscendens (25 %).
Strongly nitrophytic and neutro-basiphytic species, such as Candelaria concolor, Hyperphyscia adglutinata, Candelariella reflexa and Physconia grisea are much less frequent in this province than in other lowland areas of the region with intense agricultural activity.
The classification of the 52 stations produced 5 main groups, reported in tab. 8: they all represent different, not very well characterized facies of Xanthorion vegetation, which indicates that the eutrophication of the bark due to agricultural activity dccurs also in this province. However, the scattered occurrence of rather anitrophytic and acidophytic species, such as Parmelia sulcata, P. exasperatula, Hypogymnia physodes, Usnea subfloridana and Lecanora conizaeoides, the latter being more frequent within larger settlements, is an indication of the fact that the high pollution values reached in this province tend to produce a secondary acidification of the bark, counterbalancing the effects of eutrophication .. Of all the groups of stations, group 1 is characterized by a very low species frequency, and represents impoverished stands in very polluted areas.
The province of Rovigo has the worst air quality values within the region. Almost ali of its territory has I.A.P. values lower than 20 (see fig. 20).
The most polluted area (I.A.P. lower than 3, mostly lichen desert) is a 4-20 km wide belt, which crosses the surroundings of Rovigo in a SW-NE direction. Smaller lichen desert areas are located east of Sermide, in Emilia, and of Villanova Marchesana. A small area with I.A.P. higher than 20 is present in the northern coastal area, near Rosolina.
Near the coasts there is also one of the largest power stations of Italy. Considering the main directions of the winds, as shown by fig. 2 and by the generai pollution map (fig. 21 ) it is probable that the effects of this power station are not particularly strong within the provincial territory. The main winds should transport the pollution in a southwestern direction, towards the region Emilia-Romagna (province of Ferrara), that borders the province of Rovigo to the east. A recent study on lichens as bioindicators in the province of Ferrara
54

Station group n·· 1 2 3 4 5
Parmelia tiliacea 1
Candelariella :xanthostigma 1 1
Candelaria concolor 1
Parmelia sulcata 1 1 1
Arthonia radiata 1
Usnea subfloridana 1 1 1
Arthopyrenia antecellens 1 1 1
Lecanora carpinea 1 1
Lecanora gr. hagenii 1 1
Parmelia exasperatula 1 2 2 2 2
Evernia prunastri 1 1 1 2
Hyperphyscia adglutinata 1
Candelariella reflexa 1 1
Parmelia subrudecta 1 1 3 2
Hypogymnia physodes 1 2 1 1
Physconia grisea 1
Xanthoria parietina 2 1 1 3 Lecanora chlarotera 2 2 3 Physcia orbicularis 1 1 1 2 4
Physcia adscendens 2 2 2 1 2
Lecanora conizaeoides 1 2 1 1
Lecidella elaeochroma 5 2 2 5 4
Physcia tenella 1 5 3 5 5
Tab. 8: Frequency vectors of the five station groups obtained by numerica! classification of the matrix of species and stations relative to the province of Rovigo. Numbers refer to 5 frequency classes, with intervals of 20 % each.
(Piccoli et al. 1989) shows that in this province there are high pollution levels, the lichen flora being represented by only a few species.
Since the main economie activity in this province is intensive agriculture, it is probable that most of the air pollution is allochtonous, deriving from the industria! areas of the provinces of Padova, Venezia and perhaps also Ferrara. This hypothesis is confirmed by the general pollution pattern at a regional scale (fig. 21) and by the main wind directions in the low plains (fig. 2). In the province of Rovigo the effects of phytotoxic pollutants may be further enhanced by the frequent persistence of fog during winter.
55

Fig. 19: map of the province of Rovigo, with the location of the sampling stations.
56

o
N
o N
2 � :i,,:
�
lii �o o
CO
li.I CO
·*· �-Fig. 20: I.A.P. map of the province of Belluno. The province has been subdivided into severa} zones, characterized by different I.A.P. values.
57

<5 IHO 11-20
o 31-50 51-70 >111
O 10 20 30 40 50
""'
Fig. 21: I.A.P. map of the entire Region of Veneto. The regional territory has been subdivided into 7 zones, characterized by different I.A.P. values.
58

The I.A.P. map of the Region of Veneto
The I.A.P. map of the entire region is reported in fig. 21. The survey area has been subdivided into 7 zones, each with different pollution levels. The estimation of pollution levels by SO2 is based on the correlations between direct pollution data and values of the I.A.P. index obtained in the study carried out at La Spezia (Nimis et al. 1990). In the following, each zone is briefly discussed. Zone A (red colour) - air pollution: high. It includes the area with I.A.P. values ranging between O (lichen desert) and 5. From the results obtained at La Spezia these values should correspond to yearly mean values of the 98th percentiles of SO2 higher than 84 µg/m3, yearly means of the 50th percentiles higher than 17 µg/m3, and winter means of the 50th percentiles higher than 27.7 µg/m3. In parts of this zone these values are probably higher, but cannot be revealed by the I.A.P. for the obvious reason that this zone includes also the lichen desert. This zone has a surface of 1.383 km2, corresponding to 6.28 % of the entire region. The areas with the worst air quality include the surroundings of the industriai agglomeration of Marghera, a large part of the province of Padova, the greatest part of the province of Rovigo, and the surroundings of the city of Verona. Zone B (bright orange) - air pollution: moderate. It includes the areas with I.A.P. values ranging from 6 to 10, corresponding to yearly mean values of the 98th percentiles of SO2 ranging between 76 and 84 µg/m3, yearly means of the 50th percentiles ranging from 15.6 to 16.8 µg/m3, and winter means ranging from 25.2 to 27.6 µg/m3. This zone has a surface of 1624 km2, corresponding to 7.45 % of the entire region. It tends to occupy a narrow belt all around the areas classified as zone A. It includes the centre of Treviso and its industriai area, a small industrial area in the eastem part of the province of Venice (near Portogruaro) and the centre of Vicenza. Zone C (light orange) - air pollution: rather low. It includes areas with I.A.P. values ranging from 11 to 20, corresponding to yearly mean values of the 98th percentiles of SO2 ranging from 61 and 75 µg/m3, yearly means of the 50th percentiles ranging from 13.2 and 15.5 µg/m3, and winter means ranging from 22.7 to 25.1 µg/m3. This zone has a surface of 3877 km2, corresponding to 17.6 % of the entire region. It is particularly extended in the provinces of Venezia, Padova, Rovigo and Verona, it includes narrower areas in the provinces of Treviso and Vicenza, and the centre of the town of Belluno. Zone D (yellow) - air pollution: low. It includes areas with I.A.P. values ranging from 21 to 30, corresponding to yearly mean values of the 98th percentiles of SO2
ranging from 46 to 60 µg/m3, yearly means of the 50th percentiles ranging ranging from 13.1 to 10.7 µg/m3, and winter means ranging from 17.7 to 22.6 µg/m3. This zone has a surface of 5150 km2, corresponding to 23.4 % of theentire region. lt extends over wide areas of the Venetian Plains, except their
59

eastem parts, and surrounds the areas included into the belts A-C, occupying also the southern part of the province of Belluno. Zone E (light green) - air pollution: very low. It includes the areas with I.A.P. values ranging from 31 and 50, corresponding to yearly mean values of the 98th percentiles of S02 ranging from 17 to 45 µg/m3, yearly means of the 50th percentiles ranging from 5.8 and 10.6 µg/m3, and winter means ranging from 12.7 to 17.6 µg/m3. This zone has a surface area .of 5917 km2, corresponding to 28.9 % of the entire region. It occupies the largest part of the eastern section of the Venetian Plain, the outer part of the dealpine hills, and restricted portions of the provinces of Verona, Vicenza and Padova. It extends over a large portion of the province of Belluno. Zone F (dark green) - air pollution: negligible. It includes the areas with I.A.P. values ranging between 51 and 70, corresponding to yearly mean values of the 98th percentiles of S02 ranging from 5 and 16 µg/m3, yearly means of the 50th percentiles ranging from 0.94 to 5.7 µg/m3, and winter means ranging from 2.71 to 12.6 µg/m3. This zone has a surface area of 3661 km2, corresponding to 16.6 % of the entire region. It mainly extends over mountain areas, such as the Lessinian Mountains, the Asiago Plateau and the Dolomites in the province of Belluno. Zone G (blue) - air pollution: practically absent. It includes areas with I.A.P. values higher than 70, corresponding to yearly mean values of the 98th percentiles of S02 lower than 5 µg/m3, yearly means of the 50th percentiles lower than 0.94 µg/m3, and winter means lower than 2.71 µg/m3. This zone occupies a narrow surface of 396 km2, corresponding to 1.8 % of the region. It
covers exclusively mountain areas, such as parts of the Lessinian Mountains, of the Asiago Plateau, and of the Dolomites.
In summary, the air pollution by S02 in the territory of the Veneto Region is as follows: - in 6.3 % of the region there is a risk of high pollution levels (lichen desertareas).- 25 % of the territory has a moderate air pollution (zones A-C).- 23.38 % of the territory has a low air pollution (zone D).- 44. 93 % of the territory has a very low air pollution (zones E-G).
The southwestem part of the region has the highest pollution levels; it includes vast parts of the provinces of Rovigo, Padova and Venezia. The northern and eastern parts of the region have a better situation. By comparing the map of fig 21 with the direction of the prevailing winds (fig.2) it is evident that the pollution pattems shown by the map are well in accordance with the location of the main pollution sources (Mestre-Marghera, Padova, Verona etc.) and with the directions of the main winds. In particular, in the southem plains, the main transport is in a NE-SW direction, from Mestre towards the province of Rovigo.
60

CondeUorio concolor
Fig. 22: distribution map of Candelaria concolor in the Region of Veneto, obtained by automatic processing of its frequency data in the 662 stations.
Condeloriello xonthostigmo
Fig. 23: distribution map of Candelariella xanthostigma in the Region of Veneto, obtained by automatic processing of its frequency data in the 662 stations.
61

Hypogymnio physodes
Fig. 24: distribution map of Hypogymnia physodes in the Region of Veneto, obtained by automatic processing of its frequency data in the 662 stations.
Pormelio exosperotulo
Fig. 25: distribution map of Pannelia exasperatula in the Region of Veneto, obtained by automatic processing of its frequency data in the 662 stations.
62

Pormelio sulcoto
Fig. 26: distribution map of Pannelia sulcata in the Region of Veneto, obtained by automatic processing of its frequency data in the 662 stations.
Physcio odscendens
Fig. 27: distribution map of Physcia adscendens in the Region of Veneto, obtained by automatic processing of its frequency data in the 662 stations.
63

Physcio orbiculoris
Fig. 28: distribution map of Physcia orbicularis in the Region of Veneto, obtained by automatic processing of its frequency data in the 662 stations.
Xonthorio porietino
Fig. 29: distribution map of Xanthoria parietina in the Region of Veneto, obtained by automatic processing of its frequency data in the 662 stations.
64

Distribution pattems of selected species
The matrix of the stations and species constitutes an interesting database for phytogeographic studies. For each species, data on its average frequency within each station are available. These can be processed by the same programs utilized to obtain the I.A.P. maps. The result is a series of distribution maps that, contrary to the currently used dot-maps, show not only the presence-absence of a given species within an area, but also its frequency distribution. It should be stressed that our data set does not refer to the complete distribution of the species within the survey area, since the substrate is limited to Tilia-boles. However, the restriction to one type of substrate only permits an easier interpretation of the maps, by excluding other edaphic factors that might influence the distribution of a given species. Distribution maps have been drawn for all species occurring in our data set. Por reasons of space, in the following we report only the maps of eight selected species. They are briefly cornrnented on in the following.
Candelaria concolor - This species, which is very cornrnon throughout Italy below the montane vegetation belt, is a typical element of Xanthorion vegetation. In north eastern Italy it has the optimum within the Physcietum elaeinae (Nimis & De Faveri 1981), a nitrophytic and heliophytic lichen cornrnunity on eutrophic or eutrophiated bark, and it is often associated with Hyperphyscia adglutinata in areas with intense agricultural activities. According to Hawksworth & Rose (1970), when on eutrophic bark Candelaria concolor tolerates concentrations of SO2 up to 40 µg/m3• Also Laundon (1973), De Wit (1976) and Deruelle (1983) cite this species as rather sensitive to air pollution in the British Isles, in Holland, and in northwestern France, respectively. Barkman (1958) attributes to this species a rather high poleophoby for the town of Oslo. In ali of these cases the species is near to its northern distributional limits. A study by Sergio & Bento-Pereira (1981) demonstrates, on the contrary, that in Lisboa (Portugal) Candelaria concolor is one of the most tolerant lichens towards air pollution. A good resistance to air pollution has also been reported by Nimis (1985, 1986, 1990b) for the towns of Udine, Trieste and Rome.
The distribution map of Candelaria concolor in the Veneto Region (fig. 22) shows that this species has its optimum in the high plains, on the hills and on the lower mountains of the pre-Alps. It tends to decrease both in the relatively unpolluted mountain areas of the province of Belluno, and in the highly polluted parts of the southwestern plains. On a larger scale, this is the same behavior reported by Nimis et al. (1991) for the northem part of the province of Vicenza, and reflects both the moderately high tolerance of this species to air pollution, and its preferrence for eutrophiated substrata.
65

Candelariella xanthostigma - In Italy this species is widespread from the montane zone to the lowlands; in the South, however, it is mostly restricted to the mountains. There are only a few data on its tolerance to air pollution, particularly because it has been frequently confused with other congeneric species. Skye (1968) considers it as moderately sensitive to air pollution in Stockholm, and De Wit (1976) lists it under the rather pollution-intolerant species. Data from Italy (Nimis 1985, 1990b, Nimis et al. 1991) indicate that in this country Candelariella xanthostigma is rather poleophobic, and tends to be absent or rare within urban settlements and/or in heavily polluted areas.
The distribution map of Candelariella xanthostigma in the survey area (fig. 23) shows a distribution pattern similar to that of Xanthoria parietina and Physciaadscendens, with the difference that Candelariella xanthostigma seems to be morerestricted to the relatively unpolluted mountain areas. It might also be thatelevation plays a role in determining its distribution pattern within the region.
'
Hypogymnia physodes - This species is common throughout Italy from the lowlands (where it is less frequent) to the subalpine vegetation belt. It has a very wide ecological amplitude, being most frequent in communities growing on acid to subacid bark. According to Jiirging (1975) its optimal pH is around 4.5. This species is one of the most frequently cited as an example of a pollution-tolerant lichen. The upper tolerance limits to S02 concentrations reported in the literature are 70-100 µg/m3 (Hawksworth & Rose 1970, British Isles), 75 µg/m3 (Tiirk & Christ 1986, Vienna), and 125-150 µg/m3 (Crespo et al. 1981, winter means, Spain). Data from ltaly (Nimis 1985, 1986) show that this species can penetrate up to the limits of the lichen desert only in areas with a relatively humid climate, while in drier areas it seems to be rather poleophobic, probably because of the "drought effect", i.e. the drier microclimate of large urban areas.
The map of Hypogymnia physodes in the survey area (fig. 24) shows a disjunct distribution: the optimum is in the relatively unpolluted mountain areas with low agricultural activity; this species, which is mostly absent from the northern plain, reappears, with much lower frequency, around the most polluted areas of the low plains. This distribution seems to be conditioned essentially by the availability of acid substrates, which are present in the mountains (no or scarce eutrophication) and around the lichen desert areas (secondary acidification by pollution).
Parmelia exasperatula - This lichen, which is common throughout Italy, from the lowlands to the subalpine vegetation belt, has a wide ecological amplitude, being a common element of heliophytic lichen communities both on moderately eutrophiated and acidic bark. According to Jiirging (1975) its pH optimum is around 5.2, and Wirth (1980) claims that it can stand a rather strong
66

eutrophication of the bark. According to Hawksworth & Rose (1970) Pannelia exasperatula does not tolerate mean concentrations of SO2 higher than 50 µg/m3. De Wit (1976) lists this species as rather sensitive to air pollution in Holland and Skye (1968) claims that it is very sensitive in the surroundings of Stockholm. Data from Italy (Nirnis 1985, 1986, Nirnis et al. 1991) show that, at least in the north of the country, this species can penetrate up to the margins of the lichen desert.
The distribution map of Pannelia exasperatula in the Veneto Region (fig. 25) shows that its optimum is in the relatively unpolluted areas of themountains. It tends to decrease both in the intensely cultivated high plains, andin the very polluted areas of the low plains. Also in this case, the behavior seenon a large scale very much resembles that reported by Nirnis et al. (1991) for thenorthern part of the province of Vicenza. This distribution pattern is very sirnilarto that of Candelariella xanthostigma.
Parmelia sulcata - This is one of the most widespread and cornrnon lichens world wide. In Italy it occurs from the lowlands to the subalpine belt, and is a frequent member of severa} lichen cornrnunities, mostly on subacid to acid bark. Its pH optimum, according to Jiirging (1968) is of 5.2. In northern Italy it is rather photophytic at high elevations, rather skiophytic in the lowlands, where it is mostly confined at the northern side of isolated trunks. This species appears to be able to tolerate rather high pollution levels; the following upper lirnits are available in the literature: 80 µg/m3 (Seaward & Hitch, 1982, British Isles), from 60 to 125 µg/m3 (Crespo et al., winter means, Spain), 70 µg/m3 (Deruelle 1977, northern France). Data from northern Italy (Nirnis 1985, 1986) indicate that Pannelia sulcata is able to thrive up to the lirnits of the lichen desert in areas with rather hurnid climate conditions.
The distribution map of Pannelia sulcata in the Veneto Region (fig. 26) shows a rather peculiar pattern: this species is most frequent in the relatively unpolluted mountain areas of the provinces of Belluno and Vicenza; it is absent both from the high plains and from most of the heavily polluted areas in the province of Rovigo, and it appears again, although with low frequency values, in the low plains, chiefly in the provinces of Treviso, Venice and Padova. A similar behavior has been reported by Nirnis et al. (1991) for the northern part of the province of Vicenza. These distribution patterns rnight be explained as follows: Parmelia sulcata being an acidophytic and relatively anitrophytic lichen, has its optimum in the parts of the region where agricultural activity is lowest. It appears again in the plains where a moderately high pollution produces a secondary acidification of the bark.
Physcia adscendens - This species is widespread throughout Italy, from the lowlands to the subalpine, and sometimes even to the alpine vegetation belts; it
67

grows within Xanthorion-communities, and it appears to be somewhat less nitrophytic than Physcia orbicularis. Its tolerance to SO2 is rather high: the upper tolerance limit reported in the literature is at 70 µg/m3 (Hawksworth & Rose 1970, Deruelle 1977). The average pH, according to Jiirging (1975), is around 5.6. Data from Northern Italy (Nimis 1985, 1986, Nimis et al. 1991) indicate that Physcia adscendens is able to thrive up to the limits of the lichen desert, when it grows on eutrophic bark.
The distribution pattern of Physda adscendens in the Veneto Region (fig. 27) is well correlated with the I.A.P. map (fig. 21). This species is most frequentin the relatively unpolluted province of Belluno, and progressively decreases infrequency towards the plains, being absent in the most polluted southwesternpart of the region. This distribution pattern is very similar to that of Xanthoriaparietina (see fig. 29), and will be discussed with the comments on this species.
Physcia orbicularis - This lichen is very common throughout Italy, from the lowlands to the montane vegetation belt. It grows in communities of the Xanthorion parietinae, and it is often associated with other nitrophytic species such as Candelaria concolor and Hyperphyscia adglutinata in intensely cultivated areas (Nimis & De Faveri 1981). In the British Isles Physcia orbicularis tolerates average concentrations of S02 up to 60 µg/m3, but it starts to become abundant only at values lower than 50 µg/m3 (Hawksworth & Rose 1970). Similar tolerance values are reported by Deruelle (1983) for the surroundings of Paris (France). Data from Italy (Nimis, 1985, 1986, 1990b, Nimis et al. 1991) indicate that this species can thrive up to the limits of the lichen desert, particularly on eutrophic or eutrophiated bark.
In the Veneto Region Physcia orbicularis is one of the commonest epiphytic species, and one of those that are more able to stand high air pollution levels. Its distribution map (fig. 28) shows a pattern that very much resembles that of Candelaria concolor. Physcia orbicularis has its optimum in the high plains, the hills and the pre-Alps, becoming progressively less frequent in the most polluted areas around large settlements and in the provinces of Rovigo and Padova. Its distribution seems to be influenced positively by the secondary eutrophication of the barks due to the agricultural activity, and negatively by strong air pollution levels.
Xanthoria parietina - This species is very common throughout Italy, from the lowlands to the upper montane vegetation belt; it has its optimum within Xanthorion-vegetation, and it is somewhat less nitrophytic than e.g. Physcia orbicularis and Candelaria concolor. Its optimal pH, according to Jiirging (1975) is of 5.6. The upper tolerance limits to average concentrations of S02 available in the literature are: 70 µg/m3 (Hawksworth & Rose 1970, British Isles), 80-90 µg/m3 (Johnsen & Sochting 1973, Copenhagen). Apparently, this species is
68

rather tolerant to pollution, although the reports on its poleophoby throughout Europe are rather contradictory (see Nimis et al. 1991). Data from Italy (Nimis 1985, 1986, 1990b, Nimis et al. 1990, 1991) indicate a moderate to rather high toxitolerance for Xanthoria parietina.
The distribution pattern of Xanthoria parietina in the survey area (fig. 29) very much resembles that of Physcia adscendens (fig. 27); the two species also have a similar ecology and are frequently associated. The distribution of both species is well in agreement with the I.A.P. map (fig 21): both have frequency maxima in the relatively unpolluted mountain areas, and decrease progressively towards the most polluted parts of the southwestern plains. Their distribution is probably influenced, negatively, both by air pollution and by the strong eutrophication of the bark due to agricultural activities.
The distribution maps shown in figs 22-29 can be classified into 4 main groups, that represent 4 main distribution patterns. Each group is briefly discussed below.
Distribution pattern 1). - Candelariella xanthostigma, Pannelia exasperatula. These are slightly nitrophytic or anitrophytic, subacidophytic to
subneutrophytic, rather pollution-intolerant species. Their distribution in the survey area is limited both by air pollution and by the secondary eutrophication of the bark. Their optimum is in the relatively unpolluted mountain areas with low agricultural activity.
Other species with a similar distribution pattern are: Arthopyrenia antecellens, Lecanora chlarotera, Lecanora argentata, Pannelia caperata, Pannelia subaurifera, Pannelia tiliacea, Panneliopsis ambigua.
Distribution pattern 2). - Physcia adscendens, Xanthoria parietina. These are rather nitrophytic, subneutrophytic, rather pollution-tolerant
species. Their distribution pattern is intermediate between those of group 1) and of group 3), since they are less sensitive to air pollution than the species of group 1, and more sensible to strong eutrophication than the species of group 3.
Other species with a similar distribution are: Caloplaca cerina, Pannelia acetabulum, Parmelia subrudecta, Physcia aipolia, Physconia distorta, Xanthoria fallax.
Distribution pattern 3) - Candelaria concolor, Physcia orbicularis. These are strongly nitrophytic, neutro-basiphytic, pollution-tolerant
species. Their distribution is limited by pollution in the southwestern part of the region, by scarce eutrophication of the bark in the northern part. Their optimum is in the intensely cultivated, but less polluted northern plains plains, the hill belt and the parts of the pre-Alpine valleys with rather high agricultural activity.
69

Other species with a similar distribution pattern are Candelariella refiexa, Hyperphyscia adglutinata and Physconia grisea.
Distribution pattern 4) - Parmelia sulcata, Hypogymnia physodes. These are acidophytic, scarcely or non- nitrophytic, rather or strongly
pollution-tolerant species. The main lirniting factor for these lichens is the availability of acid to subacid, non- or scarcely eutrophiated substrates. These are available in the mountain areas with scarce agricultural activity and in the areas surrounding the lichen desert, where secondary acidification by S02 is stronger. This explains their disjunct distribution patterns, with an optimum in the mountains, and a scarce presence also around the most polluted areas of the plains.
Other species with a sirnilar distribution pattern are: Chaenotheca furfuracea, Evernia prunastri, Lecanora conizaeoides, Pseudevernia furfuracea, Usnea gr. subfloridana.
Noteworthy is the good correspondence between the ecology of all cited species (e.g. as evident in the ordinations of figs. 5 and 6) and their distribution patterns.
The distribution of lichens within the region is conditioned not only by air pollution by S02, but also by other factors, the most important of which seerns to be the secondary eutrophication of the bark due to the agricultural activity.
CONCLUDING REMARKS
The results of this study allowed the production of the first large-scale air pollution rnap based on bioindicators in Italy. The method adopted in this study proved to have a significant correlation with pollution values; the pollution patterns shown by the rnaps are well in agreement with the location of the main ernitting sources and with the directions of the prevailing winds. The method allowed also the detection of a widespread and pronounced pollution by inorganic and organic fertilizers, the eutrophication of the bark tending to counterbalance the acidifying effects of pollution by sulphur dioxide. The maps presented in this paper may be utilized to detect high risk areas within the region, and to optirnize the positioning of the recording gauges. Considering that this study has been carried out within one year, and that its costs were lower than the cost of a single recording gauge, the joint use of bioindicators and of instrumental recording is suggested as one of the most appropriate approaches to air pollution monitoring.
70

Acknowledgements
The authors are grateful to Drs. E. Cosma and S. Olivieri (Region of Veneto), for the comments to the manuscript and for help during field work, and to Drs. M.G. Bellio, G. Bolognini, M. Castello, K. Kravos, M. Tretiach (frieste), for assistence in dataelaboration.
RIASSUNTO - Vengono presentati i risultati di uno studio sull'inquinamento da S02nella regione del Veneto, effettuato utilizzando i li-:heni epifiti come bioindicatori. E' stato adottato il metodo basato sull' "Indice Lichenico Calibrato di Qualità dell' Aria" proposto da Liebendoerfer et al. (1988). Tale indice viene calcolato sommando le frequenze di tutte le specie di licheni epifiti all'interno di un reticolo di rilevamento composto .da 10 unità, ed ha dimostrato una correlazione altamente significativa con la somma delle concentrazioni di diverse sostanze inquinanti. I risultati di due studi preliminari condotti dagli autori in territorio italiano, a La Spezia e nell'Alto Vicentino hanno permesso di confermare l'alta predittività di tale indice per l'inquinamento da anidride solforosa.
Nel complesso, sono stati effettuati 2425 rilevamenti in 662 stazioni, così distribuite tra le varie provincie: Provincia di Belluno: 30 stazioni Provincia di Padova: 80 stazioni Provincia di Rovigo: 65 stazioni Provincia di Treviso: 80 stazioni Provincia di Venezia: 60 stazioni Provincia di Verona: 120 stazioni Provincia di Vicenza 227 stazioni. L'alto numero di stazioni in provincia di Vicenza deriva dal fatto che nella sua parte settentrionale è stato condotto uno studio preliminare per saggiare le metodiche successivamente estese all'intero territorio regionale.
Tutti i rilievi di vegetazione epifita sono stati effettuati su Tiglio. I rilievi sono stati effettuati utilizzando una griglia di 30 x 50 cm, suddivisa in 10 rettangoli, sistemata ad 1.2 m sul tronco, con il centro nell'area con la massima copertura lichenica. La somma delle frequenze di tutte le specie presenti nei 10 rettangoli costituisce l' Indice di Purezza Atmosferica (I.A.P.) del rilievo, L' I.A.P. della stazione è la media dei valori di tutti i rilievi effettuati nella stazione stessa (in media 3.7).
Le matrici delle specie e delle stazioni sono state sottoposte ad elaborazione tramite programmi di analisi multivariata (classificazione ed ordinamento) al fine di individuare i principali aspetti vegetazionali in ciascuna provincia, ed i principali gradienti ecologici sottostanti alla variazione floristica nell'ambito dell'intera regione.
L' elaborazione cartografica dei dati è stata effettuata tramite il programma SURFER (Goden Software Inc., Golden, colorado, U.S.A.). I dati di input sono: a) dati di I.A.P. delle stazioni per le sette provincie e per l'intero territorio regionale (carte
71
dell'inquinamento); b) frequenza media di ciascuna specie (media delle frequenze dei rilievi di ciascuna stazione) per tutte le stazioni (carte di distribuzione di specie singole).
Vengono presentate le carte dell' inquinamento da SO2 delle sette provincie, e dell'intera regione: esse sono in buon accordo sia con la disposizione delle principali fonti emittenti che con la direzione prevalente dei venti. Nel 93.7 % del territorio regionale le medie annue dei 981 percentili di SO2 sono inferiori a 84 µg/m3, e quindi il rischio disoglie di inquinamento superiori ai limiti stabiliti dalla legge è nullo o molto basso. Il 25 % del territorio regionale presenta un moderato inquinamento atmosferico, il 23.4 % un inquinamento basso, il 44.9 % ha livelli di inquinamento da S02 trascurabili. Le aree maggiormente inquinate si trovano nella porzione sudoccidentale del Veneto, nelle provincie di Padova, Rovigo e Vicenza. Ulteriori aree ad inquinamento maggiore sono site presso altri centri urbani ed aree industriali. La provincia meno inquinata è quella di Belluno, quella più inquinata è quella di Rovigo, ove tuttavia l'inquinamento proviene in gran parte da aree site al di fuori del territorio provinciale, soprattutto dalle provincie di Padova e Venezia. Le carte possono venir utilizzate per individuare aree a rischio in cui posizionare le centraline per il rilevamento strumentale dell'inquinamento.
La vegetazione lichenica prevalente nell'ambito degli alberi campionati in questo studio è quella appartenente all'alleanza Xanthorion parietinae, che include comunità di licheni fotofili, nitrofili, neutro-basofili. Ciò è dovuto in primo luogo all'eutrofizzazione secondaria dei substrati conseguente all'intensa attività agricola nella Pianura Veneta.
Vengono presentate le carte di distribuzione, anch'esse ottenute per via automatica, di 8 specie: Candelaria concolor, Candelariella xanthostigma, Hypogymnia physodes, Parmelia exasperatula, Pamelia sulcata, Physcia adscendens, Physcia orbicularis, Xanthoria parietina. Esse mostrano un' ottima concordanza tra patterns di distribuzione ed ecologia delle specie stesse. In particolare, si possono distinguere 4 patterns di distribuzione principali: 1) specie acidofitiche e non nitrofitiche, sensibili all'inquinamento, con optimum nelle aree montane a scarso sviluppo agricolo; la loro distribuzione è limitata sia dall'inquinamento atmosferico da anidride solforosa che da quello da fertilizzanti organici ed inorganici: 2) specie moderatamente nitrofitiche, subneutrofitiche, moderatamente tolleranti rispetto all'inquinamento da anidride solforosa; queste mostrano dei pattern di distribuzione intermedi tra quelli del gruppo precedente e del gruppo seguente; 3) specie fortemente nitrofitiche, neutro-basifitiche, resistenti all'inquinamento da anidride solforosa; il loro optimum è nell'alta Pianura Veneta e nella zona prealpina con maggiore sviluppo agricolo; la loro distribuzione è
limitata dall'inquinamento da anidride solforosa nella parte sudoccidentale della regione, dalla scarsa eutrofizzazione dei substrati in quella montana; 4) specie relativamente anitrofitiche ed acidofitiche, che presentano un optimum di distribuzione nelle aree montane a scarso sfruttamento agricolo, una scarsissima frequenza nelle parti della pianura veneta moderatamente o poco inquinate, ed un lieve aumento della frequenza attorno alle aree più inquinate della pianura; tale gruppo di specie evidenzia l' acidificazione secondaria dei substrati nelle aree maggiormente inquinate dovuta all' inquinamento da anidride solforosa.
I fattori principali che condizionano la presenza dei licheni nella Regione del Veneto sono l'inquinamento atmosferico da gas fitotossici e quello da fertilizzanti organici ed inorganici (eutrofizzazione delle scorze) conseguente all'intensa attività agricola.
72

References
Ammann K., Herzig R., Liebendoerfer L. & M. Urech, 1989. Statistical correlation of deposition data on 8 different air pollutants to Swiss lichen IAP method in Biel and the Swiss plain. Manuscr.(in press).
Barkman J.J., 1958. Phytosociology and ecology of cryptogamic epiphytes. Van Gorcum and Co., Assen. 628 pp.
Barkman J.J., 1969. The influence of air pollution on bryophytes and lichens. In: Air Pollution, Proceedings of the 1st European Congress on the Influence of Air Pollution on Plants and Animals. Wageningen, 1968:237-241. Centre for Agr. PubL and Doc. Wageningen.
Beschel R.E. 1958. Flechtenvereine der Stadte, Stadtflechten und ihr Wachstum. Ber. Naturw. -med. Ver. Inssbruck, 52: 1-158.
Caniglia G., Giulini P. & M. Spampani, 1978. Inquinamento atmosferico e licheni. Saggio di distribuzione nella Valle del Boite e a Cortina d'Ampezzo. Atti IV Conv. Ecologia Alpi Orientali, Pian Cansiglio:279-293.
Coppins B.J. 1973. The "Drought Hypothesis". In Ferry et al., op.cit.: 124-142. Crespo A., Barreno E., Sancho L.G. & A.G. Bueno, 1981. Establecimiento de una red de
valoracion de pureza atmosferica en la provincia de la Corufia (Espana) mediante bioindicatores liquenicos. Lazaroa, 3: 289-311.
Del Favero R., O. Andrich, G. Dal Mas, C. Lasen & L. Poldini, 1990. La Vegetazione forestale del Veneto. Prodromi di tipologia forestale. Regione del Veneto. Venezia. 180 pp.
Deruelle S., 1977. Influence de la pollution atmosphérique sur la végétation lichénique des arbres isolés dans la région de Mantes (Yvelines). Rev. Bryol. Lichénol., 43 (2): 137-158.
Deruelle S., 1978. Etude comparée de la sensibilité de trois méthodes d'estimation de la pollution atmosphérique, en utilisant les lichens comme indicateurs biologiques dans la région de Mantes (Yvelines). Rev. Bryol. Lichénol., 44 (4): 429-441.
Deruelle S., 1983. Écologie des lichens du bassin Parisien. Impact de la pollution atmosphérique et relations avec les facteurs climatiques. Univ. P. M. Curie. These de Doct. 2 voll.
De Wit T., 1976. Epiphytic lichens and air pollution in the Netherlands. Bibl. Lichenol., Band 5, Cramer, Vaduz. 228 pp.
Ferry B.W., Baddeley M.S. & D.L. Hawksworth (eds.), 1973. Air Pollution and Lichens. University of Toronto Press. Toronto. 390 pp.
Hawksworth D.L. & L. Rose, 1970. Qualitative scale for estimating sulphur dioxide air pollution in England and Wales using epiphytic lichens. Nature, 227: 145-148.
Herzig R., 1990. Entwicklung des Integrierten biologischen Messsystems der Luftverschmutzung mit Flechten in der Schweiz, seine Anwendung und erste Vergleiche mit Bodenanalysen. VDI Berichte 837: 937-956.
73

Herzig R., Liebendoerfer L. & M. Urech, 1985. F/echten als biologische Indikatoren der Luftverschmutzung in der Schweiz. Methodenentwickung in der Region Biel-Seeland. Lizentiatsarbeit Univ. Bern, 241 pp.
Herzig R., Liebendoerfer L., M. Urech & K. Ammann, 1987. Evaluation und Kalibrierung einer Flechtenindikationsmethode mit wichtigen Luftschaden. In: Bioindikation -Wirkungsbezogene Erhebungsverfahren fiir den Immissionschutz. Freising VDI-Koll., 609: 619-639.
Johnsen I. & U. Sochting, 1973. Influence of air pollution on the epiphytic lichen vegetation and bark properties of dedduous trees in the Copenhagen area. Oikos, 24: 344-351.
Jiirging P., 1975. Epiphytische F/echten als Bioindikatoren der Luftverunreinigung dargestellt an Untersuchungen und Beobachtung in Bayern. Bibl. Lichenol., 4, 164 pp.
Lackovicova A., Lisickà E. & I. Pisut, 1988. Literature on lichen indication in socialist countries. Biologia (Bratislava),43,1: 79-86.
Lackovicova A., Lisickà E. & I. Pisut, 1989. Literature on lichen indication in socialist countries. 2. Biologia (Bratislava),44,1: 83-89.
Laundon J.R., 1973. Urban Lichen Studies. In: Ferry B.W., Baddeley M.S. & D.L. Hawksworth (eds.), op. cit.: 109-123.
Liebendoerfer L., Herzig R., Urech M., & K. Ammann, 1988. Evaluation und Kalibrierung der Schweizer-Indikationsmethode mit wichtigen Luftschadstoffen. Staub Reinhaltung der Luft, 48: 233-238.
Nimis P.L., 1985. Urban Lichen Studies in Italy. I: the town of Trieste. Studia Geobot., 5: 49 -74.
Nimis P.L., 1986. Urban Lichen Studies in Italy. II: the town of Udine. Gortania, 7 : 147-172. Nimis P.L., 1990. Air Quality indicator and indices: the use of plants as bioindicators for
monitoring air pollution. Proc. Int. Workshop on lndicator and Indices JRC Ispra,
EUR 13060 EN: 93-126. Nimis P.L., 1990b. Urban Lichen Studies in Italy. III: the city of Rome. Annali di Botanica (in
press). Nimis P.L., Castello M. & M. Perotti, 1990. Lichens as biomonitors of sulphur dioxide pollution
in La Spezia (Northem Italy). Lichenologist, 22 (3): 333-344. Nimis P.L., Bargagli R., Benedet A., Castello M., Gasparo D., Lazzarin G. & A., Olivieri S.
& M. Tretiach, 1991. Licheni come bioindicatori di inquinamento atmosferico nell'Alto Vicentino. Atti Mus. St. Nat. Verona (in press).
Nimis P.L. & R. De Faveri, 1981. A numerical classification of Xanthorion communities in NE Italy. Gortania, 2: 91-110.
Nimis P.L. & J. Poelt, 1987. The lichens and lichenicolous fungi of Sardinia. An annotated list.
Studia Geobot., 7, suppl. 1, 269 pp. Piccoli F., Kumer E. & L. Bonalberti, 1989. Licheni ed inquinamento atmosferico a Ferrara.
Archivio Botanico Italiano, 65 (1-2): 73-80. Rydzak J., 1969. Lichens as indicators of the ecological conditions of the habitat. Annls. Univ.
Mariae Curiae Sklodowska, C, 23: 131-164.
74
Seaward M.R.D. & J.C.B. Hitch (eds.), 1982. Atlas of the lichens of the British Isles. Univ. of Bradford.
Sergio C. & F. Bento-Pereira, 1981. Liquenes e briofitos corno bioindicadores da poluiçao atmosferica. I. Utilizaçao de uma esca/a qualitativa para Lisboa. Bol. Soc. Brot. Ser.2, 54: 291-303.
Skye E., 1968. Lichens and air pollution. A study of cryptogamic epiphytes and environment in the Stockholm region. Acta Phytogeogr. Suec., 52: 1-123.
Spampani M., 1982. I licheni: indicatori fisiologici della qualità dell'aria. Le Scienze, 167: 60-o9. Tilrk R. & R. Christ, 1986. Beitrag zur epiphytischen Flechtenflora im Stadtgebiet von Wien.
Verh. zool.bot. Ges. Oesterr., 124: 65-80.
Urech M., Peter K., Liebendoerfer L. & R. Herzig. 1990. Bioindikation mit Flechten im Kanton Luzem. Mitt. Naturforsch. Ges. Luzem, 31: 219-232.
Walter H. & H. Lieth, 1960. Klimadiagramm-Weltatlas. Jena.- Fischer Verlag.
Wildi O. & L. Orloci, 1983. Management and multivariate analysis of vegetation data. 2nd ed.
Swiss Fed. Inst. For. Res., Rep. 215. Birmensdorf. 387 pp. Wirth V., 1980. Flechtenflora. Ulmer. Stuttgart, 552 pp.
75

Authors' Addresses
Prof. Pier Luigi NIMIS Dipartimento di Biologia Università di Trieste Via A. Valerio 32 I 34127 TRIESTE
Dr. Arianna LAZZARIN Cooperativa Co.Ge.V. Lungadige Sammicheli 9 I 37100 VERONA
Dr. Giuliano LAZZARIN Museo Civico di Storia Naturale di Verona Sezione Botanica C.so Cavour 11I 37121 VERONA
Dr. Dario GASP ARO Cooperativa ECOTHEMA Via Stuparich 15 I 34100 TRIESTE
76