CACFP Child Care Wellness Grant ODE Child and Adult Care Program.

Child Care Workforce Study Licensed Child Care Directors
Kim Hooks, Beth Rous, Patti Singleton, Amy Booth, Amy Clark, Tami Gross
Spring 2013

2013 Child Care Workforce Study
The Kentucky Partnership for Early Childhood Services is a multi-project consortium housed at the University of Kentucky, Human Development Institute (HDI). The partnership’s goal is to provide research, training and outreach to support and enhance quality early care, intervention and education. Services are provided through a variety of state and national grants and contracts.
Child Care Aware of Kentucky and the Quality Enhancement Initiatives are within the Kentucky Partnership through funds through the Kentucky Cabinet for Health and Family Services, Division of Child Care (DCC). Child Care Aware of Kentucky provides information to families seeking child care in Kentucky, assists providers with locating professional development opportunities as well as meeting licensing standards, and facilitates community involvement through participation on community organizations and in outreach activities.
This report is one in a series of three examining factors in the child care workforce. Additional reports are available on Child Care Teachers and Assistances and Certified Family Child Care Homes, available online.
www.kentuckypartnership.org/workforce
This report was developed in part with Child Care Block Grant funds through a contract to the Human Development Institute from the Kentucky Cabinet for Health and Family Services, Division of Child Care (Contract Number P02 736 1200004856 1). Child Trends, a research center that provides valuable information and insights on the well being of children was contracted for the development of the survey tool (www.childtrends.org). Additional copies of this report are available by request.
Recommended Citation: Hooks, K., Rous, B., Singleton, P., Booth, A., Clark, A., &Gross, T. (2013). Kentucky’s 2013 child care workforce study – licensed child care directors. Lexington, KY: Human Development Institute, University of Kentucky
An Equal Opportunity Employer M/F/H

Contents Table of Tables ..........................................................................................................................................3
Table of Figures ........................................................................................................................................4
Background and Methodology ...........................................................................................................5
Respondent Characteristics ...............................................................................................................7
Internet Usage ......................................................................................................................................8
Center Hours .........................................................................................................................................8
Program Characteristics and Capacity ...............................................................................................9
Funding ..................................................................................................................................................9
Accreditation ...................................................................................................................................... 10
Child Capacity and Enrollment ......................................................................................................... 10
Children of Active Duty Military or National Guard/Reserve Served at Type I and Type II Centers .............................................................................................................................................. 13
Employees at Licensed Centers ........................................................................................................ 13
Job Experience .................................................................................................................................. 16
Employee Turnover .......................................................................................................................... 17
Volunteers........................................................................................................................................... 19
Staff Availability ................................................................................................................................. 19
Center Wages and Benefits ........................................................................................................... 20
Wages .................................................................................................................................................. 20
Benefits ................................................................................................................................................ 21
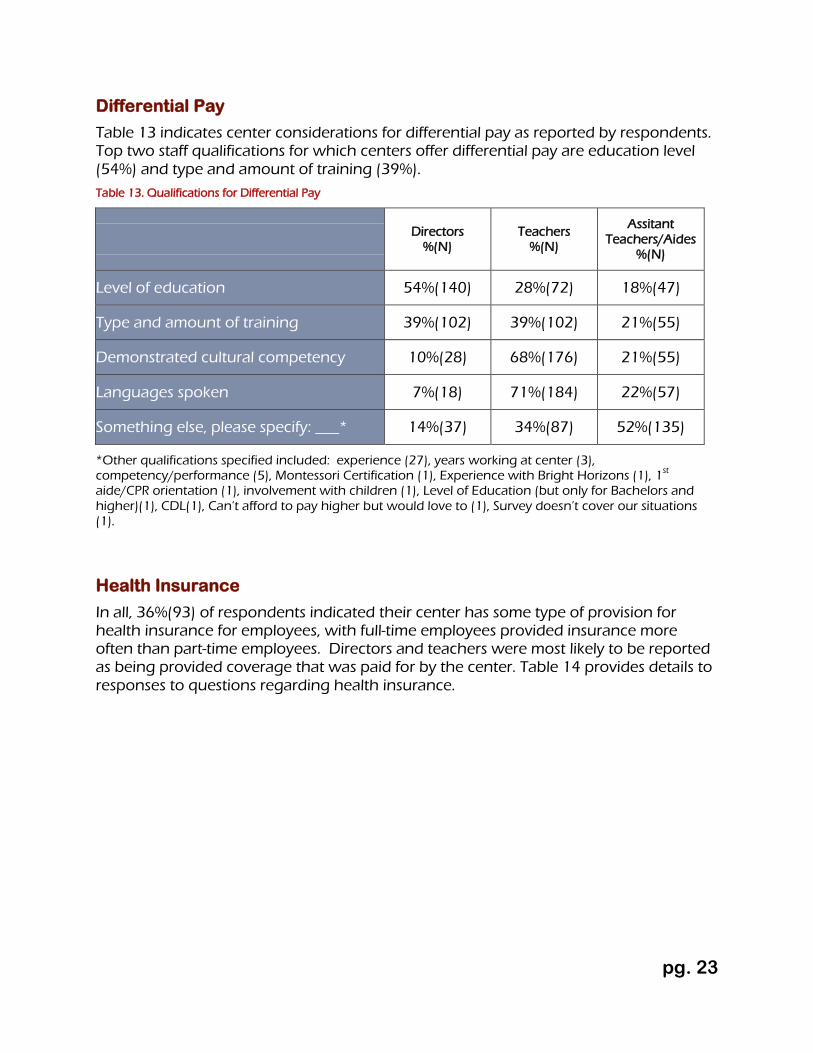
Differential Pay .................................................................................................................................. 23
Health Insurance ............................................................................................................................... 23
Dental Insurance ............................................................................................................................... 24
Working Environment ......................................................................................................................... 25
Center Policies.................................................................................................................................... 25
Professional Development ................................................................................................................. 26
Professional Development Supports ........................................................................................... 26
Use of ECE-TRIS .................................................................................................................................. 28
Use of Quality Self Study ................................................................................................................. 28
Use of KY Early Childhood Standards ......................................................................................... 29
Availability of Professional Development by Region .............................................................. 30
pg. 2

Interest in Professional Development by Region ..................................................................... 30
Barriers to Professional Development ......................................................................................... 32
Professional Development at Your Center ................................................................................ 33
Quality Improvement Initiatives ....................................................................................................... 34
Familiarity ............................................................................................................................................ 34
Source of Information on Quality Initiatives ............................................................................. 34
Identified Priorities ............................................................................................................................ 35
Barriers to Improvement ................................................................................................................. 36
Conclusion .............................................................................................................................................. 37
References............................................................................................................................................... 39
Table of Tables Table 1. Response Rate and N ..............................................................................................................5
Table 2. Regional County Designation ..............................................................................................6
Table 3. Experience and Education ....................................................................................................7
Table 4. Number of Hours Worked per Week .................................................................................8
Table 5. Staff-Child Ratio as Reported by Directors* ................................................................... 11
Table 6. Capacity as Reported by Directors ................................................................................... 11
Table 7. Enrollment as Reported by Directors .............................................................................. 12
Table 8. Centers with Students from Group.................................................................................. 13
Table 9. Number of Full-Time Employees ...................................................................................... 14
Table 10. Number of Part-Time Employees ................................................................................... 15
Table 11. Availability of Qualified Staff ........................................................................................... 19
Table 12. Benefits .................................................................................................................................. 22
Table 13. Qualifications for Differential Pay .................................................................................. 23
Table 14. Health Insurance ................................................................................................................ 24
Table 15. Dental Insurance ................................................................................................................ 25
Table 16. Center Policies ..................................................................................................................... 26
Table 17. Professional Development Supports ............................................................................. 27
Table 18. Use of ECE-TRIS ................................................................................................................... 28
Table 19. Training Hours NOT in ECE-TRIS .................................................................................... 28
pg. 3

Table 20. Use of KY Early Childhood Standards ........................................................................... 29
Table 21. Availability of Professional Development .................................................................... 30
Table 22. Interest in Professional Development Topics ............................................................. 31
Table 23. Barriers to Professional Development .......................................................................... 32
Table 24. In-House Training ............................................................................................................... 33
Table 25. Number of Annual Training Hours ............................................................................... 33
Table 26. Source of Information/Influence on Practices ........................................................... 34
Table 27. Identified Priorities ............................................................................................................. 35
Table 28. Improve Outcomes ............................................................................................................ 36
Table 29. Barriers to Improvement .................................................................................................. 36
Table of Figures Figure 1. Distribution of Facilities by Region and Survey Respondents by Region ...............6
Figure 2. For Profit Facilities ..................................................................................................................9
Figure 3. Not for Profit Facilities ..........................................................................................................9
Figure 4. Accrediting Organization ................................................................................................. 10
Figure 5. Number of Years in Current Center by Job Title ........................................................ 16
Figure 6. Number of Years Experience by Job Title .................................................................... 17
Figure 7. % Staff Leaving Job in Last 12 Months ......................................................................... 18
Figure 8. Of those who left job, % Staying in Field ..................................................................... 18
Figure 9. Kentucky Hourly Wage by Position ............................................................................... 20
Figure 10. Kentucky Annual Salary by Position ............................................................................ 21
pg. 4

Background and Methodology The 2012 Workforce survey request was sent to the population of 1,817 directors of Licensed Type I and Licensed Type II facilities in the state of Kentucky.
In May of 2012, using email addresses provided by the Early Care and Education Training Records Information System (ECE-TRIS), 1, 456 individuals were sent a cover letter and link to an online survey using Qualtrics Survey Software, with a request to complete the survey within 3 weeks. Using procedures outlined by Dillman (2009), e-mail reminders were sent at 2 and 4 weeks. Due to a low return rate (9%, N=163), an additional e-mail reminder was sent 8 weeks after the initial request. A total of 236 surveys were completed using the online version (see Table 1 for response rate).
Four weeks after the initiation of the email survey, directors with invalid or no email addresses were sent a paper survey by mail along with a cover letter and postage-paid return envelope. Three hundred and sixty seven were mailed to directors with a request to complete the survey within 3 weeks. Using procedures outlined by Dillman (2009) reminder post-cards were sent at 2 and 4 weeks. A total of 18 valid surveys were received from directors in this group.
Eight weeks after the initial email survey, STARS Quality Coordinators (SQC’s), from the Quality Enhancement Initiative, were asked to follow-up with Directors (particularly those from the underrepresented rural and Type II Centers). SQC’s provided them with a second, hard copy of the survey. An additional 5 valid surveys were added, for a total of 23 valid paper surveys.
As an incentive for completing the survey, all facilities who submitted a completed a survey received a book on early childhood topics and were entered into a drawing for a box of early childhood materials worth up to $50. DVD’s were sent upon receiving the survey, and the drawing was completed two weeks following the last contact made by the SQCs.
Twenty-eight (28) surveys were returned due to invalid address/phone. This resulted in an adjusted sample of 1,789 for an overall response rate of 15%. This is greater than the response rate of 11% recommended by Child Trends during survey development. See Table 1 for response rate. Table 1. Response Rate and N
Survey Sample
Survey Sample Size
Valid Surveys: Online*
Valid Surveys: Paper*
Response Rate
Directors Whole population 1789 236 23 15%
*Valid Surveys had >=75% of questions completed.
A greater percentage of directors from Type I facilities (15% or N=250) returned surveys than those from Type II facilities (8% or N=9).
Using county designations provided by DCC, results were disaggregated by region (East, West, Central). Sixty-two percent of respondents were from the Central region of
pg. 5

the state, 26% from the Western region of the state and the remaining 12% from the Eastern region. Table 2 details designated counties included in each region. Return percentages closely align to the percentages of facilities currently operating in each of these regions. This finding was true for both Type I and Type II facilities. Table 2 details which counties are in a region and Figure 1 illustrates the return rate by region is illustrated in Figure 1. Table 2. Regional County Designation
Region Counties
East
Bath, Bell, Boyd, Bracken, Breathitt, Carter, Clay, Elliot, Fleming, Floyd, Greenup, Harlan, Jackson, Johnson, Knott, Knox, Laurel, Lawrence, Lee, Leslie, Letcher, Lewis, Magoffin, Martin, Mason, Menifee, Montgomery,
Morgan, Owsley, Perry, Pike, Robertson, Rockcastle, Rowan, Whitley, Wolfe
Central
Adair, Anderson, Boone, Bourbon, Boyle, Bullitt, Campbell, Carlisle, Carroll, Casey, Clark, Clinton, Cumberland, Estill, Fayette, Franklin, Gallatin, Garrard,
Grant, Green, Harrison, Henry, Jefferson, Jessamine, Kenton, Lincoln, Madison, McCreary, Mercer, Nicholas, Oldham, Owen, Pendleton, Powell, Pulaski, Russell, Scott, Shelby, Spencer, Taylor, Trimble, Wayne, Woodford
West
Allen, Ballard, Barren, Breckinridge, Butler, Caldwell, Calloway, Christian, Crittenden, Daviess, Edmonson, Fulton, Graves, Grayson, Hancock, Hardin,
Hart, Henderson, Hickman, Hopkins, Laure, Livingston, Logan, Lyon, Marion, Marshall, McCracken, Mclean, Meade, Metcalfe, Monroe, Muhlenberg,
Nelson, Ohio, Simpson, Todd, Trigg, Union, Warren, Washington, Webster
Figure 1. Distribution of Facilities by Region and Survey Respondents by Region
64%
11%
25%
62%
12%
26%
0%
20%
40%
60%
80%
100%
Central East West
Percentage of Facilities Located in a Region
Percentage of Survey Respondents Located in a Region
pg. 6

Respondent Characteristics
This section provides information on the characteristics of the respondents. It should be noted that not all respondents answered all questions on the survey. Therefore sample sizes will be provided where necessary by characteristic.
Respondents were predominantly female (99%, N=258). A total of 46% (119) provided demographic information to obtain additional information about their level of education from ECE-TRIS which was used as a secondary data source . Of these, 1%(1) had a PhD, 27%(32) had a Masters degree, 42%(50) a Bachelors degree, 26%(31) an Associates degree, and 4%(5) a High School diploma or equivalent.
On average, directors responding to the survey had been in their positions 8.9 years and had worked in child care 15.9 years. During the past 7 years, they reported completing a median number of three college courses in Early Childhood or Child Development. Table 3 provides a summary of experience and education. Table 3. Experience and Education
N % Mean Median Sd Min Max
How long have you held your current position? 196 75% 8.9 7 6.79 0.33 30.00
How long have you worked in the child care profession including this job?
195 75% 15.9 15 8.24 1.75 40.00
In the past 7 years, how many college courses have you completed in Early Childhood or Child Development? *
148 57% 6.3 3 12.4 0 120**
In the past 7 years, how many college semester credits have you completed in Early Childhood or Child Development? *
139 53% 28.3 9 73.1 0 765***
*Several write in responses indicating 3 additional individuals had completed CDA-Director, 2 completed Masters degrees, 1 completed Associates Degree, 1 completed Bachelors degree, and one finished a “core program” at college.
**Maximum of 120 is an outlier, next highest was 50.
***765 and next lower, 264 are outliers. Next lowest is 145.
The majority of respondents stated they probably will (28%, N=72) or definitely will (44%, N=115) be in the child care field three years from now. Four percent (N=10) indicated they probably or definitely would not be in the field.
Most respondents (49%, N=129) indicated working 40 hours or more a week. A summary of the number of hours worked per week is presented in Table 4.
pg. 7

Table 4. Number of Hours Worked per Week
% N
less than 10 hrs/week 1% 3
10-20 hrs/week 8% 20
21-34 hrs/week 8% 22
35-40 hrs/week 8% 22
41-50 hrs/week 29% 76
Over 50 hrs/week 20% 52
No Response 25% 64
Internet Usage
The majority of respondents accessed the internet at work (43%, N=112). Twenty-three percent (59) of respondents said their primary access was from home, with 69% (N=185) reporting they accessed the internet daily.
Center Hours
The majority of respondents (182) stated that their centers were open year round (72%), with 69 (27%) directors reporting they were open only during the school year. Two(1%) directors did not respond to the question.
pg. 8

Program Characteristics and Capacity
Funding
A total of 46% (118) respondents described their centers as “For Profit”, with 137 (53%) responding as “Not for Profit” and 4 (2%) not providing a response. Figures Figure 2 and Figure 3 illustrate the type and percentage of agencies designated in each category. Figure 2. For Profit Facilities
Figure 3. Not for Profit Facilities
Ninety-nine percent (258) responded to the question regarding funding sources for their center. Of these, 75% (193) received the overwhelming majority of their funding from one source. Parent fees were most frequently selected (132) as the primary funding source. This was followed by Public Subsidies (58), Corporate funding, Private Donations, and Other: The Christian Appalachian Project was selected once as a primary funding source. The remaining 25%(66) had two or more major sources of funding.
88%
2% 4%
6%
0%
IndependentLocal ChainNational ChainSponsored: Corporate/HospitalWorker Cooperative
16%
8%
37% 3%
20%
6%
2% 2%
6% Independent
Head Start/Early Head Start
Parent Cooperative
Sponsored: Church
Sponsored: University or College
Sponsored: Public Primary/Secondary School
Sponsored: Private Primary/Secondary School
Sponsored: Corporate/Business/Hospital
Sponsored: State or Local Govt
Sponsored: Non-Governmental Agency
pg. 9

Accreditation
Ten percent (27) of respondents indicated their centers were nationally accredited. The majority of these centers (13) were accredited by the National Association for the Education of Young Children (NAEYC). Other accrediting agencies are shown in Figure 4. Figure 4. Accrediting Organization
Of those centers not currently accredited, 14% (31) said they were seeking accreditation.
Child Capacity and Enrollment Ninety-one percent (235) responded to all questions regarding Capacity, Enrollment, and Staff. Reported staff to child ratios were generally within the required state limits of 1 staff to every 5 infants, 6 toddlers, 10-14 preschoolers (depending on age), and 15 school-aged children below aged 7. Reported averages at Type I facilities were 1 staff to every: 4.6 infants, 6.1 toddlers, 9.7 preschoolers, and 12.9 school aged children. For Type II facilities reported averages were 1 staff to every: 4.6 infants, 5.3 toddlers, 4.7 preschoolers, and 7 school aged children. Table 5 indicates staff-child ratios as reported by directors.
Infants were those children 0-11 months of age; toddlers ranged from 12-24 months; preschoolers were 2-4 years old and school age children were 5 or more years old. Table 6 details Capacity as reported by directors.
The reported average number of children enrolled full-time at Licensed Type I facilities was 45.5. At Type II facilities this number was 9.6. For facilities providing part-time enrollment, the average number of part-time students enrolled at any one time was 23. Only two Type II facilities providing part-time care responded to this question. Table 7 indicates enrollment as reported by directors.
54%
9% 0%
21%
4% 4%
8% National Association for the Education of YoungChildren (NAEYC)
National Early Childhood Program Accreditation(NECPA)
National School-Age Child Care Alliance (NSACCA)
Southern Association for Colleges and Schools(SACS)
National Accrediation Commission for Early Careand Education Programs (NAC)
Association of Christian School InternaitonalPreschool Accreditation Program (ACSI)
Council on Accreditation (COA)
pg. 10

Table 5. Staff-Child Ratio as Reported by Directors*
ALL LICENSED TYPE I LICENSED TYPE II
%(N) providing Ratio
Ratio SD Min Max %(N) providing Ratio
Ratio SD Min Max %(N) Providing Ratio
Ratio SD Min Max
Infant 58%(137) 4.6 2.0 2 6 58%(134) 4.6 .8 2 6 60%(3) 4.6 .6 4 5
Toddler 71%(166) 6.2 2.2 1 15 70%(162) 6.1 2.2 1 15 80%(4) 5.3 2.2 4 6
Pre-school 86%(201) 9.6 3.0 2 15 86%(197) 9.7 3.0 2 15 60%(3) 4.7 3.0 3 6
School Age 64%(150) 12.8 4.9 1 25 65%(149) 12.9 4.9 1 25 20%(1) 7.0 - - -
*Ratios in table reflect number of children per adult in facility (1 adult to __ children).
Table 6. Capacity as Reported by Directors
ALL LICENSED TYPE I LICENSED TYPE II**
Capacity* %(N) of Responding Centers with Capacity
Mean SD Min Max %(N) of Responding Centers with Capacity
Mean SD Min Max %(N) of Responding Centers with Capacity
Mean SD Min Max
Infant 63% (149) 6.4 6.8 0 36 63% (146) 6.5 6.8 0 36 60% (3) 2 2.4 0 5
Toddler 74% (173) 13.7 13.1 0 60 73% (168) 13.9 13.3 0 60 100% (5) 5.2 1.1 4 6
Preschool 91% (213) 35.6 30.9 0 175 91% (209) 36.3 30.8 0 175 80% (4) 3.6 2.3 0 6
School Age 68% (159) 26.7 42.7 0 385 69% (158) 27.3 43.0 0 385 20% (1) .8 1.8 0 4
*Capacity reflected by the number of Directors who said their center had the capacity for 1 or more children in an age group.
**Less than 10 centers in italics.
pg. 11
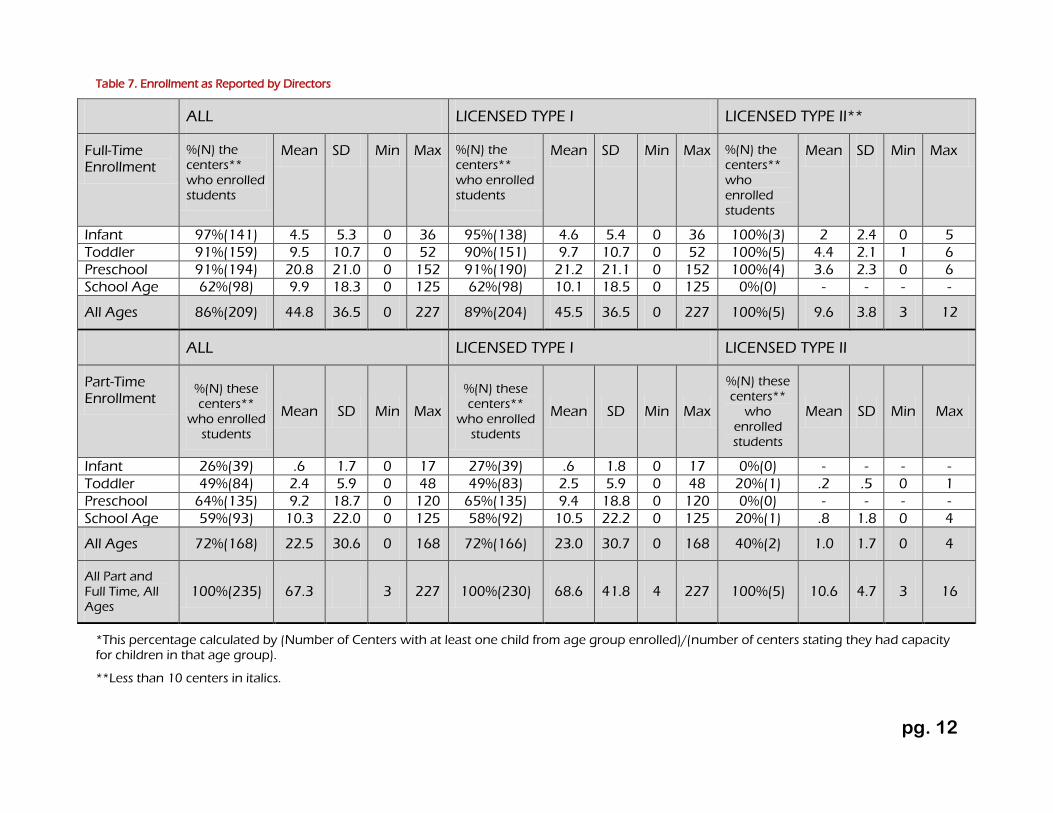
Table 7. Enrollment as Reported by Directors
ALL LICENSED TYPE I LICENSED TYPE II**
Full-Time Enrollment
%(N) the centers** who enrolled students
Mean SD Min Max %(N) the centers** who enrolled students
Mean SD Min Max %(N) the centers** who enrolled students
Mean SD Min Max
Infant 97%(141) 4.5 5.3 0 36 95%(138) 4.6 5.4 0 36 100%(3) 2 2.4 0 5 Toddler 91%(159) 9.5 10.7 0 52 90%(151) 9.7 10.7 0 52 100%(5) 4.4 2.1 1 6 Preschool 91%(194) 20.8 21.0 0 152 91%(190) 21.2 21.1 0 152 100%(4) 3.6 2.3 0 6 School Age 62%(98) 9.9 18.3 0 125 62%(98) 10.1 18.5 0 125 0%(0) - - - -
All Ages 86%(209) 44.8 36.5 0 227 89%(204) 45.5 36.5 0 227 100%(5) 9.6 3.8 3 12
ALL LICENSED TYPE I LICENSED TYPE II
Part-Time Enrollment
%(N) these centers**
who enrolled students
Mean SD Min Max
%(N) these centers**
who enrolled students
Mean SD Min Max
%(N) these centers**
who enrolled students
Mean SD Min Max
Infant 26%(39) .6 1.7 0 17 27%(39) .6 1.8 0 17 0%(0) - - - - Toddler 49%(84) 2.4 5.9 0 48 49%(83) 2.5 5.9 0 48 20%(1) .2 .5 0 1 Preschool 64%(135) 9.2 18.7 0 120 65%(135) 9.4 18.8 0 120 0%(0) - - - - School Age 59%(93) 10.3 22.0 0 125 58%(92) 10.5 22.2 0 125 20%(1) .8 1.8 0 4
All Ages 72%(168) 22.5 30.6 0 168 72%(166) 23.0 30.7 0 168 40%(2) 1.0 1.7 0 4
All Part and Full Time, All Ages
100%(235) 67.3 3 227 100%(230) 68.6 41.8 4 227 100%(5) 10.6 4.7 3 16
*This percentage calculated by (Number of Centers with at least one child from age group enrolled)/(number of centers stating they had capacity for children in that age group).
**Less than 10 centers in italics.
pg. 12

Children of Active Duty Military or National Guard/Reserve Served at Type I and Type II Centers
Forty nine percent (127) of directors from Type I and Type II licensed facilities stated that they had children whose parents were either Active Duty Military or in the National Guard or Reserve. The ages of the children served are detailed in the following table. On average, the centers that served the children of Active Duty Military or National Guard/Reserve members had two children in their facility. The total number served ranged from 0 (none CURRENTLY enrolled) to 12, as described in Table 8. Table 8. Centers with Students from Group
Centers with Students from Group % of all Centers
Infant 21 8%
Toddler 38 15%
Preschool 73 28%
School Age 34 13%
Employees at Licensed Centers Of the 98% (253 respondents) who answered questions on the number of employees in their facility, 91% (231) had at least one full-time employee and 68% (172) had at least one part-time employee. The majority of centers (59%, N=150) reported having both full and part-time employees. Detailed information on staff in these centers is summarized in Table 9 and Table 10.
The majority of teachers work between 5 and 8 hours daily (61%, N=158) or from 8 to 10 hours daily (24%, N=63). Only 8%(21) of teachers worked less than 5 hours daily and 2%(4) of teachers worked 10 or more hours a day. Thirteen respondents did not answer this question.
pg. 13

Table 9. Number of Full-Time Employees
ALL LICENSED TYPE I LICENSED TYPE II*
Full-Time Employment
%(N) Centers with Position Mean SD Min Max %(N) Centers
with Position Mean SD Min Max %(N) Centers with Position
Mean SD Min Max
Directors * 90%(227) 1.1 .6 0 3 93%(227) 1.1 .6 0 3 100%(9) 1.1 .3 1 2
Infant teachers 53%(135) 1.2 1.5 0 9 54%(132) 1.2 1.5 0 9 33%(3) .4 .7 0 2
Toddler teachers 63%(153) 1.6 1.9 0 13 64%(157) 1.6 1.9 0 13 22%(2) .3 .7 0 2
Preschool teachers 75%(191) 2.4 3.1 0 30 78%(189) 2.5 3.1 0 30 22%(2) .3 .7 0 2
School age teachers 39%(98) .7 1.3 0 12 40%(97) .7 1.3 0 12 11%(1) .3 .7 0 2
Assistant teachers/Aides 41%(104) 1.3 2.5 0 20 41%(101) 1.3 2.5 0 20 33%(3) .3 .5 0 1
All Full-Time 91%(231) 8.3 7.2 0 51 91%(222) 8.5 7.3 0 51 100%(9) 2.8 2.4 1 9
pg. 14

Table 10. Number of Part-Time Employees
ALL LICENSED TYPE I LICENSED TYPE II**
Part-Time Employment
%(N) Centers with Position Mean SD Min Max %(N) Centers
with Position Mean SD Min Max %(N) Centers with Position
Mean SD Min Max
Directors * 15%(37) .2 .4 0 3 14%(35) .2 .4 0 3 11%(1) .1 .3 0 1
Infant teachers 24%(63) .4 1.0 0 9 26%(63) .5 1.0 0 9 0%(0) - - - -
Toddler teachers 28%(72) .6 1.3 0 12 29%(71) .6 1.3 0 12 11%(1) .1 .3 0 1
Preschool teachers 39%(99) 1.2 2.4 0 16 41%(99) 1.2 2.4 0 16 0%(0) - - - -
School age teachers 31%(79) .9 2.0 0 18 32%(79) .9 2.1 0 18 0%(0) - - - -
Assistant teachers/Aides 36%(92) 1.2 2.6 0 23 38%(92) 1.3 2.6 0 23 0%(0) - - - -
All Part Time 68%(172) 4.5 5.8 0 43 70%(170) 4.6 5.8 0 43 22%(2) .2 .4 0 1
All Staff 253(100%) 12.8 8.8 1 56 244(100%) 13.1 8.8 1 56 100%(9) 3 2.5 1 9
*Some centers had more than one Director. Other centers had ONLY Part-Time personnel.
**Less than 10 centers in italics.
pg. 15

Job Experience
Responses related to job experience of child care center employees revealed 28%(583) of all center employees started their current job during the past year (<1 year at a job). Respondents indicated that 30% (210) of the assistant teachers/aides and 20%(354) of the teachers have worked less than one year at their current center. A total of 5%(19)of the directors responded this was also their first year at the center.
A total of 67%(248) of respondents reported working as the director in their current center for 6 or more years. This number decreases to 30% (322) for the teachers in the center and to 19% (130) for assistant teachers/aides. Figure 5 reflects this information. Figure 5. Number of Years in Current Center by Job Title
Responses to questions regarding experience in early care and education by job title reflect the trends illustrated in Figure 6. Respondents indicated that 20%(133) of the assistant teachers/aides and 12%(203) of teachers have worked in early care and education for less than a year, with 9%(35) of directors just beginning their work in the field of early care and education. Responses indicate that directors have had more years of experience in early care and education with 81%(333) working in the field for six or more years. Teachers (49%, N=822) and assistant teachers/aides (28%, N=194) have had less experience in the field.
5%
20% 30%
11%
27%
31%
18%
24%
20%
28%
18% 8%
39%
12% 11%
0%
10%
20%
30%
40%
50%
60%
70%
80%
90%
100%
Director Teachers Assistant Teachers/Aides
>12 years
6 to 12 years
3 to 5 years
1 to 2 years
<1 year
pg. 16

Figure 6. Number of Years Experience by Job Title
Employee Turnover
Director’s responses reported a total of 3226 employees. A total of 20% (N=648) had left their job within the past 12 months. Of those who left their job, 172 had plans to remain in the field of early care and education (26%). Figure 7 illustrates retention rate by job type.
The staff most likely to have left their position in the past year were teachers assistants/ aides (30%, N=191). This was followed by teachers at 20% (N=449), and then directors at 2% (N=8). The rate of 20% for teacher turnover is better than the national rate of 30% (Porter, 2012).
A total of 38% (N=3) of directors who left their job reported planning to stay in the field of early care and education. This contrasts with 27% (N=122) of teachers and 23% of teachers assistants/aides (N=44) who were reported as planning to stay in the field, as described in Figure 8.
9% 12% 20% 2%
15%
23%
9%
23%
22%
20%
23%
16% 61%
26% 12%
0% 1% 5%
0%
10%
20%
30%
40%
50%
60%
70%
80%
90%
100%
Director Teachers Assistant Teachers/Aides
UNKNOWN
>12 years
6 to 12 years
3 to 5 years
1 to 2 years
<1 year
pg. 17

Figure 7. % Staff Leaving Job in Last 12 Months
Figure 8. Of those who left job, % Staying in Field
2%
19%
25%
17%
20%
20%
30%
0% 10% 20% 30% 40% 50%
Director
Infant Teacher
Toddler Teacher
Preschool Teacher
School Age Teacher
All Teachers
Assistant Teachers/Aides
38%
20%
23%
43%
11%
27%
23%
0% 10% 20% 30% 40% 50%
Director
Infant Teacher
Toddler Teacher
Preschool Teacher
School Age Teacher
All Teachers
Assistant Teachers/Aides
pg. 18

Volunteers
Sixty-three (24%) of the 259 respondents who provided details on staffing stated that they had unpaid volunteers at their centers. The number of weekly hours worked by volunteers ranged between less than one and up to 86. The average number of hours was 18.
Staff Availability
Responding to questions concerning staff availability, 55% reported they can find staff with experience in the field of early childhood (Agree/Strongly Agree). Only 37% reported agreement with statements concerning the ready availability of staff with degrees or training in early childhood education.. The statement resulting in the lowest level of agreement was “I can find qualified staff to teach and nurture children with special needs” with only 32% of respondents choosing agree/strongly agree. Table 11 describes respondents agreement to statements regarding the availability of qualified staff. Table 11. Availability of Qualified Staff
Strongly Agree Agree
Neither Agree
nor Disagree
Disagree Strongly Disagree
No Response
I can find qualified infant staff.) 8%(21) 28%(71) 30%(78) 11%(28) 4%(11) 19%(50)
I can find qualified toddler staff. 8%(21) 28%(73) 28%(73) 14%(35) 5%(13) 18%(44)
I can find qualified staff with degrees and training in early childhood education.
7%(18) 30%(78) 14%(37) 25%(66) 12%(30) 12%(30)
I can find qualified staff with abilities to teach and nurture children with special needs.
5%(13) 27%(69) 21%(56) 25%(65) 11%(28) 11%(28)
I can find qualified staff to work with children from culturally diverse backgrounds.
9%(23) 31%(81) 22%(57) 20%(52) 7%(17) 11%(29)
I can find staff with experience in the field of early childhood. 14%(36) 41%(105) 15%(38) 16%(42) 4%(11) 10%(27)
pg. 19

Center Wages and Benefits
Wages
Of the 259 respondents, 47%(123) responded to the questions regarding the director’s hourly wage, 69%(179) provided hourly wage figures for the teachers and 62%(160) provided hourly wage figures for assistant teachers/aides. Figure 9 provides the Average, Minimum, and Maximum Hourly Wage that centers would pay if they were “hiring today”. For all three job categories, Kentucky’s hourly reported wages were significantly below that of the nation. Grey lines indicate the national median (50th Percentile) while the lowest/highest starting average salaries for Kentucky’s workers by job category are shown beside the green markers (U. S. Bureau of Labor Statistics, 2013). Figure 9. Kentucky Hourly Wage by Position
Of the 259 respondents, 30%(77) responded to the questions regarding the Director’s Annual Salary, 21%(53) provided annual salary figures for teachers, with 14%(36) providing annual salary figures for assistant teachers/aides. Figure 10 provides the Average, Minimum, and Maximum Annual Salary that centers would pay if they were “hiring today”. Kentucky’s reported annual salaries were significantly below that of the national average. Grey lines in the chart provide the national average while the lowest/highest starting average salaries for Kentucky’s workers by job category are shown beside the green markers (U. S. Bureau of Labor Statistics, 2013).
Results indicate directors are paid more than teachers and teachers are paid more than teacher’s aides/assistants.
LowestSalary
HighestSalary
LowestSalary
HighestSalary
LowestSalary
HighestSalary
Directors Teachers Assistant Teachers/Aides
75th Percentile $14.27 $16.61 $9.00 $12.00 $8.07 $9.76
25th Percentile $8.75 $9.51 $7.25 $8.25 $7.25 $7.50
50th Percentile $10.25 $13.00 $8.00 $9.82 $7.35 $8.25
$10.25
$13.00
$8.00 $9.82
$7.35 $8.25
$-
$10.00
$20.00
$30.00
2012 Median-National=$21.13 2012 Median-National=$13.04
2012 Median-National=$9.38
pg. 20

Figure 10. Kentucky Annual Salary by Position
Benefits
Information regarding their center benefits as reported by the 259 respondents is provided in Table 12. Results indicate that directors and then teachers are more likely to receive benefits than assistant teachers/aides. Full-time employees are also more likely to receive benefits than part-time.
The five most frequently provided benefits reported (in order) include: financial assistance for workshops, institutes, and conferences, paid holidays, paid vacation, on-site workday training, and off-site training during workday.
Benefits least reported by centers include: training or educational loans, wage supplements based on training/experience, formal mentoring, Long Term Disability insurance, and Short Term Disability insurance.
LowestSalary
HighestSalary
LowestSalary
HighestSalary
LowestSalary
HighestSalary
Directors TeachersAssistant
Teachers/Aides
75th Percentile $30,000 $40,000 $22,500 $31,000 $17,000 $18,500
25th Percentile $20,000 $23,712 $12,656 $15,600 $10,000 $9,875
50th Percentile $25,000 $28,000 $16,000 $21,000 $14,700 $15,800
$25,000 $28,000
$16,000 $21,000
$14,700 $15,800
$-
$20,000.00
$40,000.00
$60,000.00
2012 Median National=$43,950
2012 Median National=$27,130 2012 Median National=$19,510
pg. 21

Table 12. Benefits
Directors Teachers Assistant Teachers/Aids
PT (1) FT (2) PT (1) FT (2) PT (1) FT (2) Financial assistance for workshops, institutes, conferences, etc.
16%(41) 51%(133) 36%(92) 46%(118) 34%(88) 38%(98)
On-site training during paid workday 16%(42) 42%(109) 32%(83) 40%(104) 29%(74) 31%(79)
Off-site training during paid workday 15%(40) 43%(110) 31%(81) 39%(100) 30%(78) 31%(79)
Tuition reimbursement not through the Early Childhood Scholarship
7%(18) 17%(43) 13%(34) 17%(45) 10%(25) 13%(34)
Formal mentoring 5%(14) 9%(23) 11%(29) 13%(34) 10%(26) 11%(29) Reimbursement of training expenses (i.e., travel, hotel, food)
11%(29) 35%(91) 22%(56) 28%(73) 19%(49) 19%(49)
Training or educational loans 2%(6) 9%(23) 4%(10) 7%(18) 4%(10) 6%(15)
Differential pay based on education and credentials 11%(30) 36%(93) 26%(68) 36%(93) 21%(55) 26%(67)
Differential pay based on early care and education experience)
11%(28) 32%(84) 24%(62) 33%(84) 20%(50) 22%(57)
Wage supplement based on training and experience
3%(8) 11%(29) 7%(18) 11%(28) 4%(11) 8%(20)
Short-term disability insurance 3%(7) 21%(53) 7%(19) 18%(47) 5%(12) 14%(37)
Long-term disability insurance ) 2%(6) 18%(46) 7%(18) 16%(41) 4%(11) 12%(32)
Retirement Plan 4%(9) 27%(70) 7%(18) 23%(60_ 4%(11) 15%(39) Paid Sick Leave 10%(10) 41%(106) 19%(49) 36%(94) 15%(38) 26%(67) Paid Vacation 14%(37) 51%(133) 23%(60) 48%(124) 18%(46) 35%(90) Paid Holidays 15%(38) 57%(148) 28%(72) 52%(134) 23%(59) 40%(97)
pg. 22
Differential Pay
Table 13 indicates center considerations for differential pay as reported by respondents. Top two staff qualifications for which centers offer differential pay are education level (54%) and type and amount of training (39%). Table 13. Qualifications for Differential Pay
Directors
%(N) Teachers
%(N)
Assitant Teachers/Aides
%(N)
Level of education 54%(140) 28%(72) 18%(47)
Type and amount of training 39%(102) 39%(102) 21%(55)
Demonstrated cultural competency 10%(28) 68%(176) 21%(55)
Languages spoken 7%(18) 71%(184) 22%(57)
Something else, please specify: ___* 14%(37) 34%(87) 52%(135)
*Other qualifications specified included: experience (27), years working at center (3), competency/performance (5), Montessori Certification (1), Experience with Bright Horizons (1), 1st aide/CPR orientation (1), involvement with children (1), Level of Education (but only for Bachelors and higher)(1), CDL(1), Can’t afford to pay higher but would love to (1), Survey doesn’t cover our situations (1).
Health Insurance
In all, 36%(93) of respondents indicated their center has some type of provision for health insurance for employees, with full-time employees provided insurance more often than part-time employees. Directors and teachers were most likely to be reported as being provided coverage that was paid for by the center. Table 14 provides details to responses to questions regarding health insurance.
pg. 23

Table 14. Health Insurance
Directors Teachers Assistant Teachers/Aides
PT FT PT FT PT FT
Fully paid insurance for employee and dependents.
0%(0) 4%(11) 0%0%(0) 2%(5) 0%(0) 1%(3)
Fully paid insurance for employees only (no dependents).
1%(2) 10%(26) 2%(4) 8%(22) 0%(1) 4%(7)
Partially paid insurance for employee and dependents.
4%(9) 10%(27) 4%(11) 10%(26) 3%(7) 9%(22)
Partially paid insurance for employee only (no dependents).
2%(5) 9%(22) 2%(6) 8%(21) 1%(2) 7%(18)
Health insurance is available but unpaid.
3%(7) 6%(16) 4%(11) 5%(14) 5%(12) 5%(27)
Analyses conducted ONLY on those centers providing information on their staff numbers (253), revealed 39% (1245) of the 3,226 staff had health insurance offered through their workplace. This figure is higher than the national estimates for child care workers of 33% provided by Herzenberg, Price, and Bradley (2005) and 21% from Smith and Baughman (2007). It is still significantly lower than the 66% for the nation as a whole (Herzenberg, Price, and Bradley, 2005).
Dental Insurance
Overall 30% (77) of respondents indicated their centers had some type of dental insurance available for employees. Of the respondents providing information on the number of staff employed (253), 30%(981) of the 3226 employees had employers offering dental insurance. Again, full-time employees were provided insurance more often than part-time employees. Directors and then teachers were more likely to have coverage that was paid for by the center than teacher assistants/aides. See Table 15 for details about dental insurance.
pg. 24

Table 15. Dental Insurance
Directors Teachers Assistant Teachers/Aides
PT (1) FT (2) PT (1) FT (2) PT (1) FT (2) Fully paid insurance for employee and dependents. (1)
0%(1) 1%(3) 0%(1) 0%(1) 0%(0) 0%(0)
Fully paid insurance for employees only (no dependents). (2)
1%(2) 5%(14) 1%(3) 4%(11) 1%(2) 3%(8)
Partially paid insurance for employee and dependents. (3)
2%(4) 7%(19) 3%(9) 7%(18) 3%(7) 5%(12)
Partially paid insurance for employee only (no dependents).
0%(1) 4%(10) 2%(5) 4%(11) 1%(2) 3%(7)
Dental insurance is available but unpaid (5) 4%(11) 15%(40) 5%(14) 14%(35) 4%(11) 10%(26)
Working Environment
Center Policies
Table 16 provides information regarding policies effecting the work environment for child care workers. It is sorted so that policies most frequently provided by centers are at the top of the table. Generally, policies regarding organizational structure and staff performance (ie. personnel policies, job descriptions, evaluation, and orientation to work) are reported as being provided most frequently. Policies requiring increase in expenses to the center (ie. cost of living increase, paid lunch, PD stipend) are reported as less likely to be provided.
pg. 25

Table 16. Center Policies
Yes %(N) No %(N) No Response %(N)
Written personnel policies 79%(203) 0%(1) 21%(55) Written job description 79%(203) 0%(1) 21%(55) Annual evaluation 78%(201) 1%(3) 21%(55)
Orientation program when hired 75%(195) 3%(8) 21%(56)
Payment for attendance at staff meetings after working hours
67%(173) 10%(26) 23%(60)
Formal grievance procedure (for complaints) 67%(172) 8%(22) 25%(65) Paid break 63% (164) 9%(24) 28%(71) Compensation for overtime (either financial or time off) 62%(160) 13%(33) 26%(66)
Paid release time for attendance at off-site trainings and workshops 59%(153) 13%(35) 28%(71)
Paid release time for attendance at on-site in-service trainings
57%(149) 15%(37) 28%(73)
Paid preparation/planning time (not counting set-up or clean-up) 54%(141) 18%(46) 28%(72)
Payment for attendance at parent meetings after working hours 53%(138) 20%(51) 27%(70)
Staff lounge (break room) 49%(126) 25%(65) 26%(68)
Written contract 48%(125) 26%(66) 26%(68)
Periodic increase in wages based on performance 45%(117) 27%(70) 28%(66) Written salary schedule 41%(108) 31%(81) 27%(70) Stipend for professional development activities or materials
37%(96) 33%(85) 30%(78)
Paid lunch break 30%(78) 42%(42) 28%(28)
Yearly cost of living increase in wages 28%(72) 42%(109) 30%(78)
Professional Development
Professional Development Supports
Respondents indicated they most frequently were motivated to seek professional development in order “to gain skills and knowledge to improve my job performance” (29%, N=74). This was followed by “to support quality improvement of the center” (24%, N=61) and “to meet individual or program requirements” (17%, N=43). Only a few respondents indicated that they were primarily motivated by “improving my business or career” (2%, N=6). Six directors wrote in the response “All of the Above” and one director indicated that “to be of better service to her families” was her motivation.
Table 17 provides information on the familiarity that center directors reported regarding various professional development supports. These are listed from MOST to LEAST used.
pg. 26

Table 17. Professional Development Supports
Have Used %(N)
If you have used, please rate your level of satisfaction I'm not
aware of %(N)
I'm aware of but
haven't used %(N)
No Response
%(N) Very dissatisfied %
Dissatisfied %
Neither Agree or Disagree %
Satisfied %
Very Satisfied %
Early Care and Education Training Records Information System (ECE-TRIS)
60%(155) 2% 6% 21% 42% 30% 10%(25) 14%(36) 16%(43)
Kentucky STARS for KIDS NOW Technical Assistance 59%(154) 1% 6% 12% 39% 41% 5%(13) 20%(51) 16%(41)
Use of Individual Growth Plans/ PD Plans 58%(150) 3% 5% 21% 53% 17% 11%(28) 8%(21) 23%(60)
Kentucky Early Childhood Standards 57%(148) 1% 5% 20% 54% 20% 8%(22) 12%(31) 22%(58)
Early Childhood Council 54%(139) 3% 5% 22% 40% 31% 12%(30) 14%(35) 21%(55)
KIDS NOW Initiative 52%(135) 1% 1% 19% 46% 33% 11%(29) 23%(59) 14%(36)
Early Childhood Core Content 52%(134) 1% 2% 22% 53% 21% 13%(33) 14%(35) 22%(57)
KIDS NOW scholarships 51%(131) 1% 0% 9% 38% 52% 10%(27) 19%(48) 20%(53)
Early Childhood Scholarship Program 46%(118) 0% 0% 3% 41% 56% 13%(33) 21%(54) 21%(54)
Director’s Credential 44%(114) 0% 1% 9% 36% 54% 8%(21) 26%(68) 21%(56) Use of Early Childhood Professional Core Content Self-Assessment Form 43%(112) 2% 4% 25% 49% 21% 19%(48) 15%(38) 23%(61)
Milestone Achievement Award 42%(108) 0% 4% 6% 40% 50% 27%(70) 10%(25) 21%(56)
CDA and CDA-K mini-grants 41%(105) 0% 0% 7% 46% 48% 15%(40) 19%(50) 24%(64)
Kentucky Early Childhood Trainer’s Credential 37%(97) 1% 3% 26% 43% 27% 12%(32) 27%(70) 22%(60)
Quality Self-Study 36%(94) 1% 4% 31% 45% 19% 24%(62) 15%(40) 24%(63) Kentucky Early Childhood Continuous Assessment Guide 36%(92) 0% 1% 37% 45% 17% 25%(64) 15%(40) 24%(63)
Related Educational Reimbursement Award 31%(81) 0% 1% 12% 37% 49% 36%(93) 10%(27) 22%(58)
Use of a professional mentor, coach, or consultant 30%(78) 0% 5% 28% 41% 26% 29%(74) 16%(41) 25%(66) KDE Traineeship Scholarship (for special needs training) 12%(31) 0% 3% 52% 23% 23% 46%(119) 15%(38) 27%(71)
pg. 27

Use of ECE-TRIS
Overall, 54% (140) of survey participants stated that they CURRENTLY use the Early Care and Education Training Records Information System (ECE-TRIS) to track Professional Development. Twenty-five percent (66) do not use the system, and 20% (53) did not respond to the question, as described in Table 18. Of those who DO use ECE-TRIS, several admitted to having hours completed that had not been entered in the system. Table 18. Use of ECE-TRIS
% N
Unknown 65% 71
0-25% 24% 26
26-50% 6% 8
51-75% 4% 4
76-100% 0% 1
Of those respondents who do NOT use the system, 82%(54) indicated that they have received professional development. The amount of training received by these individuals is reflected in Table 19. Table 19. Training Hours NOT in ECE-TRIS
% N
Less than 15 hours 6% 3
15 hours 24% 13
16-17 hours 7% 4
18 hours 19% 10
19 hours or more 44% 24
Use of Quality Self Study
Of the 94 of respondents indicating they had used the Quality Self Study, 21%(20) indicated that they were not currently implementing, 66%(62) were “somewhat” implementing, and 13%(12) were “very” much implementing.
pg. 28

Use of KY Early Childhood Standards
Of those respondents that they used KY Early Childhood Standards (57%, N=148), the most frequent response was that the standards were used to “outline key learning goals in each of the major developmental milestones”. Table 20 reflects responses to use of the KY Early Childhood Standards. Table 20. Use of KY Early Childhood Standards
% N
The Kentucky Early Childhood Standards outline key learning goals in each of the major developmental domains, which are established as goals for children’s development to age three (0-3 Standards) or through age 4 (3-4 year Standards).
35% 51
The KY EC Standards may be used to ensure that assessment procedures cover all standards and benchmarks for a comprehensive understanding of a child’s functioning.
6% 9
The KY EC Standards can assist in planning experiences that promote children’s progress toward achieving benchmarks and standards.
20% 29
The KY EC Standards can assist to ensure that all activities, materials, and experienced provided for children address all components of each benchmark and standard.
17% 25
I do not use the KY EC Standards 14% 21
Other* 5% 8
No Response 3% 5
*Other responses include All of the above (1), serving a school-age population (2), awareness of but not using daily (1), to educate parents and our student employees on developmentally appropriate practice (1), would like more information on standards (1), some of the above (2), keep in mind when doing curriculum (1)
pg. 29

Availability of Professional Development by Region
Respondents generally indicated that they could find professional development opportunities near their home or work (49%), could find affordable opportunities (48%), and to a lesser extent could find high quality opportunities (37%).
Respondents from Eastern (25%) and Western Kentucky (26%) expressed more concern (either disagreed or strongly disagreed) than those respondents in Central Kentucky (15%) regarding finding nearby opportunities. Similarly, Eastern (26%) and Western Kentucky (22%) were not as sure that they could find affordable opportunities as those in Central Kentucky (12%). Respondents from Central Kentucky expressed the most concern about finding high quality opportunities (22% disagree/strongly disagree). Table 21 reflects reported availability of professional development by region. Table 21. Availability of Professional Development
Strongly Agree
Agree Neither Agree nor Disagree
Disagree Strongly Disagree
No Response
I can find opportunities for professional development near my home or work.
Central 19%(31) 32%(51) 7%(11) 12%(19) 3%(4) 28%(44)
East 10%(3) 35%(11) 6%(2) 19%(6)) 6%(2) 23%(7)
West 13%(9) 31%(21) 12%(8) 16%(11) 10%(7) 18%(12)
Statewide 17%(43) 32%(83) 8%(21) 14%(36) 5%(13) 24%(63)
I can find professional development that is affordable.
Central 13%(20) 38%(60) 10%(16) 10%(16) 2%(3) 28%(45)
East 13%(4) 23%(7) 13%(4) 23%(7) 6%(2) 23%(7)
West 10%(7) 37%(25) 13%(9) 18%(12) 4%(3) 18%(12)
Statewide 12%(31) 36%(92) 11%(29) 14%(35) 3%(8) 25%(64)
I can find professional development that is high quality.
Central 6%(10) 27%(43) 18%(28) 14%(22) 8%(12) 28%(45)
East 13%(4) 29%(9) 23%(7) 10%(3) 3%(1) 23%(7)
West 6%(4) 37%(25) 22%(15) 9%(6) 6%(4) 21%(14)
Statewide 7%(18) 30%(77) 19%(50) 12%(31) 7%(17) 25%(66)
Interest in Professional Development by Region
Respondents were asked to identify what professional development topics interested them the most. Table 22 indicates the reported top five topics: identified in blue below for the State as a whole and then for each Region of the state. There were two topics that fell into the top five for all regions: Behavior Management and Guidance and Child Development.
pg. 30
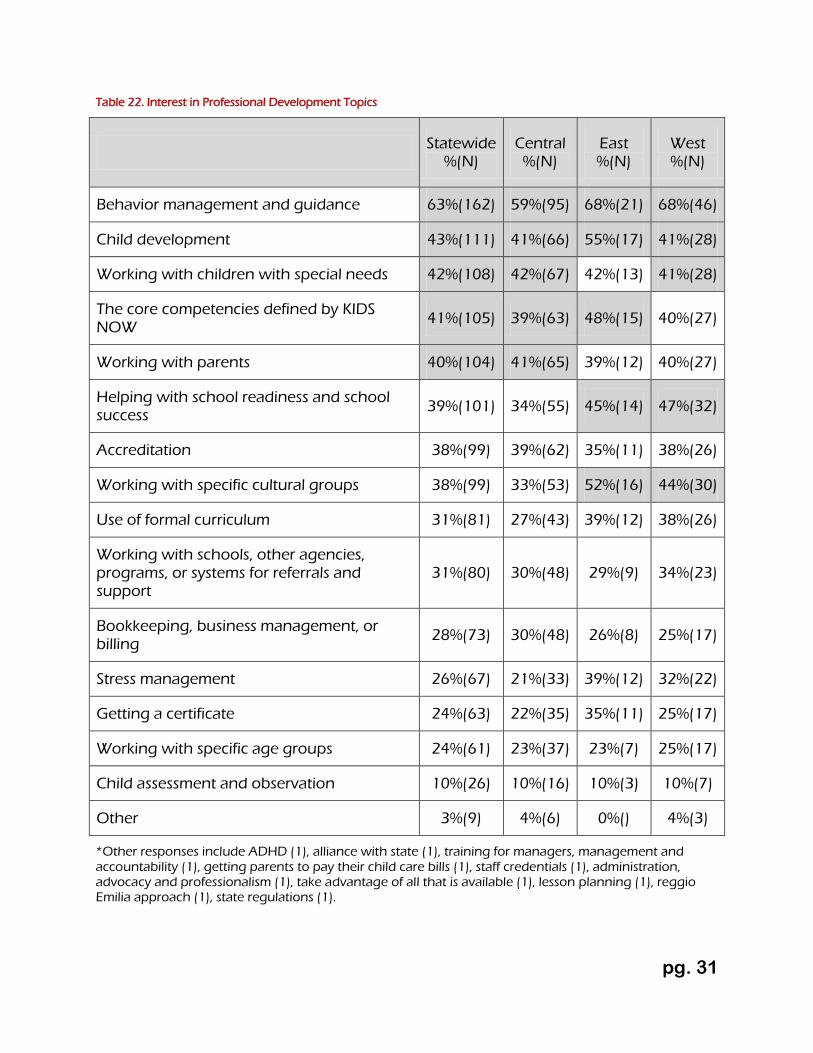
Table 22. Interest in Professional Development Topics
Statewide %(N)
Central %(N)
East %(N)
West %(N)
Behavior management and guidance 63%(162) 59%(95) 68%(21) 68%(46)
Child development 43%(111) 41%(66) 55%(17) 41%(28)
Working with children with special needs 42%(108) 42%(67) 42%(13) 41%(28)
The core competencies defined by KIDS NOW 41%(105) 39%(63) 48%(15) 40%(27)
Working with parents 40%(104) 41%(65) 39%(12) 40%(27)
Helping with school readiness and school success 39%(101) 34%(55) 45%(14) 47%(32)
Accreditation 38%(99) 39%(62) 35%(11) 38%(26)
Working with specific cultural groups 38%(99) 33%(53) 52%(16) 44%(30)
Use of formal curriculum 31%(81) 27%(43) 39%(12) 38%(26)
Working with schools, other agencies, programs, or systems for referrals and support
31%(80) 30%(48) 29%(9) 34%(23)
Bookkeeping, business management, or billing 28%(73) 30%(48) 26%(8) 25%(17)
Stress management 26%(67) 21%(33) 39%(12) 32%(22)
Getting a certificate 24%(63) 22%(35) 35%(11) 25%(17)
Working with specific age groups 24%(61) 23%(37) 23%(7) 25%(17)
Child assessment and observation 10%(26) 10%(16) 10%(3) 10%(7)
Other 3%(9) 4%(6) 0%() 4%(3)
*Other responses include ADHD (1), alliance with state (1), training for managers, management and accountability (1), getting parents to pay their child care bills (1), staff credentials (1), administration, advocacy and professionalism (1), take advantage of all that is available (1), lesson planning (1), reggio Emilia approach (1), state regulations (1).
pg. 31

Barriers to Professional Development
Respondents reported several barriers that kept them from attending professional development opportunities. The top two were transportation (52% agree/strongly agree) and “don’t plan to be in the child care field long term” (52%). Inability to get a substitute (37%), difficulty accessing online opportunities (34%), and not enough information about opportunities available (34%) also caused some difficulties. The barrier causing problems for the fewest individuals was “not having enough time” (49% disagree/strongly disagree). See Table 23 for details. Table 23. Barriers to Professional Development
Strongly Agree %(N)
Agree %(N)
Neither Agree nor Disagree
%(N)
Disagree %(N)
Strongly Disagree
%(N)
No Response
%(N)
I don’t have enough information about oppor-tunities available to me.
5%(13) 29%(74) 18%(46) 16%(41) 5%(13) 28%(72)
I don’t have enough time. 4%(10) 13%(33) 16%(41) 33%(86) 10%(25) 25%(64) The cost is too high. 5%(12) 13%(34) 24%(62) 24%(61) 10%(25) 25%(65) I don’t like the trainings available. 4%(9) 20%(51) 29%(75) 19%(48) 4%(10) 25%(66)
It is not useful enough to be worth my time/ energy/resources.
9%(24) 18%(47) 30%(76) 14%(37) 4%(9) 25%(66)
I don’t plan on being in the child care field long term.
33%(85) 19%(47) 10%(25) 5%(12) 7%(17) 28%(73)
I have concerns about the relevance of trainings available to me.
11%(28) 16%(41) 25%(66) 15%(38) 7%(18) 26%(68)
I do not have transportation to get to available trainings.
33%(87) 19%(48) 10%(26) 4%(9) 6%(15) 29%(74)
I cannot get a substitute. 20%(51) 17%(44) 18%(47) 10%(27) 8%(20) 27%(20)
Available trainings are not offered at convenient times.
10%(26) 13%(35) 21%(54) 21%(55) 8%(20) 27%(69)
The location of offered trainings is inconvenient. 8%(21) 15%(40) 22%(57) 19%(49) 9%(22) 27%(70)
I have difficulty accessing online training opportunities.
16%(42) 18%(46) 21%(54) 12%(31) 7%(17) 27%(69)
pg. 32
Professional Development at Your Center
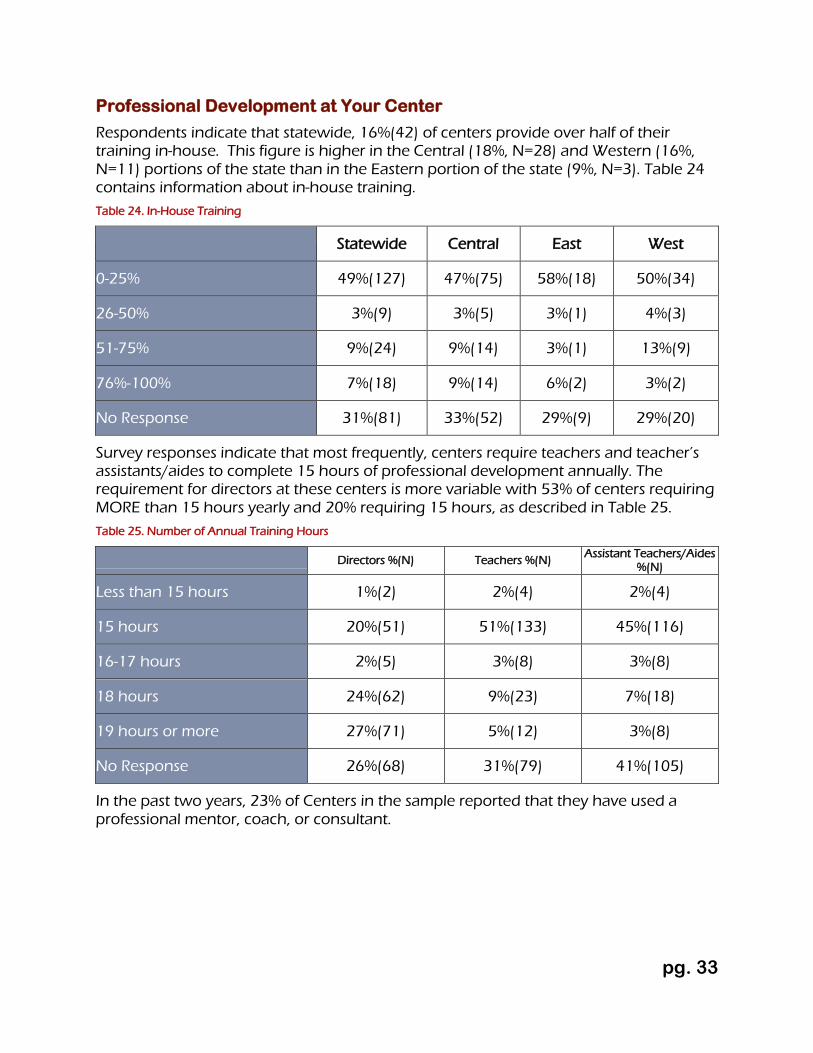
Respondents indicate that statewide, 16%(42) of centers provide over half of their training in-house. This figure is higher in the Central (18%, N=28) and Western (16%, N=11) portions of the state than in the Eastern portion of the state (9%, N=3). Table 24 contains information about in-house training. Table 24. In-House Training
Statewide Central East West
0-25% 49%(127) 47%(75) 58%(18) 50%(34)
26-50% 3%(9) 3%(5) 3%(1) 4%(3)
51-75% 9%(24) 9%(14) 3%(1) 13%(9)
76%-100% 7%(18) 9%(14) 6%(2) 3%(2)
No Response 31%(81) 33%(52) 29%(9) 29%(20)
Survey responses indicate that most frequently, centers require teachers and teacher’s assistants/aides to complete 15 hours of professional development annually. The requirement for directors at these centers is more variable with 53% of centers requiring MORE than 15 hours yearly and 20% requiring 15 hours, as described in Table 25. Table 25. Number of Annual Training Hours
Directors %(N) Teachers %(N) Assistant Teachers/Aides
%(N)
Less than 15 hours 1%(2) 2%(4) 2%(4)
15 hours 20%(51) 51%(133) 45%(116)
16-17 hours 2%(5) 3%(8) 3%(8)
18 hours 24%(62) 9%(23) 7%(18)
19 hours or more 27%(71) 5%(12) 3%(8)
No Response 26%(68) 31%(79) 41%(105)
In the past two years, 23% of Centers in the sample reported that they have used a professional mentor, coach, or consultant.
pg. 33

Quality Improvement Initiatives
Familiarity
The majority of participants (73%, N=188) stated that they had heard about Kentucky’s Quality Rating and Improvement System (STARS for KIDS NOW). When asked the primary purpose of STARS for KIDS NOW, the majority of respondents stated the primary purpose was to improve early care and education program quality (61%, N=157). Seven percent(18) respondents thought the STARS for KIDS NOW program was to provide information to parents about program quality; 2%(3) thought the program primarily provided monetary incentives to programs; and 0%(1) thought that it was to provide marketing materials to programs. Two respondents did not answer this follow-up question.
Source of Information on Quality Initiatives
Seventy-two percent of respondents (187) answered the question regarding the most important source of information/influence on their understanding of high quality practices. Consultant/TA Specialist was selected most frequently as the source of information on quality program initiatives. This was followed by supervisor or former supervisor. Table 26 details all responses. Table 26. Source of Information/Influence on Practices
N %
A consultant/TA specialist 42 22%
Supervisor or former supervisor 33 18%
Co-worker or former co-worker 8 4%
A local child care agency 24 13%
A provider support network 8 4%
Another child care professional 25 13%
A family member 4 1%
Other, please specify: * 42 22%
*Other responses include: CCR&R (4), STARS (9), college professor (2), IECE classes (2), education (2), Montessori (2), SQC (2), NAEYC (2), college (1), classes (1), accrediting agency (1), corporate (1), , education sources (1), experience (1), experience and education (1), foster care (1), head start (1), community action (1), CCHC (1), school system (1), myself (1), other Goddard schools (1), education department (1), PD Counselor (1), previous employer (1), research (1), STAR Rater (1).
pg. 34

Identified Priorities
Respondents most frequently listed improvements in staff wages and benefits/hiring additional staff as the primary concern for improving quality in their centers. This was followed by staff training and professional development. The next highest ranked priorities were supplies for the classroom, equipment for outside, and renovations of their building. Lowest on the priority ranking were assessment tools, materials for children with special needs, and NAEYC or other national accreditation. Table 27 lists these priorities in order of importance. Table 27. Identified Priorities
First %(N) Second %(N)
Third %(N)
Increase staff wage, hire additional staff, increase staff benefits 29%(74) 11%(29) 9%(24)
Staff Training and/or Education, Staff Professional Development 25%(65) 10%(26) 7%(19)
Supplies, Games, Books, Materials for the classroom 11%(28) 10%(26) 8%(20) Equipment for outside 10%(26) 12%(31) 5%(12) Renovations to the building or physical space 9%(22) 8%(20) 12%(32) Enrichment Programs for Children (e.g. music, art, storyteller) 7%(19) 10%(25) 9%(24)
Curriculum Tools 7%(17) 11%(30) 6%(15) Relationships with families (e.g. newsletter, website) 8%(20) 5%(13) 8%(22) Assessment Tools 3%(7) 11%(30) 5%(14) Materials specifically for children with special needs 5%(13) 9%(22) 4%(9) NAEYC or other national accreditation 3%(9) 5%(13) 13%(33)
When Directors were asked how they would spend money to improve outcomes if resources were limitless, the responses were much the same as indicated in Table 28. They would first hire staff with advanced degrees, renovate their physical space, and add additional staff to their center. The next ranked priorities included professional development, playground equipment, and added learning materials for the children. Assessment tools, increasing communication with families, and curriculum tools received the lowest rankings. Table 28 indicates reported activities to improve outcomes.
pg. 35

Table 28. Improve Outcomes
First %(N) Second %(N)
Third %(N)
Hire staff with advanced degrees 28%(73) 10%(10) 3%(7) Renovate the physical space 12%(31) 10%(27) 12%(31) Hire additional staff 21%(53) 11%(28) 5%(13) Provide professional development training to me or my staff (either in-house or reimbursement for) 17%(44) 9%(22) 9%(22)
Purchase additional learning materials for children 12%(32) 14%(37) 14%(36) Purchase/Improve playground facilities 12%(31) 12%(30) 13%(33) Use a curriculum tool 7%(18) 8%(22) 5%(13) Increase communication with families 9%(24) 3%(9) 6%(15) Use an assessment tool 5%(14) 7%(18) 5%(14)
Barriers to Improvement
Directors see their biggest barriers to improvement as: finding qualified staff; lack of funding to implement quality initiatives; and, lack of funding for professional development. Directors were less likely to see language barriers, child turnover, and reimbursement for child care subsidies as issues that would impede efforts towards quality improvement, as described in Table 29. Table 29. Barriers to Improvement
Biggest
Obstacle
Next Biggest
Obstacle
Next Biggest
Obstacle Finding qualified staff 27%(71) 9%(22) 4%(10) Lack of funding for other quality improvements (e.g. applying for national accreditation, improvements to the physical space)
21%(55) 12%(31) 12%(32)
Lack of funding for professional development opportunities (e.g. curriculum & assessment training, continuing education)
9%(23) 17%(45) 8%(21)
Constraints imposed by the physical location or building 10%(24) 10%(24) 10%(25)
Staff turnover 7%(17) 11%(28) 5%(12) Lack of quality professional development opportunities for me or my staff 6%(15) 10%(25) 7%(18)
Lack of parent involvement 6%(15) 5%(13) 12%(31) Lack of prep time for me/ staff 6%(15) 6%(16) 7%(19) I am / Staff are required to work long hours 5%(12) 6%(16) 5%(14) Reimbursement for child care subsidy is too time-consuming and/or unreliable 2%(5) 8%(20) 7%(17)
Child turnover 3%(8) 4%(10) 5%(14) Language barriers with families 0%(1) 3%(7) 6%(16)
pg. 36

Conclusion Response Rate: The 2012 Workforce Director’s Survey was sent to all 1789 Directors at Licensed Type I and Type II facilities in the state of Kentucky. Two-hundred fifty-nine of the Directors returned a valid survey for a response rate of 15%. This exceeds the response rate of 11% hoped for during the planning phase of the survey.
Program Characteristics: The percent of returned surveys from each portion of the state very closely aligns to the percent of facilities operating in each of Kentucky’s regions. However, only 8% of directors from Type II facilities across the state responded to the survey in contrast to 15% of those from Type I facilities. While the overall sample adequately represents the different regions in Kentucky as well as the Type I centers, the Type II facilities are underrepresented. Results, while reflective of this sample, may not always be accurately generalized to Type II facilities.
Staff to child ratios averages at Type I facilities were 1 staff to every: 4.6 infants, 6.1 toddlers, 9.7 preschoolers, and 12.9 school aged children. For Type II facilities the averages were 1 staff to every: 4.6 infants, 5.3 toddlers, 4.7 preschoolers, and 7 school aged children. These ratios are generally within the required state limits.
Forty-nine (127) of the respondents stated that they had children whose parents were either Active Duty Military or in the National Guard or Reserve. On average, these centers served 2 military-connected children in their facility. The total number served ranged from 0 to 12.
Staff Turnover, Wages, Benefits: Generally, Directors had spent more time in their current center and had more years of experience than teachers. And, teachers had spent more time in their center as well as had more years of experience than teachers’ assistants/aides. When employee turnover was examined, only about 2% of directors had left their job in the past year. This is compared to 20% of teachers and 30% of teacher assistants/aides. Although the number of individuals leaving each year continues to be alarming, the data on teacher Turnover from this sample (20%) is significantly below that of the national figure of 30% (Porter, 2012).
Kentucky’s Hourly and Annual Wages for all three position types were significantly and consistently below the national average as reported by the U. S. Bureau of Labor Statistics (2013). When asked what the highest annual salary would be for new hires, Directors responses indicated a median salary of $28,000 for new directors, $21,000 for new teachers, and $15,800 for new teacher aides/assistants. This contrasts to the average median nationwide salary of $43,950 for directors, $27,130 for teachers, and $19,510 for teacher aides. Differential pay was most often offered in Kentucky centers based on level of education (54%) and type/amount of training (39%).
Approximately 39% of staff in the respondent’s centers had access to some level of employee provided health care. This exceeds nationwide figures of 33% and 21% (Herzenberg, Price, & Bradley, 2005; Smith & Baughman, 2007) but is still significantly below the percentage of the workforce as a whole (66%) (Smith & Baughman, 2007). Other than insurance, the five most frequently provided benefits included: financial assistance for workshops, paid holidays, paid vacation, on-site workday training, and off-site workday training.
pg. 37

Professional Development: Of the professional development supports provided, directors have most used: ECE-TRIS (60%), KY STARS for KIDS NOW Technical Assistance (59%), Professional Development Plans (58%), KY Early Childhood Standards (57%), and the Early Childhood Council (54%). By contrast, they have least used: KDE Traineeship Scholarships (12%), a professional mentor or coach (30%), and The Related Educational Reimbursement Award (31%).
Responses to statements concerning the ability to find nearby, affordable, and high quality professional development opportunities varied by region of the state. Respondents from Eastern (25%) and Western (26%) regions of the state expressed more concern than those from Central Kentucky (15%) for finding nearby opportunities. Eastern (26%) and Western (22%) region respondents were also not as sure about finding affordable opportunities as reported by those in the Central Kentucky region (12%). Respondents from Central Kentucky (22%) were more concerned about finding high quality opportunities than those in the other Eastern (13%) and Western (15%)regions .
The most frequently requested topics for professional development include Behavior Management and Guidance (63%), Child Development (43%), and Working with Children with Special Needs (42%) The two most cited barriers to professional development were transportation (52%) and “don’t plan to be in the childcare field long term” (52%). About 16% of respondents reported that at least half of their professional development training is in-house. The majority of centers require 15 hours of training for teachers (51%) and assistant teachers/aides (45%). Fifty-one percent of directors are required to have 18 or more hours of training per year.
Directors feel they can find staff with experience in the field of early childhood (55% agree/strongly agree). Respondents indicated that it was harder to find staff qualified to teach and nurture children with special needs (32%); find qualified infant staff (36%); find qualified toddler staff (36%) or find qualified staff with degrees and training in early childhood education (37%).
Quality Improvement: The majority of directors have heard about STARS for KIDS NOW (73%) and understand the purpose as being to improve the early care and education program for the state of Kentucky (61%). Most frequently, their source of information for this program is from a consultant or TA specialist (22%) or a supervisor/former supervisor (18%).
A primary concern of respondents appears to be related to finding and paying qualified staff. The highest identified priority was to Increase “Staff Wages, Hire Additional Staff, and Increase Staff Benefits”. The barrier cited most frequently was to “find Qualified Staff”. With unlimited resources, respondents said they would “Hire Staff with Advanced Degrees” and “Hire Additional Staff”. In the top five of all three questions regarding priorities and concerns was “Renovations to Physical Space”, and “Staff Training and/or Education, Staff Professional Development”.
pg. 38

References
Dillman, D.A., Smyth, J.D. & Christian, L.M. (2009). Internet, mail, and mixed-mode surveys: The tailored design method. 3rd Edition. Hobokon, NJ: John Wiley & Sons. [ISBN 978-0-471-69868-5 cloth]
Herzenberg, Stephen; Price, Mark, and Bradley, David (2005). Losing Ground in Early childhood Education: Declining Workforce Qualifications in Expanding Industry (Executive Summary). Retrieved from http://www.epi.org/publication/study_ece_summary/.
Porter, Noriko (2012). [USA] High Turnover among Early Childhood Educators in the United States [Project Published Online]. Retrieved from http://www.childresearch.net/projects/ecec/2012_04.html.
Smith, Kristin and Baughman, Reagan (2007). Low Wages Prevalent indirect Care and Child Care Workforce (Policy Brief No. 7). Durham: University of New Hampshire, Carsey Institute. Retrieved from http://www.carseyinstitute.unh.edu/publications/PB_caregivers.pdf.
U. S. Bureau of Labor Statistics. (2013). News Release on Occupational Employment and Wages—May 2012. Retrieved from http://www.bls.gov/news.release/ocwage.htm.
pg. 39