LIBERTY AMERICA - LLA
26
LIBERTY LATIN AMERICA FY 2020 INVESTOR CALL March 1, 2021 Part of Liberty Latin America
Transcript of LIBERTY AMERICA - LLA

LIBERTY
LATIN
AMERICAFY 2020 INVESTOR CALL
March 1, 2021
Part of Liberty Latin America
LIBERTY LATIN AMERICA | Q3 2019 INVESTOR CALL | NOVEMBER 6, 2019
“SAFE HARBOR”
FORWARD-LOOKING STATEMENTS AND DISCLAIMER
This presentation contains forward-looking statements within the meaning of the Private Securities
Litigation Reform Act of 1995, including statements regarding our strategies, priorities and focus areas,
growth ambitions, financial performance and guidance, revenue growth expectations and Adjusted Free
Cash Flow expectations for 2021; expected new build and upgrade activity in 2021 and estimated P&E
additions as a percent of revenue; the opportunity to bring high-speed connectivity to more households in
the region; the anticipated impact of the COVID-19 pandemic on our business and financial results and
regional economic outlook; our cost control and efficiency initiatives; our digital strategy, including
touchless channels for sales and services, and product innovation and commercial plans and projects
(including expectations regarding customer value propositions); our integration plans and synergies in
Puerto Rico following the AT&T Acquisition; the timing and impact of the acquisition of Telefónica's Costa
Rica business; the strength of our balance sheet and tenor of our debt; and other information and
statements that are not historical fact. These forward-looking statements involve certain risks and
uncertainties that could cause actual results to differ materially from those expressed or implied by these
statements. These risks and uncertainties include events that are outside of our control, such as
hurricanes and other natural disasters, political or social events, and pandemics, such as COVID-19, the
uncertainties surrounding such events and efforts to contain any pandemic, the ability and cost to restore
networks in the markets impacted by hurricanes or generally to respond to any such events; the continued
use by subscribers and potential subscribers of our services and their willingness to upgrade to our more
advanced offerings; our ability to meet challenges from competition, to manage rapid technological
change or to maintain or increase rates to our subscribers or to pass through increased costs to our
subscribers; the effects of changes in laws or regulation; general economic factors; our ability to obtain
regulatory approval and satisfy conditions associated with acquisitions and dispositions, including the
acquisition of Telefónica's Costa Rica business; our ability to successfully acquire and integrate new
businesses and realize anticipated efficiencies from acquired businesses; the availability of attractive
programming for our video services and the costs associated with such programming; our ability to
achieve forecasted financial and operating targets; the outcome of any pending or threatened litigation;
the ability of our operating companies to access cash of their respective subsidiaries; the impact of our
operating companies' future financial performance, or market conditions generally, on the availability,
terms and deployment of capital; fluctuations in currency exchange and interest rates; the ability of
suppliers and vendors (including our third-party wireless network provider under our MVNO arrangement)
to timely deliver quality products, equipment, software, services and access; our ability to adequately
forecast and plan future network requirements including the costs and benefits associated with network
expansions; and other factors detailed from time to time in our filings with the Securities and Exchange
Commission, including our most recently filed Form 10-K. These forward-looking statements speak only
as of the date of this presentation. We expressly disclaim any obligation or undertaking to disseminate any
updates or revisions to any forward-looking statement contained herein to reflect any change in our
expectations with regard thereto or any change in events, conditions or circumstances on which any such
statement is based.
INFORMATION RELATING TO DEFINED TERMS
Please refer to the Appendix at the end of this presentation, as well as our SEC filings, for the definitions
of the following terms which may be used herein including: Rebased Growth, Adjusted Operating Income
Before Depreciation and Amortization (“Adjusted OIBDA”), Adjusted Free Cash Flow (“Adjusted FCF”),
Revenue Generating Units (“RGUs”), as well as non-GAAP reconciliations, where applicable.
FORWARD-LOOKING STATEMENT | DEFINED TERMS
2LIBERTY LATIN AMERICA | FY 2020 INVESTOR CALL | MARCH 1, 2021

AGENDAEXECUTIVE SUMMARY
02 | FINANCIAL RESULTS
03 | APPENDIX
01 |
Part of Liberty Latin America
LIBERTY LATIN AMERICA | Q3 2019 INVESTOR CALL | NOVEMBER 6, 2019
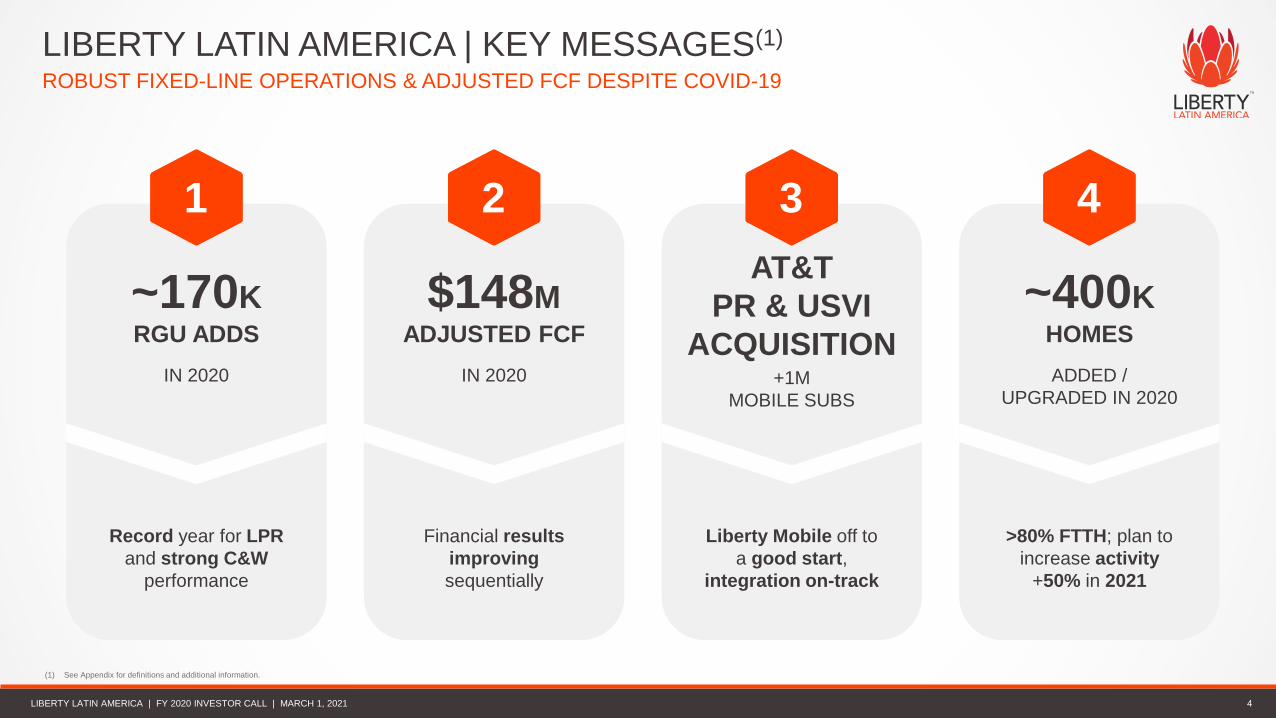
LIBERTY LATIN AMERICA | KEY MESSAGES(1)
ROBUST FIXED-LINE OPERATIONS & ADJUSTED FCF DESPITE COVID-19
4
(1) See Appendix for definitions and additional information.
1
~170KRGU ADDS
IN 2020
Record year for LPR
and strong C&W
performance
2
$148MADJUSTED FCF
IN 2020
Financial results
improving
sequentially
3
AT&T
PR & USVI
ACQUISITION+1M
MOBILE SUBS
Liberty Mobile off to
a good start,
integration on-track
4
~400KHOMES
ADDED /
UPGRADED IN 2020
>80% FTTH; plan to
increase activity
+50% in 2021
LIBERTY LATIN AMERICA | FY 2020 INVESTOR CALL | MARCH 1, 2021
LIBERTY LATIN AMERICA | Q3 2019 INVESTOR CALL | NOVEMBER 6, 2019
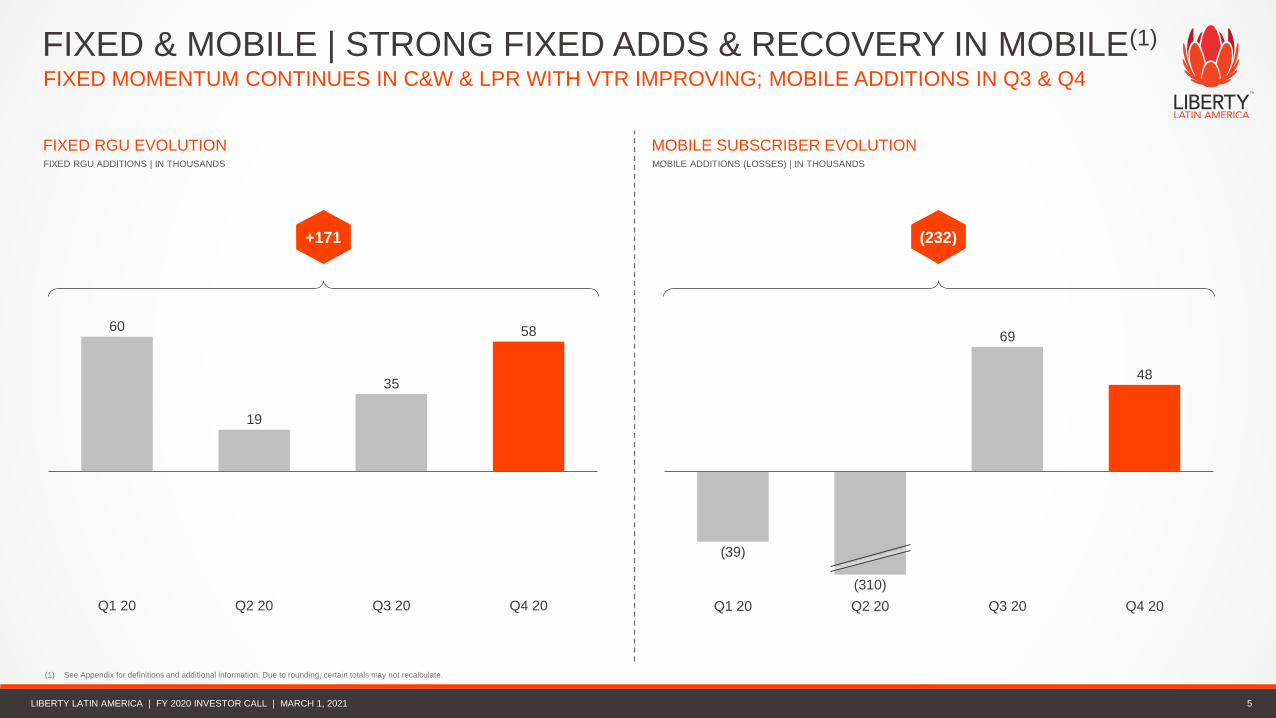
FIXED & MOBILE | STRONG FIXED ADDS & RECOVERY IN MOBILE(1)
FIXED MOMENTUM CONTINUES IN C&W & LPR WITH VTR IMPROVING; MOBILE ADDITIONS IN Q3 & Q4
(1) See Appendix for definitions and additional information. Due to rounding, certain totals may not recalculate.
(39)
69
48
Q2 20 Q4 20Q1 20 Q3 20
(310)
5
(232)
FIXED RGU EVOLUTIONFIXED RGU ADDITIONS | IN THOUSANDS
MOBILE SUBSCRIBER EVOLUTIONMOBILE ADDITIONS (LOSSES) | IN THOUSANDS
60
19
35
58
Q3 20Q1 20 Q2 20 Q4 20
+171
LIBERTY LATIN AMERICA | FY 2020 INVESTOR CALL | MARCH 1, 2021
LIBERTY LATIN AMERICA | Q3 2019 INVESTOR CALL | NOVEMBER 6, 2019
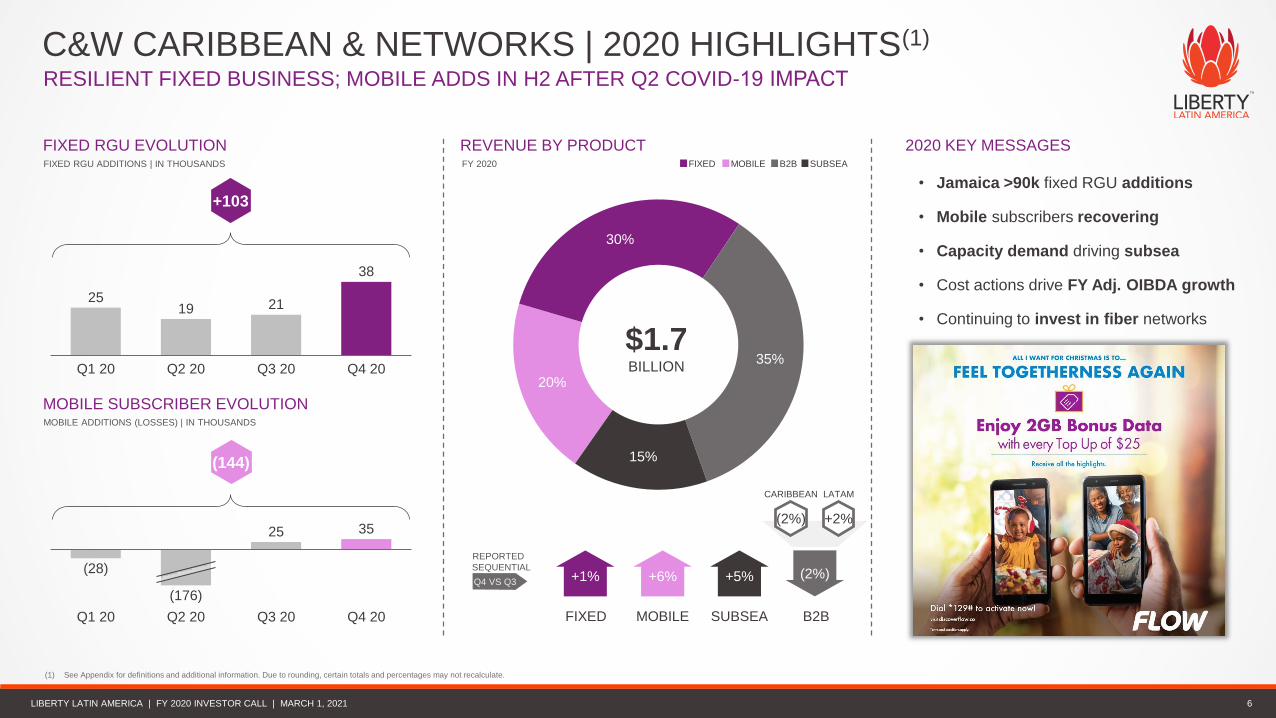
C&W CARIBBEAN & NETWORKS | 2020 HIGHLIGHTS(1)
RESILIENT FIXED BUSINESS; MOBILE ADDS IN H2 AFTER Q2 COVID-19 IMPACT
(1) See Appendix for definitions and additional information. Due to rounding, certain totals and percentages may not recalculate.
6
20%
30%
35%
15%
$1.7BILLION
MOBILE B2BFIXED SUBSEA
2020 KEY MESSAGESREVENUE BY PRODUCTFY 2020
FIXED RGU EVOLUTIONFIXED RGU ADDITIONS | IN THOUSANDS
MOBILE SUBSCRIBER EVOLUTIONMOBILE ADDITIONS (LOSSES) | IN THOUSANDS
2519 21
38
Q3 20Q1 20 Q2 20 Q4 20
+103
(28)
25 35
Q3 20Q1 20
(176)
Q4 20Q2 20
(144)
Q4 VS Q3
SEQUENTIAL
+2%
LIBERTY LATIN AMERICA | FY 2020 INVESTOR CALL | MARCH 1, 2021
(2%)
+1%
FIXED
+6%
MOBILE
(2%)
B2B
• Jamaica >90k fixed RGU additions
• Mobile subscribers recovering
• Capacity demand driving subsea
• Cost actions drive FY Adj. OIBDA growth
• Continuing to invest in fiber networks
+5%
SUBSEA
CARIBBEAN LATAM
REPORTED
LIBERTY LATIN AMERICA | Q3 2019 INVESTOR CALL | NOVEMBER 6, 2019
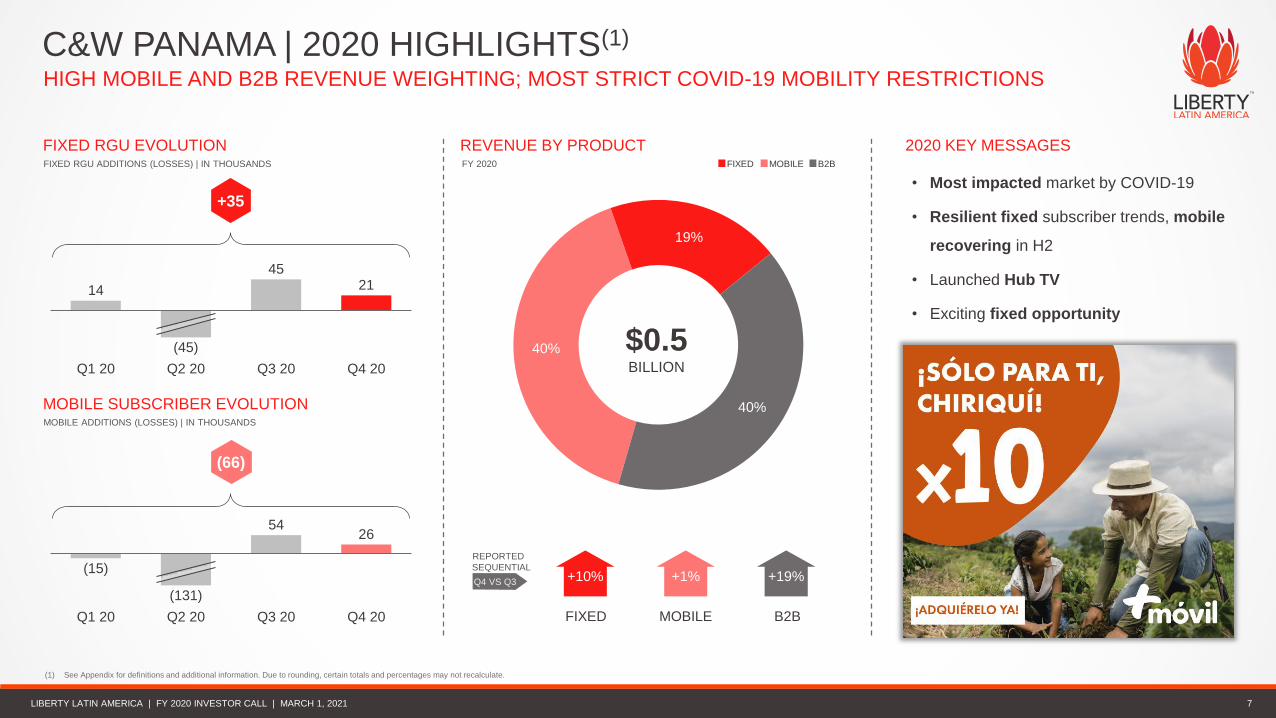
40%
19%
40%
$0.5BILLION
C&W PANAMA | 2020 HIGHLIGHTS(1)
HIGH MOBILE AND B2B REVENUE WEIGHTING; MOST STRICT COVID-19 MOBILITY RESTRICTIONS
7
• Most impacted market by COVID-19
• Resilient fixed subscriber trends, mobile
recovering in H2
• Launched Hub TV
• Exciting fixed opportunity
2020 KEY MESSAGESREVENUE BY PRODUCTFY 2020
FIXED RGU EVOLUTIONFIXED RGU ADDITIONS (LOSSES) | IN THOUSANDS
MOBILE SUBSCRIBER EVOLUTIONMOBILE ADDITIONS (LOSSES) | IN THOUSANDS
14
4521
Q2 20 Q4 20Q1 20 Q3 20
(45)
+35
(15)
5426
(131)
Q3 20Q2 20Q1 20 Q4 20
(66)
(1) See Appendix for definitions and additional information. Due to rounding, certain totals and percentages may not recalculate.
+10% +1% +19%
MOBILE B2BFIXED
Q4 VS Q3
SEQUENTIAL
LIBERTY LATIN AMERICA | FY 2020 INVESTOR CALL | MARCH 1, 2021
FIXED MOBILE B2B
REPORTED
LIBERTY LATIN AMERICA | Q3 2019 INVESTOR CALL | NOVEMBER 6, 2019
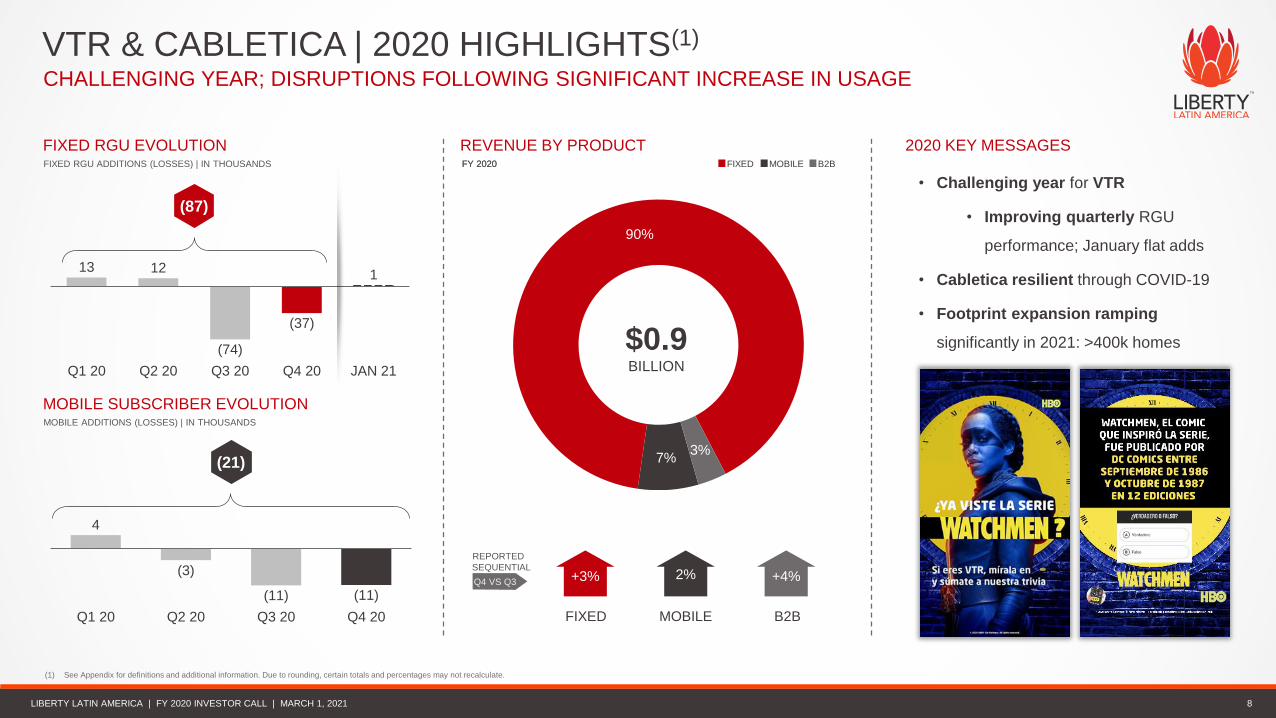
7%
90%
3%
$0.9BILLION
VTR & CABLETICA | 2020 HIGHLIGHTS(1)
CHALLENGING YEAR; DISRUPTIONS FOLLOWING SIGNIFICANT INCREASE IN USAGE
8
• Challenging year for VTR
• Improving quarterly RGU
performance; January flat adds
• Cabletica resilient through COVID-19
• Footprint expansion ramping
significantly in 2021: >400k homes
2020 KEY MESSAGESREVENUE BY PRODUCTFY 2020
MOBILE SUBSCRIBER EVOLUTIONMOBILE ADDITIONS (LOSSES) | IN THOUSANDS
13 12
(74)
(37)
Q4 20Q1 20 Q3 20Q2 20 JAN 21
1
(87)
4
(3)
(11) (11)
Q1 20 Q2 20 Q3 20 Q4 20
(21)
FIXED RGU EVOLUTIONFIXED RGU ADDITIONS (LOSSES) | IN THOUSANDS FY 2020
(1) See Appendix for definitions and additional information. Due to rounding, certain totals and percentages may not recalculate.
+3% 2% +4%
MOBILE B2BFIXED
Q4 VS Q3
SEQUENTIAL
LIBERTY LATIN AMERICA | FY 2020 INVESTOR CALL | MARCH 1, 2021
FIXED MOBILE B2B
REPORTED
LIBERTY LATIN AMERICA | Q3 2019 INVESTOR CALL | NOVEMBER 6, 2019
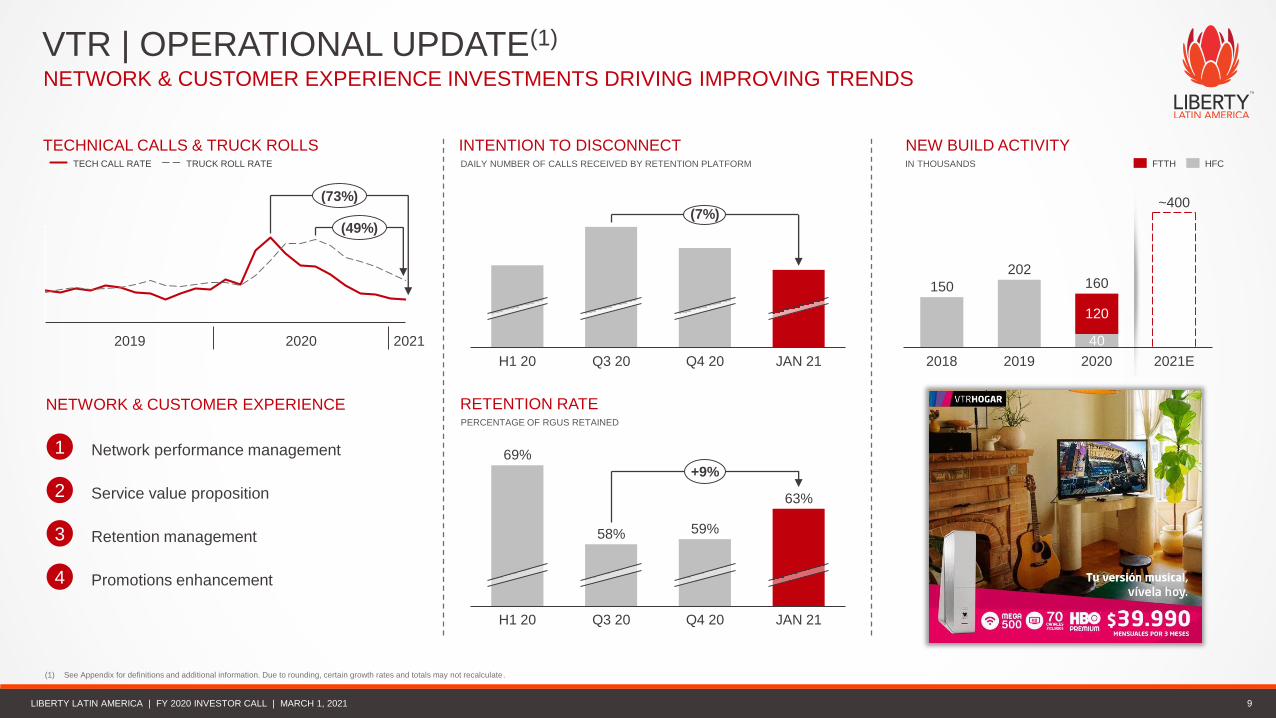
VTR | OPERATIONAL UPDATE(1)
NETWORK & CUSTOMER EXPERIENCE INVESTMENTS DRIVING IMPROVING TRENDS
(1) See Appendix for definitions and additional information. Due to rounding, certain growth rates and totals may not recalculate.
9
NETWORK & CUSTOMER EXPERIENCE
INTENTION TO DISCONNECTDAILY NUMBER OF CALLS RECEIVED BY RETENTION PLATFORM
NEW BUILD ACTIVITYIN THOUSANDS
TECHNICAL CALLS & TRUCK ROLLS
RETENTION RATEPERCENTAGE OF RGUS RETAINED
H1 20 Q3 20 Q4 20 JAN 21
(7%)
58%
H1 20 Q3 20 Q4 20 JAN 21
69%
59%
63%
+9%
(73%)
(49%)
2019 2020 2021
Network performance management1
TECH CALL RATE TRUCK ROLL RATE
2 Service value proposition
3 Retention management
4 Promotions enhancement
150
202
40
120
2018 20202019 2021E
160
~400
FTTH HFC
LIBERTY LATIN AMERICA | FY 2020 INVESTOR CALL | MARCH 1, 2021
LIBERTY LATIN AMERICA | Q3 2019 INVESTOR CALL | NOVEMBER 6, 2019
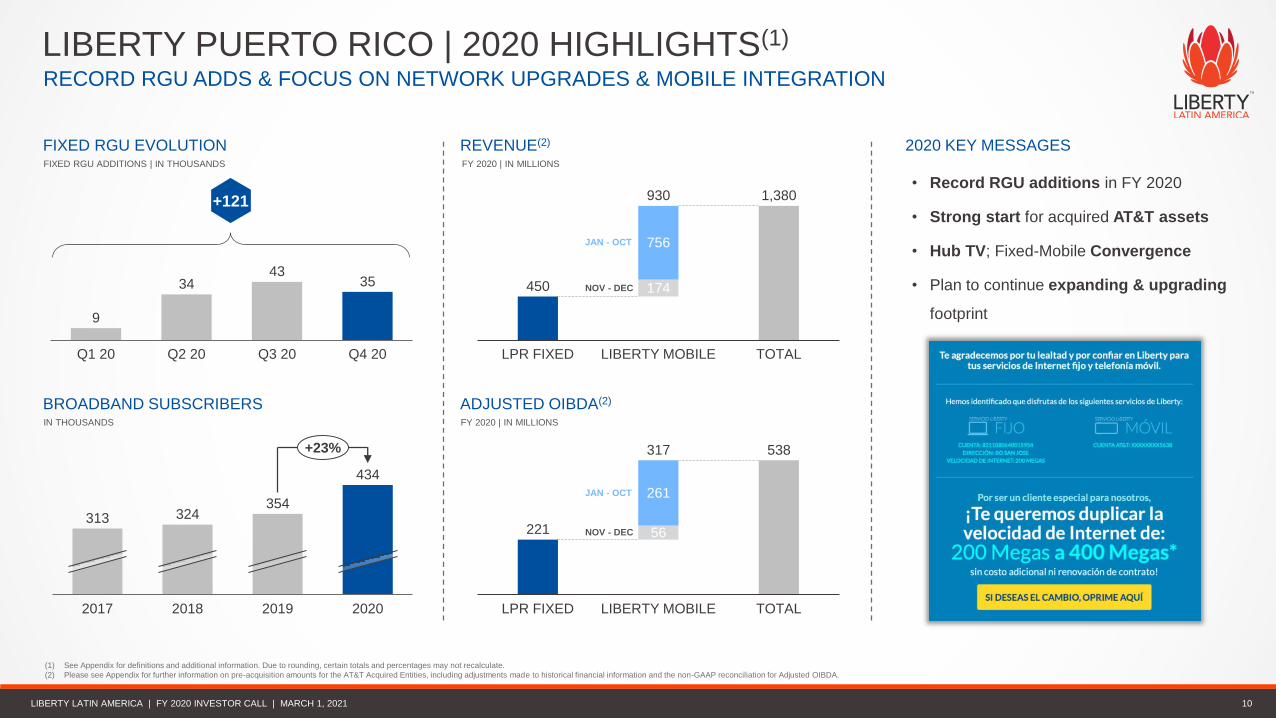
450
1,380
174
756
LPR FIXED LIBERTY MOBILE TOTAL
930
LIBERTY PUERTO RICO | 2020 HIGHLIGHTS(1)
RECORD RGU ADDS & FOCUS ON NETWORK UPGRADES & MOBILE INTEGRATION
10
REVENUE(2)
FY 2020 | IN MILLIONS
FIXED RGU EVOLUTIONFIXED RGU ADDITIONS | IN THOUSANDS
BROADBAND SUBSCRIBERSIN THOUSANDS
(1) See Appendix for definitions and additional information. Due to rounding, certain totals and percentages may not recalculate.
(2) Please see Appendix for further information on pre-acquisition amounts for the AT&T Acquired Entities, including adjustments made to historical financial information and the non-GAAP reconciliation for Adjusted OIBDA.
9
3443
35
Q3 20Q2 20Q1 20 Q4 20
+121
354324
434
2017 2018 2019 2020
313
+23%
2020 KEY MESSAGES
221
538
56
261
317
LPR FIXED TOTALLIBERTY MOBILE
LIBERTY LATIN AMERICA | FY 2020 INVESTOR CALL | MARCH 1, 2021
ADJUSTED OIBDA(2)
FY 2020 | IN MILLIONS
• Record RGU additions in FY 2020
• Strong start for acquired AT&T assets
• Hub TV; Fixed-Mobile Convergence
• Plan to continue expanding & upgrading
footprint
JAN - OCT
NOV - DEC
NOV - DEC
JAN - OCT
LIBERTY LATIN AMERICA | Q3 2019 INVESTOR CALL | NOVEMBER 6, 2019
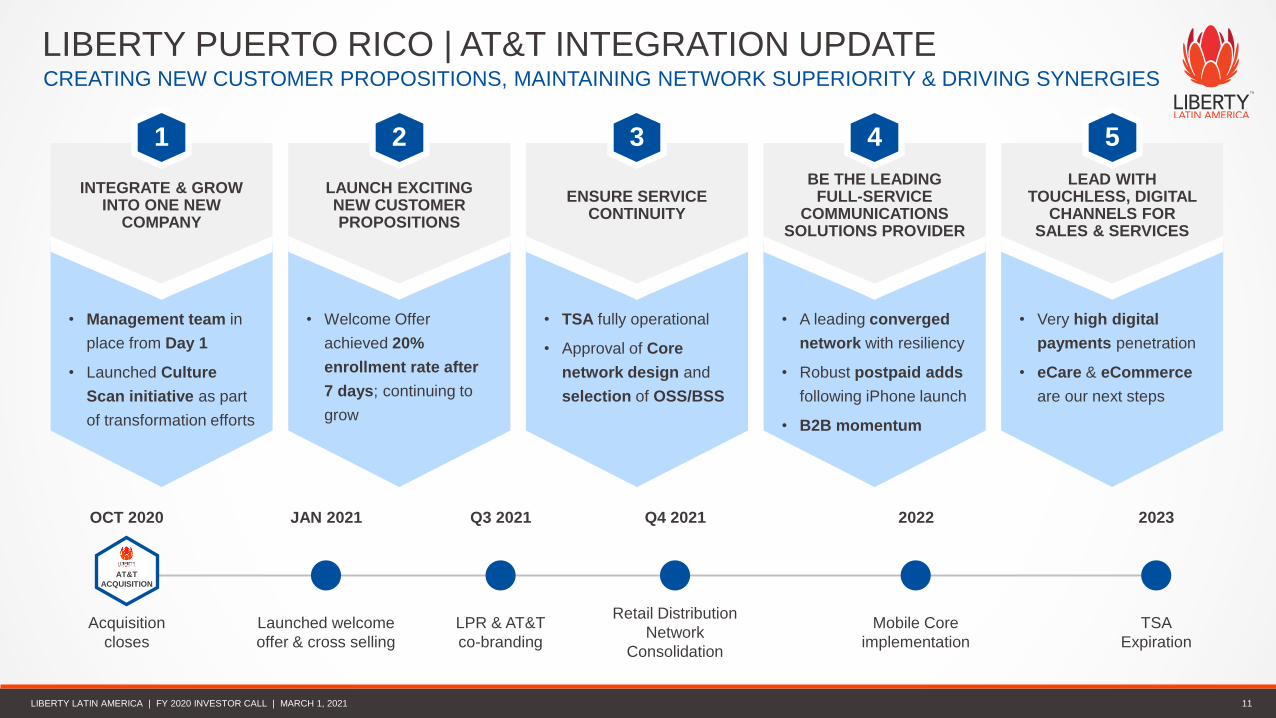
LIBERTY PUERTO RICO | AT&T INTEGRATION UPDATECREATING NEW CUSTOMER PROPOSITIONS, MAINTAINING NETWORK SUPERIORITY & DRIVING SYNERGIES
11
JAN 2021
Launched welcome
offer & cross selling
Q3 2021
LPR & AT&T
co-branding
Q4 2021
Retail Distribution
Network
Consolidation
2023
TSA
Expiration
2022
Mobile Core
implementation
AT&T
ACQUISITION
OCT 2020
Acquisition
closes
INTEGRATE & GROW INTO ONE NEW
COMPANY
1
• Management team in
place from Day 1
• Launched Culture
Scan initiative as part
of transformation efforts
LAUNCH EXCITING NEW CUSTOMER PROPOSITIONS
2
• Welcome Offer
achieved 20%
enrollment rate after
7 days; continuing to
grow
ENSURE SERVICE CONTINUITY
3
• TSA fully operational
• Approval of Core
network design and
selection of OSS/BSS
BE THE LEADING FULL-SERVICE
COMMUNICATIONS SOLUTIONS PROVIDER
4
• A leading converged
network with resiliency
• Robust postpaid adds
following iPhone launch
• B2B momentum
LEAD WITH TOUCHLESS, DIGITAL
CHANNELS FOR SALES & SERVICES
5
• Very high digital
payments penetration
• eCare & eCommerce
are our next steps
LIBERTY LATIN AMERICA | FY 2020 INVESTOR CALL | MARCH 1, 2021
LIBERTY LATIN AMERICA | Q3 2019 INVESTOR CALL | NOVEMBER 6, 2019
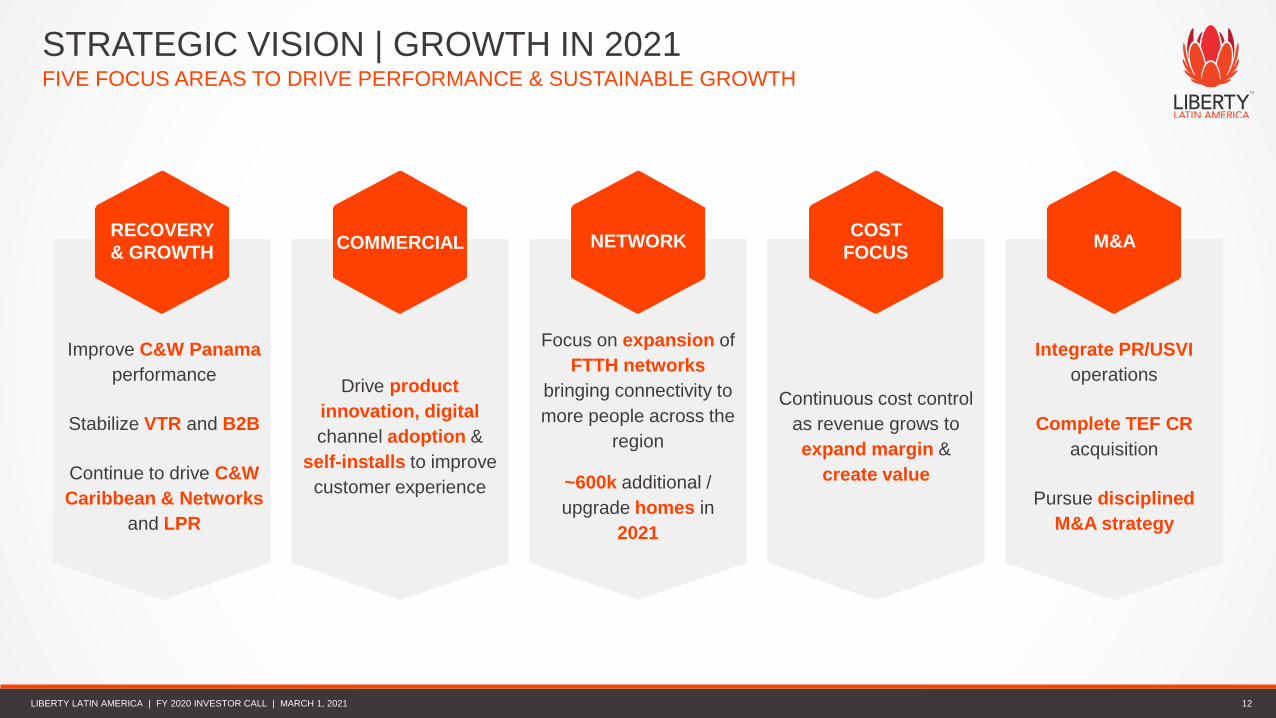
STRATEGIC VISION | GROWTH IN 2021FIVE FOCUS AREAS TO DRIVE PERFORMANCE & SUSTAINABLE GROWTH
12
COST
FOCUSM&ANETWORKCOMMERCIAL
RECOVERY
& GROWTH
Focus on expansion of
FTTH networks
bringing connectivity to
more people across the
region
~600k additional /
upgrade homes in
2021
Integrate PR/USVI
operations
Complete TEF CR
acquisition
Pursue disciplined
M&A strategy
Drive product
innovation, digital
channel adoption &
self-installs to improve
customer experience
Continuous cost control
as revenue grows to
expand margin &
create value
Improve C&W Panama
performance
Stabilize VTR and B2B
Continue to drive C&W
Caribbean & Networks
and LPR
LIBERTY LATIN AMERICA | FY 2020 INVESTOR CALL | MARCH 1, 2021

AGENDA
EXECUTIVE SUMMARY
02 | FINANCIAL RESULTS
03 | APPENDIX
01 |
Part of Liberty Latin America
LIBERTY LATIN AMERICA | Q3 2019 INVESTOR CALL | NOVEMBER 6, 2019
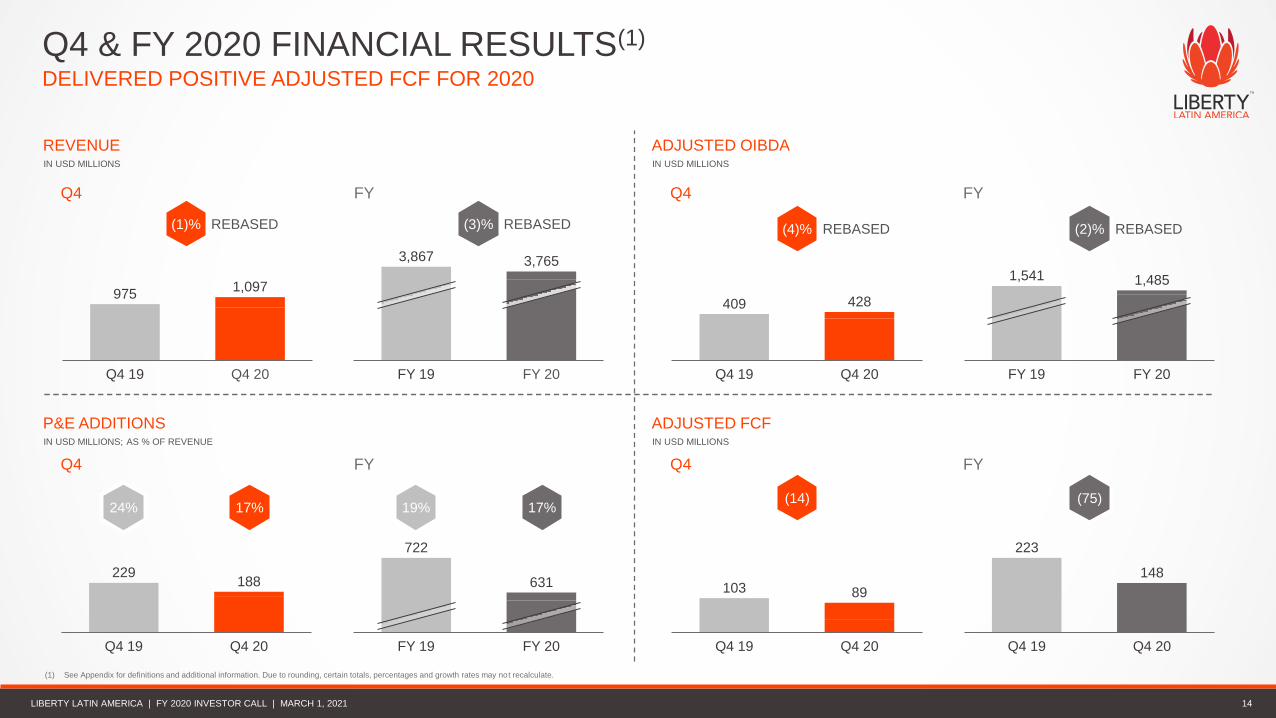
DELIVERED POSITIVE ADJUSTED FCF FOR 2020
Q4 & FY 2020 FINANCIAL RESULTS(1)
(1) See Appendix for definitions and additional information. Due to rounding, certain totals, percentages and growth rates may not recalculate.
REVENUEIN USD MILLIONS
ADJUSTED OIBDAIN USD MILLIONS
ADJUSTED FCFIN USD MILLIONS
P&E ADDITIONSIN USD MILLIONS; AS % OF REVENUE
14
9751,097
Q4 20Q4 19
229
Q4 19 Q4 20
188
409
Q4 19 Q4 20
428
103
Q4 19 Q4 20
89
Q4 FY
Q4 FY
Q4 FY
Q4 FY
REBASED(1)% REBASED(4)%
17%24%(14)
FY 20FY 19
3,867 3,765
FY 20FY 19
722
631
FY 19 FY 20
1,541 1,485
223
148
Q4 20Q4 19
REBASED(3)% REBASED(2)%
17%19%(75)
LIBERTY LATIN AMERICA | FY 2020 INVESTOR CALL | MARCH 1, 2021
LIBERTY LATIN AMERICA | Q3 2019 INVESTOR CALL | NOVEMBER 6, 2019
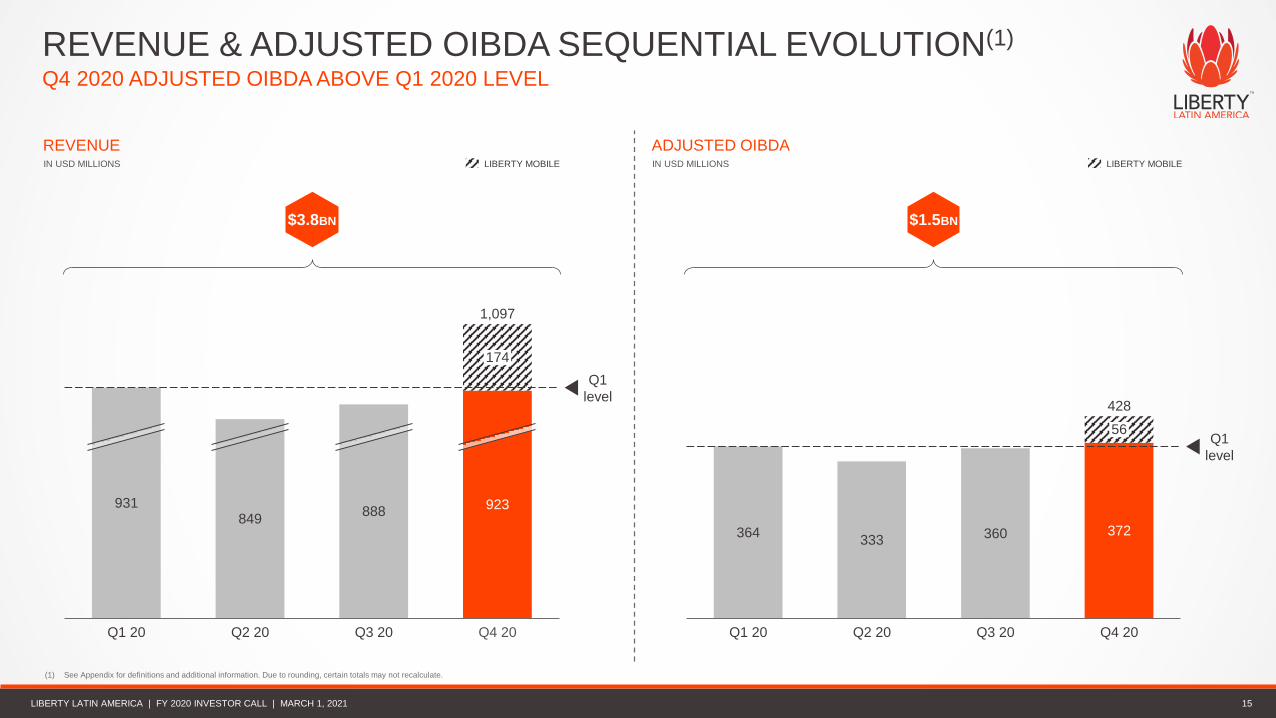
Q4 2020 ADJUSTED OIBDA ABOVE Q1 2020 LEVEL
REVENUE & ADJUSTED OIBDA SEQUENTIAL EVOLUTION(1)
888
Q1
level
931
Q1 20
849
Q2 20 Q3 20
174
923
1,097
Q4 20
364333 360 372
Q3 20Q1 20 Q2 20
Q1
level
56
Q4 20
428
(1) See Appendix for definitions and additional information. Due to rounding, certain totals may not recalculate.
REVENUEIN USD MILLIONS
ADJUSTED OIBDAIN USD MILLIONS
15
LIBERTY MOBILE LIBERTY MOBILE
$3.8BN $1.5BN
LIBERTY LATIN AMERICA | FY 2020 INVESTOR CALL | MARCH 1, 2021
LIBERTY LATIN AMERICA | Q3 2019 INVESTOR CALL | NOVEMBER 6, 2019
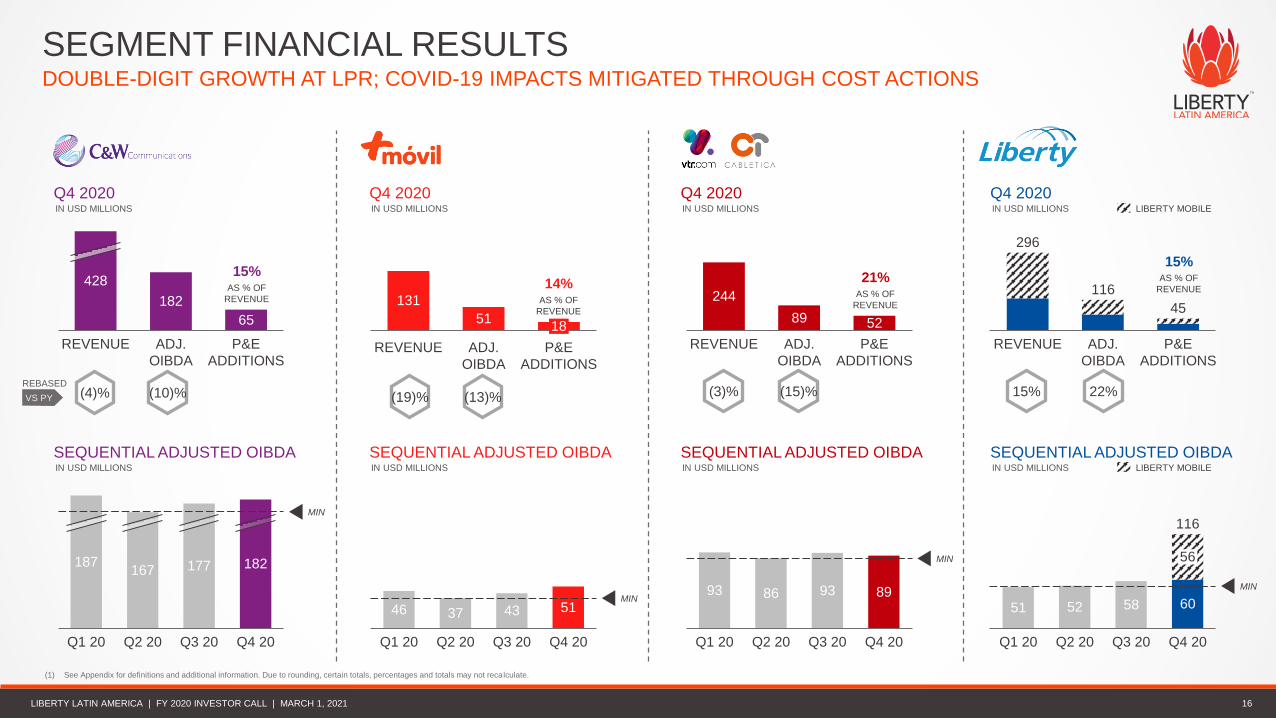
DOUBLE-DIGIT GROWTH AT LPR; COVID-19 IMPACTS MITIGATED THROUGH COST ACTIONS
SEGMENT FINANCIAL RESULTS
(1) See Appendix for definitions and additional information. Due to rounding, certain totals, percentages and totals may not recalculate.
16
182
65
428
ADJ.
OIBDA
REVENUE P&E
ADDITIONS
244
89 52
P&E
ADDITIONS
REVENUE ADJ.
OIBDA
296
REVENUE ADJ.
OIBDA
P&E
ADDITIONS
116
45
15%AS % OF
REVENUEAS % OF
REVENUE
21% AS % OF
REVENUE
15%
131
51
REVENUE ADJ.
OIBDA
18
P&E
ADDITIONS
14%AS % OF
REVENUE
VS PY
REBASED
(10)%(4)% (15)%(3)% 22%15%(13)%(19)%
167
Q4 20
187
Q1 20 Q2 20
177
Q3 20
182
MIN
93 86 93 89
Q3 20Q1 20 Q2 20 Q4 20
MIN
51 52 58 60
56
Q1 20 Q2 20 Q3 20
116
Q4 20
MIN
46 37 43 51
Q1 20 Q2 20 Q3 20 Q4 20
MIN
LIBERTY MOBILEIN USD MILLIONS
Q4 2020
SEQUENTIAL ADJUSTED OIBDAIN USD MILLIONS
IN USD MILLIONS
Q4 2020
SEQUENTIAL ADJUSTED OIBDAIN USD MILLIONS
IN USD MILLIONS
Q4 2020
SEQUENTIAL ADJUSTED OIBDAIN USD MILLIONS
IN USD MILLIONS
Q4 2020
SEQUENTIAL ADJUSTED OIBDAIN USD MILLIONS LIBERTY MOBILE
LIBERTY LATIN AMERICA | FY 2020 INVESTOR CALL | MARCH 1, 2021
LIBERTY LATIN AMERICA | Q3 2019 INVESTOR CALL | NOVEMBER 6, 2019
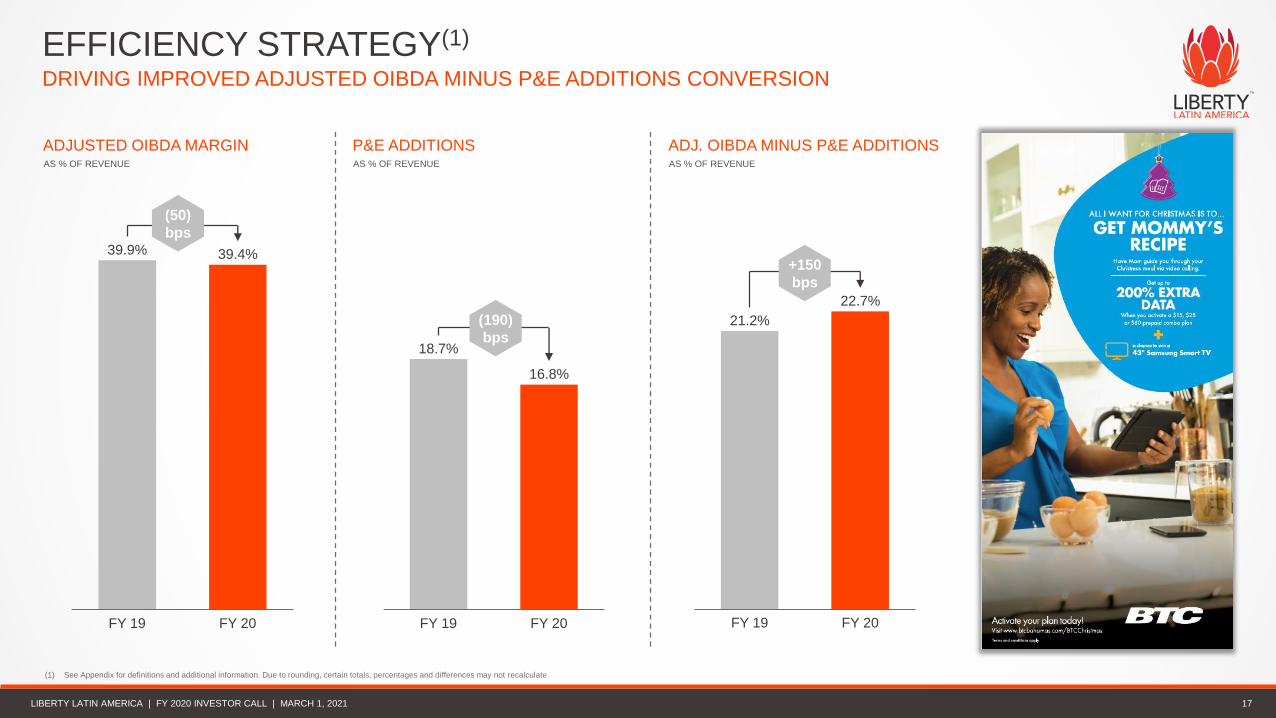
FY 19
39.9%
FY 20
39.4%
-0.5
DRIVING IMPROVED ADJUSTED OIBDA MINUS P&E ADDITIONS CONVERSION
EFFICIENCY STRATEGY(1)
17
21.2%
22.7%
FY 19 FY 20
+1.5
FY 20FY 19
18.7%
16.8%
-1.9
(1) See Appendix for definitions and additional information. Due to rounding, certain totals, percentages and differences may not recalculate.
ADJUSTED OIBDA MARGINAS % OF REVENUE
ADJ. OIBDA MINUS P&E ADDITIONSAS % OF REVENUE
P&E ADDITIONSAS % OF REVENUE
(190)
bps
+150
bps
(50)
bps
LIBERTY LATIN AMERICA | FY 2020 INVESTOR CALL | MARCH 1, 2021

LIBERTY LATIN AMERICA | Q3 2019 INVESTOR CALL | NOVEMBER 6, 2019
FINISHED THE YEAR WITH STRONG METRICS
ROBUST BALANCE SHEET(1)
(1) As of December 31, 2020. See Appendix for definitions and additional information. Due to rounding, certain totals, ratios and percentages may not recalculate.
(2) Cash refers to cash and cash equivalents, excluding restricted cash. At December 31, 2020, the full amount of unused borrowing capacity under our subsidiaries' revolving credit facilities was available to be borrowed, both before and after completion of the December 31, 2020 compliance reporting requirements, except for
available capacity under the VTR Revolving Credit Facilities that is currently limited to approximately $185 million.
(3) Consolidated leverage ratios are non-GAAP measures. For additional information, including definitions of our consolidated leverage ratios, required reconciliations and the impact of the AT&T Acquired Entities on the December 31, 2020 ratios, see Appendix and Non-GAAP Reconciliations.
(4) Excludes finance lease obligations.
18
20262021 2022 2023 20272024 2025 ≥2028
0.2 0.10.3
0.6
0.1
1.5
3.1
2.7
CASH & RCF AVAILABILITY(2)
GROUP CONSOLIDATED LEVERAGE(3)
C&W LPR VTR LLA CORPCT
MATURITY SCHEDULE(4)
IN USD BILLIONS
6.2YEARS DEBT
WEIGHTED
AVERAGE
TENOR
6.3% FULLY-
SWAPPED
BORROWING
COST
~85%DEBT DUE IN
2026 &
BEYOND
$0.9BILLION
$2.0BILLION
CASH RCF AVAILABILITY
$1.1BILLION
4.8x4.3x
GROSS LEVERAGE NET LEVERAGE
LIBERTY LATIN AMERICA | FY 2020 INVESTOR CALL | MARCH 1, 2021
LIBERTY LATIN AMERICA | Q3 2019 INVESTOR CALL | NOVEMBER 6, 2019
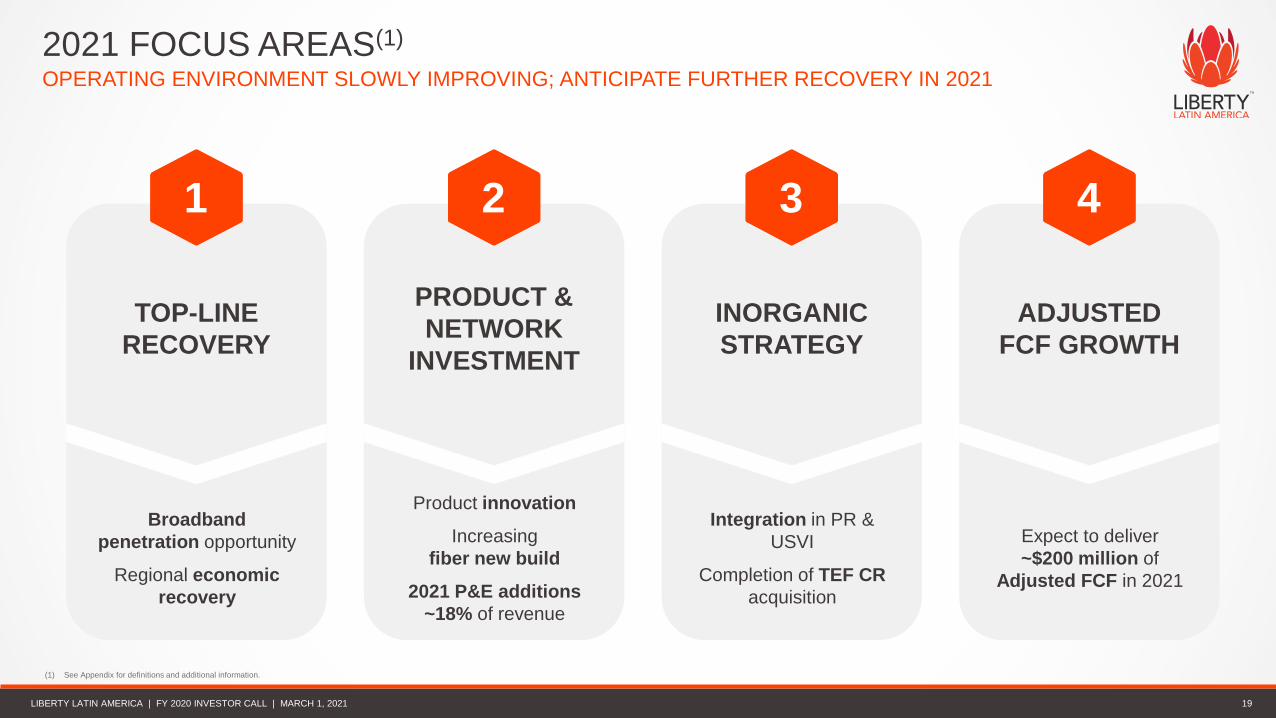
2021 FOCUS AREAS(1)
OPERATING ENVIRONMENT SLOWLY IMPROVING; ANTICIPATE FURTHER RECOVERY IN 2021
(1) See Appendix for definitions and additional information.
19
1
TOP-LINE
RECOVERY
2
PRODUCT &
NETWORK
INVESTMENT
3
INORGANIC
STRATEGY
4
ADJUSTED
FCF GROWTH
Broadband
penetration opportunity
Regional economic
recovery
Product innovation
Increasing
fiber new build
2021 P&E additions
~18% of revenue
Integration in PR &
USVI
Completion of TEF CR
acquisition
Expect to deliver
~$200 million of
Adjusted FCF in 2021
LIBERTY LATIN AMERICA | FY 2020 INVESTOR CALL | MARCH 1, 2021

AGENDAEXECUTIVE SUMMARY
02 | FINANCIAL RESULTS
03 | APPENDIX
01 |
Part of Liberty Latin America
LIBERTY LATIN AMERICA | Q3 2019 INVESTOR CALL | NOVEMBER 6, 2019
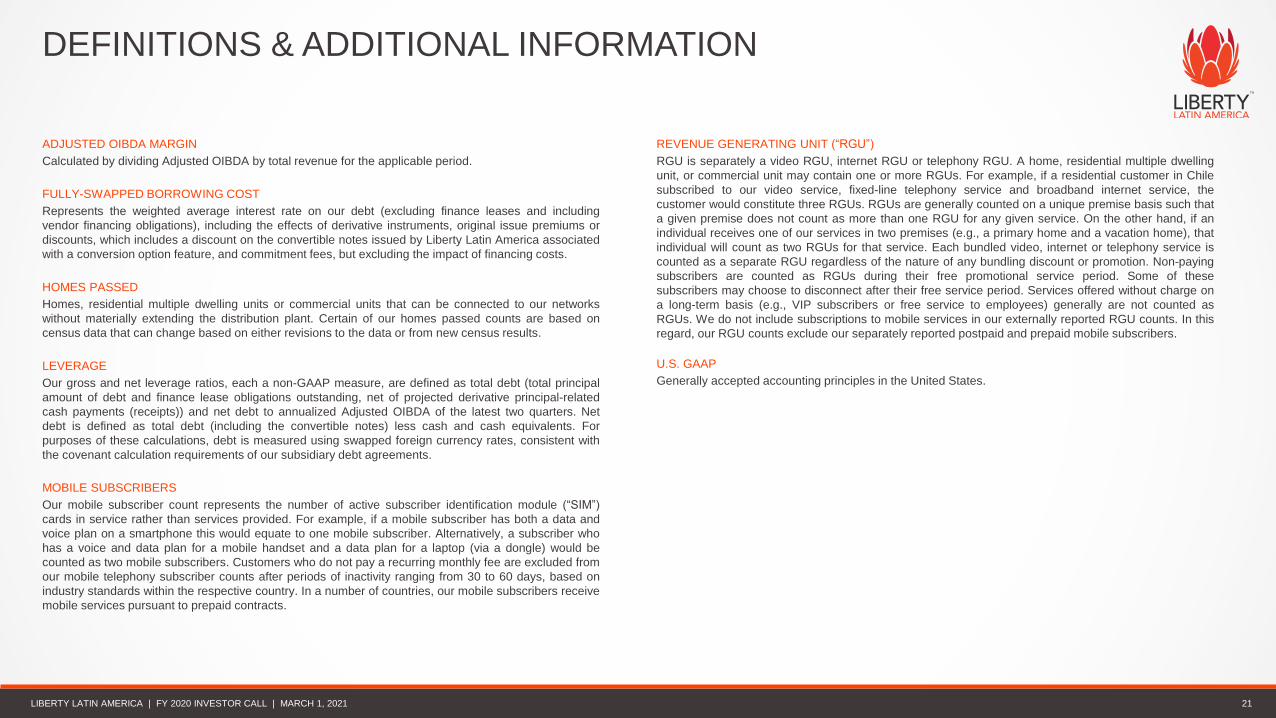
ADJUSTED OIBDA MARGIN
Calculated by dividing Adjusted OIBDA by total revenue for the applicable period.
FULLY-SWAPPED BORROWING COST
Represents the weighted average interest rate on our debt (excluding finance leases and including
vendor financing obligations), including the effects of derivative instruments, original issue premiums or
discounts, which includes a discount on the convertible notes issued by Liberty Latin America associated
with a conversion option feature, and commitment fees, but excluding the impact of financing costs.
HOMES PASSED
Homes, residential multiple dwelling units or commercial units that can be connected to our networks
without materially extending the distribution plant. Certain of our homes passed counts are based on
census data that can change based on either revisions to the data or from new census results.
LEVERAGE
Our gross and net leverage ratios, each a non-GAAP measure, are defined as total debt (total principal
amount of debt and finance lease obligations outstanding, net of projected derivative principal-related
cash payments (receipts)) and net debt to annualized Adjusted OIBDA of the latest two quarters. Net
debt is defined as total debt (including the convertible notes) less cash and cash equivalents. For
purposes of these calculations, debt is measured using swapped foreign currency rates, consistent with
the covenant calculation requirements of our subsidiary debt agreements.
MOBILE SUBSCRIBERS
Our mobile subscriber count represents the number of active subscriber identification module (“SIM”)
cards in service rather than services provided. For example, if a mobile subscriber has both a data and
voice plan on a smartphone this would equate to one mobile subscriber. Alternatively, a subscriber who
has a voice and data plan for a mobile handset and a data plan for a laptop (via a dongle) would be
counted as two mobile subscribers. Customers who do not pay a recurring monthly fee are excluded from
our mobile telephony subscriber counts after periods of inactivity ranging from 30 to 60 days, based on
industry standards within the respective country. In a number of countries, our mobile subscribers receive
mobile services pursuant to prepaid contracts.
REVENUE GENERATING UNIT (“RGU”)
RGU is separately a video RGU, internet RGU or telephony RGU. A home, residential multiple dwelling
unit, or commercial unit may contain one or more RGUs. For example, if a residential customer in Chile
subscribed to our video service, fixed-line telephony service and broadband internet service, the
customer would constitute three RGUs. RGUs are generally counted on a unique premise basis such that
a given premise does not count as more than one RGU for any given service. On the other hand, if an
individual receives one of our services in two premises (e.g., a primary home and a vacation home), that
individual will count as two RGUs for that service. Each bundled video, internet or telephony service is
counted as a separate RGU regardless of the nature of any bundling discount or promotion. Non-paying
subscribers are counted as RGUs during their free promotional service period. Some of these
subscribers may choose to disconnect after their free service period. Services offered without charge on
a long-term basis (e.g., VIP subscribers or free service to employees) generally are not counted as
RGUs. We do not include subscriptions to mobile services in our externally reported RGU counts. In this
regard, our RGU counts exclude our separately reported postpaid and prepaid mobile subscribers.
U.S. GAAP
Generally accepted accounting principles in the United States.
DEFINITIONS & ADDITIONAL INFORMATION
21LIBERTY LATIN AMERICA | FY 2020 INVESTOR CALL | MARCH 1, 2021
LIBERTY LATIN AMERICA | Q3 2019 INVESTOR CALL | NOVEMBER 6, 2019
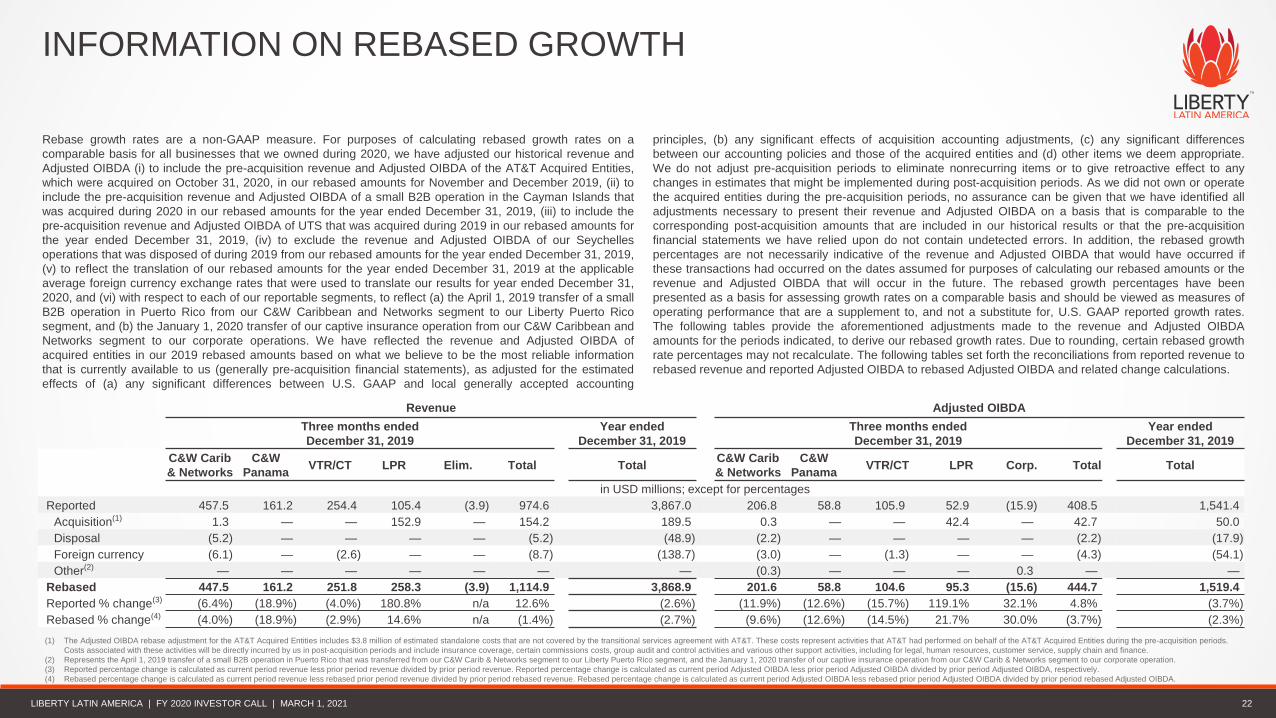
Rebase growth rates are a non-GAAP measure. For purposes of calculating rebased growth rates on a
comparable basis for all businesses that we owned during 2020, we have adjusted our historical revenue and
Adjusted OIBDA (i) to include the pre-acquisition revenue and Adjusted OIBDA of the AT&T Acquired Entities,
which were acquired on October 31, 2020, in our rebased amounts for November and December 2019, (ii) to
include the pre-acquisition revenue and Adjusted OIBDA of a small B2B operation in the Cayman Islands that
was acquired during 2020 in our rebased amounts for the year ended December 31, 2019, (iii) to include the
pre-acquisition revenue and Adjusted OIBDA of UTS that was acquired during 2019 in our rebased amounts for
the year ended December 31, 2019, (iv) to exclude the revenue and Adjusted OIBDA of our Seychelles
operations that was disposed of during 2019 from our rebased amounts for the year ended December 31, 2019,
(v) to reflect the translation of our rebased amounts for the year ended December 31, 2019 at the applicable
average foreign currency exchange rates that were used to translate our results for year ended December 31,
2020, and (vi) with respect to each of our reportable segments, to reflect (a) the April 1, 2019 transfer of a small
B2B operation in Puerto Rico from our C&W Caribbean and Networks segment to our Liberty Puerto Rico
segment, and (b) the January 1, 2020 transfer of our captive insurance operation from our C&W Caribbean and
Networks segment to our corporate operations. We have reflected the revenue and Adjusted OIBDA of
acquired entities in our 2019 rebased amounts based on what we believe to be the most reliable information
that is currently available to us (generally pre-acquisition financial statements), as adjusted for the estimated
effects of (a) any significant differences between U.S. GAAP and local generally accepted accounting
principles, (b) any significant effects of acquisition accounting adjustments, (c) any significant differences
between our accounting policies and those of the acquired entities and (d) other items we deem appropriate.
We do not adjust pre-acquisition periods to eliminate nonrecurring items or to give retroactive effect to any
changes in estimates that might be implemented during post-acquisition periods. As we did not own or operate
the acquired entities during the pre-acquisition periods, no assurance can be given that we have identified all
adjustments necessary to present their revenue and Adjusted OIBDA on a basis that is comparable to the
corresponding post-acquisition amounts that are included in our historical results or that the pre-acquisition
financial statements we have relied upon do not contain undetected errors. In addition, the rebased growth
percentages are not necessarily indicative of the revenue and Adjusted OIBDA that would have occurred if
these transactions had occurred on the dates assumed for purposes of calculating our rebased amounts or the
revenue and Adjusted OIBDA that will occur in the future. The rebased growth percentages have been
presented as a basis for assessing growth rates on a comparable basis and should be viewed as measures of
operating performance that are a supplement to, and not a substitute for, U.S. GAAP reported growth rates.
The following tables provide the aforementioned adjustments made to the revenue and Adjusted OIBDA
amounts for the periods indicated, to derive our rebased growth rates. Due to rounding, certain rebased growth
rate percentages may not recalculate. The following tables set forth the reconciliations from reported revenue to
rebased revenue and reported Adjusted OIBDA to rebased Adjusted OIBDA and related change calculations.
INFORMATION ON REBASED GROWTH
Revenue Adjusted OIBDA
Three months ended
December 31, 2019
Year ended
December 31, 2019
Three months ended
December 31, 2019
Year ended
December 31, 2019
C&W Carib
& Networks
C&W
PanamaVTR/CT LPR Elim. Total Total
C&W Carib
& Networks
C&W
PanamaVTR/CT LPR Corp. Total Total
in USD millions; except for percentages
Reported 457.5) 161.2) 254.4) 105.4) (3.9) 974.6) 3,867.0) 206.8) 58.8) 105.9) 52.9) (15.9) 408.5) 1,541.4)
Acquisition(1) 1.3) —) —) 152.9) —) 154.2) 189.5) 0.3) —) —) 42.4) —) 42.7) 50.0)
Disposal (5.2) —) —) —) —) (5.2) (48.9) (2.2) —) —) —) —) (2.2) (17.9)
Foreign currency (6.1) —) (2.6) —) —) (8.7) (138.7) (3.0) —) (1.3) —) —) (4.3) (54.1)
Other(2) —) —) —) —) —) —) —) (0.3) —) —) —) 0.3) —) —)
Rebased 447.5) 161.2) 251.8) 258.3) (3.9) 1,114.9) 3,868.9) 201.6) 58.8) 104.6) 95.3) (15.6) 444.7) 1,519.4)
Reported % change(3) (6.4%) (18.9%) (4.0%) 180.8%) n/a 12.6%) (2.6%) (11.9%) (12.6%) (15.7%) 119.1%) 32.1% 4.8%) (3.7%)
Rebased % change(4) (4.0%) (18.9%) (2.9%) 14.6%) n/a (1.4%) (2.7%) (9.6%) (12.6%) (14.5%) 21.7%) 30.0% (3.7%) (2.3%)
(1) The Adjusted OIBDA rebase adjustment for the AT&T Acquired Entities includes $3.8 million of estimated standalone costs that are not covered by the transitional services agreement with AT&T. These costs represent activities that AT&T had performed on behalf of the AT&T Acquired Entities during the pre-acquisition periods.
Costs associated with these activities will be directly incurred by us in post-acquisition periods and include insurance coverage, certain commissions costs, group audit and control activities and various other support activities, including for legal, human resources, customer service, supply chain and finance.
(2) Represents the April 1, 2019 transfer of a small B2B operation in Puerto Rico that was transferred from our C&W Carib & Networks segment to our Liberty Puerto Rico segment, and the January 1, 2020 transfer of our captive insurance operation from our C&W Carib & Networks segment to our corporate operation.
(3) Reported percentage change is calculated as current period revenue less prior period revenue divided by prior period revenue. Reported percentage change is calculated as current period Adjusted OIBDA less prior period Adjusted OIBDA divided by prior period Adjusted OIBDA, respectively.
(4) Rebased percentage change is calculated as current period revenue less rebased prior period revenue divided by prior period rebased revenue. Rebased percentage change is calculated as current period Adjusted OIBDA less rebased prior period Adjusted OIBDA divided by prior period rebased Adjusted OIBDA.
22LIBERTY LATIN AMERICA | FY 2020 INVESTOR CALL | MARCH 1, 2021
LIBERTY LATIN AMERICA | Q3 2019 INVESTOR CALL | NOVEMBER 6, 2019
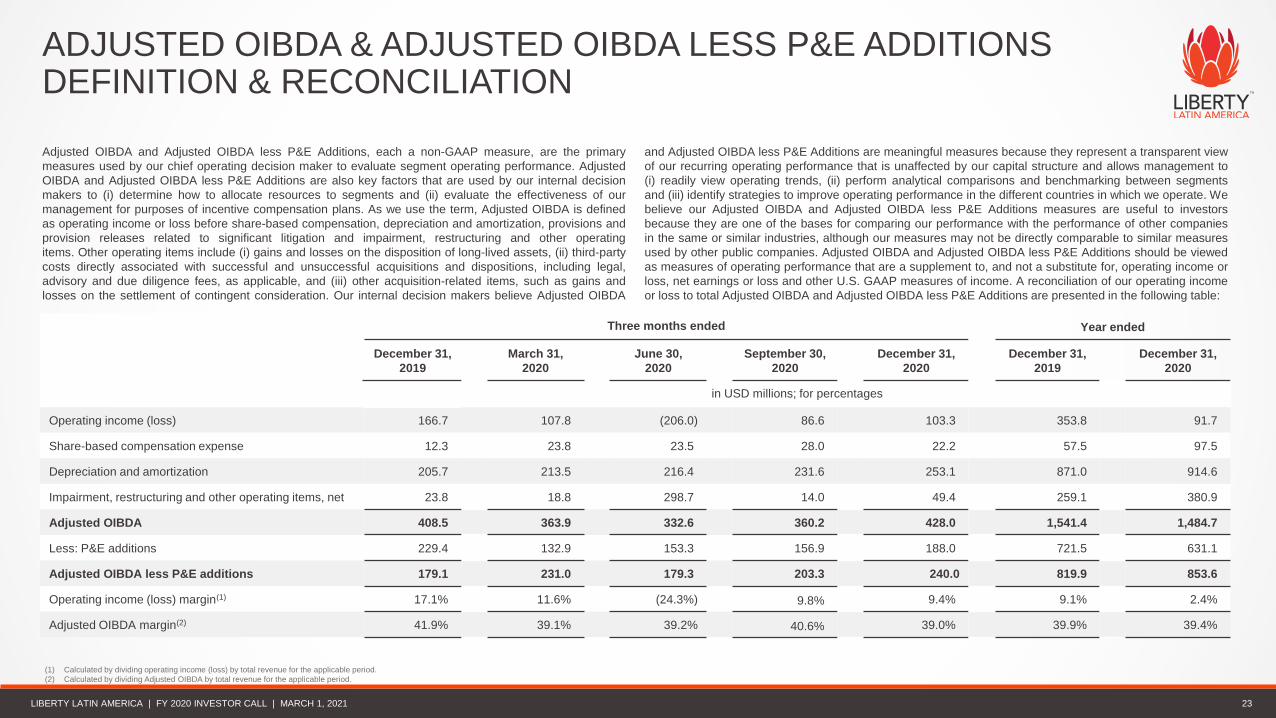
Adjusted OIBDA and Adjusted OIBDA less P&E Additions, each a non-GAAP measure, are the primary
measures used by our chief operating decision maker to evaluate segment operating performance. Adjusted
OIBDA and Adjusted OIBDA less P&E Additions are also key factors that are used by our internal decision
makers to (i) determine how to allocate resources to segments and (ii) evaluate the effectiveness of our
management for purposes of incentive compensation plans. As we use the term, Adjusted OIBDA is defined
as operating income or loss before share-based compensation, depreciation and amortization, provisions and
provision releases related to significant litigation and impairment, restructuring and other operating
items. Other operating items include (i) gains and losses on the disposition of long-lived assets, (ii) third-party
costs directly associated with successful and unsuccessful acquisitions and dispositions, including legal,
advisory and due diligence fees, as applicable, and (iii) other acquisition-related items, such as gains and
losses on the settlement of contingent consideration. Our internal decision makers believe Adjusted OIBDA
and Adjusted OIBDA less P&E Additions are meaningful measures because they represent a transparent view
of our recurring operating performance that is unaffected by our capital structure and allows management to
(i) readily view operating trends, (ii) perform analytical comparisons and benchmarking between segments
and (iii) identify strategies to improve operating performance in the different countries in which we operate. We
believe our Adjusted OIBDA and Adjusted OIBDA less P&E Additions measures are useful to investors
because they are one of the bases for comparing our performance with the performance of other companies
in the same or similar industries, although our measures may not be directly comparable to similar measures
used by other public companies. Adjusted OIBDA and Adjusted OIBDA less P&E Additions should be viewed
as measures of operating performance that are a supplement to, and not a substitute for, operating income or
loss, net earnings or loss and other U.S. GAAP measures of income. A reconciliation of our operating income
or loss to total Adjusted OIBDA and Adjusted OIBDA less P&E Additions are presented in the following table:
ADJUSTED OIBDA & ADJUSTED OIBDA LESS P&E ADDITIONS DEFINITION & RECONCILIATION
Three months ended Year ended
December 31,
2019
March 31,
2020
June 30,
2020
September 30,
2020
December 31,
2020
December 31,
2019
December 31,
2020
in USD millions; for percentages
Operating income (loss) 166.7) 107.8) (206.0) 86.6) 103.3) 353.8) 91.7)
Share-based compensation expense 12.3) 23.8) 23.5) 28.0) 22.2) 57.5) 97.5)
Depreciation and amortization 205.7) 213.5) 216.4) 231.6) 253.1) 871.0) 914.6)
Impairment, restructuring and other operating items, net 23.8) 18.8) 298.7) 14.0) 49.4) 259.1) 380.9)
Adjusted OIBDA 408.5) 363.9) 332.6) 360.2) 428.0) 1,541.4) 1,484.7)
Less: P&E additions 229.4) 132.9) 153.3) 156.9) 188.0) 721.5) 631.1)
Adjusted OIBDA less P&E additions 179.1) 231.0) 179.3) 203.3) 240.0 819.9) 853.6)
Operating income (loss) margin(1) 17.1%) 11.6%) (24.3%) 9.8%) 9.4%) 9.1%) 2.4%)
Adjusted OIBDA margin(2) 41.9%) 39.1%) 39.2% 40.6%) 39.0%) 39.9%) 39.4%)
23
(1) Calculated by dividing operating income (loss) by total revenue for the applicable period.
(2) Calculated by dividing Adjusted OIBDA by total revenue for the applicable period.
LIBERTY LATIN AMERICA | FY 2020 INVESTOR CALL | MARCH 1, 2021
LIBERTY LATIN AMERICA | Q3 2019 INVESTOR CALL | NOVEMBER 6, 2019
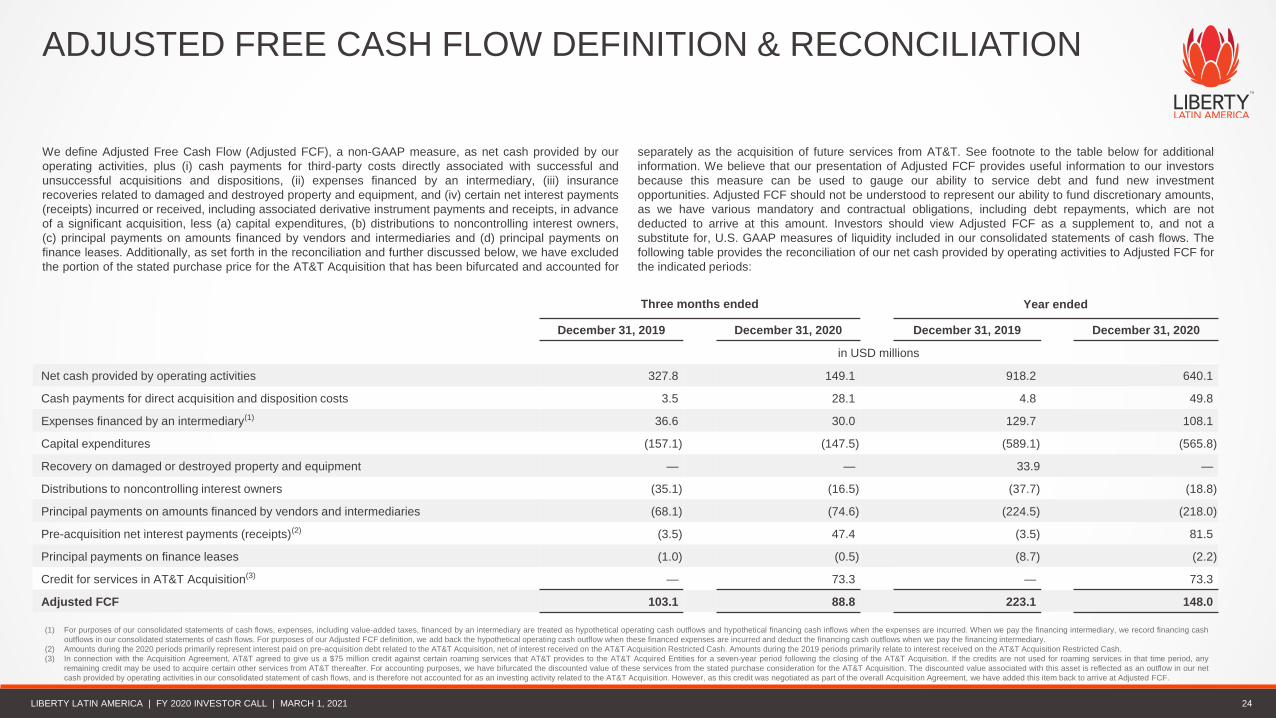
We define Adjusted Free Cash Flow (Adjusted FCF), a non-GAAP measure, as net cash provided by our
operating activities, plus (i) cash payments for third-party costs directly associated with successful and
unsuccessful acquisitions and dispositions, (ii) expenses financed by an intermediary, (iii) insurance
recoveries related to damaged and destroyed property and equipment, and (iv) certain net interest payments
(receipts) incurred or received, including associated derivative instrument payments and receipts, in advance
of a significant acquisition, less (a) capital expenditures, (b) distributions to noncontrolling interest owners,
(c) principal payments on amounts financed by vendors and intermediaries and (d) principal payments on
finance leases. Additionally, as set forth in the reconciliation and further discussed below, we have excluded
the portion of the stated purchase price for the AT&T Acquisition that has been bifurcated and accounted for
separately as the acquisition of future services from AT&T. See footnote to the table below for additional
information. We believe that our presentation of Adjusted FCF provides useful information to our investors
because this measure can be used to gauge our ability to service debt and fund new investment
opportunities. Adjusted FCF should not be understood to represent our ability to fund discretionary amounts,
as we have various mandatory and contractual obligations, including debt repayments, which are not
deducted to arrive at this amount. Investors should view Adjusted FCF as a supplement to, and not a
substitute for, U.S. GAAP measures of liquidity included in our consolidated statements of cash flows. The
following table provides the reconciliation of our net cash provided by operating activities to Adjusted FCF for
the indicated periods:
(1) For purposes of our consolidated statements of cash flows, expenses, including value-added taxes, financed by an intermediary are treated as hypothetical operating cash outflows and hypothetical financing cash inflows when the expenses are incurred. When we pay the financing intermediary, we record financing cash
outflows in our consolidated statements of cash flows. For purposes of our Adjusted FCF definition, we add back the hypothetical operating cash outflow when these financed expenses are incurred and deduct the financing cash outflows when we pay the financing intermediary.
(2) Amounts during the 2020 periods primarily represent interest paid on pre-acquisition debt related to the AT&T Acquisition, net of interest received on the AT&T Acquisition Restricted Cash. Amounts during the 2019 periods primarily relate to interest received on the AT&T Acquisition Restricted Cash.
(3) In connection with the Acquisition Agreement, AT&T agreed to give us a $75 million credit against certain roaming services that AT&T provides to the AT&T Acquired Entities for a seven-year period following the closing of the AT&T Acquisition. If the credits are not used for roaming services in that time period, any
remaining credit may be used to acquire certain other services from AT&T thereafter. For accounting purposes, we have bifurcated the discounted value of these services from the stated purchase consideration for the AT&T Acquisition. The discounted value associated with this asset is reflected as an outflow in our net
cash provided by operating activities in our consolidated statement of cash flows, and is therefore not accounted for as an investing activity related to the AT&T Acquisition. However, as this credit was negotiated as part of the overall Acquisition Agreement, we have added this item back to arrive at Adjusted FCF.
Three months ended Year ended
December 31, 2019 December 31, 2020 December 31, 2019 December 31, 2020
in USD millions
Net cash provided by operating activities 327.8) 149.1) 918.2) 640.1)
Cash payments for direct acquisition and disposition costs 3.5) 28.1) 4.8) 49.8)
Expenses financed by an intermediary(1) 36.6) 30.0) 129.7) 108.1)
Capital expenditures (157.1) (147.5) (589.1) (565.8)
Recovery on damaged or destroyed property and equipment —) —) 33.9 —)
Distributions to noncontrolling interest owners (35.1) (16.5) (37.7) (18.8)
Principal payments on amounts financed by vendors and intermediaries (68.1) (74.6) (224.5) (218.0)
Pre-acquisition net interest payments (receipts)(2) (3.5) 47.4) (3.5) 81.5)
Principal payments on finance leases (1.0) (0.5) (8.7) (2.2)
Credit for services in AT&T Acquisition(3) —) 73.3) —) 73.3)
Adjusted FCF 103.1) 88.8) 223.1) 148.0)
24
ADJUSTED FREE CASH FLOW DEFINITION & RECONCILIATION
LIBERTY LATIN AMERICA | FY 2020 INVESTOR CALL | MARCH 1, 2021
LIBERTY LATIN AMERICA | Q3 2019 INVESTOR CALL | NOVEMBER 6, 2019
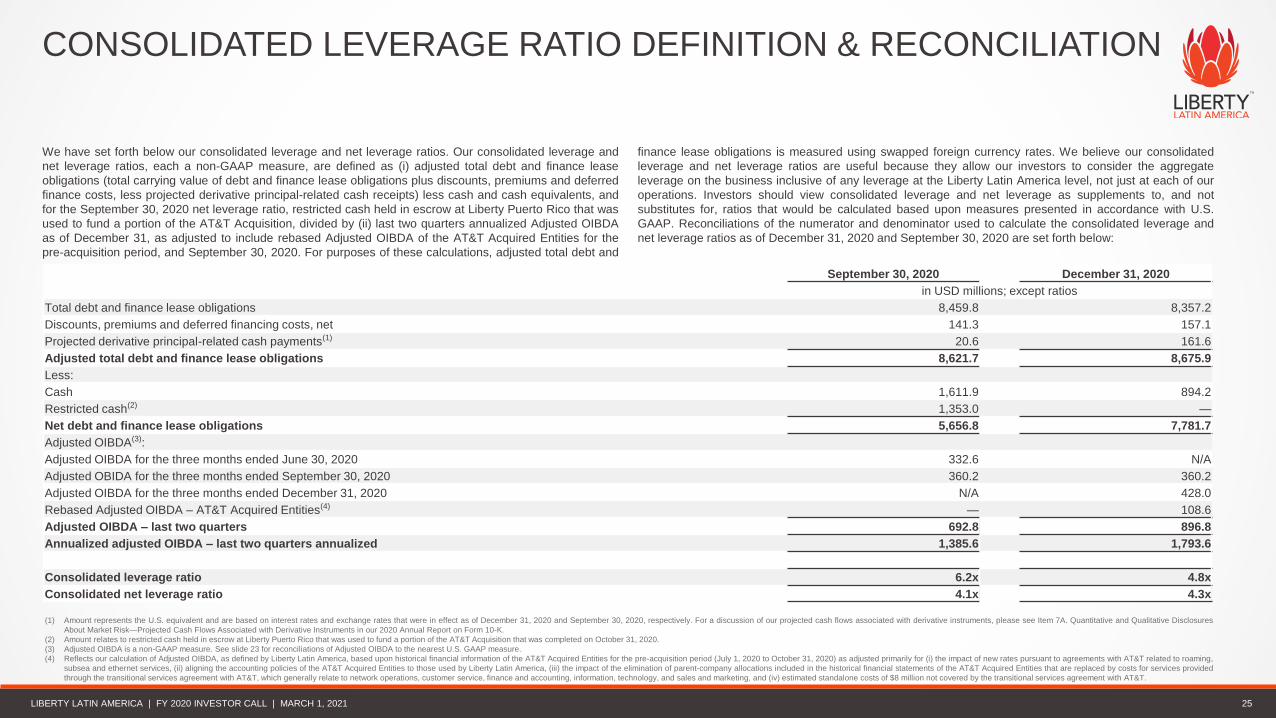
We have set forth below our consolidated leverage and net leverage ratios. Our consolidated leverage and
net leverage ratios, each a non-GAAP measure, are defined as (i) adjusted total debt and finance lease
obligations (total carrying value of debt and finance lease obligations plus discounts, premiums and deferred
finance costs, less projected derivative principal-related cash receipts) less cash and cash equivalents, and
for the September 30, 2020 net leverage ratio, restricted cash held in escrow at Liberty Puerto Rico that was
used to fund a portion of the AT&T Acquisition, divided by (ii) last two quarters annualized Adjusted OIBDA
as of December 31, as adjusted to include rebased Adjusted OIBDA of the AT&T Acquired Entities for the
pre-acquisition period, and September 30, 2020. For purposes of these calculations, adjusted total debt and
finance lease obligations is measured using swapped foreign currency rates. We believe our consolidated
leverage and net leverage ratios are useful because they allow our investors to consider the aggregate
leverage on the business inclusive of any leverage at the Liberty Latin America level, not just at each of our
operations. Investors should view consolidated leverage and net leverage as supplements to, and not
substitutes for, ratios that would be calculated based upon measures presented in accordance with U.S.
GAAP. Reconciliations of the numerator and denominator used to calculate the consolidated leverage and
net leverage ratios as of December 31, 2020 and September 30, 2020 are set forth below:
(1) Amount represents the U.S. equivalent and are based on interest rates and exchange rates that were in effect as of December 31, 2020 and September 30, 2020, respectively. For a discussion of our projected cash flows associated with derivative instruments, please see Item 7A. Quantitative and Qualitative Disclosures
About Market Risk—Projected Cash Flows Associated with Derivative Instruments in our 2020 Annual Report on Form 10-K.
(2) Amount relates to restricted cash held in escrow at Liberty Puerto Rico that was used to fund a portion of the AT&T Acquisition that was completed on October 31, 2020.
(3) Adjusted OIBDA is a non-GAAP measure. See slide 23 for reconciliations of Adjusted OIBDA to the nearest U.S. GAAP measure.
(4) Reflects our calculation of Adjusted OIBDA, as defined by Liberty Latin America, based upon historical financial information of the AT&T Acquired Entities for the pre-acquisition period (July 1, 2020 to October 31, 2020) as adjusted primarily for (i) the impact of new rates pursuant to agreements with AT&T related to roaming,
subsea and ethernet services, (ii) aligning the accounting policies of the AT&T Acquired Entities to those used by Liberty Latin America, (iii) the impact of the elimination of parent-company allocations included in the historical financial statements of the AT&T Acquired Entities that are replaced by costs for services provided
through the transitional services agreement with AT&T, which generally relate to network operations, customer service, finance and accounting, information, technology, and sales and marketing, and (iv) estimated standalone costs of $8 million not covered by the transitional services agreement with AT&T.
25
CONSOLIDATED LEVERAGE RATIO DEFINITION & RECONCILIATION
September 30, 2020 December 31, 2020
in USD millions; except ratios
Total debt and finance lease obligations 8,459.8 8,357.2
Discounts, premiums and deferred financing costs, net 141.3 157.1
Projected derivative principal-related cash payments(1) 20.6 161.6
Adjusted total debt and finance lease obligations 8,621.7 8,675.9
Less:
Cash 1,611.9 894.2
Restricted cash(2) 1,353.0 —
Net debt and finance lease obligations 5,656.8 7,781.7
Adjusted OIBDA(3):
Adjusted OIBDA for the three months ended June 30, 2020 332.6 N/A
Adjusted OBIDA for the three months ended September 30, 2020 360.2 360.2
Adjusted OIBDA for the three months ended December 31, 2020 N/A 428.0
Rebased Adjusted OIBDA – AT&T Acquired Entities(4) — 108.6
Adjusted OIBDA – last two quarters 692.8 896.8
Annualized adjusted OIBDA – last two quarters annualized 1,385.6 1,793.6
Consolidated leverage ratio 6.2x 4.8x
Consolidated net leverage ratio 4.1x 4.3x
LIBERTY LATIN AMERICA | FY 2020 INVESTOR CALL | MARCH 1, 2021

LIBERTY LATIN AMERICA | Q3 2019 INVESTOR CALL | NOVEMBER 6, 2019
(1) Reflects historical financial information of the AT&T Acquired Entities.
(2) Represents adjustments primarily related to (i) the impact of new rates pursuant to agreements with AT&T related to roaming, subsea and ethernet services and (ii) aligning the accounting policies of the AT&T Acquired Entities to those used by Liberty Latin America.
(3) Reflects our calculation of Adjusted OIBDA, as defined by Liberty Latin America, based upon historical financial information of the AT&T Acquired Entities. Adjusted OIBDA, a non-GAAP measure, should be viewed as a measure of operating performance that is a supplement to, and not a substitute for, operating income
or loss, net earnings or loss and other U.S. GAAP measures of income.
(4) Represents adjustments primarily related to (i) the impact of new rates pursuant to agreements with AT&T related to roaming, subsea and ethernet services, (ii) aligning the accounting policies of the AT&T Acquired Entities to those used by Liberty Latin America, (iii) the impact of the elimination of parent-company
allocations included in the historical financial statements of the AT&T Acquired Entities that are replaced by costs for services provided through the transitional services agreement with AT&T, which generally relate to network operations, customer service, finance and accounting, information, technology, and sales and
marketing, and (iv) estimated standalone costs of $19 million not covered by the transitional services agreement with AT&T.
26
AT&T ACQUIRED ENTITIES PRE-ACQUISITION INFORMATION & NON-GAAP RECONCILIATION
LIBERTY LATIN AMERICA | FY 2020 INVESTOR CALL | MARCH 1, 2021
Ten months ended October 31, 2020
in USD millions
Historical revenue of the AT&T Acquired Entities(1) 715.9
Adjustments(2) 40.0
Revenue as-adjusted 755.9
Historical operating income of the AT&T Acquired Entities(1) 57.1
Depreciation and amortization(1) 105.3
Adjusted OIBDA(3) 162.4
Adjustments(4) 98.3
Adjusted OIBDA as-adjusted 260.7
The table below sets forth the revenue and Adjusted OIBDA (as defined by Liberty Latin America) of the
AT&T Acquired Entities for the pre-acquisition period from January 1, 2020 to October 31, 2020, as adjusted
to conform with the accounting policies of Liberty Latin America and to make other adjustments consistent
with our rebased growth calculations. These adjustments are further described in the footnotes to the table.
The “revenue-as adjusted” and “Adjusted OIBDA-as adjusted” results are not necessarily indicative of the
revenue and Adjusted OIBDA that would have occurred if the acquisition of the AT&T Acquired Entities had
occurred as of January 1, 2020 or the revenue and Adjusted OIBDA that will occur in the future.