LIBERTY ALL–STAR EQUITY FUND · Liberty All-Star® Equity Fund President’s Letter (Unaudited) 2...
24
LIBERTY ALL–STAR ® EQUITY FUND 3rd Quarter | September 30, 2017
Transcript of LIBERTY ALL–STAR EQUITY FUND · Liberty All-Star® Equity Fund President’s Letter (Unaudited) 2...

LIBERTY ALL–STAR® EQUITY FUND
3rd Quarter | September 30, 2017

LIBERTY ALL-STAR® EQUITY FUND Periods Ended September 30, 2017 (Unaudited) Fund Statistics
Net Asset Value (NAV) $6.65
Market Price $6.03
Discount -9.3%
Quarter Year-to-Date
Distributions* $0.13 $0.39
Market Price Trading Range $5.53 to $6.06 $5.17 to $6.06
Premium/(Discount) Range -9.0% to -13.1% -9.0% to -15.3% Performance
Shares Valued at NAV with Dividends Reinvested 4.35% 16.25%
Shares Valued at Market Price with Dividends Reinvested 9.00% 25.23%
Dow Jones Industrial Average 5.58% 15.45%
Lipper Large-Cap Core Mutual Fund Average 4.33% 13.49%
NASDAQ Composite Index 6.06% 21.67%
S&P 500® Index 4.48% 14.24%
* Sources of distributions to shareholders may include ordinary dividends, long-term capital gains and return of capital. The actual amounts and sources of the amounts for tax reporting purposes will depend upon the Fund’s investment experience during its fiscal year and may be subject to changes based on tax regulations. Pursuant to Section 852 of the Internal Revenue Code, the taxability of these distributions will be reported on Form 1099-DIV for 2017.
Performance returns for the Fund are total returns, which include dividends. Returns are net of management fees and other Fund expenses.
The returns shown for the Lipper Large-Cap Core Mutual Fund Average are based on open-end mutual funds’ total returns, which include dividends, and are net of fund expenses. Returns for the unmanaged Dow Jones Industrial Average, NASDAQ Composite Index and the S&P 500®Index are total returns, including dividends. A description of the Lipper benchmark and the market indices can be found on page 19.
Past performance cannot predict future results. Performance will fluctuate with market conditions. Current performance may be lower or higher than the performance data shown. Performance information does not reflect the deduction of taxes that shareholders would pay on Fund distributions or the sale of Fund shares. An investment in the Fund involves risk, including loss of principal.
Closed-end funds raise money in an initial public offering and shares are listed and traded on an exchange. Open-end mutual funds continuously issue and redeem shares at net asset value. Shares of closed-end funds frequently trade at a discount to net asset value. The price of the Fund’s shares is determined by a number of factors, several of which are beyond the control of the Fund. Therefore, the Fund cannot predict whether its shares will trade at, below or above net asset value.

Liberty All-Star® Equity Fund President’s Letter (Unaudited)
Third Quarter Report (Unaudited) | September 30, 2017 1
Fellow Shareholders: October 2017
In a placid environment in which almost nothing seemed capable of unsettling investors, stocks
continued their steady advance during the third quarter. On the final trading day of the period, the S&P
500® Index and the NASDAQ Composite Index reached new record highs, while the widely‐followed Dow
Jones Industrial Average (DJIA) ended the period only 7‐plus points below its all‐time closing high of
22,419.59 on September 20.
An almost complete absence of volatility characterized the quarter, as the average daily move, up or
down, of the S&P 500 during the period was 0.3 percent, the lowest since 1968, according to The Wall
Street Journal. The S&P 500 and the DJIA have now gained ground for eight consecutive quarters.
For the quarter, the S&P 500 returned 4.48 percent; the DJIA returned 5.58 percent; and the NASDAQ
Composite gained 6.06 percent. For the first nine months of 2017, these indices’ respective gains are
14.24 percent, 15.45 percent and 21.67 percent.
Solid corporate earnings and good economic data served as the foundation for the third quarter’s
positive results. Corporations as diverse as Caterpillar, McDonald’s, Facebook and Boeing reported
strong second quarter earnings; overall, earnings for S&P 500 companies rose over 10 percent year over
year for the second quarter, above the expectations of most analysts. Employment data continued to
show steady gains, with employers adding 210,000 jobs in June (reported in July) and 138,000 jobs in
July. August’s addition of 169,000 jobs was in line with expectations while the unemployment rate was at
4.4 percent. In September, the Commerce Department reported that U.S. GDP grew at a rate of 3.1
percent in the second quarter (revising the 2.6 percent originally reported in July and a revised 3.0
percent reported in August); this represented a marked increase over the first quarter’s 1.2 percent rate.
Favorable news also emerged from the Federal Reserve’s July policy‐making meeting; the Fed made no
change in short‐term rates and announced that it would gradually wind down its $4 trillion‐plus portfolio
of assets, accumulated in the wake of the financial crisis. As the quarter closed, President Trump
announced a sweeping tax reform package proposing changes that will bear watching over the near‐
term, especially the potential reduction in the top corporate tax rate to 20 percent from the current
35 percent.
Negative news was scarce during the quarter, and what there was came mostly as a result of geopolitical
tensions. In particular, North Korea’s missile and nuclear bomb testing set off heated verbal exchanges
between President Trump and Kim Jung Un, North Korea’s supreme leader. On August 10, the S&P 500
dropped 1.41 percent—the first time in 58 sessions it had moved more than 1 percent up or down—with
its decline largely attributed to escalating U.S.–North Korea tensions. An active hurricane season caused extreme personal hardships but did little to upset equity markets. While hurricane Irma was devastating
parts of the Caribbean and inflicting damage on Florida—and hurricanes Jose and Maria brewed in the
Atlantic—the DJIA logged its best weekly advance of 2017, rising 2.2 percent during the week of
September 11. September employment (reported in early October after the quarter closed) was
negatively impacted by the storms, with the Labor Department reporting a loss of 33,000 net jobs, the
first monthly decline in seven years. Job losses were attributed to hurricanes Harvey and Irma, which
temporarily closed thousands of businesses and shut down the travel/tourism and hospitality industry in
key markets in the Southeast.

Liberty All-Star® Equity Fund President’s Letter (Unaudited)
2 www.all-starfunds.com
Liberty All‐Star® Equity Fund Liberty All‐Star® Equity Fund generally performed in line with major market indices for the third quarter
and ahead of most of them for the first nine months of 2017. For the quarter, the Fund returned 4.35
percent with shares valued at net asset value (NAV) with dividends reinvested and 9.00 percent with
shares valued at market price with dividends reinvested. For the nine months year to date, the Fund
returned 16.25 percent with shares valued at NAV with dividends reinvested and 25.23 percent with
shares valued at market price with dividends reinvested. By comparison, the Lipper Large‐Cap Core
Mutual Fund Average returned 4.33 percent for the quarter and 13.49 percent for the nine months. The
Fund’s performance year to date ranks it in the top 10 percent of funds in the Lipper Large‐Cap
Core universe.
Fund shares valued at market price were helped in the third quarter by a continuing narrowing of the
discount at which Fund shares trade relative to NAV; during the period, Fund shares traded in a discount
range of ‐9.0 percent to ‐13.1 percent relative to their underlying NAV. This compares to a wider range of
‐13.1 percent to ‐15.3 percent in the second quarter.
Turning to Fund news, the Board of Trustees announced a 25 percent increase in the annual distribution
rate, raising it from approximately 8 percent of NAV to approximately 10 percent of NAV. The increase
will be effective with the Fund’s fourth quarter distribution, which will be declared on November 6,
2017. The Board indicated that the increase in the distribution rate may enhance long‐term shareholder
value by providing a method of distributing the Fund’s assets at NAV while increasing liquidity and
reducing the discount at which Fund shares trade relative to their underlying NAV.
In additional Fund news, shareholders overwhelmingly defeated a shareholder proposal at the Annual
Meeting of Shareholders. About two‐thirds of the votes cast, either for or against the proposal, were in
favor of the Board of Trustees recommendation, which opposed the proposal on the basis that it was not
in the best long‐term interests of shareholders. This position was supported by a leading independent
proxy advisory firm, Institutional Shareholder Services (ISS).
In accordance with the Fund’s distribution policy, the Fund paid a distribution of $0.13 per share in the
third quarter. The Fund's distribution policy has been in place since 1988 and is a major component of
the Fund’s total return. These distributions add up to $26.04 per share for a total of more than $2.7
billion since 1987 (the Fund's first full calendar year of operations). As noted, the distribution rate will
increase by 25 percent to 10 percent of NAV, effective with the fourth quarter 2017 distribution. We
continue to emphasize that shareholders should include these distributions when determining the return
on their investment in the Fund.
The Fund continued to perform well in the third quarter, and investors benefited from strong market
price performance for both the quarter and the first nine months of the year; indeed, for the latter
period, the Fund’s return based on share price exceeds that of the S&P 500, the DJIA and the NASDAQ
Composite by a range of 3.6 percent to 11.0 percent. We are hopeful that the positive environment for
stocks will continue through the fourth quarter, setting the stage for the Fund to close out a highly

Liberty All-Star® Equity Fund President’s Letter (Unaudited)
Third Quarter Report (Unaudited) | September 30, 2017 3
rewarding 2017. As always, we will remain vigilant and be guided in our decisions by the Fund’s long‐
term objectives, philosophy and strategy.
Sincerely,
William R. Parmentier, Jr.
President and Chief Executive Officer
Liberty All‐Star® Equity Fund The views expressed in the President’s letter reflect the views of the President as of October 2017 and
may not reflect his views on the date this report is first published or anytime thereafter. These views are
not guarantees of future performance and involve certain risks, uncertainties and assumptions that are
difficult to predict so actual outcomes and results may differ significantly from the views expressed.
These views are subject to change at any time based upon economic, market or other conditions and the
Fund disclaims any responsibility to update such views. These views may not be relied on as investment
advice and, because investment decisions for the Fund are based on numerous factors, may not be relied
on as an indication of trading intent.

Liberty All-Star® Equity Fund Table of Distributions & Rights Offerings September 30, 2017 (Unaudited)
4 www.all-starfunds.com
Rights Offerings
Year Per Share
Distributions Month
Completed
Shares Needed to Purchase One
Additional Share Subscription
Price Tax Credits1 1988 $0.64 1989 0.95 1990 0.90 1991 1.02 1992 1.07 April 10 $10.05 1993 1.07 October 15 10.41 $0.18 1994 1.00 September 15 9.14 1995 1.04 1996 1.18 0.13 1997 1.33 0.36 1998 1.40 April 20 12.83 1999 1.39 2000 1.42 2001 1.20 2002 0.88 May 10 8.99 2003 0.78 2004 0.89 July 102 8.34 2005 0.87 2006 0.88 2007 0.90 December 10 6.51 2008 0.65 2009 0.31 2010 0.31 2011 0.34 2012 0.32 2013 0.35 2014 0.39 2015 0.51 2016 0.48
20173 1st Quarter 2nd Quarter
3rd Quarter
0.13 0.13 0.13
Total $24.86 1 The Fund’s net investment income and net realized capital gains exceeded the amount to be distributed under the
Fund’s distribution policy. In each case, the Fund elected to pay taxes on the undistributed income and passed through a proportionate tax credit to shareholders.
2 The number of shares offered was increased by an additional 25 percent to cover a portion of the over-subscription requests.
3 Effective September 18, 2017 the Fund’s distribution policy increased from an annual rate of approximately 8 percent (2 percent quarterly) of net asset value to approximately 10 percent (2.5 percent quarterly) of net asset value.
DISTRIBUTION POLICY
The current policy is to pay distributions on its shares totaling approximately 10 percent of its net asset value per year, payable in four quarterly installments of 2.5 percent of the Fund’s net asset value at the close of the New York Stock Exchange on the Friday prior to each quarterly declaration date. Sources of distributions to shareholders may include ordinary dividends, long‐term capital gains and return of capital. The actual amounts and sources of the amounts for tax reporting purposes will depend upon the Fund’s investment experience during its fiscal year and may be subject to changes based on tax regulations. If a distribution includes anything other than net investment income, the Fund provides a Section 19(a) notice of the best estimate of its distribution sources at that time. These estimates may not match the final tax characterization (for the full year’s distributions) contained in shareholders’ 1099‐DIV forms after the end of the year. If the Fund’s ordinary dividends and long‐term capital gains for any year exceed the amount distributed under the distribution policy, the Fund may, in its discretion, retain and not distribute capital gains and pay income tax thereon to the extent of such excess.
Investment Managers/ Liberty All-Star® Equity Fund Portfolio Characteristics
September 30, 2017 (Unaudited)
Third Quarter Report (Unaudited) | September 30, 2017 5
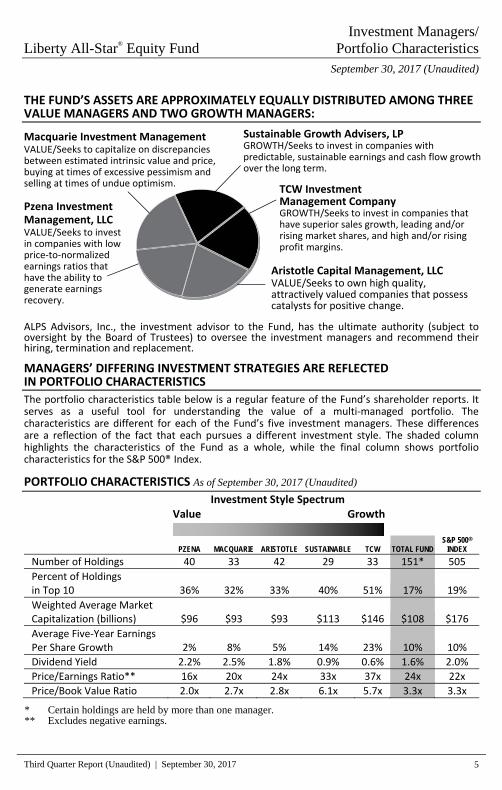
TCW Investment Management Company GROWTH/Seeks to invest in companies that have superior sales growth, leading and/or rising market shares, and high and/or rising profit margins.
Sustainable Growth Advisers, LPGROWTH/Seeks to invest in companies with predictable, sustainable earnings and cash flow growth over the long term.
Aristotle Capital Management, LLC VALUE/Seeks to own high quality, attractively valued companies that possess catalysts for positive change.
THE FUND’S ASSETS ARE APPROXIMATELY EQUALLY DISTRIBUTED AMONG THREE VALUE MANAGERS AND TWO GROWTH MANAGERS:
Macquarie Investment Management VALUE/Seeks to capitalize on discrepancies between estimated intrinsic value and price, buying at times of excessive pessimism and selling at times of undue optimism. Pzena Investment Management, LLC VALUE/Seeks to invest in companies with low price‐to‐normalized earnings ratios that have the ability to generate earnings recovery.
ALPS Advisors, Inc., the investment advisor to the Fund, has the ultimate authority (subject to oversight by the Board of Trustees) to oversee the investment managers and recommend their hiring, termination and replacement.
MANAGERS’ DIFFERING INVESTMENT STRATEGIES ARE REFLECTED IN PORTFOLIO CHARACTERISTICS
The portfolio characteristics table below is a regular feature of the Fund’s shareholder reports. It serves as a useful tool for understanding the value of a multi‐managed portfolio. The characteristics are different for each of the Fund’s five investment managers. These differences are a reflection of the fact that each pursues a different investment style. The shaded column highlights the characteristics of the Fund as a whole, while the final column shows portfolio characteristics for the S&P 500® Index.
PORTFOLIO CHARACTERISTICS As of September 30, 2017 (Unaudited)
Investment Style Spectrum Value Growth
PZENA MACQUARIE ARISTOTLE SUSTAINABLE TCW TOTAL FUND S&P 500®
INDEX
Number of Holdings 40 33 42 29 33 151* 505
Percent of Holdings in Top 10 36% 32% 33% 40% 51% 17% 19%
Weighted Average Market Capitalization (billions) $96 $93 $93 $113 $146 $108 $176
Average Five‐Year Earnings Per Share Growth 2% 8% 5% 14% 23% 10% 10%
Dividend Yield 2.2% 2.5% 1.8% 0.9% 0.6% 1.6% 2.0%
Price/Earnings Ratio** 16x 20x 24x 33x 37x 24x 22x
Price/Book Value Ratio 2.0x 2.7x 2.8x 6.1x 5.7x 3.3x 3.3x
* Certain holdings are held by more than one manager. ** Excludes negative earnings.
Liberty All-Star® Equity Fund Top 20 Holdings & Economic Sectors September 30, 2017 (Unaudited)
6 www.all-starfunds.com
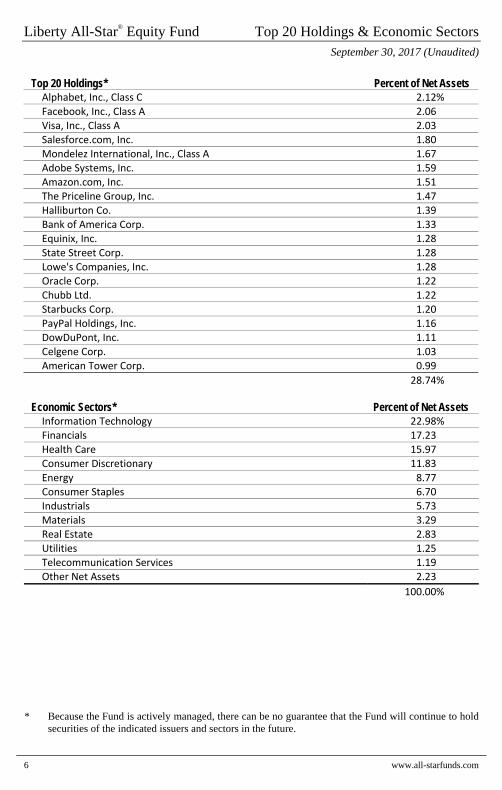
Top 20 Holdings* Percent of Net Assets Alphabet, Inc., Class C 2.12%
Facebook, Inc., Class A 2.06 Visa, Inc., Class A 2.03 Salesforce.com, Inc. 1.80 Mondelez International, Inc., Class A 1.67 Adobe Systems, Inc. 1.59 Amazon.com, Inc. 1.51 The Priceline Group, Inc. 1.47 Halliburton Co. 1.39 Bank of America Corp. 1.33 Equinix, Inc. 1.28
State Street Corp. 1.28 Lowe's Companies, Inc. 1.28 Oracle Corp. 1.22 Chubb Ltd. 1.22 Starbucks Corp. 1.20 PayPal Holdings, Inc. 1.16 DowDuPont, Inc. 1.11 Celgene Corp. 1.03 American Tower Corp. 0.99
28.74% Economic Sectors* Percent of Net Assets Information Technology 22.98% Financials 17.23 Health Care 15.97 Consumer Discretionary 11.83
Energy 8.77 Consumer Staples 6.70 Industrials 5.73 Materials 3.29 Real Estate 2.83 Utilities 1.25 Telecommunication Services 1.19 Other Net Assets 2.23
100.00% * Because the Fund is actively managed, there can be no guarantee that the Fund will continue to hold
securities of the indicated issuers and sectors in the future.

Liberty All-Star® Equity Fund Major Stock Changes in the Quarter September 30, 2017 (Unaudited)
Third Quarter Report (Unaudited) | September 30, 2017 7
The following are the major ($5 million or more) stock changes—both purchases and sales—that were made in the Fund’s portfolio during the third quarter of 2017.
Shares
Security Name Purchases (Sales) Held as of 9/30/17
Purchases
Capital One Financial Corp. 69,000 147,440
Dollar Tree, Inc. 87,200 87,200
Halliburton Co. 157,970 384,770
The TJX Companies, Inc. 106,470 106,470
Ulta Beauty, Inc. 30,254 30,254
Wells Fargo & Co. 137,987 137,987
Sales
Intel Corp. (163,066) 197,200
Kansas City Southern (73,151) 0
The Kraft Heinz Co. (80,400) 0
Regions Financial Corp. (400,825) 0

Liberty All-Star® Equity Fund Schedule of Investments As of September 30, 2017 (Unaudited)
See Notes to Schedule of Investments.
8 www.all-starfunds.com
SHARES MARKET VALUECOMMON STOCKS (97.77%)
CONSUMER DISCRETIONARY (11.83%) Automobiles (0.59%) Ford Motor Co. 631,580 $ 7,560,012
Hotels, Restaurants & Leisure (2.20%) Chipotle Mexican Grill, Inc.(a) 24,602 7,573,234 Hilton Worldwide Holdings, Inc. 74,166 5,150,829 Starbucks Corp. 285,340 15,325,611
28,049,674
Household Durables (0.52%) Lennar Corp., Class A 125,000 6,600,000
Internet & Direct Marketing Retail (2.98%) Amazon.com, Inc.(a) 20,022 19,248,150 The Priceline Group, Inc.(a) 10,253 18,771,397
38,019,547
Media (1.09%) The Interpublic Group of Cos., Inc. 128,075 2,662,679 News Corp., Class A 305,600 4,052,256 Omnicom Group, Inc. 97,893 7,250,935
13,965,870
Multiline Retail (0.59%) Dollar Tree, Inc.(a) 87,200 7,570,704
Specialty Retail (3.12%) The Home Depot, Inc. 54,000 8,832,240 Lowe's Companies, Inc. 203,748 16,287,615 The TJX Companies, Inc. 106,470 7,850,033 Ulta Beauty, Inc.(a) 30,254 6,839,219
39,809,107
Textiles, Apparel & Luxury Goods (0.74%) NIKE, Inc., Class B 183,095 9,493,476
CONSUMER STAPLES (6.70%) Beverages (0.90%) The Coca‐Cola Co. 113,700 5,117,637 Monster Beverage Corp.(a) 115,700 6,392,425
11,510,062
Food & Staples Retailing (2.72%) Costco Wholesale Corp. 40,075 6,583,922 CVS Health Corp. 136,345 11,087,575 The Kroger Co. 200,600 4,024,036 Walgreens Boots Alliance, Inc. 83,100 6,416,982

Liberty All-Star® Equity Fund Schedule of Investments As of September 30, 2017 (Unaudited)
See Notes to Schedule of Investments.
Third Quarter Report (Unaudited) | September 30, 2017 9
SHARES MARKET VALUECOMMON STOCKS (continued)
Food & Staples Retailing (continued) Wal‐Mart Stores, Inc. 84,200 $ 6,579,388
34,691,903
Food Products (2.55%) Archer‐Daniels‐Midland Co. 266,300 11,320,413 Mondelez International, Inc., Class A 523,678 21,292,748
32,613,161
Personal Products (0.53%) Unilever NV 114,000 6,730,560
ENERGY (8.77%) Energy Equipment & Services (2.51%) Core Laboratories NV(b) 68,945 6,804,872 Halliburton Co. 384,770 17,710,963 Schlumberger Ltd. 107,592 7,505,618
32,021,453
Oil, Gas & Consumable Fuels (6.26%) BP PLC(c) 126,501 4,861,433 Cenovus Energy, Inc. 580,200 5,813,604 Chevron Corp. 64,200 7,543,500 Concho Resources, Inc.(a) 27,204 3,583,311 ConocoPhillips 159,300 7,972,965 EQT Corp. 74,800 4,879,952 Exxon Mobil Corp. 61,486 5,040,622 Marathon Oil Corp. 612,010 8,298,856 Murphy Oil Corp. 143,075 3,800,072 Occidental Petroleum Corp. 116,500 7,480,465 Phillips 66 74,500 6,824,945 Pioneer Natural Resources Co. 28,600 4,219,644 Royal Dutch Shell PLC, Class A(c) 159,229 9,646,093
79,965,462
FINANCIALS (17.23%) Banks (6.16%) Banco Bilbao Vizcaya Argentaria SA(b)(c) 810,000 7,225,200 Bank of America Corp. 672,041 17,029,519 BB&T Corp. 159,300 7,477,542 BOK Financial Corp. 44,400 3,955,152 Citigroup, Inc. 146,006 10,620,476 Cullen/Frost Bankers, Inc. 38,000 3,606,960 East West Bancorp, Inc. 20,225 1,209,051 First Republic Bank 31,302 3,269,807 JPMorgan Chase & Co. 130,783 12,491,084 Mitsubishi UFJ Financial Group, Inc.(b)(c) 650,000 4,186,000
Liberty All-Star® Equity Fund Schedule of Investments As of September 30, 2017 (Unaudited)
See Notes to Schedule of Investments.
10 www.all-starfunds.com
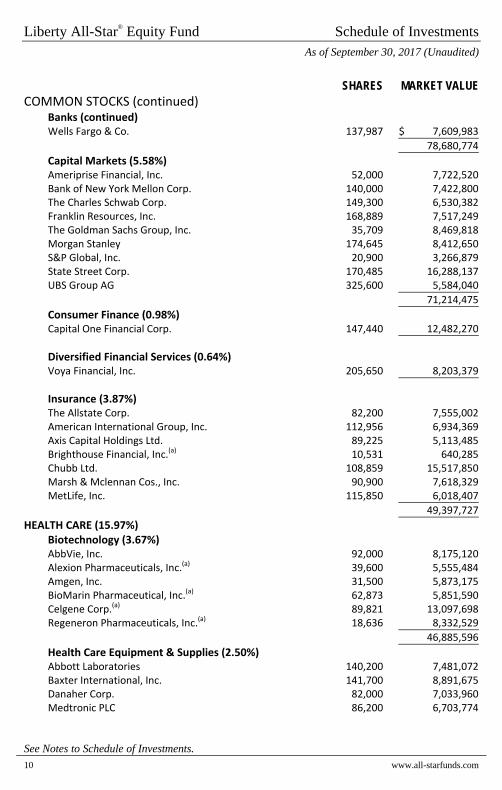
SHARES MARKET VALUECOMMON STOCKS (continued)
Banks (continued) Wells Fargo & Co. 137,987 $ 7,609,983
78,680,774
Capital Markets (5.58%) Ameriprise Financial, Inc. 52,000 7,722,520 Bank of New York Mellon Corp. 140,000 7,422,800 The Charles Schwab Corp. 149,300 6,530,382 Franklin Resources, Inc. 168,889 7,517,249 The Goldman Sachs Group, Inc. 35,709 8,469,818 Morgan Stanley 174,645 8,412,650 S&P Global, Inc. 20,900 3,266,879 State Street Corp. 170,485 16,288,137 UBS Group AG 325,600 5,584,040
71,214,475
Consumer Finance (0.98%) Capital One Financial Corp. 147,440 12,482,270
Diversified Financial Services (0.64%) Voya Financial, Inc. 205,650 8,203,379
Insurance (3.87%) The Allstate Corp. 82,200 7,555,002 American International Group, Inc. 112,956 6,934,369 Axis Capital Holdings Ltd. 89,225 5,113,485 Brighthouse Financial, Inc.(a) 10,531 640,285 Chubb Ltd. 108,859 15,517,850 Marsh & Mclennan Cos., Inc. 90,900 7,618,329 MetLife, Inc. 115,850 6,018,407
49,397,727
HEALTH CARE (15.97%) Biotechnology (3.67%) AbbVie, Inc. 92,000 8,175,120 Alexion Pharmaceuticals, Inc.(a) 39,600 5,555,484 Amgen, Inc. 31,500 5,873,175 BioMarin Pharmaceutical, Inc.(a) 62,873 5,851,590 Celgene Corp.(a) 89,821 13,097,698 Regeneron Pharmaceuticals, Inc.(a) 18,636 8,332,529
46,885,596
Health Care Equipment & Supplies (2.50%) Abbott Laboratories 140,200 7,481,072 Baxter International, Inc. 141,700 8,891,675 Danaher Corp. 82,000 7,033,960 Medtronic PLC 86,200 6,703,774
Liberty All-Star® Equity Fund Schedule of Investments As of September 30, 2017 (Unaudited)
See Notes to Schedule of Investments.
Third Quarter Report (Unaudited) | September 30, 2017 11
SHARES MARKET VALUECOMMON STOCKS (continued)
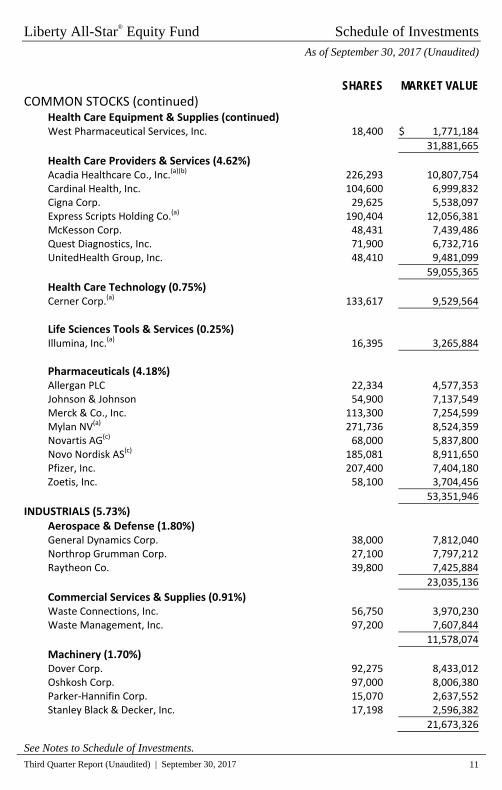
Health Care Equipment & Supplies (continued) West Pharmaceutical Services, Inc. 18,400 $ 1,771,184
31,881,665
Health Care Providers & Services (4.62%) Acadia Healthcare Co., Inc.(a)(b) 226,293 10,807,754 Cardinal Health, Inc. 104,600 6,999,832 Cigna Corp. 29,625 5,538,097 Express Scripts Holding Co.(a) 190,404 12,056,381 McKesson Corp. 48,431 7,439,486 Quest Diagnostics, Inc. 71,900 6,732,716 UnitedHealth Group, Inc. 48,410 9,481,099
59,055,365
Health Care Technology (0.75%) Cerner Corp.(a) 133,617 9,529,564
Life Sciences Tools & Services (0.25%) Illumina, Inc.(a) 16,395 3,265,884
Pharmaceuticals (4.18%) Allergan PLC 22,334 4,577,353 Johnson & Johnson 54,900 7,137,549 Merck & Co., Inc. 113,300 7,254,599 Mylan NV(a) 271,736 8,524,359 Novartis AG(c) 68,000 5,837,800 Novo Nordisk AS(c) 185,081 8,911,650 Pfizer, Inc. 207,400 7,404,180 Zoetis, Inc. 58,100 3,704,456
53,351,946
INDUSTRIALS (5.73%) Aerospace & Defense (1.80%) General Dynamics Corp. 38,000 7,812,040 Northrop Grumman Corp. 27,100 7,797,212 Raytheon Co. 39,800 7,425,884
23,035,136
Commercial Services & Supplies (0.91%) Waste Connections, Inc. 56,750 3,970,230 Waste Management, Inc. 97,200 7,607,844
11,578,074
Machinery (1.70%) Dover Corp. 92,275 8,433,012 Oshkosh Corp. 97,000 8,006,380 Parker‐Hannifin Corp. 15,070 2,637,552 Stanley Black & Decker, Inc. 17,198 2,596,382
21,673,326
Liberty All-Star® Equity Fund Schedule of Investments As of September 30, 2017 (Unaudited)
See Notes to Schedule of Investments.
12 www.all-starfunds.com
SHARES MARKET VALUECOMMON STOCKS (continued)
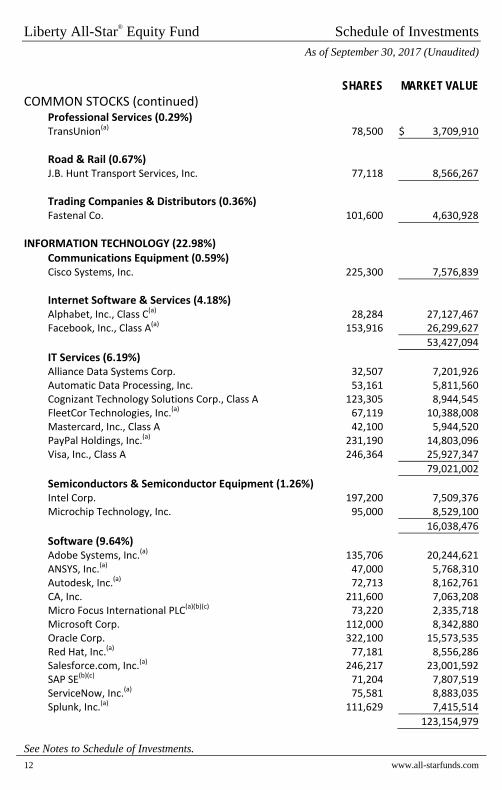
Professional Services (0.29%) TransUnion(a) 78,500 $ 3,709,910
Road & Rail (0.67%) J.B. Hunt Transport Services, Inc. 77,118 8,566,267
Trading Companies & Distributors (0.36%) Fastenal Co. 101,600 4,630,928
INFORMATION TECHNOLOGY (22.98%) Communications Equipment (0.59%) Cisco Systems, Inc. 225,300 7,576,839
Internet Software & Services (4.18%) Alphabet, Inc., Class C(a) 28,284 27,127,467 Facebook, Inc., Class A(a) 153,916 26,299,627
53,427,094
IT Services (6.19%) Alliance Data Systems Corp. 32,507 7,201,926 Automatic Data Processing, Inc. 53,161 5,811,560 Cognizant Technology Solutions Corp., Class A 123,305 8,944,545 FleetCor Technologies, Inc.(a) 67,119 10,388,008 Mastercard, Inc., Class A 42,100 5,944,520 PayPal Holdings, Inc.(a) 231,190 14,803,096 Visa, Inc., Class A 246,364 25,927,347
79,021,002
Semiconductors & Semiconductor Equipment (1.26%) Intel Corp. 197,200 7,509,376 Microchip Technology, Inc. 95,000 8,529,100
16,038,476
Software (9.64%) Adobe Systems, Inc.(a) 135,706 20,244,621 ANSYS, Inc.(a) 47,000 5,768,310 Autodesk, Inc.(a) 72,713 8,162,761 CA, Inc. 211,600 7,063,208 Micro Focus International PLC(a)(b)(c) 73,220 2,335,718 Microsoft Corp. 112,000 8,342,880 Oracle Corp. 322,100 15,573,535 Red Hat, Inc.(a) 77,181 8,556,286 Salesforce.com, Inc.(a) 246,217 23,001,592 SAP SE(b)(c) 71,204 7,807,519 ServiceNow, Inc.(a) 75,581 8,883,035 Splunk, Inc.(a) 111,629 7,415,514
123,154,979
Liberty All-Star® Equity Fund Schedule of Investments As of September 30, 2017 (Unaudited)
See Notes to Schedule of Investments.
Third Quarter Report (Unaudited) | September 30, 2017 13
SHARES MARKET VALUECOMMON STOCKS (continued)
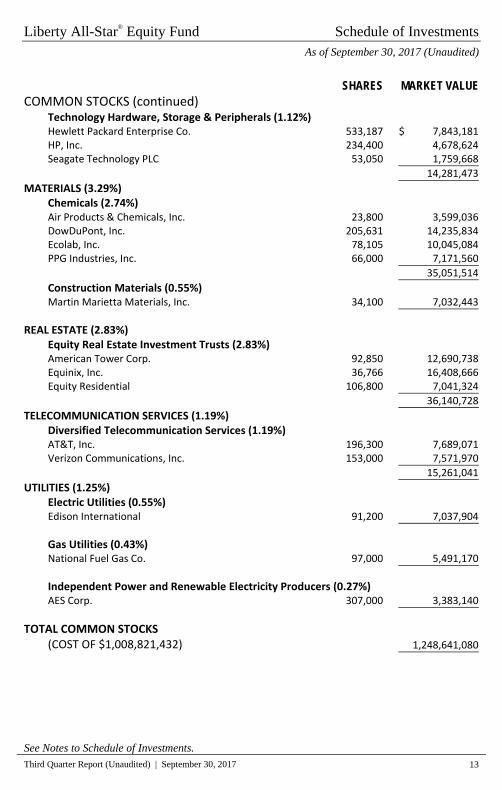
Technology Hardware, Storage & Peripherals (1.12%) Hewlett Packard Enterprise Co. 533,187 $ 7,843,181 HP, Inc. 234,400 4,678,624 Seagate Technology PLC 53,050 1,759,668
14,281,473
MATERIALS (3.29%) Chemicals (2.74%) Air Products & Chemicals, Inc. 23,800 3,599,036 DowDuPont, Inc. 205,631 14,235,834 Ecolab, Inc. 78,105 10,045,084 PPG Industries, Inc. 66,000 7,171,560
35,051,514
Construction Materials (0.55%) Martin Marietta Materials, Inc. 34,100 7,032,443
REAL ESTATE (2.83%) Equity Real Estate Investment Trusts (2.83%) American Tower Corp. 92,850 12,690,738 Equinix, Inc. 36,766 16,408,666 Equity Residential 106,800 7,041,324
36,140,728
TELECOMMUNICATION SERVICES (1.19%) Diversified Telecommunication Services (1.19%) AT&T, Inc. 196,300 7,689,071 Verizon Communications, Inc. 153,000 7,571,970
15,261,041
UTILITIES (1.25%) Electric Utilities (0.55%) Edison International 91,200 7,037,904
Gas Utilities (0.43%) National Fuel Gas Co. 97,000 5,491,170
Independent Power and Renewable Electricity Producers (0.27%) AES Corp. 307,000 3,383,140
TOTAL COMMON STOCKS (COST OF $1,008,821,432) 1,248,641,080

Liberty All-Star® Equity Fund Schedule of Investments As of September 30, 2017 (Unaudited)
See Notes to Schedule of Investments.
14 www.all-starfunds.com
SHARES MARKET VALUESHORT TERM INVESTMENTS (2.97%)
MONEY MARKET FUND (2.21%) State Street Institutional U.S. Government Money
Market Fund, 0.93%(d)
(COST OF $28,200,491) 28,200,491 $ 28,200,491
INVESTMENTS PURCHASED WITH COLLATERAL FROM SECURITIES LOANED (0.76%)
State Street Navigator Securities Lending Government Money Market Portfolio, 1.02%
(COST OF $9,681,113) 9,681,113 9,681,113
TOTAL SHORT TERM INVESTMENTS
(COST OF $37,881,604) 37,881,604
TOTAL INVESTMENTS (100.74%) (COST OF $1,046,703,036)(e) 1,286,522,684
LIABILITIES IN EXCESS OF OTHER ASSETS (‐0.74%) (9,463,792)
NET ASSETS (100.00%) $ 1,277,058,892
NET ASSET VALUE PER SHARE(192,004,410 SHARES OUTSTANDING) $ 6.65
(a)
Non-income producing security. (b)
Security, or a portion of the security position, is currently on loan. The total market value of securities on loan is $16,155,315.
(c)
American Depositary Receipt. (d)
Rate reflects seven-day effective yield on September 30, 2017. (e)
Cost of investments for federal income tax purposes is $1,047,727,520.
Gross unrealized appreciation and depreciation at September 30, 2017 based on cost of investments for federal income tax purposes is as follows:
Gross unrealized appreciation $ 281,509,563 Gross unrealized depreciation (42,714,399)
Net unrealized appreciation $ 238,795,164
Liberty All-Star® Equity Fund Notes to Schedule of Investments September 30, 2017 (Unaudited)
Third Quarter Report (Unaudited) | September 30, 2017 15
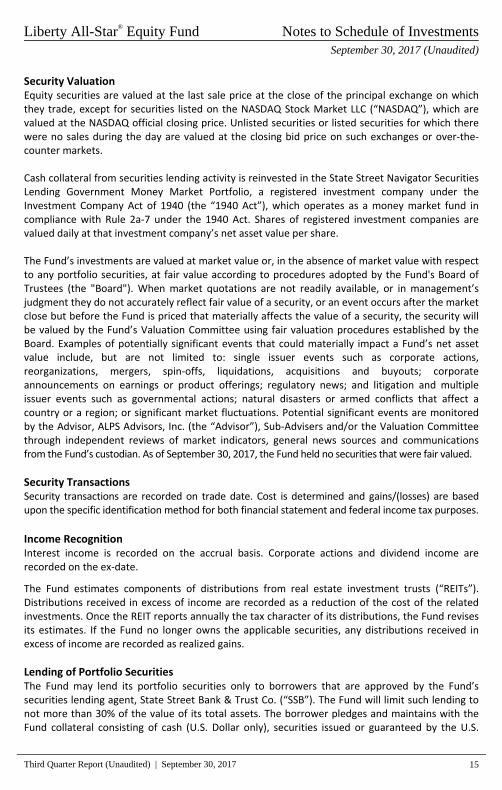
Security Valuation Equity securities are valued at the last sale price at the close of the principal exchange on which they trade, except for securities listed on the NASDAQ Stock Market LLC (“NASDAQ”), which are valued at the NASDAQ official closing price. Unlisted securities or listed securities for which there were no sales during the day are valued at the closing bid price on such exchanges or over‐the‐counter markets. Cash collateral from securities lending activity is reinvested in the State Street Navigator Securities Lending Government Money Market Portfolio, a registered investment company under the Investment Company Act of 1940 (the “1940 Act”), which operates as a money market fund in compliance with Rule 2a‐7 under the 1940 Act. Shares of registered investment companies are valued daily at that investment company’s net asset value per share. The Fund’s investments are valued at market value or, in the absence of market value with respect to any portfolio securities, at fair value according to procedures adopted by the Fund's Board of Trustees (the "Board"). When market quotations are not readily available, or in management’s judgment they do not accurately reflect fair value of a security, or an event occurs after the market close but before the Fund is priced that materially affects the value of a security, the security will be valued by the Fund’s Valuation Committee using fair valuation procedures established by the Board. Examples of potentially significant events that could materially impact a Fund’s net asset value include, but are not limited to: single issuer events such as corporate actions, reorganizations, mergers, spin‐offs, liquidations, acquisitions and buyouts; corporate announcements on earnings or product offerings; regulatory news; and litigation and multiple issuer events such as governmental actions; natural disasters or armed conflicts that affect a country or a region; or significant market fluctuations. Potential significant events are monitored by the Advisor, ALPS Advisors, Inc. (the “Advisor”), Sub‐Advisers and/or the Valuation Committee through independent reviews of market indicators, general news sources and communications from the Fund’s custodian. As of September 30, 2017, the Fund held no securities that were fair valued.
Security Transactions Security transactions are recorded on trade date. Cost is determined and gains/(losses) are based upon the specific identification method for both financial statement and federal income tax purposes.
Income Recognition Interest income is recorded on the accrual basis. Corporate actions and dividend income are recorded on the ex‐date.
The Fund estimates components of distributions from real estate investment trusts (“REITs”). Distributions received in excess of income are recorded as a reduction of the cost of the related investments. Once the REIT reports annually the tax character of its distributions, the Fund revises its estimates. If the Fund no longer owns the applicable securities, any distributions received in excess of income are recorded as realized gains.
Lending of Portfolio Securities The Fund may lend its portfolio securities only to borrowers that are approved by the Fund’s securities lending agent, State Street Bank & Trust Co. (“SSB”). The Fund will limit such lending to not more than 30% of the value of its total assets. The borrower pledges and maintains with the Fund collateral consisting of cash (U.S. Dollar only), securities issued or guaranteed by the U.S.
Liberty All-Star® Equity Fund Notes to Schedule of Investments September 30, 2017 (Unaudited)
16 www.all-starfunds.com
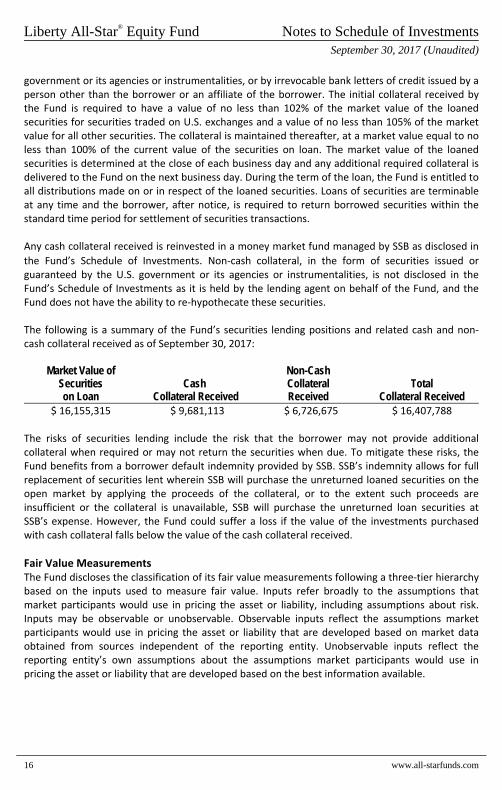
government or its agencies or instrumentalities, or by irrevocable bank letters of credit issued by a person other than the borrower or an affiliate of the borrower. The initial collateral received by the Fund is required to have a value of no less than 102% of the market value of the loaned securities for securities traded on U.S. exchanges and a value of no less than 105% of the market value for all other securities. The collateral is maintained thereafter, at a market value equal to no less than 100% of the current value of the securities on loan. The market value of the loaned securities is determined at the close of each business day and any additional required collateral is delivered to the Fund on the next business day. During the term of the loan, the Fund is entitled to all distributions made on or in respect of the loaned securities. Loans of securities are terminable at any time and the borrower, after notice, is required to return borrowed securities within the standard time period for settlement of securities transactions. Any cash collateral received is reinvested in a money market fund managed by SSB as disclosed in
the Fund’s Schedule of Investments. Non‐cash collateral, in the form of securities issued or guaranteed by the U.S. government or its agencies or instrumentalities, is not disclosed in the Fund’s Schedule of Investments as it is held by the lending agent on behalf of the Fund, and the Fund does not have the ability to re‐hypothecate these securities. The following is a summary of the Fund’s securities lending positions and related cash and non‐cash collateral received as of September 30, 2017:
Market Value of Securities on Loan
Cash Collateral Received
Non-Cash Collateral Received
Total Collateral Received
$ 16,155,315 $ 9,681,113 $ 6,726,675 $ 16,407,788 The risks of securities lending include the risk that the borrower may not provide additional collateral when required or may not return the securities when due. To mitigate these risks, the Fund benefits from a borrower default indemnity provided by SSB. SSB’s indemnity allows for full replacement of securities lent wherein SSB will purchase the unreturned loaned securities on the open market by applying the proceeds of the collateral, or to the extent such proceeds are insufficient or the collateral is unavailable, SSB will purchase the unreturned loan securities at SSB’s expense. However, the Fund could suffer a loss if the value of the investments purchased with cash collateral falls below the value of the cash collateral received.
Fair Value Measurements The Fund discloses the classification of its fair value measurements following a three‐tier hierarchy based on the inputs used to measure fair value. Inputs refer broadly to the assumptions that market participants would use in pricing the asset or liability, including assumptions about risk. Inputs may be observable or unobservable. Observable inputs reflect the assumptions market participants would use in pricing the asset or liability that are developed based on market data obtained from sources independent of the reporting entity. Unobservable inputs reflect the reporting entity’s own assumptions about the assumptions market participants would use in pricing the asset or liability that are developed based on the best information available.

Liberty All-Star® Equity Fund Notes to Schedule of Investments September 30, 2017 (Unaudited)
Third Quarter Report (Unaudited) | September 30, 2017 17
Valuation techniques used to value the Fund’s investments by major category are as follows: Equity securities that are valued based on unadjusted quoted prices in active markets are categorized as Level 1 in the hierarchy. In the event there were no sales during the day or closing prices are not available, securities are valued at the mean of quoted bid and ask prices on such day and are generally categorized as Level 2 in the hierarchy. Investments in shares of registered investment companies are valued at their closing NAV each business day and are categorized as Level 1 in the hierarchy. Various inputs are used in determining the value of the Fund’s investments as of the end of the reporting period. When inputs used fall into different levels of the fair value hierarchy, the level in the hierarchy within which the fair value measurement falls is determined based on the lowest level input that is significant to the fair value measurement in its entirety. The designated input levels are not necessarily an indication of the risk or liquidity associated with these investments. These inputs are categorized in the following hierarchy under applicable financial accounting standards:
Level 1 – Unadjusted quoted prices in active markets for identical investments, unrestricted
assets or liabilities that a Fund has the ability to access at the measurement date;
Level 2 – Quoted prices which are not active, quoted prices for similar assets or liabilities inactive markets or inputs other than quoted prices that are observable (either directly orindirectly) for substantially the full term of the asset or liability; and
Level 3 – Significant unobservable prices or inputs (including the Fund’s own assumptions indetermining the fair value of investments) where there is little or no market activity forthe asset or liability at the measurement date.
The following is a summary of the inputs used to value the Fund’s investments as of September 30, 2017:
Valuation Inputs Investments in Securities at Value* Level 1 Level 2 Level 3 Total Common Stocks $ 1,248,641,080 $ – $ – $ 1,248,641,080 Short Term Investment 28,200,491 – – 28,200,491 Investments Purchased with
Collateral from Securities Loaned 9,681,113 – – 9,681,113
Total $ 1,286,522,684 $ – $ – $ 1,286,522,684
* See Schedule of Investments for industry classifications.
The Fund recognizes transfers between levels as of the end of the period. For the nine months ended September 30, 2017, the Fund did not have any transfers between Level 1 and Level 2 securities. The Fund did not have any securities which used significant unobservable inputs (Level 3) in determining fair value during the period.

Liberty All-Star® Equity Fund Notes to Schedule of Investments September 30, 2017 (Unaudited)
18 www.all-starfunds.com
Indemnification In the normal course of business, the Fund enters into contracts that contain a variety of representations and warranties and which provide general indemnities. The Fund’s maximum exposure under these arrangements is unknown, as this would involve future claims against the Fund. Also, under the Fund’s organizational documents and by contract, the Trustees and Officers of the Fund are indemnified against certain liabilities that may arise out of their duties to the Fund. However, based on experience, the Fund expects the risk of loss due to these warranties and indemnities to be minimal. Shareholder Meeting Results On August 24, 2017, the Annual Meeting of Shareholders of the Fund was held to elect two Trustees and to consider a shareholder proposal. On June 12, 2017, the record date for the meeting, the Fund had outstanding 190,661,201 shares of beneficial interest. The votes cast at the meeting were as follows:
Proposal 1 – To elect two Trustees: Nominee For Against/Withheld Thomas W. Brock 143,884,004.146 26,818,202.466
George Gaspari 143,727,688.298 26,974,518.314
Proposal 3 – Shareholder proposal:
For Against Abstain Broker Non-Votes 34,712,284.341 67,547,452.608 4,627,432.663 63,815,037.000
Description of Lipper Benchmark Liberty All-Star® Equity Fund And Market Indices
September 30, 2017 (Unaudited)
Third Quarter Report (Unaudited) | September 30, 2017 19
Dow Jones Industrial Average A price‐weighted measure of 30 U.S. blue‐chip companies.
Lipper Large‐Cap Core Mutual Fund Average The average of funds that, by portfolio practice, invest at least 75% of their equity assets in companies with market capitalizations (on a three‐year weighted basis) above Lipper’s U.S. domestic equity large‐cap floor. These funds typically have average characteristics compared to the S&P 500® Index.
NASDAQ Composite Index Measures all NASDAQ domestic and international based common type stocks listed on the NASDAQ Stock Market.
S&P 500® Index A large cap U.S. equities index that includes 500 leading companies and captures approximately 80% coverage of available market capitalization. An investor cannot invest directly in an index.

A description of the Fund’s proxy voting policies and procedures is available (i) on the Securities and Exchange Commission’s (“SEC”) website at www.sec.gov, and (ii) without charge, upon request, by calling 1-800-542-3863. Information regarding how the Fund voted proxies relating to portfolio securities during the 12-month period ended June 30th is available from the SEC’s website at www.sec.gov.
The Fund files a complete schedule of portfolio holdings with the SEC for the first and third quarters of each fiscal year on Form N-Q. The Fund’s Form N-Qs are available on the SEC’s website at www.sec.gov and may be reviewed and copied at the SEC’s Public Reference Room in Washing ton, DC. Information on the operation of the Public Reference Room may be obtained by calling 1-800-SEC-0330.
Notice is hereby given in accordance with Section 23(c) of the Investment Company Act of 1940 that the Fund may purchase at market prices from time to time shares of its own common stock in the open market.
This report is transmitted to shareholders of Liberty All-Star® Equity Fund for their information. It is not a prospectus or other document intended for use in the purchase of Fund shares.
INVESTMENT ADVISOR
ALPS Advisors, Inc.
1290 Broadway, Suite 1100
Denver, Colorado 80203
303-623-2577
www.all-starfunds.com
INDEPENDENT REGISTERED
PUBLIC ACCOUNTING FIRM
Deloitte & Touche LLP
555 Seventeenth Street, Suite 3600
Denver, Colorado 80202
CUSTODIAN
State Street Bank & Trust Company
One Lincoln Street
Boston, Massachusetts 02111
INVESTOR ASSISTANCE,
TRANSFER & DIVIDEND
DISBURSING AGENT & REGISTRAR
Computershare
P.O. Box 505000
Louisville, Kentucky 40233
1-800-LIB-FUND (1-800-542-3863)
www.computershare.com
LEGAL COUNSEL
K&L Gates LLP1601 K Street, NWWashington, DC 20006
TRUSTEES
John A. Benning*Thomas W. Brock*, ChairmanEdmund J. BurkeGeorge R. Gaspari*Dr. John J. Neuhauser*Richard C. Rantzow*
OFFICERS
William R. Parmentier, Jr., PresidentMark T. Haley, CFA, Senior Vice PresidentEdmund J. Burke, Vice PresidentKimberly R. Storms, TreasurerAndrew P. Meloni, Assistant TreasurerSareena Khwaja-Dixon, SecretaryJennifer Craig, Assistant SecretaryErin D. Nelson, Chief Compliance Officer
* Member of the Audit Committee
LAS000820 5/31/18

Secondary market support provided to the Fund by ALPS Fund Services, Inc.’s affiliate ALPS Portfolio Solutions Distributor, Inc., a FINRA member.