
Liberalization of Trade in Services and Productivity ... · Table 6.1 shows that the Korean...
31
This PDF is a selection from a published volume from the National Bureau of Economic Research Volume Title: Trade in Services in the Asia Pacific Region, NBER East Asia Seminar on Economics (EASE), Volume 11 Volume Author/Editor: Takatoshi Ito and Anne O. Krueger, editors Volume Publisher: University of Chicago Press Volume ISBN: 0-226-38677-5 Volume URL: http://www.nber.org/books/ito_03-1 Conference Date: June 22-24, 2000 Publication Date: January 2003 Title: Liberalization of Trade in Services and Productivity Growth in Korea Author: Jong-Il Kim, June-Dong Kim URL: http://www.nber.org/chapters/c10159
Transcript of Liberalization of Trade in Services and Productivity ... · Table 6.1 shows that the Korean...

This PDF is a selection from a published volume from theNational Bureau of Economic Research
Volume Title: Trade in Services in the Asia Pacific Region,NBER East Asia Seminar on Economics (EASE), Volume11
Volume Author/Editor: Takatoshi Ito and Anne O. Krueger,editors
Volume Publisher: University of Chicago Press
Volume ISBN: 0-226-38677-5
Volume URL: http://www.nber.org/books/ito_03-1
Conference Date: June 22-24, 2000
Publication Date: January 2003
Title: Liberalization of Trade in Services and ProductivityGrowth in Korea
Author: Jong-Il Kim, June-Dong Kim
URL: http://www.nber.org/chapters/c10159

179
6.1 Introduction
Korea’s economic development over the past twenty five years has beenbased on industrialization, with priority being given to the manufacturingsectors at the expense of services. However, since the financial crisis of late1997, the importance of the service sector has been increasingly recognized,and comprehensive reforms in the service sector were recommended in or-der to restore the crisis-ridden economy to its previous growth path (Mc-Kinsey 1998).
The liberalization of services can bring potential gains in productivity inservice sectors that are subject to technology transfers and economies ofscale. These are similar to the productivity effects of foreign direct invest-ment (FDI) in the manufacturing sector, because a significant portion ofservice supplies occurs through FDI. Various studies show positive evi-dence of the productivity spillovers of FDI (Caves 1974; Globerman 1979;Blomstrom and Persson 1983; Borensztein, de Gregorio, and Lee 1998).Foreign investment may also raise productivity by enhancing competition.Based on an analysis of approximately 670 U.K. companies, Nickell (1996)showed that competition, as measured by increased numbers of competi-tors or by lower levels of rents, is associated with a significantly higher rateof total factor productivity growth. Using firm-level panel data of U.S. au-tomobile component manufacturers, Chung, Mitchell, and Yeung (1994)found that productivity gains among the host country suppliers largely stemfrom the increase in competition created by FDI.
Anecdotal evidence shows that foreign-invested firms may raise produc-
6Liberalization of Trade in Servicesand Productivity Growth in Korea
Jong-Il Kim and June-Dong Kim
Jong-Il Kim is an associate professor of economics at Dongguk University, and June-DongKim is a research fellow at the Korea Institute for International Economic Policy.

tivity by spinning out skilled workers, providing technical guidance to sub-contractors, bringing in new capital goods and technology, introducing ad-vanced management know-how, conducting in-house research and devel-opment, and enhancing competition (Kim and Hwang 2000, 272). Most ofthese channels of raising productivity through FDI apply to both the man-ufacturing and service sectors.
Moreover, the liberalization of trade in services may result in improvedproductivity in other sectors, including manufacturing, due to the resultingaccess to a broader variety, better quality, and lower cost of inputs. Using amodel of increasing returns due to specialization, Rivera-Batiz and Rivera-Batiz (1992) argued that FDI in the business service sector stimulates spe-cialization and raises the productivity of the industry that uses them.Markusen (1989) also demonstrated that allowing trade in producer ser-vices is superior to allowing trade in final goods only, due to the comple-mentarity between domestic and foreign producer services.
This paper investigates the changes in productivity growth rates of Ko-rean service and manufacturing subsectors in relation to the liberalizationof trade in services. Since Korea underwent accelerated liberalization of theservice sector in the 1990s, we try to examine whether the service subsectorsthat were liberalized and the manufacturing subsectors that use liberalizedservices as inputs experienced productivity gains in this period.
This paper is organized as follows: Section 6.2 reviews the evolution ofliberalization in services in Korea as well as the recent trends of trade in ser-vices. Section 6.3 illustrates the case of distribution services, which were lib-eralized almost completely in the 1990s. Changes in productivity in the ser-vice and manufacturing subsectors are explored in section 6.4 with atabulation of the trends of labor and total factor productivity. We then in-vestigate whether liberalized service subsectors posted relatively higher pro-ductivity growth and contributed to productivity gains in the manufactur-ing subsectors. Concluding remarks and policy implications are provided insection 6.5.
6.2 Evolution of Services Liberalization and Recent Trends of Trade in Services
6.2.1 Evolution of Services Liberalization
Unlike the manufacturing sector, in which FDI had been liberalized sincethe early 1980s, much of the services liberalization has only taken placesince the mid-1990s. Table 6.1 shows that the Korean government has lib-eralized 154 business categories (at the Korean standard industrial classifi-cation [KSIC] five-digit level) in the service sector, completely or partially,since 1993. Many of these service subsectors were liberalized as a result of
180 Jong-Il Kim and June-Dong Kim

the Uruguay Round negotiations and Korea’s accession to the Organiza-tion for Economic Cooperation and Development (OECD) in 1996. Addi-tional liberalization took place after Korea suffered from economic crisis in1997. In 1998, as a way of attracting more foreign investment and enhanc-ing efficiency, the Korean government accelerated the liberalization of theservice sector beyond the level of its OECD and World Trade Organization(WTO) commitments.
Comparison of service subsectors in which FDI was restricted as of Jan-uary 1990 (table 6A.1) with those as of November 1997 (table 6A.2) showsthat distribution services, business services, entertainment and recreationalservices, and other personal services have been liberalized since 1990. Also,transportation services, financial services, and telecommunication serviceswere partially liberalized during this period.
More drastic liberalization has been implemented since the financial cri-sis of late 1997. Twenty-two business categories, most of which are in theservice sector, including real estate rental and sales, land development, wa-terworks, and investment companies, fully opened in 1998. By May 1999,three more service business categories, the publishing of books, outer mar-itime transportation, and the operation of casinos, fully opened. Further-more, existing ceilings on foreign equity ratios were raised in 1999 in sixbusiness categories: newspaper publishing, cable broadcasting, wire tele-graph and telephone, and wireless telegraph and telephone.
As a result, only twenty four business categories in the service sector re-mained to be completely liberalized as of May 2000. Among them, radioand television broadcasting are the two categories in which FDI is whollyrestricted. Foreign direct investment in twenty two business categories, in-cluding the publishing of newspapers, coastal water transport, air trans-
Liberalization and Productivity Growth in Korea 181
Table 6.1 Korea’s FDI Liberalization, 1993–2000 (as of May 2000)
LiberalizedRemaining
Classification Total 1993 1994 1995 1996 1997 1998 1999 2000 Restricted
Manufacturing 585 2 1 0 6 1 2 2 0 0Services 495 9 23 42 39 16 20 3 2 2 (22)Others 68 5 6 2 4 10 0 0 1 2 (2)Total 1,148a 16 30 44 49 27 22 5 3 4 (24)
Source: Ministry of Finance and Economy, Five-Year Foreign Investment Liberalization Plan (variousyears), and Ministry of Commerce, Industry, and Energy, Consolidated Public Notice for Foreign Invest-ment (May 2000).Notes: The business categories are at the Korean Standard Industrial Classification (KSIC) five-digitlevel. “Others” denotes agriculture, fisheries and mining. “Liberalized” includes both complete and par-tial liberalization. The number of partially restricted business categories is in parentheses.aBusiness categories that include government services and nonprofit organizations, where FDI is prohib-ited by domestic law, are not counted.

port, telecommunications, investment trust companies, and electric powergeneration, are partially restricted (table 6.2).1
6.2.2 Recent Trends of Trade in Services
The service sector is gaining importance in the Korean economy, with itsshare of GDP and employment having increased from 43.9 percent and 39.5percent in 1980 to 52.7 percent and 59.8 percent in 1998, respectively. How-ever, the share of the service sector in the domestic economy is lower thanthat of the United States, Singapore, and Japan, where its portion of theGDP in 1996 was 74.1 percent, 70.9 percent, and 64.4 percent, respectively.
Table 6.3 shows Korea’s trade in services by mode of supply in the 1990s.The sum of exports and imports, of cross-border supply, which is measuredby commercial services in balance of payments (BOP), except for tourism,increased from about $16 billion in 1991 to $39.6 billion in 1998. Trade inservices by the three modes of supply (cross-border supply, consumptionabroad, and movement of natural persons), except commercial presence,increased from $22.8 billion in 1991 to $49 billion in 1998. In 1998, the to-tal amount of Korea’s trade in services, except commercial presence, was al-most 20 percent of the amount of trade in goods. The share in the world’stotal trade in services, except commercial presence, also rose from 1.2 per-cent in 1991 to 1.8 percent in 1998.
Table 6.4 reveals that a significant increase in trade in services has occurredthrough commercial presence since the 1980s. Foreign direct investment in-flows in services increased from $1.6 billion in 1982–90 to $6.3 billion in
182 Jong-Il Kim and June-Dong Kim
Table 6.2 Service Business Categories in which FDI is Restricted, Korea (as of May 2000)
Wholly Restricted Partially Restricted
Radio broadcasting Wholesale of meatsTelevision broadcasting Publishing (newspapers, periodicals)
Processing of nuclear fuelElectric power generationCoastal water transport (passenger, freight)Air transport (scheduled, non-scheduled)Telecommunications (leased line, wired,
mobile, cellular, resellers, other)Domestic banking (special banking)Investment trust companiesProgram supplyingCable broadcasting, satellite broadcastingNews agency activitiesRadioactive waste disposal
Source: Ministry of Commerce, Industry, and Energy, Consolidated Public Notice for ForeignInvestment (May 2000).
1. Even though FDI in legal services is not restricted, foreign lawyers are not allowed topractice unless they acquire a domestic license.

1998–99. Hotels were the largest recipients through the 1980s. In the 1990s,FDI increased remarkably in distribution services (wholesale and retail),transportation services, financial services, and other services, which aremainly composed of telecommunication and business services. Foreign directinvestment in distribution services increased from $20.1 million in 1982–90 to$586.6 million in 1996–97. Foreign direct investment in transportation ser-
Liberalization and Productivity Growth in Korea 183
Table 6.3 Trade in Services by Modes of Supply, Korea: 1991, 1995, 1998 (US$ millions)
1991 1995 1998
Exports Imports Exports Imports Exports Imports
Cross-border supplya 7,158 8,953 17,677 19,465 18,647 21,053Transportation 3,873 4,897 9,272 9,645 10,204 8,983
Communications 353 204 561 642 656 1,133Consumption abroadb 2,856 3,214 5,150 6,341 5,933 2,898Commercial presence n.a. n.a. n.a. n.a. n.a. n.a.Movement of natural personsc 604 54 774 132 446 42
Total 10,618 12,221 23,601 25,938 25,026 23,993(1.2) (1.3) (1.8) (2.0) (1.8) (1.7)
Source: International Monetary Fund, Balance of Payments Statistics Yearbook (1999).Note: Percentage shares in the world’s trade in services are in parentheses.aBOP commercial services minus travel.bBOP travel.cBOP compensation of employees.
Table 6.4 FDI Inflows in Service Subsectors, Korea: 1962–99 (%)
Subsector 1962–81 1982–90 1991–95 1996–97 1998–99
Total FDI in services (US$ millions) 412.2 1,600.2 2,078.7 2,213.1 6,330.9
Electricity and gas 0 0 26.1 0 378.7Construction 10.4 40.1 21.4 79.8 9.6Wholesale and retail 0 20.1 103.4 586.6 956.7Trading 0.4 55.5 394.7 306.5 336.1Restaurants 0 4.2 60.2 7.1 9.4Hotels 206.0 956.9 362.3 211.4 64.5Transportation 28.7 9.6 9.9 150.2 9.4Financial 109.7 384.9 710.3 480.8 2,292.9Insurance 3.0 77.3 158.0 23.2 407.9Real Estate 0 0 1.8 0.1 33.0Others 53.9 51.4 230.5 367.4 1,832.5
Total FDI into Korea (US$ millions) 1,477.8 4,385.1 5,057.2 5,394.2 15,489.7
Source: Ministry of Commerce, Industry, and Energy, Trends in Foreign Direct Investment(January 31, 2000).Note: Based on actual investment.

vices also increased, from $9.9 million in 1991–95 to $150.2 million in 1996–97. Foreign direct investment in financial services and other services experi-enced a sharp increase after the financial crisis. Foreign direct investment infinancial services increased from $480.8 million in 1996–97 to $2.3 billion in1998–99. The increase in FDI in other services was almost sixfold during thesame period, from $367.4 million in 1996–97 to $1.8 billion in 1998–99.
6.3 The Experience of Liberalization in Distribution Services
In this section, we focus on the distribution sector, which experienced sig-nificant liberalization during the 1990s, to illustrate how liberalization af-fects the productivity of a specific sector.
Distribution services had been one of the least developed sectors in Ko-rea up to the mid-1990s, along with financial services. Mom-and-pop storeshaving fewer than five employees accounted for approximately 80 percentof Korea’s $116 billion retail market in 1996. The productivity of Korea’swholesale and retail service sector, in terms of sales per establishment orsales per employee, was far below that of Japan in 1994 (table 6.5).
We may attribute the low productivity of Korean distribution services tothe regulations on zoning and land development and to the restrictions onFDI. The regulations on zoning and land development reduced the avail-ability of land, limiting the scale of operation, and the restrictions on FDIprevented exposure to foreign best practices.2
However, a remarkable transformation has taken place in Korea’s distri-bution industry since the government lifted some of the restrictions thatkept foreign service suppliers out of the country before 1996 (table 6.6).3 In
184 Jong-Il Kim and June-Dong Kim
Table 6.5 Comparison of Productivity in Distribution Services, Korea and Japan:1994 (US$ thousands)
Wholesale Retail
Korea Japan Korea Japan
Sales per establishment 693 11,724 117.8 935.2Sales per employee 170 1,099 57.8 190.0
Source: National Statistical Office, R.O.K., Annual Report on the Survey of Wholesale and Re-tail Trade as of 1994, and Ministry of Industry and Trade, Japan, Annual Statistical Report ofCommerce in 1994.Note: Applied exchange rates are US 1$ = 716.4 Korean won; US 1$ = 102.18 Japanese yen.
2. In terms of deregulation of zoning, the semiagricultural and forest areas were redefinedto allow retail stores occupying less than 30,000 square meters to be built in 1993. In 1996, largediscount retailers under 10,000 square meters were allowed to do business in the green areas,where development is regulated by the law. The objective was to promote discount stores(Mckinsey 1998).
3. In most of the service subsectors, the Korean government implemented domestic deregula-tion and external liberalization almost simultaneously. It used external commitment to liberaliza-tion in reducing any opposition or resistance to domestic deregulation or implemented domestic

Liberalization and Productivity Growth in Korea 185
Table 6.6 Liberalization of Distribution Services, Korea: 1989–2000
Year Liberalization Measures
1989 Allow FDI in wholesale of medicineExpand permissible imports by branches of foreign companies
1991 Allow FDI in retailing, up to 10 stores of 1,000 m2 or less for each foreign-investedcompany
1993 Expand store and space-related limits to 20 stores of 3,000 m2 or less for eachcompany
1996 Eliminate requirements on the number of stores and space (allowed establishmentof hyper-markets)Liberalize 5 business categories, including commodity chains, and the retailing ofmeat
1997 Liberalize 10 business categories, including general trading and the retailing ofgrain
1998 Abolish economic needs tests on department stores and shopping centersLiberalize operation of gas stations
2000 Allow FDI in the wholesaling of meat
Source: Ministry of Commerce, Industry, and Energy, Department of Distribution.
particular, store and space-related limits on retailing were eliminated forboth domestic and foreign retail firms. As a result, a number of large-sizeddiscount stores or hypermarkets have been established by both domesticand foreign firms since 1996. The total number of hypermarket storesreached 164 in 2000, and almost 30 percent of them have been establishedby foreign firms (table 6.7).
Table 6.7 Trends in the Establishment of Hyper-markets in Korea: 1997–2000
Number of Stores
Name Year of Entrya 1997 1998 1999 2000
Carrefour 1996 3 6 11 20Wal-Mart 1996 4 4 5 10Costco 1998(1994) 2 3 3 5Promodes 1999 — — 2 5Tesco 1999(1997) 1 1 2 7Total for foreign companiesb — 10 14 23 47
(15%) (16%) (20%) (29%)Total for Korean companiesb — 55 74 92 117
(85%) (84%) (80%) (71%)Total — 65 88 115 164
Source: Korean Association of Retailers, Management Revolution in 21st-Century Asian Retail-ing (December 27, 1999).aEntry year of the acquired local company in parentheses.bShares in total number of stores in parentheses.
deregulation to help domestic firms establish market position before foreign penetration. Hence,it is difficult to differentiate the impact of domestic deregulation from external liberalization.

The increasing number of hypermarkets is changing the manufacturer-dominated structure of the Korean retail industry, which had deterred pro-ductivity improvements and price competition. The increased buying powerof the hypermarkets puts price determining in the hands of retailers ratherthan manufacturers, leading to price competition. Foreign retail firms alsotransferred advanced techniques in merchandising and inventory manage-ment as well as new technologies such as point of sales (POS) systems.
Table 6.8 presents the change in number of establishments per 1,000 res-
186 Jong-Il Kim and June-Dong Kim
Table 6.8 Trends in the Sizes of Establishments in Distribution Services, Korea and Japan: 1982–98
Korea Japan
Year Wholesale Retail Wholesale Retail
Number of Establishments per 1000 Residents1982 1.2 13.8 3.3 14.51985 — — 3.1 13.51986 1.7 15.5 — —1988 1.9 16.0 — —1990 2.1 16.6 3.8 12.81992 2.6 16.9 — —1994 2.7 17.0 — —1996 3.2 16.9 — —1998 3.1 15.6 — —
Workers per Establishment1982 3.8 1.7 9.3 3.71985 — — 9.4 3.91986 5.0 1.9 — —1988 5.4 1.9 — —1990 5.5 1.9 — —1992 4.7 1.9 — —1994 5.1 2.0 — —1996 4.3 2.1 — —1998 4.2 2.0 — —
Floor Space per Establishment (m2)1982 — — — 55.41985 — — — 58.01986 — — — —1988 — — — —1990 — — — —1992 75.7 35.6 — —1994 92.7 38.7 — —1996 129.4 45.8 — —1998 136.4 52.8 — —
Sources: The data on Korea are constructed from various issues of the Annual Report on theSurvey of Wholesale and Retail Trade, published by the Korean National Statistical Office. Thedata on Japan are from Ito and Maruyama (1991) and Anwar and Taku (1993).Note: Dashes indicate that data are not available.

idents, workers per establishment, and floor space per establishment since1982. The Korean distribution sector has experienced growth in terms ofnumber of establishments as well as the size of establishments. Particularly,the number of wholesale establishments has grown quickly from 1.2 per1,000 residents in 1982 to 3.1 in 1998. The number of retail stores reached16.6 per 1,000 residents in 1990, far surpassing Japan. Although the Japan-ese distribution sector is accused of inefficiency due to the presence of manysmall establishments, the Korean distribution sector may be regarded asworse, with much smaller establishments in terms of size.4 However, in themid-1990s, the number of establishments in retailing began to decline, whilethe size continued to grow. During this period, the domestic retailing sectorbegan to be exposed to foreign competition as foreign firms started to enterthe market, as shown in table 6.7.
Figure 6.1 decomposes the growth of sales into the growth of the numberof establishments and the growth of sales per establishment. The totalamount of sales has grown steadily except for the period 1996–98, when Ko-rea fell into a severe recession due to the financial crisis. In wholesale ser-vices, the opening of new establishments contributed to the growth of sales.However, in retail services, the growth of sales came largely from the growthof sales per establishment. Particularly, in contrast to the wholesale sector,opening of new retail stores slowed down in the 1990s, and the number ofestablishments even declined from 1996 to 1998.
Figures 6.2 and 6.3 show sales per employee and sales per establish-ment. The sales per employee and sales per establishment, which arewidely used as measures of productivity and efficiency of the distributionsystem, show that the productivity of the Korean distribution sector hascontinually increased over time. Sales per both worker and establishmentincreased notably in 1996, which may be a result of the service liberaliza-tion and resulting FDI inflow. However, we have to wait to see whetherthis trend will continue after the economy recovers from the deep reces-sion of 1998.
Figure 6.4 breaks down the sales per employee of retail stores accordingto their size. It shows that sales per employee of large retail stores, with fiveor more employees, recorded a noticeable increase in 1998, whereas salesper employee of small retail stores, with fewer than five employees, havebeen stagnant since 1996. This may be because liberalization of the retailsector brought about enhanced competition in the large-sized retail storesthrough the establishment of hypermarkets by foreign retailers. The role ofliberalization in enhancing competition may be ascertained by the lowerprice margins of the supermarkets and department stores, from 17.8 per-cent and 24.2 percent in 1995 to 13.6 percent and 21.7 percent in 1998, re-
Liberalization and Productivity Growth in Korea 187
4. For a discussion of the efficiency of the Japanese distribution system, see Ito andMaruyama (1991) and Anwar and Taku (1993).
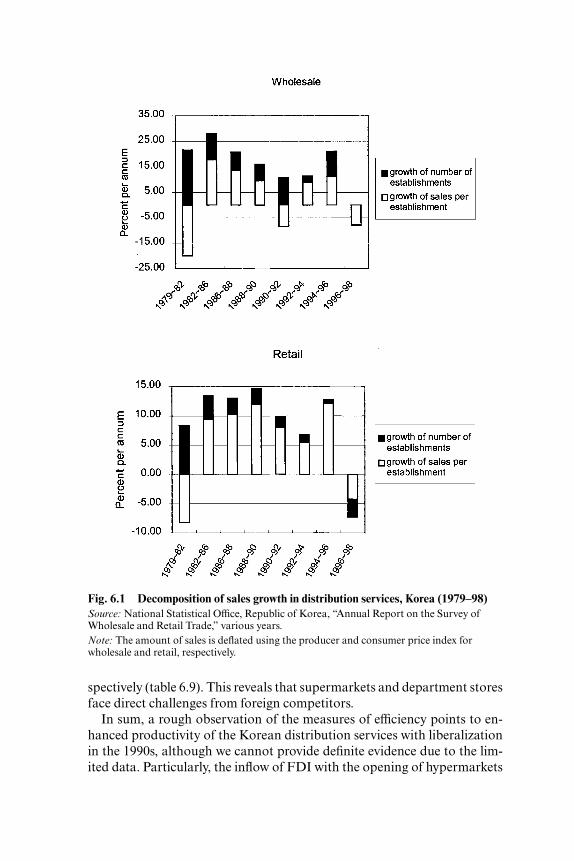
Fig. 6.1 Decomposition of sales growth in distribution services, Korea (1979–98)Source: National Statistical Office, Republic of Korea, “Annual Report on the Survey ofWholesale and Retail Trade,” various years.Note: The amount of sales is deflated using the producer and consumer price index forwholesale and retail, respectively.
spectively (table 6.9). This reveals that supermarkets and department storesface direct challenges from foreign competitors.
In sum, a rough observation of the measures of efficiency points to en-hanced productivity of the Korean distribution services with liberalizationin the 1990s, although we cannot provide definite evidence due to the lim-ited data. Particularly, the inflow of FDI with the opening of hypermarkets

Fig. 6.3 Sales per establishment in distribution services, Korea (1979–98)Source: See figure 6.1 noteNote: See figure 6.1 note
Fig. 6.4 Sales per employee in small and large-sized retail stores, Korea (1989–98)Source: National Statistical Office, Republic of Korea, “Annual Report on the Survey ofWholesale and Retail Trade,” various years.Note: Numbers are millions of won.
Fig. 6.2 Sales per employee in distribution services, Korea (1979–98)

by foreign firms introduced best practices management and challenged do-mestic retail stores. In addition, changing shopping patterns with the intro-duction of discount stores may have forced many small stores to specializetheir services and existing domestic retail firms to enlarge their size to takeadvantage of the scale effect.
6.4 Changes in Productivity Growth Rates5
This section investigates whether the productivity changes in the serviceand manufacturing sectors in the 1990s were associated with services liberal-ization. Even though there are many problems in measuring the output ofservices, we follow the traditional approach by using the value added as themeasure of output. The reason is as follows: first, the production of servicescovers a wide range of heterogeneous activities. As frequently mentioned bymany authors such as Griliches (1992) and Triplett and Bosworth (2000),each service industry contains its own unique problem of measuring output,which makes a treatment applicable to all services almost impossible. Second,recent studies approach the issue with sector-specific data sets by utilizing awide variety of methodologies. Thus, the productivity changes of differentservices calculated in various ways are not directly comparable. Third, unlikemanufacturing, services are considerably backward in the availability of reli-able data, which is particularly the case in Korea. Given the constraints ofdata, we simply utilize the data from national accounts as a last resort.
We first compare the level of labor productivity of the Korean service in-dustry with that of some of the advanced countries. The growth rates of laborproductivity and total factor productivity (TFP) in the Korean service sectorsince 1970 are then examined. Finally, we will try to see whether productivitygrowth in the manufacturing sector is associated with services liberalization.
6.4.1 Sectoral Labor Productivity: An International Comparison
In table 6.10, we compare the levels of labor productivity in Korea withthose of some developed countries in 1990. Labor productivity is calculated
190 Jong-Il Kim and June-Dong Kim
Table 6.9 Price Margin Trends for Supermarkets and Department Stores, Korea:1995–98 (%)
1995 1996 1997 1998 Change in 1995–98
Supermarkets 17.8 16.1 15.0 13.6 –4.2Department stores 24.2 24.8 22.6 21.7 –2.5
Source: Bank of Korea, Impact of Changes in Distribution Structure on Price Levels (26 Janu-ary 2000).
5. The data used for this section are described in the appendix.

as the value added per worker. For the Group of Five (G5) countries, thevalue added is converted, for comparison, by using the 1985 purchasingpower parity exchange rates. Because the purchasing power parity ex-change rate for each sector is not available for Korea, we convert the laborproductivity of Korea by using the average market exchange rate for the pe-riod 1980–90.
Table 6.10 shows that in 1990 the labor productivity of the Korean servicesector, except for “utilities,” was much lower than that of the United States,the European countries, and Japan. The labor productivity of “construction”and “finance, etc.” in Korea was about 40 percent that of the United States.Even worse was the labor productivity of “distribution, etc.” and “social ser-vices, etc.,” which was 18 percent and 15 percent of U.S. levels, respectively.
6.4.2 Productivity Growth in Services
Table 6.11 tabulates the growth rates of labor productivity in the Koreanservice subsectors since 1970. “Finance, etc.,” practically closed to foreignsuppliers until the late 1990s, experienced the worst performance, with neg-ative growth rates in labor productivity throughout the period, except for1985–90. It was during this period that the Korean economy was boomingwith a large trade surplus. However, “distribution, etc.,” which was almostcompletely liberalized in 1996, and “transport and communication,” whichwas partially liberalized in the 1990s, showed increases in labor productiv-ity in the late 1990s, from 5.09 percent and 0.41 percent in 1990–95 to 7.17percent and 1.54 percent in 1995–97, respectively.
Because labor productivity is influenced by the magnitude of capital,which is affected by FDI inflows, we next compare changes in TFP in thesame period.
Total factor productivity is defined as
TFP � �K�L
Y1���
where Y, K, and L are output, capital, and labor inputs, respectively, and �is the elasticity of the production of capital. Thus, TFP growth is calculatedas the residual of output growth net of the weighted growth of factor inputs.The underlying assumption is to use the factor shares in total costs as fac-tor weights under constant returns to scale, Hicks neutral technical pro-gress, and the profit maximization of firms in competitive markets. In ourstudy, we consider two inputs, capital and labor.
It is desirable to adjust capital and labor inputs by their quality mea-sures. However, the data on the quality of inputs at the sectoral level are notavailable. We use gross fixed capital stock for capital inputs and totalemployment for labor inputs. It is also desirable to have actually utilized
Liberalization and Productivity Growth in Korea 191

Tab
le 6
.10
Lab
or P
rodu
ctiv
ity
of S
elec
ted
Cou
ntri
es R
elat
ive
to th
e U
nite
d S
tate
s in
199
0
Tra
nspo
rtat
ion,
Dis
trib
utio
n,F
inan
ce,
Soci
alTo
tal
Cou
ntry
Agr
icul
ture
Min
ing
Man
ufac
turi
ngC
onst
ruct
ion
Uti
litie
sC
omm
unic
atio
net
c.et
c.et
c.E
cono
my
Fra
nce
7431
8286
8473
100
105
130
93W
est G
erm
any
5319
7081
6360
7016
6b17
886
Uni
ted
Kin
gdom
53n.
a.66
9085
5460
257b
8673
Uni
ted
Stat
es10
010
010
010
010
010
010
010
010
010
0Ja
pan
2531
7989
106
5070
a14
878
70K
orea
1610
3442
6823
1840
1526
Sou
rce:
Aut
hors
’ cal
cula
tion
s.N
otes
:“U
tilit
ies”
den
otes
ele
ctri
city
, wat
er, a
nd g
as; “
Dis
trib
utio
n, e
tc.”
den
otes
ret
ail,
who
lesa
le, r
esta
uran
ts, a
nd h
otel
s; “
Fin
ance
, etc
.” d
enot
e fin
ance
, ins
ur-
ance
, rea
l est
ate,
and
bus
ines
s se
rvic
es; “
Soci
al S
ervi
ces,
etc
.” d
enot
es c
omm
unit
y, s
ocia
l, an
d pe
rson
al s
ervi
ces.
a The
figu
re is
for
the
com
pari
son
of r
etai
l and
who
lesa
le tr
ade
only
, exc
ludi
ng r
esta
uran
ts a
nd h
otel
s.bT
he fi
gure
is fo
r th
e co
mpa
riso
n of
fina
nce
and
insu
ranc
e on
ly, e
xclu
ding
rea
l est
ate.

Tab
le 6
.11
Ann
ual A
vera
ge G
row
th R
ates
for
Lab
or P
rodu
ctiv
ity
in S
ervi
ce S
ubse
ctor
s, K
orea
: 197
0–97
(%)
Tra
nspo
rtat
ion,
Dis
trib
utio
n,F
inan
ce,
Soci
alTo
tal
Per
iod
Man
ufac
turi
ngC
onst
ruct
ion
Uti
litie
sC
omm
unic
atio
net
c.et
c.Se
rvic
es, e
tc.
Eco
nom
y
1970
–75
5.62
–4.6
010
.62
11.2
05.
13–2
.45
7.64
5.26
1975
–80
6.06
2.10
12.5
42.
24–2
.87
–6.2
63.
164.
4019
80–8
56.
396.
1615
.95
4.26
3.39
–1.7
07.
656.
9619
85–9
04.
764.
193.
053.
497.
371.
023.
656.
0819
90–9
58.
63–0
.14
9.43
5.09
0.41
–1.0
66.
465.
3419
95–9
79.
871.
486.
327.
171.
54–1
.31
0.57
4.83
1970
–80
5.84
–1.2
511
.58
6.72
1.13
–4.3
65.
404.
8319
80–9
05.
585.
179.
503.
885.
38–0
.34
5.65
6.52
1990
–97
8.98
0.32
8.54
5.68
0.74
–1.0
84.
785.
20
1970
–97
6.56
1.54
10.0
25.
402.
60–2
.02
5.33
5.55
Sou
rce:
Aut
hors
’ cal
cula
tion
s.

input levels by using working hours and utilized capital. However, the dataon hours worked, both for capital and labor, are limited in their use for ourpurposes. Regarding working hours, the published data concern the hourspaid rather than hours actually worked. Also, the capacity utilization rateat the subsector level is not available, particularly for the service sectors.Therefore, due to the failure to allow for cyclical variations in hours workedand capacity utilization, there is a cyclical bias to our measurements of TFPgrowth in the short run. However, this problem is lessened in the long runby the booms’ being offset by recessions.
Table 6.12 shows that similar patterns can be detected for changes in TFP.As was the case for labor productivity, “finance, etc.” recorded negativeTFP growth rates throughout the period, except for 1985–90. “Transportand communications” showed a gain in TFP growth in the late 1990s, from2.2 percent in 1990–95 to 4.12 percent in 1995–97. The trend of TFP growthin “distribution, etc.” also improved in the late 1990s, from –0.41 percent in1990–95 to –0.02 percent in 1995–97.
However, we cannot strictly prove that productivity improvement wascaused by liberalization in services from the trend of labor productivity andTFP growth. As already mentioned, the two measures of efficiency consid-ered above are subject to cyclical fluctuations, and there may be a time lagfor the liberalization measure to take effect in a sector-wide productivitychange. Considering that meaningful liberalization in the Korean servicesectors has only been implemented since the mid-1990s, it may be too earlyto demonstrate any causal relationship between productivity changes andservices liberalization.
6.4.3 Contribution of Services Liberalization to Manufacturing
The hypothesis that liberalization in services may increase the productiv-ity of manufacturing subsectors that use liberalized services as inputs canbe examined by comparing the productivity growth rates of manufacturingsubsectors (table 6.13) and the input coefficients of services to those manu-facturing subsectors (table 6.14).
For “nonmetals,” which had a negative TFP growth rate of –0.06 percentin 1990–97, we can notice that the input coefficient of distribution services,which were liberalized in the 1990s, was 0.018, relatively lower than the in-put coefficients of the other service subsectors. Thus, “nonmetals,” whichuses the liberalized service subsector less intensively, shows poor perfor-mance in terms of TFP growth rates when compared with other manufac-turing subsectors.
However, it seems to be difficult to extract any consistent pattern from thegrowth rates of the TFP in the manufacturing subsectors and the input co-efficients of the service subsectors. In general, the sum of the input coefficientsof services in the manufacturing subsectors is in the range of 0.1 to 0.17,which is not large enough to make a significant impact on their productivity.
194 Jong-Il Kim and June-Dong Kim

Tab
le 6
.12
Ann
ual A
vera
ge G
row
th R
ates
of T
otal
Fac
tor
Pro
duct
ivit
y in
Ser
vice
Sub
sect
ors,
Kor
ea: 1
970–
97 (%
)
Tra
nspo
rtat
ion,
Dis
trib
utio
n,F
inan
ce,
Soci
alSe
rvic
eTo
tal
Per
iod
Man
ufac
turi
ngC
onst
ruct
ion
Uti
litie
sC
omm
unic
atio
n, e
tc.
etc.
etc.
Serv
ices
, etc
.To
tal
Eco
nom
y
1970
–75
3.58
–2.0
47.
526.
634.
16–4
.87
5.32
2.17
1.52
1975
–80
5.23
–0.6
43.
29–0
.58
–3.9
3–5
.60
2.54
–2.3
5–1
.13
1980
–85
5.81
1.81
3.33
–2.2
01.
65–1
.56
7.54
0.77
2.89
1985
–90
2.99
3.39
6.56
1.69
3.95
1.27
2.65
3.20
2.65
1990
–95
4.90
–2.5
22.
392.
20–0
.41
–2.8
24.
44–0
.31
0.99
1995
–97
–0.5
4–0
.01
2.71
4.12
–0.0
2–2
.72
–1.0
4–0
.15
0.71
1970
–80
4.41
–1.3
45.
413.
020.
11–5
.24
3.93
–0.0
90.
2019
80–9
04.
402.
604.
94–0
.25
2.80
–0.1
55.
101.
982.
7719
90–9
73.
35–1
.80
2.48
2.75
–0.3
0–2
.79
2.87
–0.2
60.
91
1970
–97
4.13
0.00
4.47
1.74
1.00
–2.7
24.
090.
631.
34
Sou
rce:
Aut
hors
’ cal
cula
tion
s.

Tab
le 6
.13
Ann
ual A
vera
ge G
row
th R
ates
of T
otal
Fac
tor
Pro
duct
ivit
y in
Man
ufac
turi
ng, K
orea
: 197
0–97
(%)
Man
ufac
turi
ngP
erio
dF
ood
Tex
tile
sW
ood
Pap
erC
hem
ical
sN
onm
etal
sM
etal
sM
achi
nery
Oth
erTo
tal
1970
–75
2.57
8.11
6.04
–1.0
2–1
.42
5.54
23.6
27.
968.
233.
5819
75–8
09.
154.
67–3
.63
5.43
6.31
–0.0
916
.09
2.00
7.52
5.23
1980
–85
1.90
4.02
10.3
28.
373.
384.
649.
908.
697.
515.
8119
85–9
02.
591.
006.
391.
163.
04–2
.00
6.74
2.97
–5.6
12.
9919
90–9
50.
693.
494.
349.
142.
810.
138.
185.
96–2
.24
4.90
1995
–97
0.04
–1.0
22.
66–1
.47
0.65
–0.5
5–0
.13
–1.4
71.
71–0
.54
1970
–80
5.86
6.39
1.20
2.21
2.44
2.73
19.8
54.
987.
884.
4119
80–9
02.
242.
518.
364.
773.
211.
328.
325.
830.
954.
4019
90–9
70.
502.
203.
866.
112.
20–0
.06
5.81
3.84
–1.1
13.
35
1970
–97
3.13
3.87
4.54
4.17
2.66
1.48
11.9
45.
002.
984.
13
Sou
rce:
Aut
hors
’ cal
cula
tion
s.

Tab
le 6
.14
Inpu
t Coe
ffici
ents
for
Sel
ecte
d M
anuf
actu
ring
Sub
sect
ors,
Kor
ea: 1
995
Out
put
Woo
d an
dM
etal
In
put
Foo
dT
exti
les
Pap
erC
hem
ical
sN
onm
etal
sP
rodu
cts
Mac
hine
ryE
lect
roni
cs
Uti
litie
s0.
008
0.01
30.
023
0.02
30.
034
0.01
50.
007
0.00
7C
onst
ruct
ion
0.00
00.
001
0.00
00.
001
0.00
10.
001
0.00
10.
000
Dis
trib
utio
n0.
026
0.02
90.
032
0.02
30.
018
0.02
50.
028
0.02
6R
esta
uran
ts, e
tc.
0.00
00.
000
0.00
00.
000
0.00
00.
000
0.00
00.
000
Tra
nspo
rtat
ion
0.01
30.
011
0.01
90.
014
0.03
80.
013
0.01
30.
010
Com
mun
icat
ions
0.00
10.
002
0.00
30.
002
0.00
50.
002
0.00
20.
003
Fin
anci
al s
ervi
ces
0.01
40.
038
0.03
30.
024
0.02
90.
025
0.02
40.
018
Rea
l est
ate,
etc
.0.
028
0.02
40.
018
0.03
20.
023
0.02
00.
022
0.02
5P
ublic
adm
inis
trat
ion
00
00
00
00
Edu
cati
on, h
ealt
h0.
003
0.00
30.
002
0.01
40.
006
0.00
40.
014
0.03
0So
cial
ser
vice
s0.
000
0.00
10.
001
0.00
10.
001
0.00
10.
001
0.00
1O
ther
ser
vice
s0.
013
0.02
40.
014
0.01
70.
017
0.02
20.
016
0.01
1
Tota
l0.
108
0.14
60.
148
0.15
20.
173
0.12
80.
129
0.13
2(0
.151
)(0
.209
)(0
.209
)(0
.217
)(0
.274
)(0
.191
)(0
.195
)(0
.148
)
Sou
rce:
Ban
k of
Kor
ea, I
nput
/Out
put T
able
s(1
995)
.N
ote:
The
figu
res
in p
aren
thes
es a
re th
e sh
are
of s
ervi
ce in
tota
l int
erm
edia
te in
put.

6.5 Concluding Remarks
Due to industrialization that gave priority to manufacturing at the ex-pense of services, the service sector in Korea was grossly underdevelopedprior to the early 1990s. Numerous sector-specific regulations and restric-tions on FDI prevented competition and impeded the offering of higher-value services. In 1990, the labor productivity of the Korean service sub-sectors was much lower than that of the advanced countries. The laborproductivity of “distribution services, etc.,” in particular, was less than one-fifth that of the United States in 1990.
Since the mid-1990s, the Uruguay Round negotiations and accession tothe OECD enabled the Korean government to gradually open the servicesector to foreign suppliers. The financial crisis of late 1997 resulted in theKorean service sector’s becoming almost completely open, except for a fewareas sensitive to national security, culture, and political stability.
The liberalization of services is presumed to bring productivity gains in theservice sector and also in manufacturing sectors that use liberalized servicesas inputs. In searching for some evidence of this in Korea, we examined thechanges in productivity of the service and manufacturing subsectors in 1970–97. Because liberalization took place in the 1990s and it takes time to see thefull effects of liberalization, it is too early to give a definite answer to whetherliberalization in services has caused an increase in productivity in Korea.However, we see a productivity improvement in such sectors as distributionservices, which had a large inflow of FDI due to liberalization in the 1990s.
Appendix
Sources of Data
The sectors considered were selected on the basis of their availability foroutput and factor use. The sector classification used was the InternationalStandard Industrial Classification System. Output was measured as valueadded in constant prices, the data for which were obtained from the na-tional accounts of Korea collected by the Bank of Korea.
The labor input is measured as total employment. The Annual Report onthe Economically Active Population Survey (AREAPS) provides the dataon total employment. However, AREAPS does not classify most of the ser-vice subsectors for periods earlier than 1991.6 Thus, we computed the ratiofor each service subsector based on the data from the Statistical Yearbookof the International Labor Organization (ILO) and the employment tables
198 Jong-Il Kim and June-Dong Kim
6. The Annual Report on the Economically Active Population Survey currently classifiesservice sectors as electricity, gas, and water; retail and wholesale trade, restaurants, and hotels;transport, storage, and communications; financial institutions, insurance, real estate, andbusiness services; and community, social, and personal services.

of the Bank of Korea and estimated the total employment for each subsec-tor by applying the computed ratio to the total employment of the servicesector of AREAPS.
Capital input is defined as gross fixed capital stock and was computed byapplying the perpetual inventory method (PIM) to the data on the grossfixed capital formation of each industry in constant prices obtained fromthe national accounts. To use the PIM, we need data on benchmark capitalstock and the depreciation rate. However, reliable data on these two vari-ables are not available. Therefore, we extrapolated the gross fixed capitalformation back to 1930 based on the time trend from 1953 to 1960 to avoidthe problem of benchmark capital stock and accumulated the investmentfrom 1930.7 For the depreciation rate for each industry, we used the averagerates of the corresponding Japanese industries, calculated from the Inter-national Sectoral Database (ISDB) published by the OECD, under the as-sumption that the structure of the Korean economy is most similar to Japanamong the developed countries covered by the ISDB.
Finally, to compute the TFP, we need data on the share of labor in valueadded. The labor share is calculated by dividing the compensation of laborby value added. Because the data on the compensation of employees fromthe national accounts do not include the compensation of self-employed la-bor, we adjusted the compensation of employees under the assumption thatthe compensation of the self-employed is comparable to that of the em-ployed. That is,
The share of labor in value added � (compensation of employees
� [compensation of employees/total employees]
� [total employment � total employees])/value added.
The data on the compensation of employees and current value added aretaken from the National Accounts. The number of total employees is takenfrom the ILO Statistical Yearbook and the employment tables of the Bankof Korea. The share of agriculture and fisheries; community, social, andpersonal services; retail and wholesale trade; and restaurants and hotels,computed as above, are too high. The employment in these industries showsthat a large proportion of unpaid family workers may be underemployed.Thus, when comparing them with some of the advanced countries from theISDB, we assumed that the unpaid workers were compensated at half therate of paid workers. After adjustment, the shares of labor in value addedfor these industries were comparable to the estimate of Kim and Park(1985).
Finally, the data on some of the advanced countries used for internationalcomparison were taken from the ISDB of the OECD, which provides sec-toral output and input data of OECD countries from 1970 to 1990.
Liberalization and Productivity Growth in Korea 199
7. We assumed the investment to be zero between 1950 and 1952 during the Korean War.

Table 6A.1 Service Subsectors in which FDI is Restricted (as of January 1990)
Wholly Restricted Partially Restricted
Production, collection and distribution of electricity
Publishing (newspapers, periodicals and books)Collection, purification and distribution of
waterDrinking establishmentsTransport via railwaysScheduled air transportNonscheduled air transportPost and courier activitiesTelecommunicationsNews agency activitiesRadio and television broadcastingGambling
Source: Ministry of Finance and Economy, Five-Year Foreign Investment Liberalization Plan (variousyears)Note: In KSIC three-digit level.
Wholesale of agricultural raw materials, liveanimals, food, beverages and tobacco
Wholesale of household goods (medical goodsand cosmetics)
Wholesale of nonagricultural intermediateproducts, waste and scrap (fertilizers)
Other wholesale (foreign trade brokers)Retail sale of food, beverages and tobacco in
specialized storesOther retail trade of new goods in specialized
storesLand transportSea and coastal water transportInland water transportTravel agenciesGeneral financial intermediation (banking)Other financial intermediation (investment, trust,
securities)Insurance and pension fundingReal estate rental and developmentRenting of other machinery and equipment
(construction equipment)Research and experimental development on
social sciences and humanitiesLegal, accounting, bookkeeping and auditing
activities; tax consultancy; market research andpublic opinion polling; business andmanagement consultancy
AdvertisingOther business services (personnel supply
services, investigation and security activities)Adult and other education (vocational training
schools, etc.)Human health activitiesVeterinary activitiesMotion pictures and other entertainment
activitiesLibraries, archives, museums and other cultural
activitiesSporting and other recreational activitiesOther service activities (barber and beauty shops,
wedding chapels, etc.)Other recreational activities (parks, beaches, etc.)Personal services (tutoring, housekeeping, etc.)

References
Anwar, Syed Tariq, and Michael A. Taku. 1993. Productivity and efficiency in theJapanese distribution system: A review and developments. Journal of World Trade27:83–110.
Blomstrom, Magnus, and Hakan Persson. 1983. Foreign investment and spilloverefficiency in an underdeveloped economy: Evidence from the Mexican manufac-turing industry. World Development 11:493–501.
Borensztein, E., J. de Gregorio, and J. W. Lee. 1998. How does foreign direct invest-ment affect economic growth? Journal of International Economics 45:115–35.
Caves, Richard E. 1974. Multinational firms, competition, and productivity in host-country markets. Economica 41:176–93.
Chung, W., W. Mitchell, and Bernard Yeung. 1994. Foreign direct investment andhost country productivity: The case of the American automotive components in-dustry. Discussion Paper no. 367. University of Michigan, Institute of Public Pol-icy Studies.
Globerman, Steve. 1979. Foreign direct investment and “spillover” efficiency bene-fits in Canadian manufacturing industries. Canadian Journal of Economics 12:42–56.
Griliches, Zvi. 1992. Introduction. In Output measurement in the service sectors, ed.Zvi Griliches, Chicago: University of Chicago Press.
Ito, Takatoshi, and Masayoshi Maruyama. 1991. Is the Japanese distribution sys-
Liberalization and Productivity Growth in Korea 201
Table 6A.2 Service Subsectors in which FDI is Restricted (as of November 1997)
Wholly Restricted Partially Restricted
Collection, purification and distribution of Wholesale of agricultural raw materials, live water animals, food, beverages and tobacco
News agency activities (meat)Radio and television broadcasting Production, collection and distribution of Gambling electricity
Publishing (newspapers, periodical and books)
Other retail trade of new goods in specialized stores (gas stations)
Land transportSea and coastal water transportScheduled air transportNonscheduled air transportTelecommunicationsGeneral financial intermediation (banking)Other financial intermediation (investment,
trust, securities)Insurance and pension fundingReal estate rental and developmentCredit information agency
Source: Ministry of Finance and Economy, Five-Year Foreign Investment Liberalization Plan(various years).Note: In KSCI three-digit level.

tem really inefficient? In Trade with Japan, ed. Paul Krugman, Chicago: Univer-sity of Chicago Press.
Kim, J.-D., and S.-I. Hwang. 2000. The role of foreign direct investment in Korea’seconomic development: Productivity effects and implications for the currency cri-sis. In The role of foreign direct investment in East Asian economic development, ed.Anne O. Krueger and Takatoshi Ito, 267–94. Chicago: University of ChicagoPress.
Kim, K.-S., and J.-K. Park. 1985. Sources of economic growth in Korea: 1963–1982.Seoul: Korea Development Institute.
Markusen, James R. 1989. Trade in producer services and in other specialized in-termediate inputs. American Economic Review 79:85–95.
McKinsey Global Institute. 1998. Productivity-led growth for Korea. Washington,D.C.: McKinsey Global Institute.
Nickell, Stephen J. 1996. Competition and corporate performance. Journal of Polit-ical Economy 104:724–46.
Rivera-Batiz, Francisco L., and Luis A. Rivera-Batiz. 1992. Europe 1992 and theliberalization of direct investment flows: Services versus manufacturing. Interna-tional Economic Journal 6:45–57.
Triplett, Jack E., and Barry P. Bosworth. 2000. Productivity in the service sector.Washington, D.C.: Brookings Institution. Manuscript.
Comment Kazumasa Iwata
The paper investigates the impacts of service liberalization, notably estab-lishment trade through commercial presence, on productivity in Korea.The authors found it premature to show empirical evidence on an increasein productivity. They argue, however, that competition is enhanced, notablyin the distribution sector, which may lead to an increase in productivity.
The liberalization of services trade may increase productivity through anumber of channels. First, the establishment trade via commercial presencebrings about an increase in production and in management know-how andimparts a productivity spillover effect to the economy.
Second, the improved quality and diversified service with lower prices asintermediate inputs (both embodied and disembodied) may improve theproductivity of the manufacturing sector. This constitutes the major sourceof benefit of developing countries that have a comparative disadvantage inservice trade.
Third, the liberalization of trade in services may enhance competition.This implies that trade liberalization affects the market structure in an econ-omy. Although it does not exclude the case of foreign monopoly, the Koreaneconomy seems to prove that the domestic economy is large enough to per-mit the commercial presence of foreign firms. We should recall that some
202 Jong-Il Kim and June-Dong Kim
Kazumasa Iwata is a professor of economics at the University of Tokyo.

developing economies have employed trade restriction as the imperfect sub-stitute for antimonopoly law.
Fourth, the transmission of advanced knowledge through the joint re-search and development and provision of licenses constitutes the channel-of-productivity increase.
It is interesting to observe that in the case of Korea the establishmenttrade in services has accelerated after the financial crisis, despite the factthat the massive inflow and subsequent outflow of capital disrupted the fi-nancial market. It seems important to pay due attention to the fact that thefinancial liberalization has been accompanied by over-investment by nonfi-nancial firms and constituted the precondition to financial crisis. The ab-sence of appropriate prudential policy on financial institutions’ financialtrade liberalization may have had a destabilizing effect on the economy. Thefinancial disruption seemed to work to deepen the recession.
Table 6.9 provides an international comparison of sectoral labor produc-tivity in 1990, whereas table 6.11 provides an interesting result on changesin total factor productivity (TFP). It indicates an improvement of produc-tivity in the service sector, notably in the transport and communication sec-tor, in 1995–97, despite the recession. However, it is somewhat puzzling thatproductivity in the financial sector registered a negative rate of increase fora long period of time, from 1970 to 1997. Further, I find it difficult to acceptthe statement that the distribution sector shows an improvement in pro-ductivity when I look at tables 6.10 and 6.11; the negative TFP growth isrecorded in 1995–97. In contrast, figure 6.1 points to an increase in sales peremployee, but it is not clear whether it implies a productivity gain. It seemsnecessary to provide additional evidence to confirm the productivity im-provement in the distribution sector after 1996.
My first comment is whether the productivity gain is attributable solelyto foreign direct investment. I suspect that domestic regulatory reform inthe communication sector, in addition to the distribution sector, may haveplayed an important role in increasing the productivity of almost all servicesectors. Liberalization of trade in service often takes place simultaneouslywith domestic regulatory reform. Both promote competition and efficiencyin an economy. It is important to discriminate between the effects of reduc-tion in the domestic distortion and in the external distortion. Apparently,services trade liberalization deals with the latter. It seems possible to trun-cate the impact by employing some econometric methods, although note 2mentions that it is difficult to differentiate between the impacts of domesticderegulation and external liberalization.
For instance, it may be useful to apply the tariffication to trade in ser-vices, as argued by Deardorff (2000), or develop the tax-equivalent mea-sures in assessing external distortion, such as the exercise carried out by theAustralian Productivity Council.
Liberalization and Productivity Growth in Korea 203

My second comment is a question as to whether the observed productiv-ity gain is due to the expansion of the production frontier or the shift of theproduction point inside the existing production frontier to the more effi-cient point.
Foreign direct investment (FDI) implies an increase in capital accumula-tion, coupled with transfer of management and reduction in external dis-tortion, whereas domestic deregulation simply removes barriers and re-duces domestic distortion. Thus, the increase in FDI is accompanied by theexpansion of production frontiers into the direction that the Rybczynskitheorem predicts. The lack of appropriate data may prevent judgment.However, it may be useful to delineate the difference, at least conceptually,because it relates to the issue on the order of liberalization, notably with re-spect to financial liberalization.
Third, I would like to know why the intermediate service inputs in totalintermediate inputs take on such a small share (0.15–0.17) in intermediateinputs of the Korean manufacturing sector. In Japan the share ranges from0.28 to 0.3 in 1995, whereas in the United States it is 0.32 in 1990. As isshown by the simulation results in a paper presented at this conference byKun-Ming Chen and others (chap. 4 in this volume), the service inputs areimportant not only for the development of the service sector but also forstrengthening the competitiveness of the manufacturing sector. The smallershare of intermediate service inputs implies a smaller impact (about half) ofliberalization of trade in services in the case of Korea, as compared withother countries, such as Japan and the United States.
Fourth, the paper primarily concerns productivity. However, the benefitfor consumers appears mainly through price reduction and diversificationof services. The price differential between home and abroad and the com-parison of cost structures provide additional information on domestic andexternal distortion. It may be promising to employ cost function, instead ofproduction function, in continuing the analysis on changes in consumerwelfare by the liberalization of trade in services.
Fifth, despite the difficulty in the case of abnormal shocks like financialcrises, it still seems important to make some cyclical adjustment to the la-bor and total productivity changes, in order to assess the impact of liberal-ization.
Finally, with respect to productivity changes in distribution sector, I findit more important to pay attention to the impact of information andtelecommunication innovation due to the regulatory reform; it contributesto the expansion of production frontier due to the new innovation and thenetwork externality effect. It may be noted that in the case of Japan the largeretail stores like Ito-Yokado intend to make new entry into banking busi-ness specializing in payment services by utilizing both the physical and vir-tual networks. Conversely, many banks attempt to enclose networks of con-
204 Jong-Il Kim and June-Dong Kim

venience stores. This attempt can enhance competition and bring about anincrease in productivity in financial service.
Reference
Deardorff, A. V. 2000. Tariffication of services. Paper presented at the conferenceorganized by Keio University. 19 May.
Comment Mahani Zainal-Abidin
The paper shows that Korea’s service sector liberalization began in the early1990s with its commitment to the Uruguay Round negotiation and latermembership to the Organization for Economic Cooperation and Develop-ment (OECD). The pace of liberalization was further accelerated during theEast Asian Crisis, and by May 2000 only very few service industries had to-tal or partial restrictions (see table 6.2).
The paper suggests that liberalization of Korea’s service sector, which al-lows for greater participation of foreign direct investment (FDI), will im-prove productivity of liberalized service subsectors as well as of the manu-facturing sector that uses the services of these subsectors.
My comments are as follows.First, the main channel for productivity improvement put forward in this
paper is through higher participation of FDI that can inject technologytransfer and overcome economies of scale constraints. Increasing foreignparticipation is one form of service sector liberalization. An equally impor-tant form of liberalization concerns domestic service producers, namely,the lowering of barriers to domestic producers through deregulation anddismantling of regulatory impediments. These may take the form of what iscalled in Kim’s paper barriers to ongoing operation or barriers that are de-signed to protect incumbent firms.
The paper should describe more the measures of liberalization for do-mestic service producers—for example, to what extent the Korean servicesliberalization has removed entry and competition barriers. In other words,to what extent is productivity improvement in the service subsector due tothe removal of barriers to ongoing operation of domestic services providersvis-à-vis increased FDI participation?
For example, in Malaysia, productivity gains in service subsectors suchas telecommunications are substantially caused by deregulation of domes-
Liberalization and Productivity Growth in Korea 205
Mahani Zainal-Abidin is professor of applied economics at the University of Malaya.

tic industries through increasing the number of participants and competi-tion in the industry.
Another form of services liberalization is through privatization. Most ofthe services industries are publicly owned, and privatization of these activ-ities since the late 1980s has allowed these services to be managed in a moreefficient manner and has made cost and quality of service key in evaluatingtheir performance. As a result, there was a marked increase in the produc-tivity of these privatized services. For example, parts of the health, educa-tion, and water sectors have been privatized, and the ensuing higher pro-ductivity has benefited consumers and has attracted investments in thesesectors.
Second, I would like to comment on the calculation of service subsectorproductivity.
The key problem in calculating service productivity is in determining asuitable measure of output over time. This is complicated by two factors:a) market prices may not be observable for publicly provided services, andb) it is often difficult to identify precisely what constitutes a service activityin a particular industry and to account correctly for quality changes in ser-vices.
The measurement of output requires identifying whether the output con-sists of the transaction performed or the outcome achieved through the ser-vice. A case in point is the finance subsector. The subsector experiencednegative growth rates in labor productivity throughout the 1970–97 period,except for 1985–90. The period 1985–90, in which productivity rose sub-stantially, was when the Korean economy boomed following the 1988Olympic games. Thus, the increase in output of finance subsector was dueto bigger transaction volume and not improvement in services. Further, thefinance sector offers a variety of activities that may increase its output (rev-enue) by expanding the scope of financial transactions, and this higher rev-enue may not come from improvement in service.
The measurement difficulties are further aggravated by contributionsmade by technology. In some services, such as distribution, telecommuni-cation, and parts of the financial service industry, technological change hasstrongly affected the production process and the organization of produc-tion. This has contributed to significant improvements in productivity, butthis may not always be easy to measure.
To overcome these measurement problems, some studies have used thegrowth rate of capital as a proxy for services output growth.
Third, I would like to comment on the contribution of services liberal-ization to the manufacturing sector.
The paper has produced two interesting tables: table 6.8, on annual aver-age growth rates of total factor productivity in the manufacturing sector,and table 6.9, on input coefficients for selected manufacturing subsectors.As contended by the paper, liberalization in service subsectors will benefit
206 Jong-Il Kim and June-Dong Kim

the manufacturing industries that use the services of these subsectorsthrough productivity improvements. The paper should explore and formal-ize these links. These two tables have given the authors a good start, and thiswork should be expanded to capture the links between service subsectorsand manufacturing industries.
Finally, the authors should be commended for initiating a study to esti-mate productivity improvements in the service sectors, especially for thedistribution industry.
Liberalization and Productivity Growth in Korea 207


