Liar Liar, Pants on Fire! A Physiological Study of …jass.neuro.wisc.edu/2011/01/Liar Liar, Pants...
24
Liar Liar, Pants on Fire! A Physiological Study of Deception Lauren Engler; Whitney Lloyd; Jo Martin-Koob; Sawyer Naze Lab 602, Group 10 May 5, 2011 Abstract From 2002 to 2005, the United States Department of Justice utilized the polygraph test 49,000 times. While not typically permissible in court, the results of a polygraph test can impact everything from individual employment opportunities to national security issues and thus, it is important to understand the advantages and limitations of the polygraph test. This experiment examined the ease of which a college-aged individual can thwart a polygraph test by manipulating his or her rate of respiration by controlling breathing or by increasing his or her body temperature though the use of heat packs and insulating clothing. Results were obtained by measuring heart rate, galvanic skin response (GSR) and rate of respiration using the iWorx Program. The data collected from the two experimental groups was compared to a control group where the participants were not provided with any strategies to beat the polygraph test. The analysis of respiration and GSR data of the control group showed no significant difference between truthful and untruthful responses measured by iWorx. Analysis of the heart rate data showed a significant difference between the truthful and untruthful responses from the control group, while it showed no significant difference for the experimental groups. Due to these results, the manipulations of respiration rate and body temperature were unable to be confirmed as effective methods to beat a polygraph. Further experimentation with larger sample sizes, more sensitive equipment and different methods of analysis might provide more conclusive findings. Introduction From 2002 to 2005, the United States Department of Justice utilized the polygraph test 49,000 times. The use of the test ranged from making pre-employment decisions and personnel security decisions to counterintelligence and counterterrorism investigations. 1 While the results of the polygraph test are typically not permissible in court, the results of polygraph tests clearly impact both individual employment opportunities as well as
Transcript of Liar Liar, Pants on Fire! A Physiological Study of …jass.neuro.wisc.edu/2011/01/Liar Liar, Pants...
Liar Liar, Pants on Fire! A Physiological Study of Deception
Lauren Engler; Whitney Lloyd; Jo Martin-Koob; Sawyer Naze
Lab 602, Group 10
May 5, 2011
Abstract
From 2002 to 2005, the United States Department of Justice utilized the polygraph
test 49,000 times. While not typically permissible in court, the results of a polygraph test
can impact everything from individual employment opportunities to national security
issues and thus, it is important to understand the advantages and limitations of the
polygraph test. This experiment examined the ease of which a college-aged individual can
thwart a polygraph test by manipulating his or her rate of respiration by controlling
breathing or by increasing his or her body temperature though the use of heat packs and
insulating clothing. Results were obtained by measuring heart rate, galvanic skin response
(GSR) and rate of respiration using the iWorx Program. The data collected from the two
experimental groups was compared to a control group where the participants were not
provided with any strategies to beat the polygraph test. The analysis of respiration and GSR
data of the control group showed no significant difference between truthful and untruthful
responses measured by iWorx. Analysis of the heart rate data showed a significant
difference between the truthful and untruthful responses from the control group, while it
showed no significant difference for the experimental groups. Due to these results, the
manipulations of respiration rate and body temperature were unable to be confirmed as
effective methods to beat a polygraph. Further experimentation with larger sample sizes,
more sensitive equipment and different methods of analysis might provide more
conclusive findings.
Introduction
From 2002 to 2005, the United States Department of Justice utilized the polygraph
test 49,000 times. The use of the test ranged from making pre-employment decisions and
personnel security decisions to counterintelligence and counterterrorism investigations.1
While the results of the polygraph test are typically not permissible in court, the results of
polygraph tests clearly impact both individual employment opportunities as well as

national security precautions. Thus, it is important to understand the advantages and limits
of the polygraph test.
A polygraph measures heart rate, respiration and Galvanic Skin Response (GSR).
These physiological measurements are largely controlled by the sympathetic branch of the
autonomic nervous system. When an environmental stressor is experienced the fight-or-
flight response is induced and catecholamines are released from the adrenal gland to
stimulate an appropriate physiological response. Theoretically, the heart rate, respiration,
and GSR response of the individual should increase when they are lying as compared to
when they are telling the truth, because the sympathetic nervous system is not consciously
controlled. A main assumption of the polygraph test is that changes in emotional state will
elicit a change in autonomic response.2
A baseline is obtained by asking an individual questions that are intended to
provoke a typical autonomic response for the particular participant. These questions
should be general enough that the administrator of the test can easily determine if the
person is lying (“Are you human?”, “Have you ever lied to someone?”). By creating a
baseline measurement of normal autonomic activity, deviations in physiologic response
during the test can be used to indicate when an individual is not being truthful.
Heart rate is defined as the number of beats per unit time, which is typically
recorded as beats per minute (bpm). When a stressor is encountered, the cardiac output
increases from around one gallon per minute to up to five gallons per minute.3 Although
SNS control of heart rate is largely involuntary, speculations have been made that there
may be ways to affect your own heart rate.4,5

One technique that may influence heart rate is the conscious control of respiration.
Respiration rate is defined as the number of breaths an individual takes in a given time
period. The increased blood flow induced by a sympathetic response leads to an increased
respiratory rate to maintain the O2 and CO2 equilibrium throughout the body.6 This
function is controlled in the medulla, which evaluates the amount of O2 consumed and CO2
produced by the tissues with the amount of O2 intake and CO2 expulsion of the lungs.7
Galvanic Skin Response measures the changes in conductance produced by sweat
glands, particularly in the palms and the soles of the feet. These sweat glands act as
“variable resistors” whose resistance can be measured when a small electrical impulse of
known voltage is sent through the skin of the subject. As the sweat ducts in the palms fill
with sweat their resistance decreases eliciting a spike in the conductance reading. The
amount of sweat in the gland is a response to the novelty, intensity and emotional
significance of environmental stimuli and is triggered when the sympathetic branch of the
autonomic nervous system releases acetylcholine onto the pathways that increases the
amount of sweat in the sweat glands. If a subject is lying, the GSR response should increase
as his or her sweat glands fill, decreasing the resistance. It is important to keep in mind
that random natural spikes in resistance occur one to three times per minute (Figure 1).8
Figure 1. Example of a GSR trace
showing natural and stress induced
spikes. The peak to the left of the
blue line shows a GSR response due
to lying. To the right of the blue line,
the trace displays the natural
variations that occur during a GSR
measurement.

In order to gain an appreciation as to the efficacy of the ‘lie-detector’ test, we have
decided to explore how easily the polygraph can be beaten when individuals are provided
with information about the test prior to administration of the polygraph. This is an area of
research that has not been previously pursued and there is a lack of relevant literature
regarding polygraphs tests and techniques to beat them. This study examines if it is
possible for an individual to beat a polygraph test and tell a lie without displaying the
expected physiological indicators when he/she is informed of the physiological responses
that are assessed during a polygraph test and is provided with strategies to control these
responses prior to undergoing the test.
Material and Methods
Fifteen individuals currently enrolled at the University of Wisconsin-Madison
voluntarily participated in the project. Each reported he or she had no prior experience
with polygraph examinations.
Each participant was presented with the fictitious situation that he or she had stolen
money from an unoccupied office in the building; however no one had witnessed him or
her commit the crime (see Appendix A). The participant was then given a twenty-dollar bill
to keep in his/her pocket that represented the stolen money. The individual was
instructed to deny any involvement and claim he or she had no knowledge of the situation
during a polygraph test. Furthermore, he or she was instructed to provide truthful
responses to all other questions unrelated to the burglary posed during the test. The
control group received no further instruction and was immediately tested. The other three
groups were provided with possible techniques to attempt to thwart the polygraph

machine. The first group was instructed to concentrate on breathing in order to maintain a
constant respiration rate throughout the entire exam. The second group of participants
was given heat packs to raise their body temperature and increase sweat production.
The polygraph administrator was blinded to the experimental method. Each
individual was asked the same set of 22 questions with five pertaining to the stolen money
(see Appendix B). The test was performed in a small, windowless room with minimal
distractions and noise.
The three physiological factors used by the polygraph machine were galvanic skin
conductance (GSR), respirations, and heart rate. A GSR-200 Galvanic skin response
amplifier (iWorx Systems Inc., Dover, NH) was used to measure the skin conductance. A
RM-204 respiration monitor and C-AAMI-504 ECG electrodes (iWorx) were also used to
monitor respirations and heart rate, respectively. Two ECG electrodes were positioned on
each side of the participant’s chest, just beneath the collarbone. A reference electrode was
placed on the right ankle. Data was collected using the IWX/214 data acquisition unit
(iWorx) and was formatted and analyzed using LabScribe (iWorx). Equipment setup and
calibration are thoroughly described in literature provided by iWorx Systems and will not
be discussed here.8
Analysis was performed on the responses to questions 3, 5, 11, 12, and 21 for which
the subjects were instructed to be truthful and the responses to questions 6, 9, 14, 19, and
22 for which the subject was instructed to lie. As each individual had a different
physiological response time for each question, the analysis window was standardized by
measuring each physiological factor (heart rate, respirations, and GSR) from the time a
question was asked until the GSR recording stabilized at a constant value. Heart rate was

determined using the number of beats that occurred within this time period and the
number of inhalations within this window was used to calculate respiratory rate. The area
under the curve of respiration was measured to obtain the depth of respiration for each
subject. Peak GSR height was calculated using the maximum voltage deviation from the
baseline value. The area under the GSR curve was also measured. (See Appendix C for
example data traces). Averages and standard deviations were calculated for each
individual. Truthful responses were compared to the untruthful responses using a paired
t-test. Statistical significance was set at the level of 0.05.
Results
The average heart rate values for truthful and untruthful responses of the control
group, controlled respirations group, and elevated temperature group are depicted in
Figure 2. Individual p-values comparing truthful versus untruthful responses for heart rate
are also shown. For supplementary data see Appendix D, part a.
Data for respiration rate and respiration depth was also obtained for truthful and
untruthful responses of the control group, controlled respirations group, and elevated

temperature group. The respiration rate data and respective p-values are shown in Figure
3. The respiration depth data and respective p-values are depicted in Figure 4. For
supplementary data see Appendix D, parts b and c.
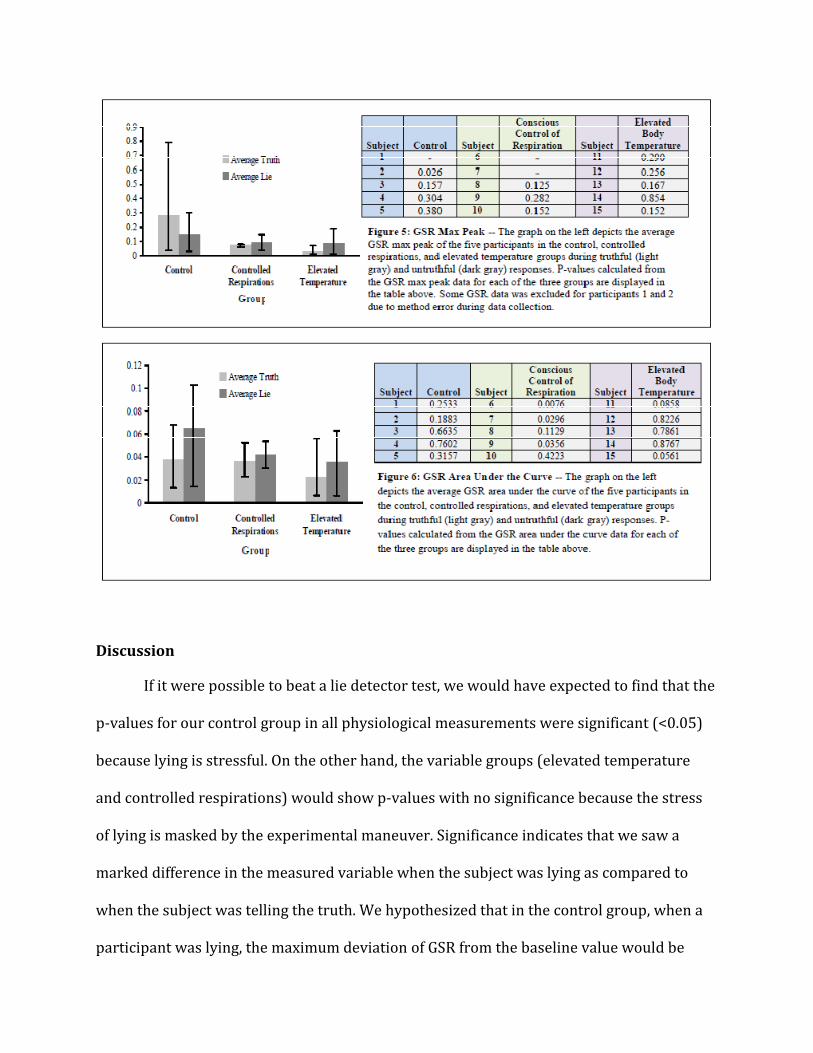
Data for maximum GSR deviation from baseline and GSR area under the curve was
also obtained for each experimental group. The maximum GSR deviation from baseline and
respective p-values are depicted in Figure 5. The GSR area under the curve data and
respective p-values are depicted in Figure 6. For supplementary data see Appendix D, parts
d and e.
Discussion
If it were possible to beat a lie detector test, we would have expected to find that the
p-values for our control group in all physiological measurements were significant (<0.05)
because lying is stressful. On the other hand, the variable groups (elevated temperature
and controlled respirations) would show p-values with no significance because the stress
of lying is masked by the experimental maneuver. Significance indicates that we saw a
marked difference in the measured variable when the subject was lying as compared to
when the subject was telling the truth. We hypothesized that in the control group, when a
participant was lying, the maximum deviation of GSR from the baseline value would be

larger than if the participant was being truthful. We also hypothesized that their average
heart rate and rate of respiration would increase if they were lying; their depth of
respiration would thus be decreased due to increased frequency of respirations. If the
manipulation of these variables using breathing control and heat pads was a successful way
to beat the lie detector test, we would expect the p-values of these two data sets to be
insignificant.
For the control group, heart rate provided a consistent measurement to determine if
the subject was telling the truth. There was a regular and significant increase in heart rate
when the participant provided an untruthful response. This displays the sympathetic
response of each subject to the stress presented by lying. Catecholamines, such as
adrenaline, are released during this stress response and increased the heart rate. While
four of the five p-values in this group were below 0.05, the remaining value for subject 2
was 0.0901. However, for this individual, the GSR was not allowed to return to baseline
before the next question was asked, which affected the analysis window in which the heart
rate was determined. Using these data, the iWorx system effectively distinguished the
heart rate during an untruthful response from that obtained during a truthful response
95% of the time.
In the group that controlled respirations, heart rate was not significantly different
between truthful and untruthful responses. By controlling breathing rate, participants
were able to maintain a consistent heart rate, even when telling a lie. The p-values for
these individuals were all greater than 0.10, indicating the iWorx system was unable to
distinguish between a truth and a lie when the person was controlling his/her respirations.

While consciously slowing one’s heart rate is more involved than merely controlling
respiration rate, by concentrating on breathing the subject can influence the stimulation of
the parasympathetic nervous system, which helps to minimize the effects of the
sympathetic nervous system when presented with a stressor.
With the group that was given heat packs to raise their body temperature, there was
no significant difference in heart rate between truthful and untruthful responses. The p-
values were all greater than 0.30, meaning the heart rates were very similar for each
response type. When the subject was given heat packs to increase their body temperature,
the iWorx system was unable to be used effectively to discern when an individual was
lying. Vasodilation is an important thermoregulation mechanism of the body to decrease
body temperature. When the vessels dilate, the heart beats faster in an attempt to maintain
blood pressure. Given the data, using heat packs affected the resting heart rate enough to
mask the effect of the sympathetic response while lying.
Our data analysis of the respiration and GSR measurements did not confirm our
hypothesis. Overall, p-values for all three participant groups were not significant, meaning
it was not possible for us to tell the difference between the truth and a lie based on either
respiration or GSR data. No p-values within the respiration data set were significant.
Within the GSR data set, only two p-values were significant (Control Subject #2: p = 0.0263
and Heat Subject #15: p = 0.0276).
No significant findings were obtained regarding alterations in respiration frequency
or depth while lying. Thus, no conclusive results can be drawn as to the effectiveness of
controlling rate of respiration in order to beat a polygraph test. The insignificant p-values

of the control group indicate that even when respiration was not consciously controlled, it
was not a good indication of whether or not a participant was lying.
No conclusive results were obtained from the GSR data. Not only did we find no
significance when analyzing maximum GSR peak, we also found no significance when
analyzing area under the GSR curve. This measurement was intended to determine if the
GSR took longer to reach baseline when someone was lying. It is difficult to draw definitive
conclusions from the GSR data because there is a lot of variation in GSR spikes not only
from participant to participant, but also within individual responses to the questions asked
of each participant. This might be eliminated if a larger sample size of questions and/or a
larger sample of participants were analyzed. It is also difficult to say whether or not our
GSR measurements were an accurate representation of truth versus lies because GSR
spikes also occur naturally (refer to Figure 1), and it is often challenging to differentiate a
natural spike in GSR from a spike caused by a physiological response to lying. It would be
beneficial to investigate if there are other ways this data can be analyzed that may give rise
to different results.
A selected amount of GSR data was excluded due to experimenter error. When
carrying out the first four trials, the interviewer did not allow sufficient time after each
question for the GSR measurement to return to baseline. Thus, it was not possible to obtain
an accurate analysis of GSR data for these participants because there was no baseline value
to compare to the peak height. GSR data for the first three participants was completely
excluded. For the fourth participant, GSR data was able to be analyzed for six questions;
however, the other four questions could not be analyzed because the measurement did not

return to baseline. All data for the remaining participants was able to be utilized because
ample time was allowed for the GSR to return to baseline between each question.
There are several factors regarding the experimental subject group that affect the
ability of the results obtained to be generalized. The results are subject to selection bias
due to the non-random recruitment of participants. All participants were college students
between ages the ages of eighteen and twenty-three. This absence of considerable
demographic variation amongst our participants limits the extent to which the results can
be generalized to the entire population. In addition, the number of participants interviewed
was fewer than anticipated due to time constraints; the overall sample size consisted of
fifteen participants. A larger sample size would give more statistically relevant results and
decrease variation seen within the data. The consequence of selection bias and a limited
sample size is that the results may not be indicative of the population as a whole. These
issues decrease the external validity of the experiment.
Various experimental procedures used also limit the internal validity of the results.
In some instances the participant was a friend or acquaintance of the interviewer. A
personal relationship with the interviewer could potentially have a calming or distressing
effect on the physiological state of the participant. The existence of a relationship between
interviewer and interviewee would then give rise to inconsistent data when compared to
the absence of any relationship. Therefore, the data obtained from these participants may
be skewed. In addition, two of the researchers conducted interviews with participants
rather than one as was originally planned. The inconsistency in the individual asking the

questions could also lead to biased results due to differences amongst the interviewers and
the way the interviews were conducted.
Measures were taken to ensure minimal distraction of the participant during testing.
No one was present in the room during the questioning aside from the interviewer and
participant. The interviewer was prevented from knowing the experimental condition of
each individual; the execution of a blind experiment works to limit unconscious bias on
behalf of the interviewer.
In order to increase the validity of the results obtained, this experimental procedure
could be repeated with some alterations. In order to reduce selection bias, participants
would be randomly chosen. Ideally, the subject group would consist of a large number of
participants with significant variability in demographic background. Using the same
interviewer for the testing of each participant would provide more consistency as well. If
the experiment were repeated, a greater time investment would be made in choosing the
appropriate software to ensure efficient and accurate data collection and analysis. The
iWorx software required substantial effort in integrating the GSR, ECG, and respiration
measurements. Software specifically designed for collecting and analyzing polygraph
measurements would be more suited to the scope of this experiment. We also experienced
difficulty with the leads measuring GSR on multiple occasions. The traces appeared “noisy”
making them unreadable and unusable as data. (See Figure 7) An additional proposition for
further research is to test the same hypothesis using additional physiological
measurements. We could also take measurements of blood pressure throughout the

interview to investigate whether changes in blood pressure can serve as an indication of
lying.
Figure 7. Example of poor GSR data.

References
1. United States. Dept. of Justice. Evaluation and Inspections Division. Use of Polygraph
Examinations in the Department of Justice. [Washington, D.C.]: U.S. Dept. of Justice,
Office of the Inspector General, Evaluation and Inspections Division, 2006. Print.
2. "CleveLabs Laboratory Course, Biomedical Engineering and Health Science Course."
Biofeedback Laboratory. CleveLabs. Web. 04 Feb. 2011.
<http://www.clevemed.com/ CleveLabs/overview.shtml>.
3. "Fight-or-Flight Reaction." Changing Minds and Persuasion -- How We Change What
Others Think, Believe, Feel and Do. Web. 22 Feb. 2011. http://changingminds.org/
explanations/brain/fight_flight.htm
4. Yoffe, Emily. "Can I Beat a Lie Detector?" Slate Magazine. Web. 02 Feb. 2011.
<http://www.slate.com/id/2112734/>.
5. "Learn How to Pass (or Beat) a Polygraph Test." Antipolygraph.org. Web. 05 Feb.
2011. <http://antipolygraph.org/>.
6. Rea, C., 2008, Catecholamines, UCSD Health Library, http://myhealth.ucsd.edu/
library/healthguide/en-us/support/topic.asp?hwid=te7424 (Feb 21, 2011).
7. Mulroney, S., Myers, A; Netter’s Essential Physiology. Saunders/Elseviers:
Philadelphia, 2009. pp 186-187.
8. "Experiment HP-2: The Galvanic Skin Response (GSR) and Emotion." IWorx: Labs by
Design for the Life Sciences. Web. 2 Feb. 2011.
<http://www.iworx.com/LabExercises/ lockedexercises/LockedGSR-A-LS2.pdf>.

Appendix
A. Prompts for Test Subjects
Prompt for Control and Test subjects
You have stolen money from the empty office (go grab money out of drawer). No one saw
you enter or leave the office, and they have no physical proof that you were there.
Unfortunately, due to your badass reputation, the cops have called you in for questioning
and a lie detector test. Your lawyer advises you to deny any involvement and claim you
have no knowledge of the situation, but to answer all other question truthfully. Respond to
the questions by saying either “Yes” or “No.” Attempt to sit as still as possible, because if
you appear fidgety the police will assume you are not being truthful and assume your guilt.
Additional prompt for test subjects undergoing heat increase
You must attempt to “beat” the test or else you face jail time. The lie detector directly
involves the measurement of your perspiration. In order to attempt to thwart the
measurement, you will use heat pads placed on your core and layering of clothing to
increase your sweat production. This should increase the conductance measured by the
galvanic skin response monitor, hiding your physiological response when lying.
Additional prompt for test subjects using respiration control
You must attempt to “beat” the test or else you face jail time. The lie detector directly
involves the measurement of your respiration and heart rate. In order to attempt to thwart
the measurement, you will use the given technique. This should increase the measurement,
hiding your physiological response when lying.

B. Question list
1. Is your name ?
2. Is your major biology?
3. Have you ever told a lie?
4. Are you male/female?
5. Are you a student at UW-Madison?
6. Did you steal the money?
7. Do you have class on Friday?
8. Do you live in the residence halls?
9. If you stole the money, do you have it with you?
10. Is your hair color ?
11. Have you ever taken food from your roommate without asking?
12. Do you have a dog?
13. Do you have an exam this week?
14. If you stole the money, was a five dollar bill?
15. Is it March?
16. Is your favorite season spring?
17. Do you like ice cream?
18. Do you exercise regularly?
19. If you stole the money, was it a 20 dollar bill?
20. Are you a packers fan?
21. Do you have a bicycle in Madison?
22. If you stole the money, did you take it out of the drawer?

C. Example Data Trace Figures
a. Heart rate was determined by analyzing data obtained from the ECG. The number
of heart beats in each time interval was multiplied by 60 seconds, then divided by
the length of the time interval (in seconds) to give heart rate in bpm for each
particular time interval.
b. Respiration depth was determined by measuring area under the curve. The
bottom of the first respiration after the respective question marker was used as the
starting point. The end point was the bottom of the last respiration before the next
question marker.

c. Maximum GSR peak was determined by measuring the height of the largest peak in each
question interval. Area under the curve was also determined. The starting point was taken
at the point the question was asked; the end point taken at the closest approximation of the
point that the GSR leveled off.

D. Supplementary Figures. Average Truth and Lie values for a. heart rate, b.
respiration rate, c. respiration depth, d. GSR maximum peak height, and e. GSR area
under the curve are shown in the following tables along with standard deviations.
The graph below each table represents the difference between the group average
measurement for truthful responses and untruthful responses (i.e. Average truth –
Average Lie).
a. Heart Rate Data (beats/min)
Response Subject Control
Subject Conscious
Control of
Respiration
Subject Elevated Body
Temperature
Truth 1 65.4 ± 6.2 6 70.0 ± 6.1 11 87.1 ± 3.0
Lie 72.9 ± 1.2 75.1 ± 1.2 84.2 ± 3.3
Truth 2 81.6 ± 4.8 7 62.7 ± 2.2 12 61.8 ± 2.3
Lie 89.3 ± 3.1 61.6 ± 1.9 61.7 ± 1.8
Truth 3 75.2 ± 1.5 8 79.6 ± 5.2 13 84.4 ± 2.9
Lie 77.8 ± 1.5 76.2 ± 6.2 84.5 ± 3.4
Truth 4 62.6 ± 2.6 9 87.9 ± 4.1 14 74.7 ± 1.6
Lie 71.8 ± 2.9 86.3 ± 4.6 72.0 ± 4.1
Truth 5 66.3 ± 1.1 10 74.2 ± 2.8 15 95.9 ± 3.9
Lie 71.8 ± 1.9 74.5 ± 2.1 94.1 ± 2.4
Control
Controlled
Respiration
Elevated
Temperature
-7
-6
-5
-4
-3
-2
-1
0
1
2
∆∆ ∆∆of
Hea
rt R
ate

b. Respiration Rate (breaths/min)
Response Subject Control Subject Conscious
Control of
Respiration
Subject Elevated Body
Temperature
Truth 1 26.9 ± 1.1 6 21.1 ± 4.9 11 11.6 ± 2.7
Lie 23.6 ± 4.6 17.0 ± 4.0 10.2 ± 1.5
Truth 2 19.4 ± 6.7 7 17.3 ± 2.9 12 18.6 ± 1.5
Lie 17.8 ± 3.1 18.8 ± 1.6 18.0 ± 0.9
Truth 3 18.0 ± 2.1 8 8.78 ± 1.9 13 18.4 ± 2.7
Lie 19.2 ± 1.6 12.1 ± 1.8 18.7 ± 1.7
Truth 4 6.1 ± 1.1 9 14.0 ± 3.3 14 16.4 ± 3.3
Lie 5.4 ± 0.8 14.3 ± 3.8 18.4 ± 3.7
Truth 5 20.7 ± 4.7 10 21.8 ± 2.2 15 8.2 ± 3.7
Lie 22.7 ± 1.6 22.4 ± 1.2 5.5 ± 1.8
Control
Controlled
Respirations
Elevated
Temperature
-0.4
-0.3
-0.2
-0.1
0
0.1
0.2
0.3
0.4
0.5
0.6
∆∆ ∆∆of
Res
pir
ati
on
Rate

c. Relative Respiration Depth
Response Subject Control
Subject Conscious
Control of
Respiration
Subject Elevated Body
Temperature
Truth 1 0.4658 ±
0.2210 6 1.0073± 0.4219 11 3.2441± 1.5967
Lie 0.6311 ±
0.2423 1.0528± 0.0745 3.2975± 0.5966
Truth 2 1.1475±
0.5299 7 0.6748± 0.3039 12 0.5112± 0.2268
Lie 0.8941±
0.5361 0.8090± 0.1933 0.4823± 0.2104
Truth 3 1.4578±
0.3888 8 2.7702± 1.3002 13 0.5874± 0.5429
Lie 1.5141±0.3350 1.2643± 0.2459 0.6832± 0.3272
Truth 4 7.8041±
3.2151 9 1.5089± 1.0293 14 0.3969± 0.1432
Lie 7.6458±
2.9463 1.1090± 0.5772 0.5155± 0.2731
Truth 5 0.6566±
0.2167 10 0.5743± 0.2147 15 3.2003± 1.6063
Lie 0.4155±
0.1222 0.4075± 0.3010 4.9526± 1.1506
Control
Controlled
Respirations
Elevated
Temperature
-0.5
-0.4
-0.3
-0.2
-0.1
0
0.1
0.2
0.3
0.4
0.5
∆∆ ∆∆o
f R
esp
irati
on
Dep
th

d. Maximum GSR deviation from baseline (volts)
Response Subject Control
Subject Conscious
Control of
Respiration
Subject Elevated Body
Temperature
Truth 1 - 6 - 11 0.02 ± 0.01
Lie - - 0.03 ± 0.004
Truth 2 0.04 ± 0.01 7 - 12 0.05 ± 0.01
Lie 0.16 ± 0.11 - 0.06 ± 0.02
Truth 3 0.23 ± 0.08 8 0.08 ± 0.04 13 0.01 ± 0.02
Lie 0.30 ± 0.05 0.15 ± 0.06 0.13 ± 0.05
Truth 4 0.06 ± 0.06 9 0.06 ± 0.03 14 0.01 ± 0.01
Lie 0.03 ± 0.01 0.08 ± 0.01 0.01 ± 0.01
Truth 5 0.79 ± 1.54 10 0.08 ± 0.06 15 0.07 ± 0.03
Lie 0.10 ± 0.04 0.04 ± 0.04 0.19 ± 0.06
Control
Controlled
Respirations
Elevated
Temperature
-0.1
-0.05
0
0.05
0.1
0.15
∆∆ ∆∆of
GS
R M
ax P
eak

e. GSR Area Under Curve
Response Subject Control
Subject Conscious
Control of
Respiration
Subject Elevated Body
Temperature
Truth 1 0.0460 ± 0.0245 6 0.0376 ± 0.0115 11 0.0086 ± 0.0031
Lie 0.0743 ± 0.0103 0.0487 ± 0.0173 0.0130 ± 0.0025
Truth 2 0.0166 ± 0.0088 7 0.0525 ± 0.0005 12 0.0164 ± 0.0073
Lie 0.0557 ± 0.0235 0.0309 ± 0.0118 0.0160 ± 0.0041
Truth 3 0.0687 ±
0.0209 8 0.0377 ± 0.0140 13 0.0558 ± 0.0142
Lie 0.0763 ±0.0162 0.0536 ± 0.0242 0.0489 ± 0.0264
Truth 4 0.0134 ± 0.0025 9 0.0227 ± 0.0142 14 0.0064 ± 0.0025
Lie 0.0142 ± 0.0029 0.0384 ± 0.0050 0.0061 ± 0.0021
Truth 5 0.0420 ± 0.0103 10 0.0314 ± 0.0222 15 0.0249 ± 0.0103
Lie 0.1031 ± 0.1355 0.0372 ± 0.0092 0.0631 ± 0.0234
-0.03
-0.025
-0.02
-0.015
-0.01
-0.005
0
Control
Controlled
Respirations
Elevated
Temperature
∆∆ ∆∆of
GS
R A
rea U
nd
er C
urv
e