Liane Guild, Brad Lobitz, Randy Berthold, Jeremy Kerr Biospheric Science Branch, NASA Ames Research...
18
Liane Guild, Brad Lobitz, Randy Berthold, Jeremy Kerr Biospheric Science Branch, NASA Ames Research Center, CA Roy Armstrong, James Goodman University of Puerto Rico at Mayaguez, PR Collaborators: AVIRIS Team at NASA JPL Airborne Science and Technology Lab at NASA Ames Funding: Interdisciplinary Research in Earth Science NASA Ocean Biology and Biogeochemistry Program Contact: [email protected] http://earthscience.arc.nasa.gov/sge/coral-health/ Coral Reef Bleaching and Threats to Biodiversity in Puerto Rico
-
Upload
magnus-hardy -
Category
Documents
-
view
218 -
download
1
Transcript of Liane Guild, Brad Lobitz, Randy Berthold, Jeremy Kerr Biospheric Science Branch, NASA Ames Research...

Liane Guild, Brad Lobitz, Randy Berthold, Jeremy KerrBiospheric Science Branch, NASA Ames Research Center, CA
Roy Armstrong, James Goodman University of Puerto Rico at Mayaguez, PR
Collaborators:AVIRIS Team at NASA JPLAirborne Science and Technology Lab at NASA Ames
Funding: Interdisciplinary Research in Earth Science NASA Ocean Biology and Biogeochemistry Program
Contact: [email protected]
http://earthscience.arc.nasa.gov/sge/coral-health/
Coral Reef Bleaching and Threats to Biodiversity in Puerto Rico
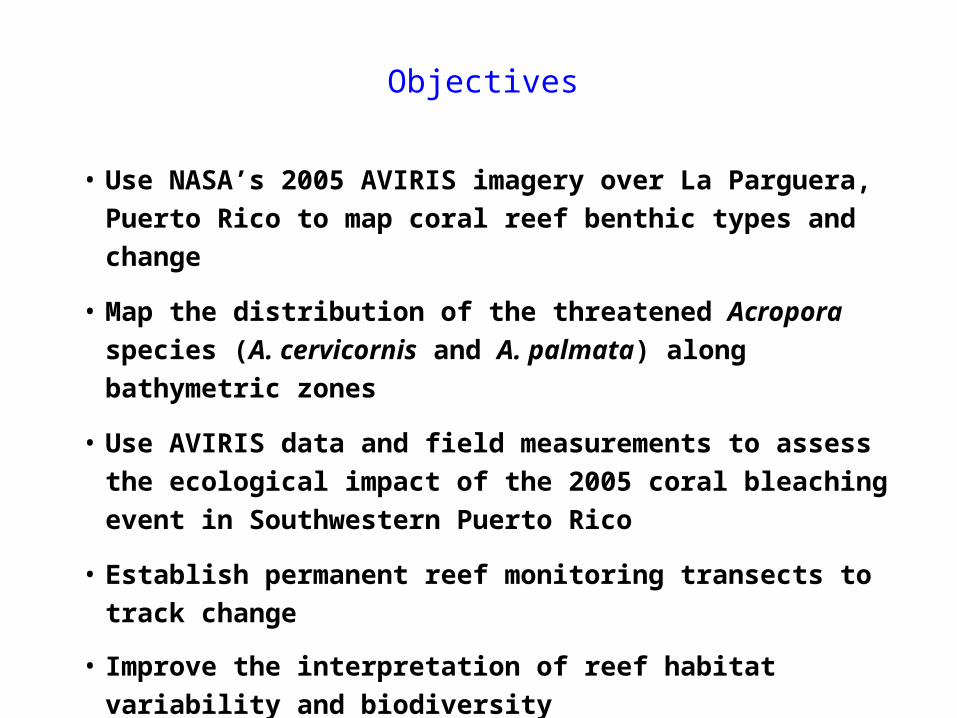
• Use NASA’s 2005 AVIRIS imagery over La Parguera, Puerto
Rico to map coral reef benthic types and change
• Map the distribution of the threatened Acropora species (A.
cervicornis and A. palmata) along bathymetric zones
• Use AVIRIS data and field measurements to assess the
ecological impact of the 2005 coral bleaching event in
Southwestern Puerto Rico
• Establish permanent reef monitoring transects to track
change
• Improve the interpretation of reef habitat variability and
biodiversity
Objectives

NASA AVIRIS Mission of the 2005 Caribbean Coral Reef Bleaching Event
AVIRIS flight lines over La Parguera, Puerto Rico
• December 12-13, 2005
• Twin Otter Platform, Altitude ~3.5 km
• Pixel Size 2.4 m
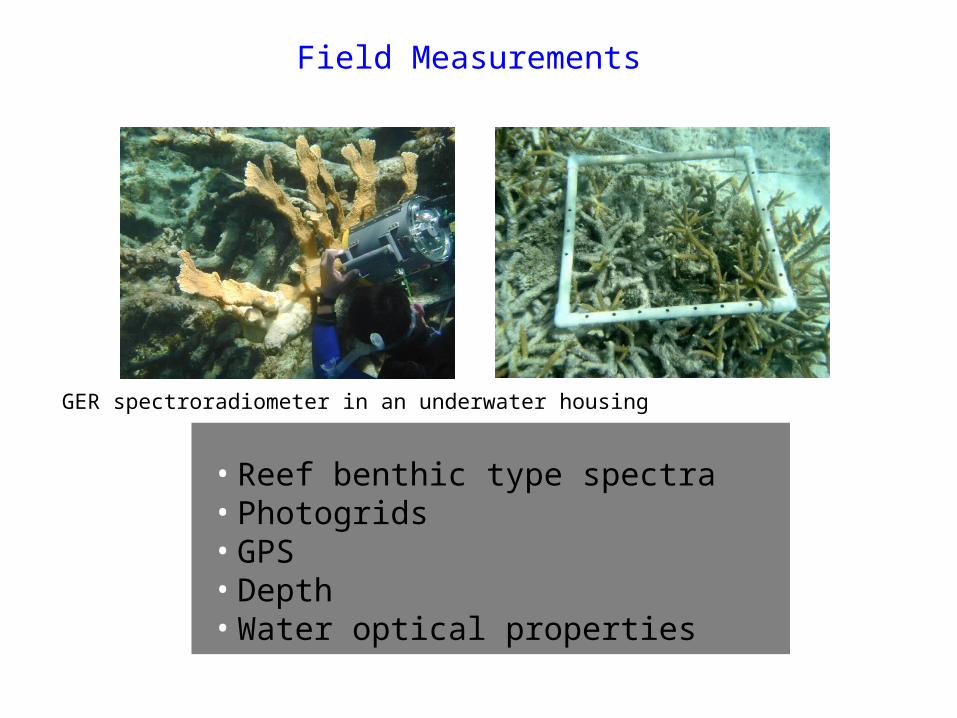
• Reef benthic type spectra• Photogrids• GPS• Depth• Water optical properties
Field Measurements
GER spectroradiometer in an underwater housing
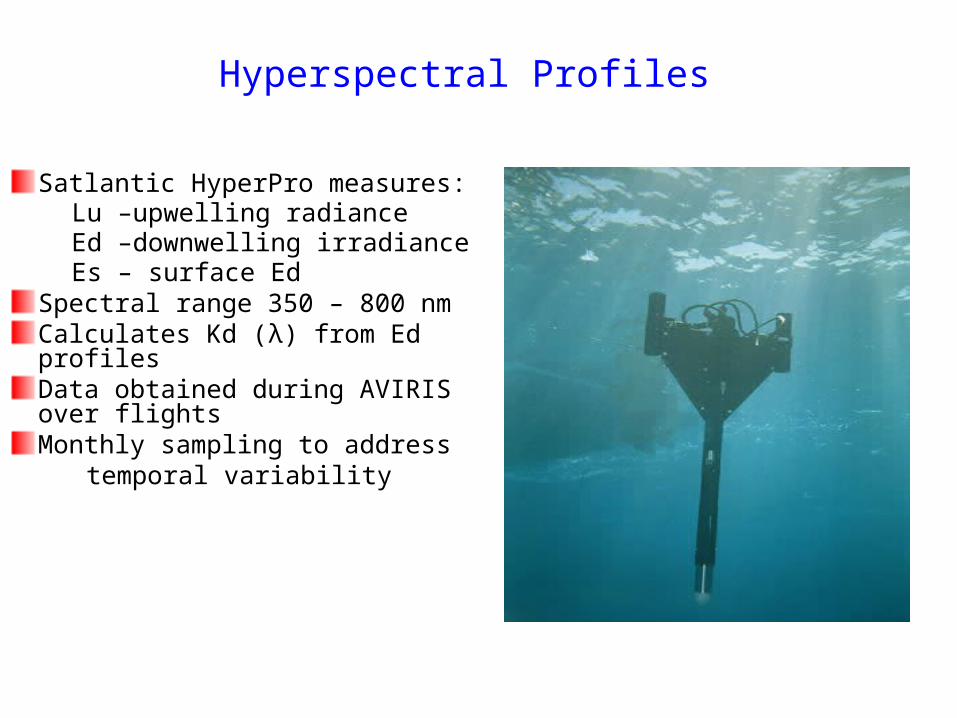
Hyperspectral Profiles
Satlantic HyperPro measures:– Lu –upwelling radiance– Ed –downwelling irradiance– Es – surface Ed
Spectral range 350 – 800 nmCalculates Kd (λ) from Ed profilesData obtained during AVIRIS over flights Monthly sampling to address
temporal variability

LiDAR
Bathymetry and reflectivity products ADS Mk II Airborne System April 2006-May 2007 Bathymetry to 50 mSpatial Resolution 4m

Processing Steps
• Atmospheric correction – Tafkaa (Gao et al. 2000, Montes et al. 2001, 2003)• Sun glint removal (Hedley et al. 2005)• Semi-analytical model (Lee et al. 1996, 1998, 1999)• J. Goodman’s implementation of this model
Image Preprocessing
Anomaly Corrections
Glint Removal
Atmospheric Correction
Inversion Model
Semi-Analytical
Input Parameters
Absorption Properties
Bottom Reflectance
Linear Unmixing Model
Inversion Output
Water Constituent Properties
Bottom Albedo (550 nm)
Bathymetry
RMSE
Unmixing Output
Reef, Algae, Sand Distribution
RMSE
Spectral Endmembers
Reef, Algae, Sand
Field Spectra
Forward Model
Semi-Analytical
AVIRIS

2005 AVIRIS: Unmixing Model
J. Goodman (UPRM)
ForwardModel
Preprocessed AVIRIS Imagery
Spectral Input Parameters
Aquatic Absorption Properties
Generic Bottom ReflectanceImage Geometry
Explicit pixel by pixel subsurface angles
View (AVIRIS) Illumination (solar)
Inversion Output
Water Properties
Bathymetry
UnmixingModel
0
0.1
0.2
0.3
0.4
0.5
400 500 600 700Wavelength, nm
Ref
lect
ance Sand
Algae
Coral
Spectral Endmembers
Unmixing Output
Benthic Composition
Sand
AlgaeCoral

Rb = (1/0.54) Rrs (z = a) – (1 – e -2kz) Rw
e -2kz
Rrs (z = a) reflectance just above the water surface
(1/0.54) corrects for transmittance of the air/water interface and the refractive index
Rb is substrate reflectance
k is the attenuation coefficient of the water body
Rw is the water column reflectance in optically deep waters
z is depth (from LiDAR)All terms except z are wavelength specific
Water Column Corrections
R. Armstrong (UPRM)

Effects of Water Column Correction – Sand Target
0
100
200
300
400
500
600
400 450 500 550 600 650 700
Wavelength (nm)
Valu
es
Sand
0
5
10
15
20
25
30
35
40
45
400 450 500 550 600 650 700
Wavelength (nm)
% R
efl
ect
an
ce
Corrected Image
GER
Atmospherically corrected pixel over sand target
In situ percent reflectance of sand target (red line)
AVIRIS water column corrected pixel (blue line)
Depth 2.5 m
Per
cent
Ref
lect
ance
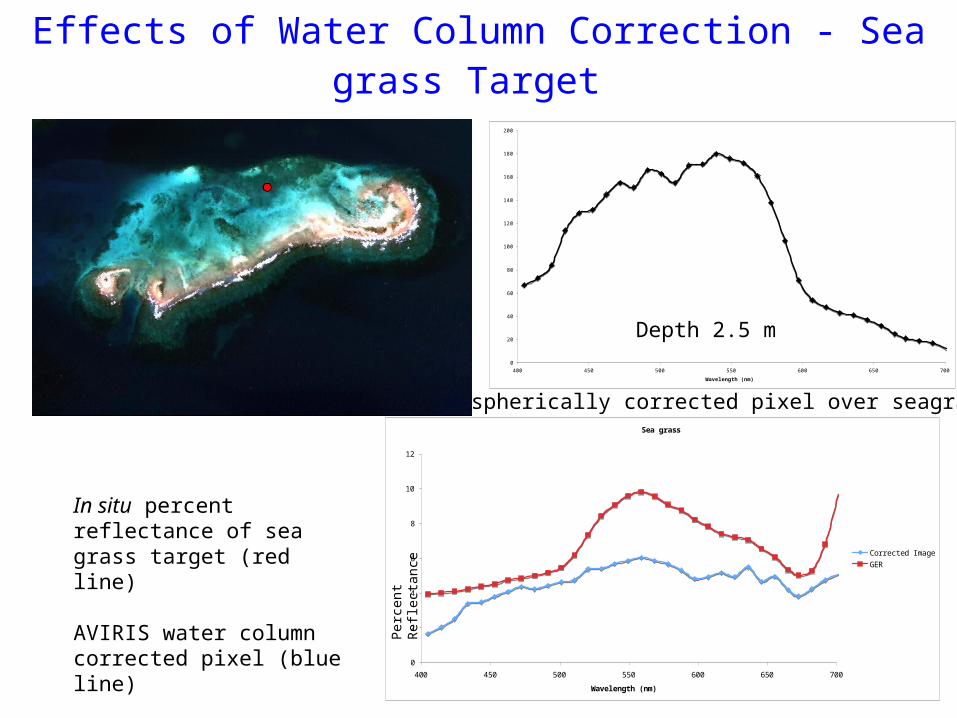
Effects of Water Column Correction - Sea grass Target
0
20
40
60
80
100
120
140
160
180
200
400 450 500 550 600 650 700
Wavelength (nm)
Valu
es
Atmospherically corrected pixel over seagrassesSea grass
0
2
4
6
8
10
12
400 450 500 550 600 650 700
Wavelength (nm)
% R
efl
ect
an
ce
Corrected Image
GER
In situ percent reflectance of sea grass target (red line)
AVIRIS water column corrected pixel (blue line)
Depth 2.5 m
Per
cent
Ref
lect
ance

Effects of Water Column Correction – Coral Target
0
5
10
15
20
25
400 450 500 550 600 650 700
Wavelength (nm)
% R
elf
ecta
nce
Live Coral
0
5
10
15
20
25
400 450 500 550 600 650 700
Wavelength (nm)
% R
efl
ect
an
ce
Corrected Image
GER
Atmospherically corrected pixel over coral target
In situ percent reflectance of typical coral endmember (red line)
AVIRIS water column corrected pixel of mixed living/dead corals and sand(blue line)
Depth 0.5 m
Per
cent
Ref
lect
ance
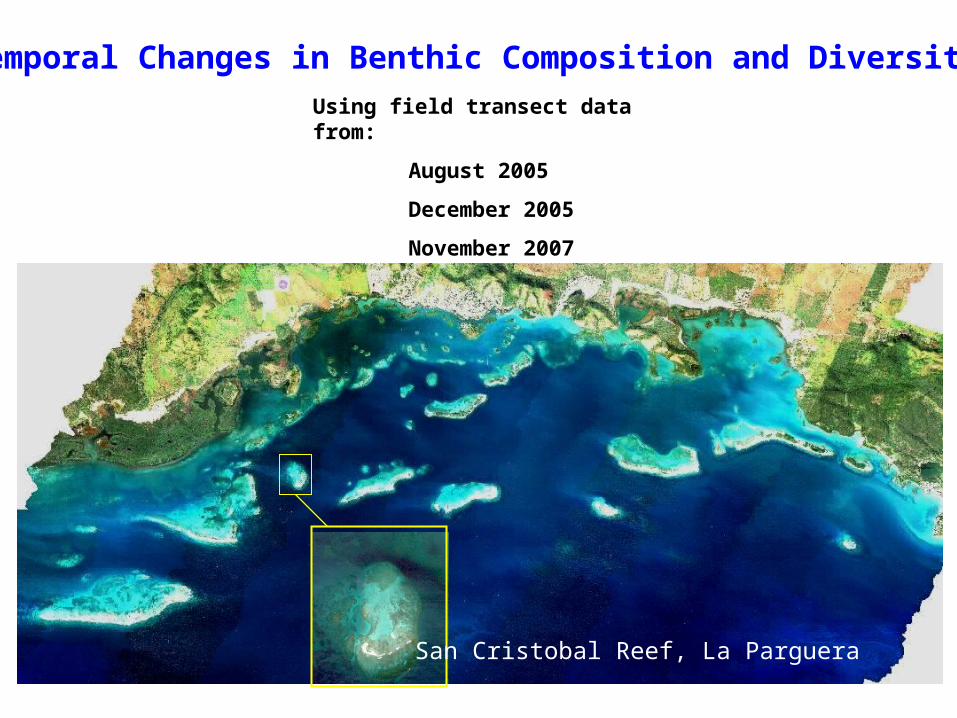
Temporal Changes in Benthic Composition and Diversity
San Cristobal Reef, La Parguera
Using field transect data from:
August 2005
December 2005
November 2007

24.12
1.29 0.86
46.17
9.38
4.261.14
59.94
21.88
3.12
8.23
3.72
49.29
14.98
22.59
0.00
25.00
50.00
75.00
100.00
Coral Gorgonians Sponges Macroalgae Sand
Cover type
Per
cen
t co
ver
Aug-05 Dec-05 Fall-07
*
*
*
*
**
!
*
Trends in Reef Cover Type
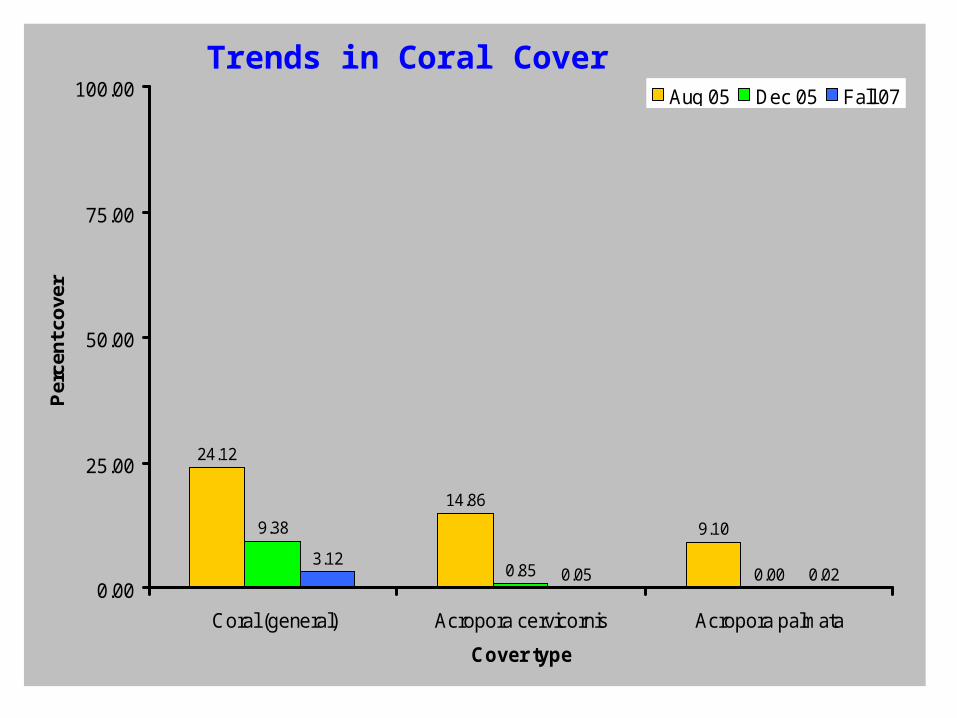
24.12
14.86
9.109.38
0.85 0.003.12
0.05 0.020.00
25.00
50.00
75.00
100.00
Coral (general) Acropora cervicornis Acropora palmata
Cover type
Per
cen
t co
ver
Aug 05 Dec 05 Fall 07
Trends in Coral Cover

Acropora cervicornis (staghorn coral) Transects 2004-2007
20042004 20052005
20062006 20072007

Changes in Biodiversity
Pre-bleaching event (August 2005): 0.70* 0.60**
Post-bleaching and mortality (November 2007): 1.61* 0.22**
* = calculated as each coral species cover as a percent of total coral cover
** = calculated as each coral species cover as a percent of overall cover
Acroporid dominance in 2005, before the bleaching event, was 98%. This dominance diminished to 2% in 2007 accounting for the increase in diversity when only coral species are included in the index calculations. When other reef benthic components (sponges, gorgonians, macroalgae) are taken into account, there was a dramatic decrease in coral diversity according to the Shannon-Wiener Index.
• The Shannon-Wiener Diversity Index is a measurement of biodiversity. • This index takes into account the number of species and the evenness of the species.
Shannon-Wiener Index

Summary AVIRIS data have been atmospherically corrected including:
• Stray-light anomaly suppression
• Removal of sun glint
Unmixing analysis is in progress:
• Using spectral endmembers of coral, sand, and algae
• Analysis performed for depth range 0-10 m
• Use MESMA for unmixing and compare results
Next steps :
• Finish field data analysis for all years
• Implement water column corrections and use of spectral library
• Accuracy assessment of benthic composition classification
• Complete reef degradation and “biodiversity” analysis