LI Xin, ZHANG Yu-liang, YU Jian-ping, ZHOU Zhao-zhong · 2017-02-04 · the Coriolis experiment....
9
International Journal of Engineering and Advanced Research Technology (IJEART) ISSN: 2454-9290, Volume-3, Issue-1, January 2017 12 www.ijeart.com Abstract— The steady flow of the internal flow field in a sewage pump was numerically simulated and analyzed as a solid–liquid two-phase flow was transported. The simulation and analysis were based on the mixture multiphase model, the RNG k–ε turbulence model, the frozen rotor method, and the SIMPLE algorithm. The impact of the solid–liquid two-phase flow on the hydraulic performance of the sewage pump and the attrition rate of the vane was emphatically analyzed under different solid-phase concentrations. Results show that, as the concentration of the transported solid phase increased, the pump lift and efficiency decreased monotonously. The shaft power also showed a tendency to monotonically increase. The solid-phase concentration on the pressure surface of the vane continuously increased as well. Under a high transportation concentration, the secondary part of the suction surface experienced the most severe wear. The equilibrium point of equal pressure continuously moved toward the leading edge of the vane. At the same time, the isoconcentration points of the pressure surface and suction surface moved toward the vane inlet. Index Terms— sewage pump; solid-phase concentration; numerical calculation; hydraulic performance; attrition rate I. INTRODUCTION Sewage pumps are solid–liquid pumps that are commonly used to clear channel sedimentation in cities. Researchers at home and abroad have conducted in-depth studies on sewage pumps and have made important achievements. Engin carried out experiments to compare transported mediums with various levels of hardness, such as water and sand. On the basis of the different capabilities of the centrifugal pump with a semi-enclosed impeller pump in the experiment, Engin derived a conclusion on the relation between particle size and pump capability. During the liquid–solid transport process, the predictive data on the lift and deviation of the experiment value ranged from −20% to 15% [1]. Gandhi performed an experiment to test the capacity of a centrifugal pump with a shrouded impeller when the transmission medium was a mixture of water, mortar, and tailing containing zinc mineral. When the solid concentration was lower than 20%, the relation between the pump lift and the flow could be determined by calculating the pure water condition. Yuan Qi et al. [3] investigated a non-overload mud pump through a numerical simulation and found the existence of backflow at the entry and velocity slip between two phases. At the junction of the pressure surface and suction surface, the turbulent kinetic energy and turbulent kinetic energy dissipation rate of the liquid phase reached their extreme points. Li et al. [4] investigated the influence of solid particles of different diameters on the external characteristics of a centrifugal pump. Under a small flow condition, the efficiency value slightly increased; the stable working range shrank, and the best efficiency point moved toward the small flow. Zhang et al. conducted a numerical simulation for a two-phase flow field in a centrifugal pump by using the numerical calculation method. Distinct jet-wake flows were observed near the volute tongue. As the volume fraction increased, the jet-wake flows became increasingly obvious. Another numerical simulation was also performed to investigate the starting characteristics of a centrifugal pump with a high specific speed for transporting solid–liquid two-phase flows [6]. Harry et al. [7] investigated centrifugal pump vanes made from high chromium cast iron and aluminum alloy by using the Coriolis experiment. The centrifugal pump vanes showed different wear patterns when the transmission medium was slurry. On the basis of a rapid experiment and mathematical analysis, Veselin et al. [8] proposed a type of wear forecast method that could replace traditional mud pump wear tests, which are time consuming and costly and involve poor validation. Most designs of sewage pumps are based on former designs. Thus, an effective pump performance is difficult to guarantee. In this context, an extensive investigation into the internal flow of pumps is urgently necessary. The findings of such investigation can then be used to derive a theoretical basis for developing a type of pump with high standard performance and stable operation. The present work presents numerical simulations and analyses of a solid–liquid two-phase pump and emphasizes the impact of the solid–liquid two-phase flow on the performance of the sewage pump in terms of solid-phase concentration. Through the analysis of the internal pressure and dynamic deposition distribution of the particles on the surface of the solids, we can perform a preliminary forecast of the basic characteristics of a sewage pump and thereby derive a theoretical basis for improving the design of sewage pumps. II. PUMP MODEL AND CALCULATION METHOD 2.1 Pump model and computational grid The calculation model was a centrifugal pump with a specific speed of ns=129.3. The fundamental performance parameters are as follows: flux, 50 m 3 /h; lift, 20.54 m; rotation rate, 2900 r/min. The main geometry sizes of the pump are as follows: pump inlet diameter, D j =76 mm; hub diameter, d h =0 mm; impeller output diameter, D 2 =137 mm; impeller output width, b 2 =14 mm; impeller blade angle, β 2 =30°; blade number, Z=6; scroll of blade, 104.5°; volute basic circle diameter, D 3 =145 mm; volute entry width, b 3 =30 mm. Calculation of the influence of solid-phase concentration on sewage pumps based on Mixture model LI Xin, ZHANG Yu-liang, YU Jian-ping, ZHOU Zhao-zhong
Transcript of LI Xin, ZHANG Yu-liang, YU Jian-ping, ZHOU Zhao-zhong · 2017-02-04 · the Coriolis experiment....

International Journal of Engineering and Advanced Research Technology (IJEART)
ISSN: 2454-9290, Volume-3, Issue-1, January 2017
12 www.ijeart.com
Abstract— The steady flow of the internal flow field in a
sewage pump was numerically simulated and analyzed as a
solid–liquid two-phase flow was transported. The simulation
and analysis were based on the mixture multiphase model, the
RNG k–ε turbulence model, the frozen rotor method, and the
SIMPLE algorithm. The impact of the solid–liquid two-phase
flow on the hydraulic performance of the sewage pump and the
attrition rate of the vane was emphatically analyzed under
different solid-phase concentrations. Results show that, as the
concentration of the transported solid phase increased, the
pump lift and efficiency decreased monotonously. The shaft
power also showed a tendency to monotonically increase. The
solid-phase concentration on the pressure surface of the vane
continuously increased as well. Under a high transportation
concentration, the secondary part of the suction surface
experienced the most severe wear. The equilibrium point of
equal pressure continuously moved toward the leading edge of
the vane. At the same time, the isoconcentration points of the
pressure surface and suction surface moved toward the vane
inlet.
Index Terms— sewage pump; solid-phase concentration;
numerical calculation; hydraulic performance; attrition rate
I. INTRODUCTION
Sewage pumps are solid–liquid pumps that are commonly
used to clear channel sedimentation in cities. Researchers at
home and abroad have conducted in-depth studies on sewage
pumps and have made important achievements. Engin carried
out experiments to compare transported mediums with
various levels of hardness, such as water and sand. On the
basis of the different capabilities of the centrifugal pump with
a semi-enclosed impeller pump in the experiment, Engin
derived a conclusion on the relation between particle size and
pump capability. During the liquid–solid transport process,
the predictive data on the lift and deviation of the experiment
value ranged from −20% to 15% [1]. Gandhi performed an
experiment to test the capacity of a centrifugal pump with a
shrouded impeller when the transmission medium was a
mixture of water, mortar, and tailing containing zinc mineral.
When the solid concentration was lower than 20%, the
relation between the pump lift and the flow could be
determined by calculating the pure water condition. Yuan Qi
et al. [3] investigated a non-overload mud pump through a
numerical simulation and found the existence of backflow at
the entry and velocity slip between two phases. At the
junction of the pressure surface and suction surface, the
turbulent kinetic energy and turbulent kinetic energy
dissipation rate of the liquid phase reached their extreme
points. Li et al. [4] investigated the influence of solid particles
of different diameters on the external characteristics of a
centrifugal pump. Under a small flow condition, the
efficiency value slightly increased; the stable working range
shrank, and the best efficiency point moved toward the small
flow.
Zhang et al. conducted a numerical simulation for a two-phase
flow field in a centrifugal pump by using the numerical
calculation method. Distinct jet-wake flows were observed
near the volute tongue. As the volume fraction increased, the
jet-wake flows became increasingly obvious. Another
numerical simulation was also performed to investigate the
starting characteristics of a centrifugal pump with a high
specific speed for transporting solid–liquid two-phase flows
[6]. Harry et al. [7] investigated centrifugal pump vanes made
from high chromium cast iron and aluminum alloy by using
the Coriolis experiment. The centrifugal pump vanes showed
different wear patterns when the transmission medium was
slurry. On the basis of a rapid experiment and mathematical
analysis, Veselin et al. [8] proposed a type of wear forecast
method that could replace traditional mud pump wear tests,
which are time consuming and costly and involve poor
validation.
Most designs of sewage pumps are based on former designs.
Thus, an effective pump performance is difficult to guarantee.
In this context, an extensive investigation into the internal
flow of pumps is urgently necessary. The findings of such
investigation can then be used to derive a theoretical basis for
developing a type of pump with high standard performance
and stable operation. The present work presents numerical
simulations and analyses of a solid–liquid two-phase pump
and emphasizes the impact of the solid–liquid two-phase flow
on the performance of the sewage pump in terms of
solid-phase concentration. Through the analysis of the
internal pressure and dynamic deposition distribution of the
particles on the surface of the solids, we can perform a
preliminary forecast of the basic characteristics of a sewage
pump and thereby derive a theoretical basis for improving the
design of sewage pumps.
II. PUMP MODEL AND CALCULATION METHOD
2.1 Pump model and computational grid
The calculation model was a centrifugal pump with a specific
speed of ns=129.3. The fundamental performance parameters
are as follows: flux, 50 m3/h; lift, 20.54 m; rotation rate, 2900
r/min. The main geometry sizes of the pump are as follows:
pump inlet diameter, Dj=76 mm; hub diameter, dh=0 mm;
impeller output diameter, D2=137 mm; impeller output width,
b2=14 mm; impeller blade angle, β2=30°; blade number, Z=6;
scroll of blade, 104.5°; volute basic circle diameter, D3=145
mm; volute entry width, b3=30 mm.
Calculation of the influence of solid-phase
concentration on sewage pumps based on Mixture
model
LI Xin, ZHANG Yu-liang, YU Jian-ping, ZHOU Zhao-zhong
Calculation of the influence of solid-phase concentration on sewage pumps based on Mixture model
13 www.ijeart.com
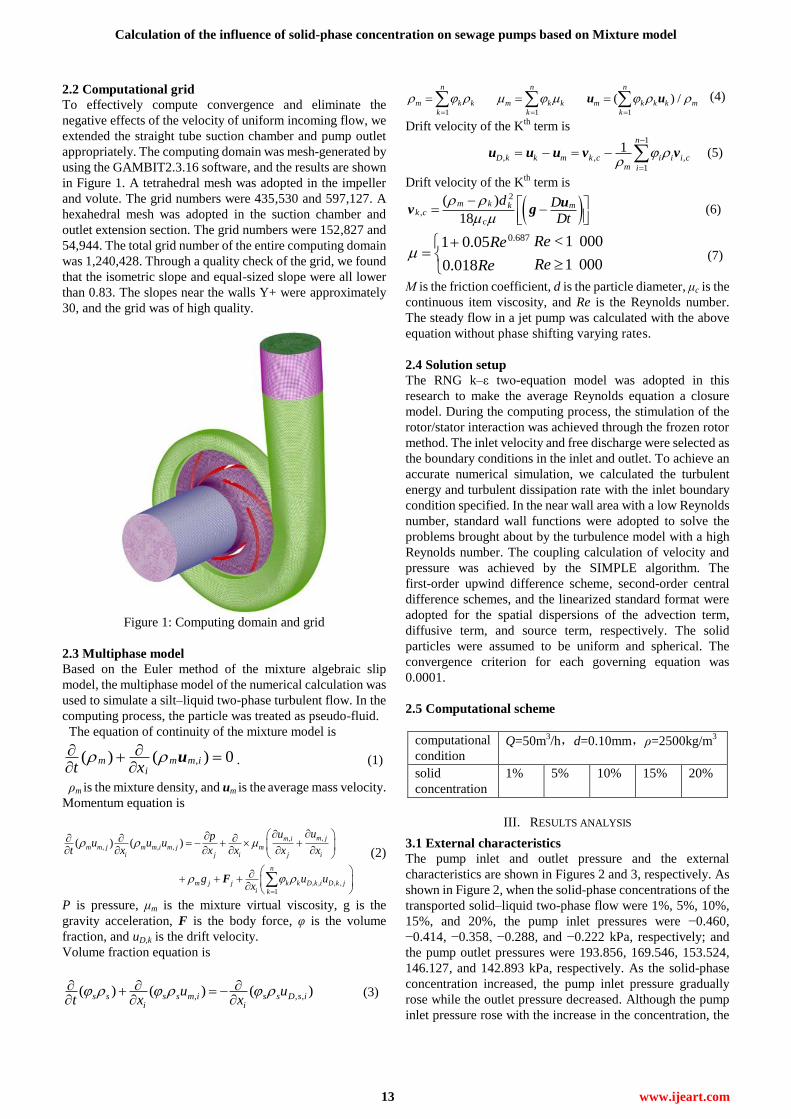
2.2 Computational grid
To effectively compute convergence and eliminate the
negative effects of the velocity of uniform incoming flow, we
extended the straight tube suction chamber and pump outlet
appropriately. The computing domain was mesh-generated by
using the GAMBIT2.3.16 software, and the results are shown
in Figure 1. A tetrahedral mesh was adopted in the impeller
and volute. The grid numbers were 435,530 and 597,127. A
hexahedral mesh was adopted in the suction chamber and
outlet extension section. The grid numbers were 152,827 and
54,944. The total grid number of the entire computing domain
was 1,240,428. Through a quality check of the grid, we found
that the isometric slope and equal-sized slope were all lower
than 0.83. The slopes near the walls Y+ were approximately
30, and the grid was of high quality.
Figure 1: Computing domain and grid
2.3 Multiphase model
Based on the Euler method of the mixture algebraic slip
model, the multiphase model of the numerical calculation was
used to simulate a silt–liquid two-phase turbulent flow. In the
computing process, the particle was treated as pseudo-fluid.
The equation of continuity of the mixture model is
,( ) ( ) 0m m m iit x
u . (1)
ρm is the mixture density, and um is the average mass velocity.
Momentum equation is
,,
, , ,
, , , ,
1
( ) ( )m jm i
m m j m m i m j mi j i j i
n
m j j k k D k i D k ji k
uupu u u
t x x x x x
g u ux
F
(2)
P is pressure, μm is the mixture virtual viscosity, g is the
gravity acceleration, F is the body force, φ is the volume
fraction, and uD,k is the drift velocity.
Volume fraction equation is
, , ,( ) ( ) ( )s s s s m i s s D s ii i
u ut x x
(3)
1 1 1
( ) /n n n
m k k m k k m k k k m
k k k
u u (4)
Drift velocity of the Kth
term is
1
, , ,
1
1n
D k k m k c i i i cm i
u u u v v (5)
Drift velocity of the Kth
term is
2
,
( )
18
m k k mk c
c
d D
Dt
uv g (6)
0.687 <1 0001 0.05
1 0000.018
ReRe
ReRe
(7)
Μ is the friction coefficient, d is the particle diameter, μc is the
continuous item viscosity, and Re is the Reynolds number.
The steady flow in a jet pump was calculated with the above
equation without phase shifting varying rates.
2.4 Solution setup
The RNG k–ε two-equation model was adopted in this
research to make the average Reynolds equation a closure
model. During the computing process, the stimulation of the
rotor/stator interaction was achieved through the frozen rotor
method. The inlet velocity and free discharge were selected as
the boundary conditions in the inlet and outlet. To achieve an
accurate numerical simulation, we calculated the turbulent
energy and turbulent dissipation rate with the inlet boundary
condition specified. In the near wall area with a low Reynolds
number, standard wall functions were adopted to solve the
problems brought about by the turbulence model with a high
Reynolds number. The coupling calculation of velocity and
pressure was achieved by the SIMPLE algorithm. The
first-order upwind difference scheme, second-order central
difference schemes, and the linearized standard format were
adopted for the spatial dispersions of the advection term,
diffusive term, and source term, respectively. The solid
particles were assumed to be uniform and spherical. The
convergence criterion for each governing equation was
0.0001.
2.5 Computational scheme
computational
condition Q=50m
3/h,d=0.10mm,ρ=2500kg/m
3
solid
concentration
1% 5% 10% 15% 20%
III. RESULTS ANALYSIS
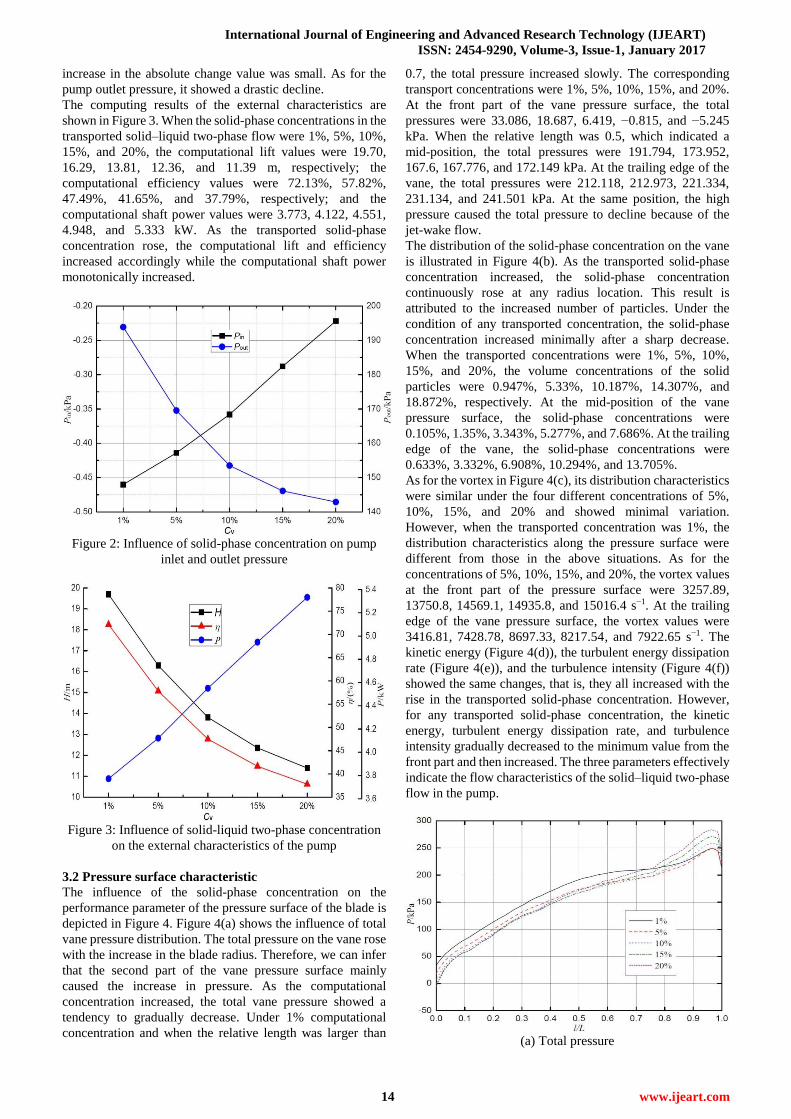
3.1 External characteristics
The pump inlet and outlet pressure and the external
characteristics are shown in Figures 2 and 3, respectively. As
shown in Figure 2, when the solid-phase concentrations of the
transported solid–liquid two-phase flow were 1%, 5%, 10%,
15%, and 20%, the pump inlet pressures were −0.460,
−0.414, −0.358, −0.288, and −0.222 kPa, respectively; and
the pump outlet pressures were 193.856, 169.546, 153.524,
146.127, and 142.893 kPa, respectively. As the solid-phase
concentration increased, the pump inlet pressure gradually
rose while the outlet pressure decreased. Although the pump
inlet pressure rose with the increase in the concentration, the
International Journal of Engineering and Advanced Research Technology (IJEART)
ISSN: 2454-9290, Volume-3, Issue-1, January 2017
14 www.ijeart.com
increase in the absolute change value was small. As for the
pump outlet pressure, it showed a drastic decline.
The computing results of the external characteristics are
shown in Figure 3. When the solid-phase concentrations in the
transported solid–liquid two-phase flow were 1%, 5%, 10%,
15%, and 20%, the computational lift values were 19.70,
16.29, 13.81, 12.36, and 11.39 m, respectively; the
computational efficiency values were 72.13%, 57.82%,
47.49%, 41.65%, and 37.79%, respectively; and the
computational shaft power values were 3.773, 4.122, 4.551,
4.948, and 5.333 kW. As the transported solid-phase
concentration rose, the computational lift and efficiency
increased accordingly while the computational shaft power
monotonically increased.
Figure 2: Influence of solid-phase concentration on pump
inlet and outlet pressure
Figure 3: Influence of solid-liquid two-phase concentration
on the external characteristics of the pump
3.2 Pressure surface characteristic
The influence of the solid-phase concentration on the
performance parameter of the pressure surface of the blade is
depicted in Figure 4. Figure 4(a) shows the influence of total
vane pressure distribution. The total pressure on the vane rose
with the increase in the blade radius. Therefore, we can infer
that the second part of the vane pressure surface mainly
caused the increase in pressure. As the computational
concentration increased, the total vane pressure showed a
tendency to gradually decrease. Under 1% computational
concentration and when the relative length was larger than
0.7, the total pressure increased slowly. The corresponding
transport concentrations were 1%, 5%, 10%, 15%, and 20%.
At the front part of the vane pressure surface, the total
pressures were 33.086, 18.687, 6.419, −0.815, and −5.245
kPa. When the relative length was 0.5, which indicated a
mid-position, the total pressures were 191.794, 173.952,
167.6, 167.776, and 172.149 kPa. At the trailing edge of the
vane, the total pressures were 212.118, 212.973, 221.334,
231.134, and 241.501 kPa. At the same position, the high
pressure caused the total pressure to decline because of the
jet-wake flow.
The distribution of the solid-phase concentration on the vane
is illustrated in Figure 4(b). As the transported solid-phase
concentration increased, the solid-phase concentration
continuously rose at any radius location. This result is
attributed to the increased number of particles. Under the
condition of any transported concentration, the solid-phase
concentration increased minimally after a sharp decrease.
When the transported concentrations were 1%, 5%, 10%,
15%, and 20%, the volume concentrations of the solid
particles were 0.947%, 5.33%, 10.187%, 14.307%, and
18.872%, respectively. At the mid-position of the vane
pressure surface, the solid-phase concentrations were
0.105%, 1.35%, 3.343%, 5.277%, and 7.686%. At the trailing
edge of the vane, the solid-phase concentrations were
0.633%, 3.332%, 6.908%, 10.294%, and 13.705%.
As for the vortex in Figure 4(c), its distribution characteristics
were similar under the four different concentrations of 5%,
10%, 15%, and 20% and showed minimal variation.
However, when the transported concentration was 1%, the
distribution characteristics along the pressure surface were
different from those in the above situations. As for the
concentrations of 5%, 10%, 15%, and 20%, the vortex values
at the front part of the pressure surface were 3257.89,
13750.8, 14569.1, 14935.8, and 15016.4 s−1. At the trailing
edge of the vane pressure surface, the vortex values were
3416.81, 7428.78, 8697.33, 8217.54, and 7922.65 s−1. The
kinetic energy (Figure 4(d)), the turbulent energy dissipation
rate (Figure 4(e)), and the turbulence intensity (Figure 4(f))
showed the same changes, that is, they all increased with the
rise in the transported solid-phase concentration. However,
for any transported solid-phase concentration, the kinetic
energy, turbulent energy dissipation rate, and turbulence
intensity gradually decreased to the minimum value from the
front part and then increased. The three parameters effectively
indicate the flow characteristics of the solid–liquid two-phase
flow in the pump.
(a) Total pressure

Calculation of the influence of solid-phase concentration on sewage pumps based on Mixture model
15 www.ijeart.com
(b) Solid-phase concentration
(c) Vortex
(d) Kinetic energy
(e) Turbulent dissipation rate
(f) Turbulence intensity
Figure 4: Influence of solid-phase concentration on the
performance parameters of the vane pressure surface
3.3 Suction surface characteristics
The influence of the solid-phase concentration on the
performance parameter of the vane pressure surface is shown
in Figure 5. Figure 5(a) shows the influence of total vane
pressure distribution. The total pressure always showed the
tendency to rise with the increase in the radius from the front
part of the suction surface under any transported
concentration. A dramatic drop was observed at the outlet of
the suction surface, similar to the previous discussion.
Generally, the total pressure on the suction surface increased
as the transported solid-phase concentration rose. The
difference was the increasing range. When the relative length
was smaller than 0.5, the increasing difference in pressure was
not obvious. However, at the secondary part of the suction
surface, the increasing difference in pressure was obvious. As
for the concentrations of 5%, 10%, 15%, and 20%, the total
pressures at the front part of the suction surface were −44.844,
−40.356, −35.976, −32.815, and −30.666 kPa. At the
mid-position of the suction surface, the total pressures were
62.362, 62.598, 73.698, 86.119, and 101.852 kPa. At the
position in which the relative length was 0.9, the total
pressures were 199.551, 281.383, 339.416, 365.957, and
401.358 kPa.
The influence of the transported solid-phase concentration on
the distribution of the solid-phase concentration on the vane
suction surface is shown in Figure 5(b). With the increase in
the transported solid-phase concentration, the solid-phase
concentration on the vane suction surface continuously
increased. This result is directly attributed to the increasing
solid particles in the pump. When the transported solid-phase
concentration was 1%, the solid-phase concentration on the
vane suction surface was low and showed minimal change.
The corresponding solid-phase concentrations to the front
part of the vane, the mid-position of the vane, and the trailing
edge of the vane were 0.9%, 0.818%, and 1.545%,
respectively. However, when the concentrations were 5%,
10%, 15%, and 20%, no obvious increase was observed at the
front part of the vane, but an obvious increase was noted at the
trailing edge position. At the front part of the suction surface,
the four corresponding solid-phase concentrations were
4.356%, 9.374%, 14.798%, and 20.173%. At the
mid-position of the suction surface, the four corresponding
solid-phase concentrations were 4.902%, 12.236%, 19.808%,

International Journal of Engineering and Advanced Research Technology (IJEART)
ISSN: 2454-9290, Volume-3, Issue-1, January 2017
16 www.ijeart.com
and 29.379%. At the position in which the relative length was
0.9, the four corresponding solid-phase concentrations were
10.145%, 21.022%, 27.686%, and 35.059%. Thus, we can
infer that, under high transported solid-phase concentrations,
wear occurred mainly in the secondary part of the suction
surface.
The vortex distributions on the vane suction surface under
different transported solid-phase concentrations are shown in
Figure 5(c). Except for the case in which the transported
solid-phase concentration was 1%, the other cases showed
similar vortex distributions on the vane suction surface. As for
the case in which the transported solid-phase concentration
was 1%, when the relative length was shorter than 0.68, the
vortex showed a small ripple with a stable average value, but
the vortex was high at the inlet position of the suction surface.
At the secondary part of the suction surface, the vortex rose
markedly. When the relative lengths were 0.4, 0.6, and 0.8,
the vortexes were 4030.34, 3548.85, and 13084.3 s−1,
respectively. The distribution of the kinetic energy, the
turbulent energy dissipation rate, and the turbulence intensity
along the vane suction surface under different transported
solid-phase concentrations are shown in Figures 5(d), 5(e),
and 5(f), respectively. The three parameters showed a similar
change, that is, they all increased with the increase in the
transported solid-phase concentration.
(a) Total pressure
(b) Solid-phase concentration
(c) Vortex
(d) Kinetic energy
(e) Turbulent energy dissipation rate
(f) Turbulence intensity
Figure 5: Influence of solid-phase concentration on the
performance parameters of the vane pressure surface

Calculation of the influence of solid-phase concentration on sewage pumps based on Mixture model
17 www.ijeart.com
3.4 Total pressure distribution on the vane under
different solid-phase concentrations
The total pressure distribution on the pressure and suction
surface of the vane under five different transported
solid-phase concentrations is shown in Figure 6. Apparently,
the total pressure rose with the increase in the radius
regardless of the pressure surface or suction surface. When
the transported solid-phase concentration was 1%, which was
regarded as low, the total pressure on the pressure surface in
most areas (in which the relative length was 0.96) was always
higher than that on the suction surface; the opposite occurred
thereafter. In summary, the isostatic pressure balance point of
the pressure surface and suction surface was at the area in
which the relative length was 0.96. As for the other four
transported solid-phase concentrations, similar changes were
observed; the only difference was the location of the isostatic
pressure balance point. When the transported solid-phase
concentrations were 5%, 10%, 15%, and 20%, the positions
of the isostatic pressure balance point were 0.77, 0.70, 0.67,
and 0.63, respectively. With the increase in the transported
solid-phase concentration, the isostatic pressure balance point
continuously moved toward the leading edge.
(a)1%
(b)5%
(c)10%
(d)15%
(e)20%
Figure 6: Change of total pressure distribution on the vane
under different solid-phase concentrations
3.5 Distribution of particle concentration on the vane
under different solid-phase concentrations
The distribution of the solid-phase concentration on the
pressure and suction surface of the vane under five different
transported solid-phase concentrations is shown in Figure 7.
In most areas of the vane surface, the solid-phase
concentration of the suction surface was higher than that of
the pressure surface. Given that the solid-phase concentration
reflected the wear degree of the wall surface to some extent,
we can infer that the suction surface could bear serious wear.
Moreover, the position of the isoconcentration point (the
point of the same solid-phase concentration at the same radius
of the pressure surface and suction surface) constantly
changed. When the concentrations were 1%, 5%, 10%, 15%,
and 20%, the positions of the isoconcentration point were
0.16, 0.15, 0.13, 0.10, and 0.07, respectively. That is, as the
transported solid-phase concentration increased, the
isoconcentration point of the pressure surface and suction
surface moved toward the inlet of the vane.
(a)1%

International Journal of Engineering and Advanced Research Technology (IJEART)
ISSN: 2454-9290, Volume-3, Issue-1, January 2017
18 www.ijeart.com
(b)5%
(c)10%
(d)15%
(e)20%
Figure 7: Changes of the distribution of the solid-phase
concentration on the vane under different solid-phase
concentrations
3.6 Particle concentration of the pressure surface on the
vane
The distribution of the particle concentration of the pressure
surface on the vane under five different transported
solid-phase concentrations is shown in Figure 8. When the
transported concentration was low at 1%, the distribution of
the particle concentration of the pressure surface on the vane
was an even one. When the concentration was 5%, the
solid-phase concentration at the inlet and outlet of the
pressure began to rise. When the concentrations were 10%,
15%, and 20%, the solid-phase concentration at the inlet and
outlet of the pressure surface was high. These results indicate
that the above position would suffer from severe wear.
(a)1% (b)5% (c)10% (d)15% (e)20%
Figure 8: Distribution change of the particle concentration of the pressure surface on the vane under different solid-phase
concentrations
3.7 Particle concentration of the pressure surface on the
vane
The distribution of the particle concentration of the suction
surface on the vane under five different transported
solid-phase concentrations is shown in Figure 8. When the
transported concentration was low at 1%, the distribution of
the particle concentration of the suction surface on the vane
was an even one. When the concentration was 5%, the
solid-phase concentration at the secondary part of the
pressure began to rise. When the concentrations were 10%,
15%, and 20%, the solid-phase concentration at the inlet and
outlet of the suction surface was high. These results indicate
that the above position would suffer from severe wear.

Calculation of the influence of solid-phase concentration on sewage pumps based on Mixture model
19 www.ijeart.com
(a)1% (b)5% (c)10% (d)15% (e)20%
Figure 9: Distribution change of the particle concentration of the suction surface on the vane under different solid-phase
concentrations
3.8 Particle concentration of the volute surface
The distribution of the particle concentration of the volute
surface under five different transported solid-phase
concentrations is shown in Figure 10. Regardless of amount
of transported concentration (1% or 20%), the distribution of
the particle concentration of the volute surface was even,
which indicated that the degree of inner surface wear of the
volute was approximately in agreement with each other.
When the concentration was 5%, the distribution of the
particle concentration of the volute inner surface was uneven;
at the position near the volute tongue, the highest
concentration could reach 30%. Such a situation also
occurred when the transported solid-phase concentrations
were 10% and 15%. The position near the volute tongue still
had a high solid-phase concentration, which indicated that,
under the corresponding situations, the aforementioned
positions would suffer from severe wear.
(a)1% (b)5% (c)10% (d)15% (e)20%
Figure 10: Distribution change of the particle concentration of the volute surface on the vane under different transported
solid-phase concentrations
3.9 Total pressure and streamline
The placement of the total pressure and streamline under
different transported solid-phase concentrations is shown in
Figure 11. When the transported solid-phase concentrations
differed, the streamline distinction in each channel of the vane
wheel was not obvious and was approximately in agreement
with those in other channels. This outcome can be explained
by the fact that, although the transported solid-phase
concentrations differed, the computation conditions were all
design conditions that favored the corresponding inner flow.
(a)1% (b)5% (c)10% (d)15% (e)20%
Figure 11: Placement of the total pressure and streamline under different transported solid-phase concentrations

International Journal of Engineering and Advanced Research Technology (IJEART)
ISSN: 2454-9290, Volume-3, Issue-1, January 2017
20 www.ijeart.com
IV. CONCLUSIONS
With the increase in the transported solid-phase
concentration, the total pressure of the pump inlet showed a
tendency to gradually rise. By contrast, the total pressure of
the pump outlet showed a tendency to gradually decline.
Although the total pressure of the pump inlet increased with
the increasing transported solid-phase concentration, its
absolute variation value was small. By contrast, the decrease
in the total pressure of the pump outlet was severe.
With the increase in the transported solid-phase
concentration, the computational lift and efficiency of the
pump decreased monotonously. Under the same condition,
the shaft power monotonically increased.
With the increase in the transported solid-phase
concentration, the solid-phase concentration on the vane
suction surface continuously rose. Regardless of the amount
of transported concentration, the solid-phase concentration
showed a tendency to increase minimally after a sharp
decrease. When the transported solid-phase concentration
was high, the secondary part of the suction surface mainly
suffered from wear.
With the increase in the transported solid-phase
concentration, the isostatic pressure balance point
continuously moved toward the leading edge, and the
isoconcentration point of the pressure surface and suction
surface moved toward the inlet of the vane.
ACKNOWLEDGEMENT
The work was supported by the Zhejiang Provincial Natural
Science Foundation of China (No.LY14E090011), Zhejiang
Provincial Science and Technology Project
(No.2015C31129), Academic Foundation of Quzhou
University (No.XNZQN201508), and Chinese National
Foundation of Natural Science (No.51536008, 51505253).
REFERENCES
[1]Engin T, Gur M. Performance characteristics of centrifugal pump
impeller with running tip clearance pumping solid-liquid mixtures[J].
Journal of Fluids Engineering, 2001, 123(3): 532-538.
[2]Gandhi B K, Singh S N, Seshadn V. Effect of speed on the performance
characteristics of a centrifugal slurry pump[J]. Journal of Hydraulic
Engineering, 2002, 128(2): 225-233.
[3]Yuan Shouqi, Zhang Peifang, Zhang Jinfeng. Numerical simulation of
3-D dense solid- liquid two- phase turbulent flow in a non-clogging mud
pump[J]. Chinese Journal of Mechanical Engineering, 2004,
17(4):623-627.
[4]Li Yi, Zhu Zuchao, He Weiqiang, et al. Numerical simulation and
experimental research on the influence of solid phase characteristics on
centrifugal pump performance[J]. Chinese Journal of Mechanical
Engineering, 2012, 25(6): 1184-1189.
[5]Zhang Yuliang, Li Yi, Cui Baoling, et al. Numerical simulation and
analysis of solid-liquid two-phase flow in centrifugal pump[J]. Chinese
Journal of Mechanical Engineering, 2013, 26(1): 53-60.
[6]Zhang Yuliang, Li Yi, Zhu Zuchao, et al. Computational analysis of
centrifugal pump delivering solid-liquid two-phase flow during startup
period[J]. Chinese Journal of Mechanical Engineering, 2014, 27(1):
178-185.
[7]Harry H T, Graeme R A. Experimental study on erosive wear of some
metallic materials using Coriolis wear testing approach[J]. Wear, 2005,
(258): 458-469.
[8]Veselin B. Erosive wear model of slurry pump impeller[J]. Journal of
Tribology, 2010, 132(2): 021602.1-5.
LI Xin, College of Mechanical Engineering, Quzhou University, Quzhou
324000, China, Key Laboratory of Advanced Manufacturing Technology of
Zhejiang Province, Hangzhou 310027, China
ZHANG Yu-liang, College of Mechanical Engineering, Quzhou
University, Quzhou 324000, China,
YU Jian-ping, College of Mechanical Engineering, Quzhou University,
Quzhou 324000, China,
ZHOU Zhao-zhong, College of Mechanical Engineering, Quzhou
University, Quzhou 324000, China,