Valoriser les données de la recherche : l'exemple de la Phonothèque de la MMSH

HAL Id: tel-00161196https://tel.archives-ouvertes.fr/tel-00161196
Submitted on 10 Jul 2007
HAL is a multi-disciplinary open accessarchive for the deposit and dissemination of sci-entific research documents, whether they are pub-lished or not. The documents may come fromteaching and research institutions in France orabroad, or from public or private research centers.
L’archive ouverte pluridisciplinaire HAL, estdestinée au dépôt et à la diffusion de documentsscientifiques de niveau recherche, publiés ou non,émanant des établissements d’enseignement et derecherche français ou étrangers, des laboratoirespublics ou privés.
Bassins de rift à des stades précoces de leurdéveloppement: l’exemple du bassin de
Makgadikgadi-Okavango-Zambezi, Botswana et dubassin Sud-Tanganyika (Tanzanie et Zambie).
Composition géochimique des sédiments: traçeurs deschangements climatiques et tectoniques
Philippa Huntsman-Mapila
To cite this version:Philippa Huntsman-Mapila. Bassins de rift à des stades précoces de leur développement: l’exempledu bassin de Makgadikgadi-Okavango-Zambezi, Botswana et du bassin Sud-Tanganyika (Tanzanieet Zambie). Composition géochimique des sédiments: traçeurs des changements climatiques et tec-toniques. Géochimie. Université de Bretagne occidentale - Brest, 2006. Français. <tel-00161196>


2

3
Remerciements Je tiens tout d’abord à remercier Jean-Jacques Tiercelin et Christophe Hémond, mes directeurs de thèse. Je leur suis très reconnaissante pour leurs conseils et leur sympathie. Je remercie beaucoup Mathieu Benoit et Jo Cotten pour la patience qu’ils ont montré lors de la mesure d’échantillons au cours de ma thèse et pour avoir accepté de travailler sur mes échantillons de sédiments. Mille merci au Professeur Lars Ramberg, directeur de Harry Oppenheimer Okavango Research Centre, Maun pour m’avoir donné le temps de travailler sur ce manuscrit et d’avoir accepté mes absences aux réunions. Grand merci au Professeur Susan Ringrose pour avoir suivi mon travail et pour les discussions fructueuses. Merci à Mike Talbot pour la datation des carottes du Tanganyika. Ma reconnaissance va également à Claire Bassoullet et Danièle Hureau-Mazaundier (et Laurence), non seulement pour m’avoir aidé dans le laboratoire mais également pour leur hospitalité inoubliable. C’est grâce à vous, que j’ai reussi à survivre aux absences de ma petite famille. Je remercie Mathieu Schuster pour son aide généreuse dans la rédaction en français. Merci beaucoup à Monica Morrison et Dominique Gac pour leur aide avec la bibliographie et à Sidonie Revillon pour ses commentaires dans la relecture des chapîtres. Thank you to all my colleagues at HOORC especially Ineelo Mosie, Billy Mogojwa, Wilfred Kaneguba and Thebe Kemosedile for all their field assistance. Mes plus sincères remerciements vont à mon mari Tlamelo et mes deux filles, Jessica et Elena (née le mois où j’ai commencé la thèse) pour leur soutien permanent. Ils ont supporté mes absences avec courage. Mille merci à mes parents pour m’avoir toujours encouragé. Cette thèse est dédiée à mon mentor, Professeur Henri A.B. Kampunzu, qui m’a donné le courage de commencer ce travail. Même après son décès en 2004, c’est lui qui m’a donné l’inspiration pour continuer.

4

5
SOMMAIRE INTRODUCTION (VERSION FRANÇAISE) .........................................................8
0.1 Problématique ......................................................................................................8 0.2 Organisation du manuscrit .................................................................................10
INTRODUCTION (ENGLISH VERSION) ............................................................14 0.1 Statement of the problem...................................................................................14 0.2 Organisation of the manuscript ..........................................................................16
I. STUDY SITE......................................................................................................21 I.1 The Makgadikgadi-Okavango-Zambezi Basin...................................................23 I.2 Lake Tanganyika ................................................................................................25 I.3 Regional climate .................................................................................................27
II. SYNTHESIS OF PALEOCLIMATIC DATA FOR THE REGION ...............32 II.1 Last Glacial Maximum......................................................................................32 II. 2 Deglacial period ...............................................................................................33 II.3 The Younger Dryas Event.................................................................................34 II.4 The Early Holocene...........................................................................................35 II.5 The Late Holocene ............................................................................................35
III. SUMMARY OF GEOCHEMICAL ANALYTICAL PROCEDURES.....40 IV. CRYPTIC INDICATORS OF PROVENANCE FROM THE GEOCHEMISTRY OF THE OKAVANGO DELTA SEDIMENTS, BOTSWANA ..............................................................................................................44
IV.1. La géochimie des sédiments de l’Okavango comme indicateur de provenance..................................................................................................................................44 IV.2. Cryptic indicators of provenance from the geochemistry of the Okavango Delta sediments, Botswana ......................................................................................45
IV.2.1. Introduction ........................................................................................................ 46 IV.2.2. Geological setting ............................................................................................... 46 IV.2.3. Local setting ....................................................................................................... 47 IV.2.4. Sampling and analytical procedures ................................................................... 51 IV.2.5 Petrography.......................................................................................................... 59 IV.2.6 Major element composition ................................................................................. 62 IV.2.7. Trace element compositions ............................................................................... 69
IV.2.7.1. Transition metals ......................................................................................... 69 IV.2.7.2. Alkalis and alkali-earth elements ................................................................ 71 IV..2.7.3. High-field-strength-elements (HFSE), Th and U........................................ 73 IV.2.7.4. Rare earth elements ..................................................................................... 74
IV.2.8. Discussion........................................................................................................... 78 IV.2.8.1. Introduction ................................................................................................. 78 IV.2.8.2. Grain-size and density-controlled sorting ................................................... 79 IV.2.8.3. Source area weathering and diagenetic processes...................................... 80 IV.2.8.4. Source rock lithology................................................................................... 82
IV.2.9. Conclusions ........................................................................................................ 86 References .............................................................................................................. 87
V. SEDIMENT GEOCHEMISTRY, PROVENANCE AND TECTONIC SETTING: APPLICATION OF DISCRIMINATION DIAGRAMS TO VERY EARLY STAGE OF INTRACONTINENTAL RIFT EVOLUTION, WITH EXAMPLES FROM THE OKAVANGO AND SOUTHERN TANGANYIKA RIFT BASINS.............................................................................................................91
V.1. Géochimie et provenance des sédiments, contexte tectonique : application des diagrammes de discrimination aux sédiments des phases précoces d’un rift intracontinental, exemples des bassins de l’Okavango et du Sud Tanganyika........91 V.2 Sediment geochemistry, provenance and tectonic setting: Application of discrimination diagrams to very early stages of intracontinental rift evolution, with examples from the Okavango and Southern Tanganyika rift basins .......................92
V.2.1.Introduction........................................................................................................... 92
6
V.2.2. Geological setting ................................................................................................ 93 V.2.2.1. Classification of tectonic settings ................................................................. 93 V.2.2.2. Description of rift settings............................................................................. 94 V.2.2.3. The East African Rift System......................................................................... 94 V.2.2.4. Okavango Delta setting................................................................................. 97 V.2.2.5. Lake Tanganyika setting ............................................................................. 100
V.2.3 Description of samples and analysis ................................................................... 102 V.2.4 Results................................................................................................................. 103
V.2.4.1 Discrimination diagrams using major elements .......................................... 103 V.2.4.2 Discrimination diagrams and ratios of trace and rare earth elements........ 108
VI.2.5 Discussion.......................................................................................................... 112 V.2.5.1 Inferred tectonic setting of the depositional basin....................................... 112 V.2.5.2 Provenance .................................................................................................. 114
V.2.6 Conclusions......................................................................................................... 115 VI. SEDIMENTOLOGICAL AND GEOCHEMICAL EVIDENCE FOR PALAEO-ENVIRONMENTAL CHANGE IN THE MAKGADIKGADI SUBBASIN IN RELATION TO THE MOZ RIFT DEPRESSION, BOTSWANA....................................................................................................................................120
VI.1. Changements paléo-environnementaux dans le sous-bassin de Makgadikgadi en relation avec la dépression du rift de MOZ (Botzwana): approche géochimique et sédimentologique ...............................................................................................120 VI.2. Sedimentological and geochemical evidence for palaeo-environmental change in the Makgadikgadi subbasin in relation to the MOZ rift depression, Botswana 121
VI.2.1. Introduction ...................................................................................................... 122 VI.2.2. Study area ......................................................................................................... 123 VI.2.3. Analytical techniques ....................................................................................... 125 VI.2.4. Topographic, Stratigraphic and Petrographic Results ...................................... 130 VI.2.5. X Ray Diffraction and Geochemical Results.................................................... 134 VI.2.6 Thin section and ESEM results ......................................................................... 142 VI.2.7 Thermoluminescence Dating ............................................................................. 143 VI.2.8 Discussion and Conclusions .............................................................................. 150
VII. USE OF THE GEOCHEMICAL AND BIOLOGICAL SEDIMENTARY RECORD IN ESTABLISHING PALAEO-ENVIRONMENTS AND CLIMATE CHANGE IN THE LAKE NGAMI BASIN, NW BOTSWANA .........................158
VII.1. Enregistrement sédimentaire des variations du niveau du lac Ngami au Pléistocène supérieur et à l’Holocène ....................................................................158 VII.2 Use of the geochemical and biological sedimentary record in establishing palaeo-environments and climate change in the Lake Ngami basin, NW Botswana................................................................................................................................159
VII.2.1 Introduction ...................................................................................................... 160 VII.2.2. Local setting and climate................................................................................. 161 VII.2.3. Previous work on climate change and lake levels ........................................... 163
VII.2.3 1. Regional palaeo-environmental studies ................................................... 163 VII.2.3.2. Palaeo-environmental studies conducted in the MOZ Basin ................... 164
VII.2.4. Sampling and analytical procedures................................................................ 167 VII.2.5. Topographic and stratigraphic results ............................................................. 171 VII.2.6. Geochemical characteristics of the Ng-02 samples......................................... 173
VII.2.6.1. Redox condtions ....................................................................................... 176 VII.2.6.2. Salinity and alkalinity levels.................................................................... 179
VII.2.7. Diatom composition of Ng-02 samples........................................................... 180 VII.2.8. Palaeo-environmental interpretation ............................................................... 182 VII.2.9. Conclusions ..................................................................................................... 183 Acknowledgements....................................................................................................... 184
VIII. MAJOR AND TRACE ELEMENT GEOCHEMISTRY OF LAKE TANGANYIKA SEDIMENTS: IMPLICATIONS FOR LATE QUATERNARY CLIMATIC VARIABILITY...................................................................................189

7
VIII.1. Changements paléo-environnementaux dans le bassin du Tanganyika au Quaternaire : approche géochimique des éléments traces et majeurs....................189 VIII.2. Major and trace element geochemistry of Lake Tanganyika sediments: implications for late Quaternary climatic variability .............................................191
VIII.2.1. Introduction.................................................................................................... 192 VIII.2.2. Geological and limnological setting .............................................................. 193 VIII.2.3. Previous work on climate change and lake levels.......................................... 195
VIII.2.3.1 Last Glacial Maximum............................................................................. 195 VIII.2.3.2 Deglacial period ...................................................................................... 196 VIII.2.3.3 The Younger Dryas cold event (ca. 12.5 – 11.5 kyr)................................ 197 VIII.2.3.4 The Holocene ........................................................................................... 197
VIII.2.4. Description of cores ....................................................................................... 198 VIII.2.5. Sampling and analysis.................................................................................... 198 VIII.2.6. Results............................................................................................................ 201
VIII.2.6.1 Major elements......................................................................................... 203 VIII.2.6.1.1 Elements affected by weathering processes...................................... 203 VIII.2.6.1.2 Indicators of relative abundance of volcaniclastic debris in sediments.............................................................................................................................. 205
VIII.2.6.2 Trace elements ......................................................................................... 205 VIII.2.6.2.1. Indicators of relative abundance of volcaniclastic debris in sediments.............................................................................................................................. 205 VIII.2.6.2.2. Indicators of redox conditions ......................................................... 205
VIII.2.7. Discussion ...................................................................................................... 208 VIII.2.7.1 Source area weathering ........................................................................... 208 VIII.2.7.2 Palaeoclimatic conditions determined from volcanic ash in sediment .... 209 VIII.2.7.3 Redox conditions ...................................................................................... 210
VIII.2.8. Conclusions.................................................................................................... 211 IX. CONCLUSIONS................................................................................................217
IX.1. Conclusions (Version française)...................................................................217 IX.2 Conclusions (English version).......................................................................220
APPENDIX 1. CHARACTERIZATION OF ARSENIC OCCURRENCE IN THE WATER AND SEDIMENTS OF THE OKAVANGO DELTA, BOTSWANA ............................................................................................................224
A1.1 Caractérisation de la distribution de l’Arsenic dans l’eau et les sédiments du Delta de l’Okavango, Botswana. ...........................................................................224 A1.2. Characterization of Arsenic occurrence in the water and sediments of the Okavango Delta, NW Botswana ............................................................................225
A1.2.1. Introduction...................................................................................................... 225 A1.2.2. Hydrological setting......................................................................................... 226 A1.2.3. Sampling and analytical procedures ................................................................ 232
A1.2.3.1 Water sampling .......................................................................................... 232 A1.2.3.2 Sediment sampling and pre-treatment ....................................................... 233 A1.2.3.3 Sample analysis.......................................................................................... 234
A1.2.4. Results.............................................................................................................. 234 A1.2.4.1 Water samples ............................................................................................ 235 A1.2.4.2 Sediment samples ....................................................................................... 241
A1.2.5. Discussion ........................................................................................................ 245 A1.2.5.1 General hydrochemistry............................................................................. 245 A1.2.5.3 Nature and source of sediment arsenic...................................................... 247 A1.2.5.4 Nature and source of groundwater arsenic ............................................... 248
A1.2.6. Conclusions...................................................................................................... 249 Acknowledgements ........................................................................................... 250
LISTE DES FIGURES ............................................................................................254 LISTE DES TABLEAUX........................................................................................257

8
INTRODUCTION (VERSION FRANÇAISE)
0.1 Problématique Cette thèse concerne l’étude des sédiments lacustres de deux bassins de rift appartenant à un
segment du Système de Rift Est-africain décrit comme étant une zone actuellement en cours
d’ouverture, connue dans la littérature sous le nom de “Southern Complex” ou “Southwestern
Branch” (Reeves, 1972; Mondeguer et al., 1989; Modisi et al., 2000). Ces deux bassins,
considérés comme illustrant deux stades précoces successifs de l’ouverture d’un bassin de rift,
sont : 1) Le Bassin de Makgadikgadi-Okavango-Zambèze (MOZ), situé dans la région nord-
ouest du Botswana; 2) Le Bassin de Mpulungu, qui constitue l’extrémité sud-est du Bassin du
lac Tanganyika (Tanzanie et Zambie) (Figure I-1).
Climat et tectonique, et en particulier les relations qui existent entre le soulèvement de la
croûte continentale, induisant le développement de topographies élevées, et les processus
d’altération et d’érosion, sont à l’origine des processus qui résultent en la formation de
sédiments et la dissolution d’éléments chimiques dans les eaux. En particulier, la composition
chimique des eaux joue un grand rôle dans le cycle biogéochimique de la Terre. La
composition chimique de la fraction détritique est déterminée pour ses grandes lignes par la
composition originelle des roches sources, leur degré d’altération, et les processus qui
surviennent au cours de son transport et son accumulation. L’activité tectonique induit la
formation des reliefs, qui deviennent les zones sources à la fois des éléments détritiques et
solubles. Les conditions climatiques locales à globales (en particulier les paramètres
température et précipitations) déterminent elles les paramètres physiques de l’altération et de
l’érosion.
Les processus tectoniques possèdent tous une signature géochimique particulière inscrite dans
les sédiments qu’ils génèrent, signature qui caractérise : 1) un signal de provenance, et 2) des
mécanismes sédimentaires particuliers qui leur sont associés (Rollinson, 1993). Pour des
sédiments tels que les grès, les relations existant entre leur composition géochimique,
l’origine de ces sédiments et leur contexte tectonique sont des outils efficaces dans
l’interprétation de roches et d’environnements anciens mal préservés. L’utilisation des
compositions des sédiments en éléments majeurs (Bhatia, 1983; Roser and Korsch, 1986;
1988) et en éléments traces (Bhatia and Crook, 1986) dans des diagrammes d’identification se
sont révélés fort efficaces dans la reconnaissance d’environnements tectoniques particuliers.
Afin de vérifier la véracité de certains diagrammes d’identification de contextes tectoniques
dans le cas de sédiments anciens, il est possible de comparer les champs géochimiques
identifiés à ceux définis pour des sédiments actuels déposés dans des contextes tectoniques

9
parfaitement identifiés. Ceci a déja été fait (Bhatia, 1983; Bhatia and Crook, 1986; Roser and
Korsch, 1986; Roser, 1996) mais de nouvelles données concernant des sédiments bien
identifiés dans des contextes tectoniques reconnus afin d’affiner et valider définitivement les
critères d’identification. Dans ce travail, nous utilisons des informations concernant des
sédiments récents (Pléistocène supérieur à Holocène) dans un environnement tectonique
parfaitement bien connu, celui du Système de Rift Est-africain. Dans ce contexte, deux
exemples ont été choisis comme correspondant à des stades jeunes de la formation d’un
bassin de rift. L’analyse des sédiments associés à ces contextes a permis de d’établir une
signature chimique désormais représentative de stades précoces du rifting.
En ce qui concerne les recherches concernant les changements climatiques récents en Afrique,
l’attention des chercheurs est essentiellement orientée vers les bio-indicateurs tels les pollens
(e.g. Vincens et al., 1993; Vincens et al., 2005) et les diatomées (e.g. Gasse et al., 1989; Gasse
et al., 2002), à l’opposé des marqueurs géochimiques. A ce jour, à l’exception de l’utilisation
des marqueurs en géochimie organique dans les sédiments lacustres et en ce qui concerne
l’Afrique, les recherches sur les lacs Ouest-africains et le lac Malawi (e.g. Schneider et al.,
1997; Talbot and Laerdal, 2000; Johnson et al. 2004; Talbot et al., 2006), les marqueurs en
géochimie sédimentaire n’ont été que très peu utilisés sur les sédiments récents, alors qu’ils
l’ont largement été pour des séries sédimentaires anciennes (e.g. Fedo et al., 1997).
La question posée dans ce travail est : l’étude des compositions chimiques minérales des
sédiments quaternaires du Rift Est-africain peut-elle contribuer à la détection des
signaux de changement du climat et à l’identification des environnements tectoniques
précis des zones de dépôt de ces sédiments?
Pour répondre a cette question, une approche multidisciplinaire à dominante géochimique,
avec plusieurs objectifs a été employé :
a) mieux comprendre les processus géochimiques au cours du cycle de genèse des formations
sédimentaires (érosion-transport-accumulation) pour des stades précoces de l’évolution d’un
bassin de rift ;
b) définir des critères sédimentologiques et géochimiques permettant de discriminer l’activité
tectonique et les changements climatiques au cours de l’évolution de ces deux bassins du rift.
c) reconstruire les environnements climatiques et tectoniques caractérisant ces deux régions
du Rift Est-africain au cours du Pléistocène et de l’Holocène ;
Le bassin de Makgadikgadi-Okavango-Zambèze (MOZ) est un vaste bassin intracontinental
d’âge Plio-Pléistocène dont l’histoire est contrôlée par l’évolution d’un système de failles
parallèles de direction NE-SW (Figure I-2). Ces failles délimitent depuis les extrémités sud et
nord des bassins des lacs Tanganyika et Malawi un ensemble de fossés à histoire structurale
complexe (fossés anciens d’âge Karoo, ou fossés plus récents). Au sein de cette structure

10
MOZ, le Bassin de l’Okavango est un demi-graben dont la formation est liée à la croissance
de trois failles de direction NE-SW, les failles de Gumare, Kunyere et Thamalakane. Le
Bassin de l’Okavango est situé dans la zone climatique de l’Afrique du Sud centrale mais son
bassin versant s’étend vers le nord-ouest jusqu’aux reliefs de l’Angola situés en zone
tropicale.
Le Bassin du lac Tanganyika appartient à la branche ouest du Rift Est-africain, située en zone
tropicale. Le Bassin de Mpulungu est le plus méridional des sept sous-bassins qui constituent
le Bassin du Tanganyika (Tiercelin and Mondeguer, 1991) (Figure I-3). Sa structure est
contrôlée sur son flanc sud-ouest par plusieurs failles de direction N140°, qui s’associent pour
former la faille bordière de Mpulungu. Un groupe de failles de direction N30° et N70°
intersecte la faille bordière de Mpulungu et contrôle la morphologie des bassins des lacs
Mweru et Mweru-Wantipa (Figure I-3). Associés au Bassin de Mpulungu, ces deux bassins
sont les plus septentrionaux du «Complexe Sud» (ou Branche sud-ouest) du Rift Est-africain
(Mondeguer, 1991). Le Bassin de Mpulungu est le plus récent des sous-bassins du lac
Tanganyika. Il s’est formé entre 4 et 2 millions d’années, le segment central du Tanganyika
étant lui daté de 12-10 millions d’années (Cohen et al., 2000).
Le Rift Est-africain est célèbre pour les nombreuses découvertes de sites à hominidés anciens,
qui ont donné lieu à une littérature fort abondante (Leakey et al., 1964 ; Patterson and
Howells, 1967; Johanson and Taieb, 1976; Tattersall, 1993; Prat et al., 2005). La
détermination de l’extension spatiale et temporelle des changements d’environnement
occasionnés par les variations du climat en Afrique de l’Est et les phénomènes tectoniques
liés au développement du rift, a fait l’objet d’études quantitatives afin de mieux comprendre et
vérifier les différents scénarios d’évolution proposés pour les diverses populations
d’Hominidés (Vbra, 1995; deMenocal et al., 2000; Behrensmeyer, 2006).
0.2 Organisation du manuscrit
Tous les chapitres de cette thèse sont rédigés en langue anglaise et, à l’exception du Chapitre
I, II et III, ils correspondent soit à des publications parues en 2005 et 2006 dans des revues
internationales à comité de lecture soit seront soumises prochainement à de telles revues.
Vous trouverez au début des chapitres IV-VIII un résumé en français.
Le Chapitre I présente une description détaillée des deux bassins sédimentaires choisis pour
cette étude : Le Bassin Makgadikgadi-Okavango-Zambezi situé dans la région Nord-Ouest du
Botswana, et le Bassin de Mpulungu qui forme l’extrémité sud du fossé du lac Tanganyika.
11
Les caractéristiques essentielles de ces deux bassins, contexte géologique, climatique et
hydrologique, sont présentées dans ce chapitre.
Le Chapitre II présente une synthèse des différents travaux en paléoclimatologie pour
l’ensemble de la région englobant le Bassin de Mpulungu au Nord et le bassin Makgadikgadi-
Okavango-Zambezi au sud.
Le Chapitre III présente une synthèse des différents méthodes géochimiques employées dans
cette étude. En plus la justification pour avoir choisi certaine élements et rapports
géochimique pour cette étude est donnée.
Le Chapitre IV, intitulé «Cryptic indicators of provenance from the geochemistry of the
Okavango Delta sediments, Botswana» a été publié dans la revue Sedimentary Geology en
2005. Cet article présente l’étude géochimique des sédiments silicoclastiques échantillonnés
dans des forages réalisés dans la partie distale du Delta de l’Okavango près de la ville de
Maun. La géochimie des élements majeurs, traces et terres rares a été utilisée pour identifier la
provenance des sédiments remplissant le Bassin de l’Okavango. Ces sédiments sont composés
de deux fractions minérales, l’une d’origine éolienne et l’autre d’origine fluviatile. La fraction
éolienne est composée essentiellement de quartz, ce qui provoque un fort effet de dilution des
autres éléments. Des modélisations quantitatives utilisant des roches caractéristiques du
bassin-versant pouvant être considérées comme sources potentielles ont été réalisées. Les
résultats de ces modélisations ont confirmé que ces roches granitoïdes-gabbros Protérozoïques
et les complexes volcaniques et ortho-métamorphiques qui sont exposés dans le NW du
Botswana et les pays adjacents (Angola et Namibie) constituent bien la source principale des
sédiments de l’Okavango.
Le Chapitre V s’intitule «Sediment geochemistry, provenance and tectonic setting:
Application of discrimination diagrams to very early stages of intracontinental rift evolution,
with examples from the Okavango and Southern Tanganyika rift basins ». Il sera soumis au
Journal of African Earth Sciences. Les cadres tectoniques et les stades d’évolution du Bassin
de l’Okavango et du Bassin de Mpulungu (Sud-Tanganyika) dans un contexte de rift
continental, sont bien connus (Tiercelin and Mondeguer, 1991; Modisi et al., 2000). Les
caractéristiques géochimiques des sédiments de l’Okavango et du Tanganyika sont utilisés ici
comme un marqueur des stades d’évolution tectonique de ces deux bassins, par établissement
de champs nouveaux à l’intérieur des diagrammes de discrimination conventionnels. Ainsi
sont définis par leur signal géochimique 1) un stade de bassin de rift naissant illustré par le
bassin de l’Okavango, et 2) un bassin plus mature, représenté par le Bassin de Mpulungu, le
plus jeune des sous-bassins constituant l’actuel fossé du lac Tanganyika. Les caractères
géochimiques de ces sédiments ont permis en outre de définir la nature des roches dont ils
sont issus, et donc de préciser les régions sources à l’intérieur des bassin-versants respectifs.

12
Le Chapitre VI est intitulé «Sedimentological and geochemical evidence for palaeo-
environmental change in the Makgadikgadi subbasin in relation to the MOZ rift depression,
Botswana». Ce travail a été publié dans la revue Palaeogeography, Palaeoclimatology and
Palaeoecology en 2005. Ce chapitre représente un travail beaucoup plus pluridisciplinaire que
le Chapitre II. Des approches de sédimentologie de terrain et de géomorphologie /
morphostratigraphie sont combinées à des études géochimiques et chronologiques
(thermoluminescence). Elles contribuent à identifier les marqueurs des changements de
paléoenvironments dans le nord du Botswana pendant le Pléistocène. Ce travail représente en
particulier une nouvelle approche de l’interprétation de l’environnement paléolacustre du
bassin de Makgadikgadi dans le contexte de la dépression du rift de Makgadikgadi-
Okavango-Zambezi.
Le Chapitre VII “Use of the geochemical and biological sedimentary record in establishing
palaeo-environments and climate change in the Lake Ngami basin, NW Botswana” a été
publié dans la revue Quaternary International en 2006. Cet article présente une étude de
reconstruction des paléo-niveaux lacustres du lac Ngami situé dans la région sud-ouest du
Bassin de l’Okavango. Deux tranchées réalisées dans le fond du lac asséché ont révélé sur
quelques mètres d’épaisseur une succession de faciès lacustres à fluvio-lacustres indiquant
d’importantes variations en terme de niveau lacustre et d’hydrologie. L’analyse géochimique
des sédiments du Lac Ngami et leur interprétation a été facilitée par le fait que ces sédiments
sont caractérisés par une fraction fine (fraction argileuse) beaucoup plus importante que les
sédiments silicoclastiques du Delta de l’Okavango au sens strict, très riches en quartz,
diminuant ainsi l’effet de dilution des autres minéraux par rapport au quartz. La géochimie
des sédiments lacustres renseigne sur les conditions de redox et les environnements de dépôt
dans le bassin, résultats supportés par une étude des diatomées. Cette étude renseigne
directement sur la qualité de l’eau dans le passé et, couplée à la géochimie des sédiments,
permet de mettre en évidence le lien direct entre les fluctuations du niveau du paléolac et le
climat pendant le Pléistocène et l’Holocène dans la région du Botswana. En outre, la séquence
de Ngami est perturbée par les mouvements tectoniques dans le bassin montré par le dépôt
rapide des sables vers 40 ka. Depuis la publication de ce travail, il a été découvert d’autres
preuves dans d’autres régions du delta d’un événement tectonique majeur vers 40 ka
(Ringrose and Huntsman-Mapila, unpublished data) qui a peut-être influencé la formation du
cône alluvial de l’Okavango.
Le Chapitre VIII, «Major and trace element geochemistry of the Lake Tanganyika sediments:
implications for late Quaternary climatic variability» est destiné à être soumis à la revue
Palaeogeography, Palaeoclimatology, Palaeoecology. L’enregistrement sédimentaire du Lac
Tanganyika (Bassin de Mpulungu) intègre la réponse du bassin à des perturbations externes
comme les changements climatiques passés et son étude permet de répondre à des questions
13
telles que l’impact du Dernier Maximum Glaciaire et du Dryas Récent sur l’environnement de
cette région. La séquence sédimentaire récente du Tanganyika est perturbée par des arrivées
de cendres volcaniques générées lors d’éruptions du volcan Rungwe situé au sud-est du bassin
de Mpulungu. L’identification de ces niveaux pyroclastiques aide à définir les régimes de
vents dans cette région d’Afrique, et par là même contribue à l’interprétation de la position de
la Zone de Convergence Intertropicale (ZCIT) et à la reconstruction des changements
climatiques.
Le papier intitulé «Characterization of arsenic occurrence in the water and sediments of the
Okavango Delta, NW Botswana», a été publié dans la revue Applied Geochemistry en 2006.
Ce papier ce trouve dans l’Appendix. Ce travail a été effectué à la suite de l’observation de
niveaux élevés en arsenic dans les eaux de plusieurs puits près de Maun, Botswana. Le but de
ce travail préliminaire était de caractériser les types de sédiments et les eaux qui révèlent de
tels niveaux élevés en arsenic. Les milieux de dépôt des sédiments chargés en arsenic ont été
définis, ainsi que les processus de transfert de l’arsenic contenu dans les sédiments dans l’eau
souterraine. Ce travail a des applications pratiques immédiates en ce qui concerne la gestion
des ressources en eau dans les pays désertiques.

14
INTRODUCTION (ENGLISH VERSION)
0.1 Statement of the problem This thesis is a study of fluvio-lacustrine sediments from two basins located within the East
African Rift. The zone of interest for this work is known in the literature under the name of
the “Southern Complex” or “Southwestern Branch” (Reeves, 1972; Mondeguer et al., 1989;
Modisi et al., 2000). The early initiation stage in the development of a continental rift is
characterized by the development of shallow half-graben basins where nascent faults exert a
primary control in the deposition, hence modification of catchment drainage. The two basins
selected for this study are considered to represent two successive stages in early rift
development. They are: 1) the Makgadikgadi-Okavango-Zambezi Basin located in the north-
west of Botswana and 2) the Mpulungu sub-basin which constitutes the extreme south
western basin of Lake Tanganyika (Tanzania and Zambia) (Figure I-1).
Climate and tectonics, in particular the relationship between the uplift of continental crust and
weathering, drives the processes which result in the formation sediment detritus and the ions
dissolved in water. The chemical composition of the aqueous component plays a role in the
biogeochemical cycling of downstream aquatic systems. The chemical composition of the
detrital fraction is determined to a large extent by the composition of the source rocks, the
degree of weathering, and the processes which occur during transport and accumulation of
sediments. Tectonic activity creates the source area uplift to form relief. It is the regional
climatic conditions (temperature and precipitation) which determine physical and chemical
weathering regimes of the source area, hence the nature of the sediment pile in the nascent rift
basins.
Tectonic processes give a distinctive geochemical signature to sediments in two ways: 1)
tectonic settings have characteristic provenance signals and 2) they are characterized by their
sedimentary processes (Rollinson, 1993). For sandstones, the relationship between the
geochemical composition, the provenance of sediments and the tectonic setting can be a
useful tool in elucidating information from ancient rocks. For instance, the use of major
(Bhatia, 1983; Roser and Korsch, 1986; 1988). and trace element (Bhatia and Crook, 1986)
compositions in diagnostic diagrams has been shown to be useful in determining tectonic
settings.
In order to test the accuracy of various diagnostic diagrams to elucidate the tectonic setting of
ancient sediments, they should be tested against modern sediments of a known tectonic
setting. This has been done in the past (Bhatia, 1983; Bhatia and Crook, 1986; Roser and

15
Korsch, 1986; Roser, 1996) but more data are required on recent sediments of known tectonic
setting to validate and refine these established discrimination criteria. We use data from
young (late Pleistocene to Holocene) sediments from a known tectonic setting, the East
African Rift System (EARS), an early stage rifted basin, to establish how well discriminant
diagrams and bivariate plots of tectonic settings categorize these sediments, thereby shedding
light on their tectonic history.
With respect to climate change work conducted on lake sediments in Africa, the focus to date
has been more on bio-indicators of climate such as pollen series (e.g. Vincens et al., 1993;
Vincens et al., 2005) and diatom assemblages (e.g. Gasse et al., 1989; Gasse et al., 2002) as
opposed to geochemical methods. To date, with the exception of organic geochemistry
methods of lake sediments (e.g. Talbot and Laerdal, 2000; Talbot et al., 2006), and work
conducted in West Africa and Lake Malawi (e.g. Schneider et al., 1997; Johnson et al. 2004)
sedimentary geochemistry has been a tool primarily used on ancient sedimentary suites in
Africa (e.g. Fedo et al., 1997).
Hypothesis: Can the interpretation of sedimentary inorganic geochemistry of
Quaternary sediments from the East African Rift contribute both to the detection of
climate change signals and to the understanding of tectonic evolution of the Southern
Complex?
In order to assess the hypothesis, a multidisciplinary approach was used with an emphasis on
geochemical methods, based on the following primary objectives:
a) to enhance our understanding of geochemical processes which occur during the formation
of sedimentary sequences (erosion – transport - accumulation) accumulating during the early
stage development in rift evolution;
b) to define sedimenatry and geochemical criteria which allow for the discrimination of
tectonic activity and climate changes throughout the evolution of these rift basins
c) reconstruct the tectonic and climatic environments which characterised these two regions of
the East African Rift throughout the late Pleistocene and Holocene.
The Makgadikgadi-Okavango-Zambezi (MOZ) Basin is an extensive intracontinental basin of
Plio-Pleistocene age. The evolution of this basin is controlled by a system of parallel faults in
the NE-SW direction (Figure I-2). Located within the larger MOZ basin is the Okavango
Basin which is a half-graben whose formation is linked to the development of NE-SW
trending faults, in particular the Gumare, Kunyere and Thamalakane faults. The Okavango
Delta is located within the central southern Africa climate zone however the catchment area
extends into the north-west of Angola, in the tropical climate zone.

16
The Lake Tanganyika Basin belongs to the western branch of the East African Rift and is
located within the tropics. The Mpulungu sub-basin is the most southerly of the seven sub-
basins which constitute the Tanganyika Basin (Tiercelin and Mondeguer, 1991) (Figure I-3).
The Mpulungu sub-basin is the most recent of the sub-basins of Lake Tanganyika. It was
formed between 4 and 2 million years ago, whereas the central segment of Tanganyika is
believed to have formed between 12 – 10 million years ago (Cohen et al., 2000). The
Mpulungu sub-basin and the associated Mweru and Mweru-Wantipa Lakes represent the most
northerly extent of basins within the “Southern Complex” of the East African Rift.
The East African Rift is famous for its numerous discoveries of fossil homonid sites which
has given rise to abundant literature on the region and the sites (Leakey et al., 1964 ; Patterson
and Howells, 1967; Johanson and Taieb, 1976; Tattersall, 1993; Prat et al., 2005). The
determination of the spatial and temporal extent of environmental changes brought about by
climatic variations and tectonic events linked to the development of the rift has become a key
issue in palaeo-anthropology today. These issues are crucial in order to better understand and
verify the different scenarios of evolution and migrations for different groups of Hominids
(Vbra, 1995; deMenocal et al., 2000; Behrensmeyer, 2006).
0.2 Organisation of the manuscript
All chapters in this thesis are written in English, and with the exception of Chapters I, II and
III, represent work already published in international journals or manuscripts in preparation
for submission to journals. At the beginning of Chapters IV – VIII a summary written in
French is presented.
Chapter I gives a detailed description of the two sites chosen for this study: the
Makgadikgadi-Okavango-Zambezi Basin located in north-west Botswana and the Mpulungu
sub-basin of Lake Tanganyika. In this chapter a description of the geological, climatic and
hydrological characteristics of each site is given.
Chapter II presents a review of published work on palaeo-climate for the region encompassing
the Mpulungu sub-basin to the north and the Makgadikgadi-Okavango-Zambezi Basin to the
south.
Chapter III presents an overview of the major geochemical methods employed in this work. In
addition, it provides the scientific justification behind choosing certain geochemical indicators
in this study.

17
Chapter IV entitled «Cryptic indicators of provenance from the geochemistry of the Okavango
Delta sediments, Botswana» was published in the journal Sedimentary Geology in 2005. This
article presents the results of a geochemical study conducted on siliciclastic sediments
sampled from boreholes drilled in the distal Okavango Delta, near Maun (Figure IV-1). The
geochemistry of major, trace and rare earth elements was used to identify provenance of the
sediments which currently fill the Okavango Delta alluvial fan. These sediments are
composed primarily of two fractions, one aeolian and one fluvial component. The aeolian
fraction is composed essentially of quartz which results in a strong dilution of the other
geochemical elements in the sediments. Quantitative modelling using representative rocks
from the catchment as potential source rocks was carried out. The results confirm that
Proterozoic granitoid–gabbro and related volcanic and ortho-metamorphic rock complexes
exposed in NW Botswana and adjacent Angola and Namibia are the source rocks of the
sediment component which was mixed with aeolian sand and interacted with a variable
proportion of diagenetic carbonates to produce the Okavango sediments.
Chapter V entitled «Sediment geochemistry, provenance and tectonic setting: Application of
discrimination diagrams to very early stages of intracontinental rift evolution, with examples
from the Okavango and Southern Tanganyika rift basins ». This mansucript is being prepared
for submission to the Journal of African Earth Sciences. The tectonic setting and the stages of
evolution of the MOZ basin and the Mpulungu sub-basin within the context of a continental
rift has been investigated in earlier work (Tiercelin and Mondeguer, 1991; Modisi et al., 2000;
Ringrose et al., 2005). The geochemical characterisitcs of the Okavango and Mpulungu
sediments are used in this mansucript as markers in the stages of tectonic evolution of these
two rift basins. In this work, two new fields within the classical discrimination diagrams for
tectonic setting are proposed. One field represents the nascent stages of early rift development
illustrated by the Okavango Delta alluvial fan and the second stage represents and successive,
more mature stage, represented by the Mpulungu lacustrine basin. The significance of this
work is in the possible future use of these diagrams to elucidate the stage of rifting in ancient
sediments.
Chapter VI is entitled «Sedimentological and geochemical evidence for palaeo-environmental
change in the Makgadikgadi subbasin in relation to the MOZ rift depression, Botswana».
This work was published in the journal Palaeogeography, Palaeoclimatology and
Palaeoecology in 2005. This chapter represents the result of a multidisciplinary study
including field sedimentology and geomorphological techniques combined with geochemical
methods and dating to help constrain palaeo-climatic events. This work contributes to the
identification of palaeoenvironmental markers in north west Botswana during the Pleistocene.
This work represents a new approach to the interpretation of palaeoenvironments in the
Makgadikgadi basin within the context of the larger MOZ rift depression
18
Chapter VII “Use of the geochemical and biological sedimentary record in establishing
palaeo-environments and climate change in the Lake Ngami basin, NW Botswana” was
published in the journal Quaternary International en 2006. This article presents the results of
a study to reconstruct palaeoenvironments and lake levels in the Lake Ngami basin, located to
the south-west of the Okavango Delta. Two trenches dug into the dry lake bed revealed over
several meters of thickness, a succession of lacustrine to fluvio-lacustrine facies which
demonstrate important variations in terms of lake levels and hydrological input to the sub-
basin. The geochemical analysis of the Lake Ngami sediments and the subsequent
interpretation was facilitated by the fact that the Lake Ngami sediments are characterised by a
fine fraction (clay fraction) as a result of being a drainage terminus, much more significant
than the through-flow fluvial siliciclastic sediments of the Okavango Delta. The geochemistry
of the lacustrine sediments therefore provides more detailed evidence of palaeo-redox
conditions which when combined with a study of the diatoms, contribute significant
information on water quality and lake levels during the late Pleistocene and Holocene in the
Lake Ngami Basin.
Chapter VIII, «Major and trace element geochemistry of the Lake Tanganyika sediments:
implications for late Quaternary climatic variability» is being prepared for submission to
Palaeogeography, Palaeoclimatology, Palaeoecology. The sedimentary record of Lake
Tanganyika (Mpulungu Basin) records the response of the basin to external perturbations such
as climate change and the study of this record enhances our understanding of the impact of
climatic events such as the Last Glacial Maximum and the Younger Dryas on the environment
of the region. The sedimentary sequence of Lake Tanganyika is interrupted by the input of
volcanic ash generated from eruptions of the Rungwe volcanoes located to the south-east of
the Mpulungu Basin. The identification of the pyroclastic layers in the sedimentary sequence
helps in the reconstruction of wind regimes in the region which in turn is related to the
position of the ITCZ and the reconstruction of past climate.
The paper entitled «Characterization of arsenic occurrence in the water and sediments of the
Okavango Delta, NW Botswana», was published in the journal Applied Geochemistry in 2006.
This paper is located in Appendix 1. This work was conducted following a preliminary
investigation of water quality in the Okavango Delta which revealed the presence of elevated
arsenic in some of the boreholes located around Maun. The aim of this work was to
characterize the types of sediments and waters which contain elevated arsenic. The
sedimentary environment under which sediments with elevated arsenic were discussed as well
as the process of the transfer of arsenic from the sediments into the groundwater. This work
has important practical outcomes related to water resource management in a semi-arid
country, such as Botswana.
References
19
Behrensmeyer, A.K., 2006. Climate change and human evolution. Science 311, 476-478. Bhatia, M.R., 1983. Plate tectonics and geochemical composition of sandstones. Journal of
Geology 91, 611-627. Bhatia, M.R., Crook, K.A.W., 1986. Trace element characteristics of graywackes and tectonic
setting discrimination of sedimentary basins. Contributions to Mineralogy and Petrology 92, 181-193.
Cohen, A.S., Scholz, C.A., Johnson T.C., 2000. The international decade of East African Lakes (IDEAL) drilling initiative for the African Great Lakes, Journal of Paleolimnology, 24 (2), 231-235.
deMenocal, P., Ortiz, J., Guilderson, T., Adkins, J., Sarnthein, M., Baker, L., Yarusinsky, M., 2000. Abrupt onset and termination of the African humid period: rapid climate responses to gradual insolation forcing. Quaternary Science Reviews 19, 347-361.
Fedo, C.M., Eriksson, K.A., Krogstad, E.J., 1996. Geochemistry of shales from the Archaean (~3.0 Ga) Buhwa Greenstone Belt, Zimbabwe: implications for provenance and source-area weathering. Geochim. Cosmochim. Acta 60, 1751–1763.
Gasse, F., Lédée, V., Massault, M., Fontes, J.Ch., 1989. Water-level fluctuations of Lake Tanganyika in phase with oceanic changes during the last glaciation and deglaciation. Nature 342, 57-69.
Gasse , F., Barker, P., Johnson,T.C., 2002. A 24,000 yr diatom record from the northern basin of Lake Malawi. In: Odada E.O., and Olago, D.O. (eds), The East African Great lakes: Limnology, Palaeolimnology and Biodiversity. Dordrecht, Kluwer, pp. 393-414.
Johanson, D.C., Taieb, M., 1976. Plio-Pleistocene hominid discoveries in Hadar, Ethiopia. Nature 260, 293-297.
Leakey, L.S.B., Tobias, P.V., Napier, J.R., 1964. A new species of the genus Homo from Olduvai Gorge. Nature 202, 7-9.
Modisi, M.P., Atekwana, E.A., Kampunzu, A.B., Ngwisanyi, T.H., 2000. Rift kinematics during the incipient stages of continental extension: evidence from nascent Okavango rift basin, northwest Botswana. Geology 28, 939– 942.
Mondeguer, A., Ravenne, C., Masse, P., Tiercelin, J-J., 1989. Sedimentary basins in an extension and strike-slip background: the South Tanganyika Trough complex, East African rift. Bull. Soc. Geol. France 8 (3), 501-522.
Mondeguer, A., 1991. Bassin sedimentaires en contexte extensive et decrochant: L’example du “Complexe des fosses sud-Tanganyika”, Rift Est- Africain. Morphostructure et sedimentation. PhD thesis. L’Universite de Bretagne Occidentale.
Partridge, T.C., Scott, L., Hamilton, J.E., 1999. Synthetic reconstructions of southern African environments during the Last Glacial Maximum (21-18 kyr) and the Holocene Altithermal, (8-6 kyr). Quaternary International 57/58, 207-214.
Patterson, B., Howells, W.W., 1967. Hominid humeral fragment from Early Pleistocene of Northwestern Kenya. Science 156, 64-66.
Prat, S., Brugal, J-P., Tiercelin, J-J., Barrat, J-A., Bohn, M., Delagnes, A., Harmand, S., Kimeu K., Kibunjia, M., Texier, P-J., Roche, H., 2005. First occurrence of early Homo in the Nachukui Formation (West Turkana, Kenya) at 2.3-2.4 Myr. Journal of Human Evolution 49, 230-240.
Reeves, C.V., 1972. Rifting in the Kalahari? Nature 237, 95-96. Ringrose, S., Huntsman-Mapila, P., Kampunzu, H.,Downey, W.D. Coetzee S., Vink, B.,
Matheson W, Vanderpost, C., 2005. Geomorphological and geochemical evidence for palaeo-environmental change in the Makgadikgadi sub-basin, in relation to the MOZ rift depression, Botswana. Palaeogeography, Palaeoclimatology and Palaeoecology 217, 265-287.
Roser, B.P., Korsch, R.J., 1986. Determination of tectonic setting of sandstone-mudstone suites using SiO2 content and K2O/Na2O ratio. Journal of Geology 94, 75-83.
Roser, B.P., Korsch, R.J., 1988. Provenance signatures of sandstone-mudstone suites determined using discriminant function analysis of major-element data. Chemical Geology 67, 119-139.
Schneider, R.R., Price, B., Muller, P.J., Kroon, D., Alexander, I., 1997. Monsoon related variations in Zaire (Congo) sediment load and influence of fluvial silicate supply on marine productivity in the east equatorial Atlantic during the last 200,000 years. Paleoceanography 12 (3) 463-481.

20
Talbot, M.R., Jensen, N.B., Laerdal, T., Filippi, M.L., 2006. Geochemical responses to a
major transgression in giant African lakes. Journal of Paleolimnology. 35 (3), 467-489.
Talbot, M.R., Laerdal, T., 2000. The Late Pleistocene-Holocene palaeolimnology of Lake Victoria, East Africa, based upon elemental and isotopic analyses of sedimentary organic matter. Journal of Paleolimnology 23, 141-164.
Tattersall, I., 1993. The Human Odyssey: Four Million Years of Human Evolution. Prentice
Hall, New York, 191 pp. Tiercelin, J-J, Mondeguer, A., 1991. The geology of the Tanganyika Trough. In: Coulter
G.W. (ed), Lake Tanganyika and its life. Oxford University Press, Oxford, pp. 7-48. Tyson, P.D., Preston-Whyte, R.A., 2000. The weather and climate of Southern Africa. Oxford
University Press, Cape Town, 396 pp. Vrba, E.S., 1995. In: Paleoclimate and evolution with emphasis on human origins. E.S. Vrba,
G.H. Denton, T.C. Partridge, L.H. Burckle (eds), Yale University Press, New Haven, CT, pp.24-25.
Vincens, A., Chalié, F., Bonnefille, R., Guiot, Tiercelin, J-J., 1993. Pollen-derived rainfall and temperature estimates from lake Tanganyika and their implications for late Pleistocene water levels. Quaternary Research 40, 343-350.
Vincens, A., Buchet, G., Williamson, D., Taieb, M., 2005. A 23,000 yr pollen record from Lake Rukwa (8oS, SW Tanzania): New data on vegetation dynamics and climate in Central Eastern Africa. Review of Palaeobotany and Palynology 137, 147-162.

21
I. STUDY SITE The East African Rift System (EARS) is a vast Cenozoic structure with a length of more than
4500 km, extending from Afar in the north to the south of the African continent (Botswana,
Mozambique) (Figure I-1). It is a major intracontinental extension zone, with two main
branches characterized by N-S to NNE-SSW oriented deep troughs, which are mainly half-
grabens.
The Eastern Branch, with a length of 1800 km, extends from the Afar Depression to the
Kenya Rift and the North Tanzanian Divergence. The early phases of rifting characterizing
this branch are dated from Eocene - Lower Oligocene and resulted in major fissural volcanic
activity and half-graben development in northern Kenya and southern Ethiopia (Morley et al.,
1992; Ebinger and Ibrahim, 1994; Ebinger et al., 2000; Tiercelin et al., 2004).
The Western Branch, with a length of 2500 km, is more complex in structure and includes the
Lake Tanganyika and Lake Malawi Troughs, which are the two largest and deepest structures
of the EARS. Compared to the Eastern Branch, the Western Branch is marked by having only
a few volcanic provinces which are: Ruwenzori, Virunga, Kivu and Rungwe (Figure I-1).
Initial volcanic activity occurred in these regions at about 8 Ma (Ebinger et al., 1989). Two
major NW-SE-trending transcurrent fault zones, the Aswa Fault Zone and the TRM
(Tanganyika-Rukwa-Malawi) Fault Zone, act as links between the Eastern and Western
Branches, and between segments of the Western Branch, respectively. These transverse
structures are recognized as Late Precambrian features reactivated during the Cenozoic rifting
phases (McConnell, 1980).
To the southwest, a suite of half-graben basins extend from the southern Tanganyika-northern
Malawi region in a NE-SW direction, forming the “Southern Complex” (Mondeguer et al.,
1989; Tiercelin and Mondeguer, 1991) (Figure I-1). This Southern Complex, which includes
the Makgadikgadi-Okavango-Zambezi (MOZ) basin, differs from the two other branches of
the EARS as it is much younger than the other segments and has no record of volcanic
activity during the Cenozoic.

22
Figure I 1. Map of East African Rift System showing the Western and Eastern Branches and the Southern Complex. Study areas are located within boxes.
23
The early initiation stage in the development of a continental rift is characterized by the
development of shallow half-graben basins where nascent faults exert a primary control in the
evolution of drainage catchment formation (Gawthorpe and Leeder, 2000). This stage is
illustrated by the present Okavango alluvial fan, located within the larger MOZ basin. The
Okavango Delta is a broad subsiding half-graben occupied by an alluvial fan, strongly controlled
by fault growth (Modisi, 2000). The immediate successive stage concerns the development of
deeper basins where swamps and shallow lacustrine environments (<50 m water depth) occur, as
the result of fault growth and propagation, and initiation of basin subsidence, represented by the
larger MOZ basin. A more mature stage concerns the development of well-defined, actively
subsiding half-graben basins, where propagation and interaction between fault segments lead to
basin linkage and strong control of drainage. Wider and deeper lacustrine environments
characterize this stage, which is illustrated by the southern Mpulungu sub-basin of Lake
Tanganyika.
Samples for this study were obtained from northern Botswana, within the Makgadikgadi-
Okavango-Zambezi depression and from the Mpulungu sub-basin in Lake Tanganyika. Both sites
are described in detail below.
I.1 The Makgadikgadi-Okavango-Zambezi Basin
Fluvio-lacustrine deposition in northern Botswana has mainly taken place within a large structural
depression considered as a southwesterly propagating extension of the EARS (Figure 1-1). This
rift depression was drained and filled by southeasterly flowing rivers on a number of occasions
during the Tertiary and Pleistocene as the area was faulted and half grabens developed (Cooke,
1980; Mallick et al., 1981; Modisi et al., 2000). The MOZ (Makgadikgadi–Okavango–Zambezi)
depression (Figure I-2) is controlled by a series of NE–SW normal faults related to rifting which
reactivated Proterozoic and Karoo structures (Baillieul, 1979; Smith, 1984; Modisi et al., 2000).
Tectonic activity along the same trend resulted in uplift along the Zimbabwe–Kalahari axis
possibly during the late Pliocene (Partridge and Maud, 2000; Moore and Larkin, 2001) causing
the impoundment of proto Okavango, Kwando and upper Zambezi drainage and the development
of the Makgadikgadi (MSB), Ngami and Mababe subbasins (Cooke, 1980; Ringrose et al., 2002).

24
Figure I 2. The Okavango Delta within the MOZ rift depression. Extent of rift depression is shown by the dashed lines.

25
The nascent Okavango Delta alluvial fan is located within the Kalahari Basin, which is a shallow
intracontinental basin. Aeromagnetic and seismic refraction studies suggest that the maximum
thickness of sediment, in excess of 300 m, occurs in northern Namibia and in the Okavango
graben in Botswana (Reeves, 1978; Modisi et al., 2000). The major part of the catchment area is
covered by unconsolidated to loosely consolidated, chiefly reworked aeolian sand of the presently
active Kalahari Basin. The Okavango Delta sediments represent the youngest (Quaternary)
stratigraphic unit of the Kalahari sedimentary basin. Potential sources of the Okavango Delta
sediments are mainly Proterozoic granitoids, gabbros and related volcanic and orthometamorphic
rocks exposed in the catchment area in Angola, northern Namibia and northern Botswana.
Samples for the Makgadikgadi-Okavango-Zambezi study include sediment and water samples
from boreholes drilled in the distal Okavango Delta, calcrete samples from the shorelines of
palaeo-lake Makgadikgadi, and sediment samples from an excavation pit dug in Lake Ngami.
I.2 Lake Tanganyika
The Lake Tanganyika Trough (3° 30’-8° 50’ S, 29°-31°20’ E) is the largest structure of the
Western Branch of the EARS (Figure I-1). It is structurally divided into two main basins, the
northern basin orientated N0o, and the southern basin oriented in the N150o direction, separated
by N130-150°-trending horst block called the Kalemie-Mahali shoal (Mondeguer, 1991) (Figure
I-3). These two basins are occupied by Lake Tanganyika, which is 650 km long and the deepest
of the African rift lakes at 1470 m.
The basin geometry and stratigraphy of the Tanganyika Basin were recorded by the seismic
reflection studies of Projects PROBE and GEORIFT (Rosendahl et al., 1986, 1988; Tiercelin and
Mondeguer, 1991; Lezzar et al., 1996). The central part of the basin is known to contain a > 5 km
thick sequence of rift-related sediments (Rosendahl et al., 1986; Morley, 1988). Age estimates by
Cohen et al. (1993) suggest that the central segment of the Tanganyika Basin began to form
between 9 and 12 Ma, whereas the northern basin, characterized by a 4-km-thick sequence of
sediments (Rosendahl et al., 1986; Ebinger, 1989), formed more recently, at 7-8 Ma. The
southern end of the basin, known as the Mpulungu sub-basin (Mondeguer, 1991), contains a 2.5
km thick pile of rift sediments with an estimated age of 4-2 Ma.

26
Figure I 3. The structure and hydrology of Lake Tanganyika Basin. Key 1-littoral platforms; 2-transverse shoals; 3-sub-basin deep zones (after Tiercelin and Mondeguer, 1991).

27
The Mpulungu sub-basin is 100 km long, 25 km wide with up to 800 m water depth (Figure I-3)
The sub-basin is delineated by three groups of faults: a main group trending N150° forming the
Mpulungu Border Fault characterized by an important vertical throw of at least 2000 m, a second
group of faults oriented N70o that developed on the western flank of the Mpulungu Basin, and a
minor group of faults oriented N30°, respectively. The two main groups of faults deeply intersect
the Upper Precambrian tabular terrains of the northern side of the Zambian craton (also known as
Bangweulu Block) (Unrug, 1984). The craton is of Middle Proterozoic age (around 1820 Ma
(Brewer et al., 1979)), and mainly composed of granites, granitoides and metavolcanites; 2) the
Mporokoso Group formed of conglomerates, sandstones, quartzites and shales; and 3) the
Katanga super-group, that include conglomeratic and quartzitic series overlain by carbonate series
(Daly and Unrug, 1983). To the south-east of the Mpulungu sub-basin is the Rungwe volcanic
province (Figure VI-3 a), which is the most southern eruptive centre in the EARS western branch.
Volcanic activity in the Rungwe started in the Late Miocene (~ 8 Ma) and remained active during
the late Pleistocene and Holocene with major pyroclastics eruptions (Harkin, 1960; Ebinger et al.,
1989; Williams et al., 1993).
Lake Tanganyika sediments were recovered from the Mpulungu sub-basin duirng the GEORIFT
Project of Elf-Aquitaine. Several Kullenberg piston cores were collected in December 1985 in the
central part of the Mpulungu sub-basin and on the platform/slope of Cameron Bay (Mondeguer,
1991). Sediments from two cores have been considered for this study: the MPU-10 core, 8.09 m
long, was collected from a water depth of 422 m in the central part of the basin, and the 11.19 m
long MPU-3 core was collected from a water depth of 140 m at the limit of the slope between
Cameron Bay and the Mpulungu sub-basin.
I.3 Regional climate
Rainfall in tropical Africa is strongly influenced by the seasonal migration of the Intertropical
Convergence Zone (ITCZ) to the north and south of the equator (Figure I-4). During austral
winter, the ITCZ migrates northwards and during this dry season, south-eastern Africa is
dominated by SE winds (Lindesay, 1998). In the austral summer, when the ITCZ migrates to its
southward position, north winds bring moisture to this region. In south-western Africa, the wet
ITCZ and the dry high-pressure system over the South Atlantic are the two major systems that
control today’s climate. When the ITCZ moves to its southward position in the austral summer,

28
the moist north winds replace the dry westerly wind system. The strength of African monsoon
and variations of the mean ITCZ position over tropical Africa are mainly driven by the earths 23
kyr precessional cycle which results in changes in the amount of solar radiation received at low
latitudes (deMenocal et al., 2000; Tyson and Preston-Whyte, 2000; Baker et al., 2001).
Figure I 4. Present ITCZ seasonal migration over Africa shown as dark grey band. Predominant wind directions are represented as black arrows. Figure from Grand Atlas du Continent Africain (1973).
Flooding in the Okavango Delta is influenced by both local rainfall and in-flow from the
catchment in the Angolan highlands. Under the current climatic conditions, local rainfall over the
Okavango Delta is influenced by the anticyclonic conditions that dominate the interior of
southern Africa and rainfall patterns are subject to an 18 year oscillation pattern (McCarthy et al.,
2000). The Angolan catchment climate is currently strongly influenced by the ITCZ and the
South Atlantic high pressure systems (Figure I-4). The Okavango River derives its water from
two major tributaries, the Cubango River in the west and the Cuito River in the east. Rainfall over
29
the Cubango catchment shows an 18-year rainfall oscillation which is out of phase with that of
central southern Africa (McCarthy et al., 2000).
In Lake Tanganyika, there is a single rainy season in the catchment area from November to April
with a mean annual rainfall of 1000-1100mm (Vincens, 1991). South easterly winds predominate
during the dry season, resulting in seasonal upwelling of deep water at the southern end of Lake
Tanganyika (Vincens, 1991). During the rainy season, solar heating forces air to rise through
convection, resulting in the African monsoon.
References
Baillieul, T.A., 1979. A reconnaisance survey of the cover sands in the Republic of Botswana. Journal of Sedimentary Petrology 45,494-503.
Baker, P.A., Rigsby, C.A., Seltzer, G.O., Fritz, S.C., Lowenstein, T.K., Bacher, N.P., Veliz, C., 2001. Tropical climate changes at millennial and orbital timescales on the Bolivian Altiplano. Nature 409, 698-701.
Brewer, M.S., Halsam, H.W., Darbyshire, P.F.P., Davis, A.E., 1979. Rb/Sr age determinations in the Bangweulu Block, Luapula Provnice, Zambia. Inst. Geol. Sci. London 79 (5), 11 pp.
Carney, J.N., Aldiss, D.T., Lock, N.P., 1994. The geology of Botswana. Geol. Surv. Dep., Lobatse, Botswana, p. 113.
Cohen, A.S., Soreghan, M.J., Scholz, C.A., 1993. Estimating the age of formation of lakes: an example from Lake Tanganyika, East African Rift system. Geology 21, 511-514.
Cooke, H.J., 1980. Landform evolution in the context of climatic changes and neotectonics in the middle Kalahari of north-central Botswana. Trans. Inst. Brit. Geog., NS 5, 80-99.
Daly, M.C., Unrug, R. 1983. The Muva Supergroup of northern Zambia: a craton to mobile belt sedimentary sequence. Transaction of the Geological Society of South Africa 85, 155-165.
deMenocal, P., Ortiz, J., Guilderson, T., Adkins, J., Sarnthein, M., Baker, L., Yarusinsky, M., 2000. Abrupt onset and termination of the African humid Period: rapid climate responses to gradual insolation forcing. Quaternary Science Reviews 19, 347-361.
Ebinger, C.J., 1989. Tectonic development of the western branch of the East African Rift system. Bulletin of the Geological Society of America 101, 885-903.
Ebinger, C.J., Deino, A.L., Drake, R.E., Tesha, A.L., 1989. Chronology of volcanism and rift basin propogation: Rungwe volcani province, East Africa: Journal of Geophysical Research 94, 15785-15803.
Ebinger, C.J., Ibrahim, A., 1994. Multiple episodes of rifting in Central and East Africa: A re-evaluation of gravity data. Geological Rundschau 83, 689-702.
Ebinger, C.J., Yemane, T., Harding, D.J., Tesfaye, S., Kelley, S., Rex, D.C., 2000. Rift deflection, migration, and propagation: Linkage of the Ethiopian and eastern rifts, Africa. Bulletin of the Geological Socciety of America 112, 163-176.
Gawthorpe, R.L., Leeder, R., 2000. Tectono-sedimentary evolution of active extensional basins. Basin Research 12, 195-218.
Harkin, D.A., 1960. The Rungwe volcanics at the northern end of Lake Nyasa. Mem. Geol. Surv. Tanganyika, II: 172pp.

30
Kampunzu, A.B., Bonhomme, M.G., Kanika, M., 1998. Geochronology of volcanic rocks and evolution of the Cenozoic Western branch of the East African rift system. Journal of African Earth Sciences 26, 441–461.
Kampunzu, A.B., Armstrong, M.P., Modisi, M.P., Mapeo, R.B., 1999. The Kibaran belt in southwest Africa: ion microprobe U– Pb zircon data and definition of the Kibaran Ngami belt in Botswana, Namibia and Angola. Gondwana Res. 2, 571–572.
Kampunzu, A.B., Armstrong, R.A., Modisi, M.P., Mapeo, R.B.M., 2000. Ion microprobe U–Pb ages on single detrital zircon grains from Ghanzi Group: implications for the identification of a Kibaran-age crust in northwestern Botswana. Journal of African Earth Sciences 30, 579–587.
Le Gall, B., Tshoso, G., Jourdan, F., Fe´raud, G., Bertrand, H., Tiercelin, J.J., Kampunzu, A.B., Modisi, M., Dyment, J., Maia, M., 2002. Ar–Ar geochronology and structural data from the Okavango giant mafic dike swarm, Karoo large igneous province, N Botswana. Earth Planetary Science Letters 202, 595–606.
Lezzar, K.E., Tiercelin, J.J., De Batist, M., Cohen, A.S., Bandora, T., van Rensbergen, P., Le Turdu, C., Wafula, M., Klerk, J., 1996. New seismic stratigraphy and Late Tertiary history of the North Tanganyika Basin, East African Rift system, deduced from multifold reflection and high resolution seismic data and piston core evidence: Basin Research 8, 1-28.
Lindesay, J.A., 1998. Present climates of Southern Africa. In: Hobbs, J.E., Lindesay, J.A., and Bridgeman, H.A., (eds), Climates of the Southern Continents: Present, Past and Future. John Wiley and Sons, New York, pp. 5-62.
Mallick, D.I.J, Habgood F, Skinner AC. 1981. A geological interpretation of Landsat imagery and air photography of Botswana. Overseas Geological and Mineral Resources, London, 56, 1-36.
Mapeo, R.B.M., Armstrong, R.A., Kampunzu, A.B., 2000. Ages of detrital zircon grains from Neoproterozoic siliciclastic rocks in Shakawe area: implications for the evolution of the Proterozoic crust in northern Botswana. South African Journal of Geology 103, 156–161.
Mapeo, R.B.M., Armstrong, R.A., 2001. Ion microprobe U–Pb zircon geochronology of gneisses from the Gweta borehole, NE Botswana: implications for the Paleoproterozoic Magondi belt in southern Africa. Geological Magazine 138, 299–308.
McCarthy, T.S., Cooper, G.R.J., Tyson, P.D., Ellery, W.N., 2000. Seasonal flooding in the Okavango Delta, Botswana—recent history and future prospects. South African Journal of Science 96, 25–33.
McConnell, R.B., 1980. A resurgent taphrogenic lineament of Precambrian origin in eastern Africa. Journal of the Geological Society of London 137, 483-489.
Modisi, M.P., 2000. Fault system of the southeastern boundary of the Okavango Rift, Botswana. Journal of African Earth Sciences 30, 569– 578.
Modisi, M.P., Atekwana, E.A., Kampunzu, A.B., Ngwisanyi, T.H., 2000. Rift kinematics during the incipient stages of continental extension: evidence from nascent Okavango rift basin, northwest Botswana. Geology 28, 939– 942.
Mondeguer, A., Ravenne, C., Masse, P., Tiercelin, J.J., 1989. Sedimentary basin in an extension and strike-slip background : the South Tanganyika troughs complex, East African Rift. Bull. Soc. Geol. Fr., 8 (3), 501-522.
Mondeguer, A., 1991. Bassin sedimentaires en contexte extensive et decrochant: L’example du “Complexe des fosses sud-Tanganyika”, Rift Est- Africain. Morphostructure et sedimentation. PhD thesis. L’Universite de Bretagne Occidentale.
Moore A. E., Larkin, P. 2001. Drainage evolution in south-central Africa since the breakup of Gondwana. South African Journal of Geology, 104, 47-68.
Morley, C.K., 1988. Variable extension in Lake Tanganyika. Tectonics 7, 785-801.

31
Morley, C.K., Wescott, W.A., Stone, D.M., Harper, R.M., Wigger, S.T., Karanja, F.M., 1992. Tectonic evolution of the northern Kenyan Rift. Journal of the Geological Society of London 149, 333-348.
Partridge, T.C., Maud, R.R., 2000. The Cenozoic of southern Africa. New York: Oxford University Press, 406 pp.
Reeves, C.V., 1978. The gravity survey of Ngamiland: 1970–71. Geol. Surv. Botsw., Bull. 11, 84 pp.
Ringrose, S., Huntsman-Mapila, P., Kampunzu, A.R., Matheson, W., Downey, W.S., Vink, B., 2002. Geomorphological evidence for MOZ palaeo-wetlands in northern Botswana; implications for wetland change. Presentation to Monitoring of Tropical and Sub-tropical Wetlands Conference, December 2002, Maun, Botswana, Published by HOORC and the University of Florida, Centre for Wetlands.
Rosendahl, B.R., Reynolds, D.J., Lorber, P.M., Burgess, C.F., McGill, J., Scott, D., Lambiase, J.J., Derksen, S.J., 1986. Structural expressions of rifting. Lessons from lake Tanganyika, Africa. In: Sedimentation in the African Rifts (eds) Frostick, L.E., Renaut, R.W., Reid, I., Tiercelin, J-J.) Geol. Soc. London Spec. Publ. 25, 127-139.
Rosendahl, B.R., Versfelt, J.W., Scholz, C.A., Buck, J.E., Woods, L.D., 1988. Seismic atlas of Lake Tanganyika, East Africa: Project PROBE Geophysical Atlas Series, Folio 1, Durham, Duke University.
Smith, R.A., 1984, Lithostratigraphy of the Karoo stratigraphy in Botswana, Botswana Geological Survey Bulletin, Lobatse, Botswana, 26, 34pp.
Tiercelin, J-J, Mondeguer, A., 1991. The geology of the Tanganyika Trough. In: Coulter G.W. (ed), Lake Tanganyika and its life. Oxford University Press, Oxford, pp. 7-48.
Tiercelin, J-J., Potdevin, J-L., Morley, C.K., Talbot, M.R., Bellon, H., Rio, A., Le Gall, B., Vetel, W., 2004. Hydrocarbon potential of the Meso-Cenzoic Turkana Depression, northern Kenya. I. Reservoirs: depositional environments, diagenetic characteristics, and source rock-reservoir relationships. Marine and Petroleum Geology 21, 41-62.
Tyson, P.D., Preston-Whyte, R.A., 2000. The weather and climate of Southern Africa. Oxford University Press, Cape Town, 396pp.
Unrug, R., 1984. The mid-proterozoic Mporokoso group of northern Zambia: Stratigraphy, sedimentation and regional position. Precambrian Research 24, 99-121.
Vincens, A., 1991. Late Quaternary vegetation history of the South-Tanganyika Basin. Climatic implications in South Central Africa. Palaeogeography, Palaeoclimatology, Palaeoecology 86, 207-226.
Williams, T.M., Henney, P.J., Owen, R.B., 1993. Recent eruptice episodes of the Rungwe Volcanic Field (Tanzania) recorded in the lacustrine sediments of the Northern Malawi Rift. Journal of African Earth Sciences, 17, 33-39.

32
II. SYNTHESIS OF PALEOCLIMATIC DATA FOR THE REGION
This chapter provides an overview of the important climatic and environmental changes in the
late Quaternary for the region encompassing southern Lake Tanganyika and the Okavango Delta.
Tectonic uplift of the subcontinent occurring during the Tertiary and Early Quaternary had
palaeoclimatic consequences as surface temperatures decreased by approximately 0.6 – 0.7oC. In
addition, a major climatic shift took place across the Mio-Pliocene boundary, with the west coast
becoming drier and the tropical conditions developing in the eastern subcontinent (Tyson and
Preston-Whyte, 2000). During the Quaternary, oxygen isotope stages are assigned to successive
alternating interglacial and glacial periods. The Quaternary is generally characterized by
relatively short successions of glacials and interglacial (Tyson and Preston-Whyte, 2000). The
period from 125 ka to around 16 ka BP in the southern hemisphere was characterized by a series
of rapid warming stages followed by slow declines to progressively lower minima. The deuterium
isotopic record from the Antarctic Vostok ice core illustrates this sequence, with the last
minimum occurring at the Last Glacial Maximum (LGM) at around 20 ka BP. Orbit-related
parameters such as eccentricity, obliquity and precession constitute the major forcing of the
climatic periodicities. High lake levels at 135 ka , 110 ka, 90 ka and 66 ka BP in Lake Naivasha,
East Africa coincide with the precessional cycles (Trauth et al., 2001). Marine core data off the
coast of KwaZulu-Natal, South Africa reflect the 100 kyr Milankovitch forcing events (Prell et
al., 1979). The impact on climate of the precessional cycle have been determined from sediments
of the Tswaing impact crater lake in the northern part of South Africa (Partridge et al., 1997;
Kirst et al. 1999; Tyson et al., 2002). Evidence from the MOZ (Makgadikgadi-Okavango-
Zambezi) basin in northern Botswana also indicates some co-incidence with the last 120 kyr wet
cycles as suggested by recent TL dates (Ringrose et al., 2002, 2005).
II.1 Last Glacial Maximum
The hydrological record reconstructed from sediments from tropical African lakes has shown that
most of the East African lakes from the ITCZ region were at a low level (Beuning et al., 1997;
Gasse et al., 1989; Gasse et al., 2002; Barker and Gasse, 2003, Scholz et al., 2003; Talbot et al.,
2006) during the cooler and drier Last Glacial Maximum (LGM). During the LGM (23-18 ka BP)
generally dry conditions prevailed in both hemispheres associated with lower tropical land and

33
sea surface temperatures. Sedimentological studies from Tswaing Crater indicate that whilst
enhanced summer rainfall is predicted due to orbital forcing during the LGM, grain-size
(Partridge et al., 1997) and diatom data (Metcalfe, 1999) indicate increased aridity. High
resolution seismic profiles in Lake Tanganyika indicate a LGM low stand ca. 250-300m below
current lake levels (Tiercelin and Mondeguer, 1991). This is supported by a multi-proxy study of
a core from central Lake Tanganyika where Scholz et al. (2003), from abundances of benthic
diatoms, infer that the lake was about 350 m lower than present during the LGM. South east
African lakes Malawi and Rukwa indicate from diatom records, a negative water balance during
the LGM (Johnson et al., 2004; Barker et al., 2002). Pollen records from Lake Rukwa spanning
the last 23 kyr indicate that between 23 and 20 kyr cal BP vegetation indicates cooler and
probably drier climatic conditions than today (Vincens et al., 2005). Pollen records from cores in
the Mpulungu sub-basin suggest a mean temperature decrease of about 4.2oC and mean annual
precipitation decrease of about 180 mm/yr (Vincens et al., 1993). The LGM was a period of
increased aridity and cooler conditions in the Kalahari region (Partridge et al., 1999; Lancaster,
1989; Thomas and Shaw, 2002), with a minimum of 60% less rainfall than present. Pollen and
microfossil data from a marine core off southwest Africa suggest the temperatures were 4-6ºC
lower than today and that the winter rainfall regime shifted northwards at this time (Shi et al.,
2000).
However, during the LGM, summer insolation, which is under the control of orbital precession
(Berger, 1978), was at a maximum in the southern tropics, and might normally have been
expected to strengthen the summer African monsoon (Kutzbach and Liu., 1997), resulting in
higher rainfall inland. Recent studies from Lake Masoko have suggested water levels in this
crater basin were higher, reflecting a moister climate locally at this time (Garcin et al., 2006b). In
addition, work conducted at Lake Ngami, situated in NW Botswana has suggested that this basin,
which receives inflow from Angola, was at a highstand during the LGM (Huntsman-Mapila et al.,
2006). Reconstructions of the equatorial river discharge, on the other hand, indicate significantly
lower discharge and dry conditions in the Congo basin during the LGM (Adegbie et al., 2003;
Schefuss et al., 2005).
II. 2 Deglacial period
34
In equatorial Africa, significantly wetter conditions followed the LGM which led to a rise in
water levels in many of the lakes. This is thought to have been triggered by insolation changes
which reached 4.2% higher than modern values (Berger and Loutre, 1991). Most equatorial lakes
rose substantially at ca. 15 ka although in some lakes an earlier humid phase is apparent. The
rapid refilling of Lake Victoria commenced at ca. 15 ka BP (Talbot and Laerdal, 2000) and flow
from Lake Victoria via Lake Albert into the Nile was re-established no later than 14.5 ka
(Williams et al., 2006). Talbot et al., 2006 report major changes in organic matter (OM)
composition in Mpulungu cores (Lake Tanganyika) during and following the period of lake level
change. Diatom records from Lake Rukwa indicate that deep water conditions were reached by
13.5 ka BP (Barker et al., 2002). In Lake Malawi, a reported warming trend is also reported for
this period (Powers et al., 2005). Geomorphological and pollen studies, as well as stable isotope
analysis of stalagmites in southern Africa suggest a rapid increase starting between 18 ka and
17.5 ka BP (Thomas and Shaw, 2002; Dupont and Behling, 2006). Sea surface temperatures of
the northern Benguela System off the coast of southwestern Africa began to increase about 17 ka
BP (Shi et al., 2000; Dupont et al., 2004) which corresponded with changes in the vegetation
cover, reflecting a higher rainfall/ moisture adapted vegetation, in southern Africa detected from
pollen records (Scott and Thackeray 1987).
II.3 The Younger Dryas Event
During the Younger Dryas (YD), event, dry climatic conditions with increased northerly trade
winds prevailed over much of Africa. This resulted in the failure of the African monsoon which
in turn led to lower lake levels in a number of East African lakes at ca. 12.5 – 11.5 ka cal BP
(Street-Perrott and Perrott, 1990: deMenocal et al., 2000; Gasse, 2000; Peck et al., 2004). The
failure of the African monsoon during the Younger Dryas, was then followed by a return to more
humid climatic conditions leading into the generally more humid Holocene period (Barker et al.,
2004; Johnson et al., 2004; Schefuss et al., 2005). During the YD (13.8 ka BP) temperatures in
Lake Malawi dropped by 2ºC (Powers et al., 2005). The YD event is recorded in other climate
records, for example, the mollusc stable isotope data for the Atlantic Ocean (Cohen et al. 1992),
the Wonderkrater pollen record from South Africa (Scott and Thackeray 1987; Thackeray 1988),
and minimum SSTs from an Atlantic Ocean core (12.4-11.8 ka BP) (Dupont et al., 2004).
Following the Younger Dryas event, temperatures rose over much of the subcontinent.
35
II.4 The Early Holocene Diatom records from Lake Rukwa show that between 11.8 and 6.7 ka cal BP the lake was deep
and fresh (Barker et al., 2002) and may have overflowed into Lake Tanganyika (Haberyan, 1987).
Based on sedimentologic and geochemical analyses of cores from Lake Edward, Russell et al.
(2003) propose a well-mixed, deep waterbody between 11 and approximately 9 ka BP. From 12.1
to 5.5 ka cal BP more humid conditions in Lake Rukwa are confirmed from the pollen record
(Vincens et al., 2005).
In southern Africa, arid conditions are thought to have predominated in the early Holocene
(Shaw, 1986). These conditions contrast with the more humid conditions prevalent at this time in
the sub-tropical region. The inverse relationship between the humid intertropical and the more
arid subtropical southern climate during the early Holocene may have been a response to
precessional forcing which led to a northward migration of the ITCZ and a general reduction in
precipitation in southern Africa region (Shi et al., 2000). The arid conditions, including the SW
Kalahari dune system (Lancaster, 1989), prevailed in the early Holocene and generally persisted
in southern Africa till about 6.8 ka BP, when, according to Shaw, 1986, the region experienced a
return to more humid conditions. The vegetation cover in southern Africa began to reflect more
high rainfall/moisture adapted vegetation by 7 ka BP (Scott and Thackeray, 1987).
II.5 The Late Holocene
Barker et al. (2002) report saline conditions from the diatom record of Lake Rukwa after 5.5 ka
cal BP and Russell et al. (2003) report the onset of drier conditions in Lake Edward from about
5.2 ka BP based on the occurrence of authigenic calcite. From 5.5 ka cal BP drier conditions are
also indicated from the pollen record of Lake Rukwa, which intensify ca. 3.5 ka cal BP towards
modern conditions (Barker et al., 2002).An abrupt rise in biogenic silica mass accumulation rates
at 4.5 ka BP in northern Lake Malawi is attributed either to stronger northerly winds or a shift to
wetter conditions (Johnson et al., 2004). Data from northwest Botswana (Nash et al., 1997) from
palaeo-lake levels indicates more humidity in the northern and central Kalahari at this time. Lake
levels at Lake Ngami increased at 4 ka BP. This apparent increase in humidity in northern and
central Kalahari at 4 ka BP may be more a reflection of increased rainfall in the Angolan
catchment as opposed to localized rainfall (Huntsman-Mapila et al., 2006).

36
References Adegbie, A.T., Schneider, R.R., Röhl, U., Wefer, G., 2003. Glacial millennial-scale fluctuations
in central African precipitation recorded in terrigenous sediment supply and freshwater signals offshore Cameroon. Palaeogeography, Palaeoclimatology Palaeoecology 197, 323-333.
Aucour, A., Hillaire-Marcel, C., Bonnefille, R., 1993. A 30, 000 yr record of d13C and d18O changes in organic matter from an equatorial peatbog. Climate change in continental isotopic records. Geophys. Monogr. American Geophysical Union 78, 343 - 351.
Aucour, A., Hillaire-Marcel, C. and Bonnefille, R., 1994. Late Quaternary biomass changes from 13C measurements in highland peatbog from equatorial Africa (Burundi). Quart. Res. 41, 225-233.
Barker, P., Telford, R., Gasse, F., Thevenon, F., 2002. Late Pleistocene and Holocene palaeohydrology of lake Rukwa, Tanzania, inferred from diatom analysis. Palaeogeography, Palaeoclimatology, Palaeoecology 187, 295-305.
Barker, P., Gasse, F., 2003. New evidence for a reduced water balance in East Africa during the Last Glacial Maximum; implication for model-data comparison. Quaternary Science Reviews 22, 823-837.
Barker, P., Talbot, M.R., Street-Perrot, A., Marret, F., Scourse, J., Odada, E., 2004. Late Quaternary climatic variability in intertropical Africa. In "Past Climate Variability Through Europe and Africa." (R. W. Batterbee, Gasse, F., Stickley, C.E., Ed.), pp. 118-138. Developments in Palaeoenvironmental Research. Springer, Dordrecht.
Berger, A., 1978. Long-term variations of caloric insolation resulting from the earth’s orbital elements. Quaternary Research 9, 139-167.
Beuning, K.R.M., Talbot, M.R., Kelts, K., 1997. A revised 30,000-year paleoclimatic and paleohydrologic history of Lake Albert, East Africa. Palaeogeography, Palaeoclimatolgy, Palaeoecology 136, 259-279.
Cohen, A. L., Parkington, J.E., Brundritt, G.B., Merwe, N.J. van der., 1992. A Holocene marine climate record in mollusk shells from the southwest African coast. Journal of Quaternary Research 38, 379-385.
deMenocal, P., Ortiz, J., Guilderson, T., Adkins, J., Sarnthein, M., Baker, K., Yarusinsky, M., 2000. Abrupt onset and termination of the African Humid Period: rapid climate responses to gradual insolation forcing. Quaternary Science Reviews 19, 347-361.
Dupont, L., Behling, H., 2006. Land-sea linkages during deglaciation: High-resolution records from the eastern Atlantic off the coast of Namibia and Angola (ODP site 1078). Quaternary International 148, 19-28.
Dupont, L. M., Kim, J-H, Schneider, R.R., Shi, N., 2004. Southwest African climate independent of Atlantic sea surface temperatures during the Younger Dryas. Quaternary Research 61, 318-324.
Haberyan, K.A., Hecky, R.E., 1987. The late Pleistocene and Holocene stratigraphy and paleolimnology of lakes Kivu and Tanganyika. Palaeogeography, Palaeoclimatology, Palaeoecology 61, 169-197.
Garcin, Y., Williamson, D., Taieb, M., Vincens, A., Mathe, P., Majule, A., 2006b. Centennial to millennial changes in lake deposition during the last 45,000 years in Tropical Southern Africa (Lake Masoko, Tanzania). Palaeogeography, Palaeoclimatology, Palaeoecology 239 (3-4), 334-354.
Gasse, F., Lédée, V., Massault, M., Fontes, J.Ch., 1989. Water-level fluctuations of Lake Tanganyika in phase with oceanic changes during the last glaciation and deglaciation. Nature 342, 57-69.

37
Gasse , F., Barker, P., Johnson,T.C., 2002. A 24,000 yr diatom record from the northern basin of Lake Malawi. In: Odada E.O., and Olago, D.O. (eds), The East African Great lakes: Limnology, Palaeolimnology and Biodiversity. Dordrecht, Kluwer, pp. 393-414.
Gasse, F., 2000. Hydrological changes in the African tropics since the Last Glacial maximum. Quaternary Science Reviews 19, 189 - 211.
Heine, K., 1982. The main stages of late Quaternary evolution of the Kalahari region, southern Africa. Palaeoecology of Africa 15, 53-76.
Huntsman-Mapila, P., Ringrose, S., Mackay, A.W., Downey, W.S., Modisi, M., Coetzee, S.H, Tiercelin, J-J., Kampunzu, A.B., Vanderpost C., 2006. Use of the geochemical and biological sedimentary record in establishing palaeo-environments and climate change in the Lake Ngami basin, NW Botswana. Quaternary International 148, 51-64.
Johnson, T. C., Brown, E.T., McManus, J., 2004. Diatom productivity in Northern Lake Malawi during the past 25,000 years: implictions for the position of the intertropical convergence zone at millennial and shorter time scales. In "Past Climate Variability Through Europe and Africa." (R. W. Batterbee, Gasse, F., Stickley, C.E., Ed.), pp. 93-116. Developments in Palaeoenvironmental Research. Springer, Drodrecht.
Kirst, G. J., Schneider, R.R., Muller, P.J., Storch, I. von, Wefer, G., 1999. Late Quaternary temperature variability in the Benguela Current system derived from alkenones. Quaternary Research 52, 92-103.
Kutzbach, J.E. , Liu, Z., 1997. Response of the African monsoon to orbital forcing and ocean feedbacks in the middle Holocene. Science 278: 440-443.
Lancaster, N. (1989). Late Quaternary palaeoenvironments of the southwestern Kalahari. Palaeogeography, Palaeoclimatology, Palaeoecology 70, 367-376.
Metcalfe, S.E., 1999. Diatoms from the Pretoria Salt Pan- a record of lake evolution and environmental change. In: Partridge, T.C. (ed.), Investigations into the origin, age and palaeoenvrionments of the Pretoria Saltpan. Geological Survey of South Africa. pp. 192-192.
Nash, D. J., Meadows, M.E., Shaw, P.A., Baxter, A.J., Gieske, A., 1997. Geomorphological and chronostratigraphic evidence for late Holocene environmental change in the Ncamasere Valley, Okavango Delta, Botswana: preliminary results. South African Geographical Journal Special edition, 93-100.
Olago, D. O., 2001. Vegetation changes over palaeo - time scales in Africa. Climate Research 17, 105 -121.
Partridge, T. C., deMenocal, P.B., Lorentz, S.A., Paiker, M.J., Vogel, J.C., 1997. Orbital forcing of climate over South Africa: a 200,000 year rainfall record from the Pretoria Saltpan. Quaternary Science Reviews 16, 1125-1133.
Partridge, T. C., Scott, L., Hamilton, J.E., 1999. Synthetic reconstructions of southern African environments during the Last Glacial Maximum (21-28 kyr) and the Holocene Altithermal, (8-6 kyr). Quaternary International 57/58, 207-214.
Peck, J.A., Green, R.R., Shanahan, T., King, J.W., Overpeck, J.T., Scholz, C.A., 2004. A magnetic mineral record of Late Quaternary tropical climate variability from Lake Bosumtwi, Ghana. Palaeogeography, Palaeoclimatology, Palaeoecology 215, 37-57.
Powers, L. A., Johnson, T.C., Werne, J.P., Castaneda, S., Hopmans, E.C., Sinninghe Damste, J.S., Schouten, S. (2005). Large temperature variability in the southern African tropics since the Last Glacial Maximum. Geophysical Research Letters 32, L08706, doi:10.1029/2004GL022014.
Prell, W. L., 1984. Monsoonal climate of the Arabian sea during the late Quarternary: a response o changing solar radiation. In "Milankovitch and climate, Part 1. NATO ASI Series C: Mathematical and Physical sciences Vol. 126 D." (A. Berger, Imbrie, J., Hays, J. Kukla, G., Saltzman, B., Ed.), pp. 349 - 366. Reidel Publishers, Dordrecht.

38
Ringrose, S., Kampunzu, A.B., Vink, B., Matheson, W., Downey, W.S., 2002. Origin and palaeo-environments of calcareous sediments in the Moshaweng dry valley, southeast Botswana. Earth Surface Processes and Landforms 27, 591-611.
Ringrose, S., Huntsman-Mapila, P., Kampunzu, H.,Downey, W.D. Coetzee S., Vink, B., Matheson W, Vanderpost, C., 2005. Geomorphological and geochemical evidence for palaeo-environmental change in the Makgadikgadi sub-basin, in relation to the MOZ rift depression, Botswana. Palaeogeography, Palaeoclimatology and Palaeoecology 217, 265-287.
Scholz, C.A., King, J.W., Ellis, G.S., Swart, P.K., Stager, J.C., Colman, S.M., 2003. Paleolimnology of Lake Tanganyika, East Africa over the past 100 k yr. Jounral of Paleolimnology 30, 139-150.
Schefuss, E., Schouten, S., Schneider, R.R., 2005. Climatic controls on central African hydrology during the past 20, 000 years. Nature 437, 1003-1006.
Shaw, R. P., 1986. The palaeohydrology of the Okavango delta-some preliminary results. Palaeocology Africa 17, 51 - 58.
Shi N., D., L.M., Beug, H., Schneider, R., 2000. Correlation between vegetation in Southwestern Africa and oceanic upwelling in the past 21, 000 years. Quartenary Research 54, 72 - 80.
Scott, L., Thakeray, J.F., 1987. Multivariate analysis of late Pleisocene and Holocene pollen spectra from Wonderkrater, Transvaal, South Africa. South African Journal of Science 83, 93-98.
Scott, L., Anderson, H.M., Anderson, J.M., 1997. Vegetation history. In "Vegetation of souhern Africa." (R. M. Cowling, Richardson, D.M., Pierce, S.M., Ed.), pp. 62 - 84. Cambridge University Press, Cambridge.
Street-Perrott, F. A., Perrott, R.A..,1990. Abrupt climatic fluctuations in the tropics - the influence of Atlantic Ocean circulation. Nature 343, 607 - 612.
Street-Perrott, F. A., Perrott, R.A. 1993. Holocene vegetation, lake levels and climate of Africa. In "Global Climates since the Last Glacial Maximum." (H. E. Wright, Kutzbatch, J.E., Webb III, T., Ruddiman, W.F., Street-Perrott, F.A., Bartlein, P.J., Ed.), pp. 318 - 356. University of Minnesota Press, Minneapolis.
Talbot, M.R., Jensen, N.B., Laerdal, T., Filippi, M.L., 2006. Geochemical responses to a major transgression in giant African lakes. Journal of Paleolimnology. 35 (3), 467-489.
Talbot, M.R., Laerdal, T., 2000. The Late Pleistocene-Holocene palaeolimnology of Lake Victoria, East Africa, based upon elemental and isotopic analyses of sedimentary organic matter. Journal of Paleolimnology 23, 141-164.
Taylor, D. M., 1990. Late Quaternary pollen records from two Ugandan mires: evidence for environmental change in the Rukiga Highlands of southwest Uganda. Palaeogeograhy, Palaeoclimatology Palaeocology 80, 283 - 300.
Thackeray, J. F., 1988. Quantification of climatic change during the late Quaternary in southern Africa. Palaeocology of Africa 19, 317 - 326.
Thomas, D. S. G., Shaw, P.A., 2002. Late Quaternary environmental change in central southern Africa: new data, synthesis, issues and prospects. Quaternary Science Reviews 21, 783-797.
Tiercelin, J-J, Mondeguer, A., 1991. The geology of the Tanganyika Trough. In: Coulter G.W. (ed), Lake Tanganyika and its life. Oxford University Press, Oxford, pp. 7-48.
Trauth, M. H., Deino, A.L., Strecker, M.R., 2001. Response of the East African climate to orbital forcing during the last interglacial (130-117 ka) and the early last glacial (117-60 ka). Geology 29, 499-502.
Tyson, P. D., Preston-Whyte, R.A., 2000. "The Weather and Climate of Southern Africa." Oxford University Press, Cape Town.

39
Tyson, P. D., Fuchs, R., Fu, C., Lebel, L., Mitra, A.P., Odada, E., Perry, J., Steffen, W., Virji, H. 2002. Global-Regional Linkages in the Earth System. In "Global Change - The IGBP Series." pp. 198. Springer, Berlin.
Vincens, A., Chalié, F., Bonnefille, R., Guiot, Tiercelin, J-J., 1993. Pollen-derived rainfall and temperature estimates from lake Tanganyika and their implications for late Pleistocene water levels. Quaternary Research 40, 343-350.
Vincens, A., Buchet, G., Williamson, D., Taieb, M., 2005. A 23,000 yr pollen record from Lake Rukwa (8oS, SW Tanzania): New data on vegetation dynamics and climate in Central Eastern Africa. Review of Palaeobotany and Palynology 137, 147-162.

40
III. SUMMARY OF GEOCHEMICAL ANALYTICAL PROCEDURES This chapter presents an overview of the geochemical analytical procedures followed in this
thesis and in addition gives an explanation of why certain elements were selected to be used as
indicators of either climatic and tectonic change or both.
Major elements are the elements which predominate in any rock analysis. They include Si, Ti, Al,
Fe, Mn, Mg, Ca, Na, K and P and their concentrations are expressed as a weight per cent (wt. %)
of the oxide. Major elements for this work were measured by inductively coupled plasma-atomic
emission spectrometry (ICP-AES) after employing standard silicate dissolution methods with HF
(see Chapter V and VIII for more details). ICP-AES uses a plasma which is an electrical
conducting gaseous mixture containing a significant concentration of cations and electrons,
capable of reaching a temperature in the range of 6000 – 10 000 K. The sample solution is passed
as an aerosol from a nebulizer into an argon plasma where the sample dissociates and a large
number of atomic and ionic spectral lines are excited. The spectral lines are detected by a range of
photomultipliers, compared with calibration lines, and their intensities are converted into
concentrations (Rollinson, 1993).
In this work, major elements were used to determine the degree of chemical weathering using for
example the chemical index of alteration (CIA) of Nesbitt and Young (1982) and also the CaO +
Na2O-Al2O3-K2O triangular plots of Nesbitt and Young (1984, 1989). Since feldspar makes up
in excess of 50% of the upper crust (with quartz comprising an additional 20%), the CIA
effectively measures the degree of alteration of feldspars to clay minerals during weathering.
Major elements are also used, in particular the ratios of SiO2/Al2O3 to reflect the relative
abundance of quartz and the clay and feldspar content (Potter, 1978) while the Na2O/K2O ratio
reflects the feldspar content (Pettijohn et al., 1972), as indicators of the degree of chemical
maturity of the sediments. Major element composition of sediments was used in determining the
tectonic settings of the depositional basins. Useful discriminating parameters of tectonic setting
for major elements include Fe2O3 + MgO%, TiO2% and the Al2O3/SiO2, K2O/Na2O and
Al2O3/(CaO+Na2O) ratios. The Al2O3/(CaO+Na2O) is a ratio of the relatively immobile to the
more mobile elements. In general, as the tectonic setting changes from oceanic island arc to
continental island arc to active continental margins to the passive margin type, there is a
detectable decrease in Fe2O3+MgO, TiO2, Al2O3/SiO2 and an increase in K2O/Na2O and

41
Al2O3/(CaO+Na2O) (Bhatia, 1983; Roser and Korsch, 1986; 1988). Passive margin sandstones
are generally enriched in SiO2 and depleted in Na2O, CaO and TiO2. They also usually exhibit a
large variation in their K2O/Na2O and Al2O3/(CaO+Na2O) compositions and have a low
Fe2O3+MgO content. This is a reflection of the recycled nature of passive margin sediments with
an enrichment of quartz and depletion of chemically unstable grains, for example, feldspars
(Bhatia, 1983; Roser and Korsch, 1986; 1988). Relative tectonic stability which results in
enhanced weathering leads to the maturity of the sediments of this setting (Bhatia, 1983)
Trace elements are defined as those which are present in a sample in concentrations of less than
0.1 wt. % or less than 1000 ppm. Trace element measurements were conducted using inductively
coupled plasma-mass spectrometry (ICP-MS) after silicate dissolution of the sediment samples
(see Chapter V and VIII for more details). ICP-MS is widely used as a tool for trace element
analysis due to its very low detection limits and good accuracy and precision (Rollinson, 1993).
Mass spectrometry is based on the separation of ions on the basis of their mass-to-charge ratio.
With ICP-MS, ions are extracted from the plasma into a vacuum system and focused with an ion
lens into a mass spectrometer. In the mass spectrometer, an ion beam is fired along a curved tube
with an electromagnet which separates the atoms according to their mass. A mass spectrum is
produced in which the lighter ions are deflected with a smaller radius of curvature than the
heavier ions (Rollinson, 1993).
Trace element concentrations in sediments result from a number of factors including provenance,
weathering, diagenesis, sediment sorting and the aqueous geochemistry of the particular element
hence may be used to infer past climatic conditions. Generally the highest concentrations of trace
elements are found in clay-rich sediments. The trace elements used to identify sedimentary
provenance have included the REE, Th and Sc. This is due to the fact that these are relatively
insoluble in water are transferred almost quantitatively into terrigenous clastic material. Cullers et
al., 1988 showed that the immobile elements La and Th are more abundant in felsic than in basic
rocks, but that the opposite is true for Sc and Co. Ratios such as La/Sc, Th/Sc, Th/Co and La/Co
allow a distinction to be made between a felsic or mafic source.
Studies have indicated that high pH water show enrichments in heavy REEs (HREE) and the
degree of enrichment appears to increase with increasing alkalinity (Moller and Bau, 1993;
Johannesson et al., 1994). For the high pH alkaline waters, speciation modelling (Johannesson et
al., 1994) indicates that REE dicarbonate complexes are the only important form of dissolved

42
REE. The HREE are more strongly complexed in alkaline solution leading to enrichment of the
HREEs over light REEs (LREE) in the water. This implies that certain sediments should be the
site of preferential accumulation of LREE. Normalization of Ce abundances to those of its
neighbouring REE, measured in various biogenic and authigenic components has been used to
deduce redox conditions of the water column at the time of REE uptake by these phases. Unlike
the other REE, cerium can undergo oxidation from soluble Ce(III) to highly insoluble Ce (IV). Its
fixation in particulate matter, including organics is thought to be responsible for distinctive
depletion of Ce in well oxygenated seawater (Wright et al., 1987; Liu et al., 1988; Bellanca et al.,
1997).
Other elements, such as the transition metals are more soluble and redox sensitive and therefore
good indicators of wet and dry conditions in sedimentary basins. Metals that occur as minor and
trace elements in clastic sediments may become concentrated by precipitation under appropriate
redox conditions and thus have redox-proxy potential. These include Cu, Fe, Mo, U, Pb, Co, Zn,
Ni, V and Cr (Sageman et al., 2003). The redox state of a depositional system regulates various
organic and inorganic reactions which results in dissolved constituents being precipitated as
preservable minerals. This allows for reconstructions of past redox states which have been used in
this thesis for the climate change component of the work.
In most instances in this work, we look at the variations in the geochemical composition of
sediments which are due to surface processes such as weathering or redox conditions. However
trace elements vary in their behaviour in melts and this variation is largely due to the charge/size
ratio of the elements. Trace elements whose preference is the mineral phase are described as
compatible whereas elements whose preference is the melt are described as incompatible. In
Chapter VIII we use the Nb/Ti ratio of the Lake Tanganyika sediments as an indicator of
volcaniclastic sediments in the basin. Niobium is an incompatible element which becomes
concentrated in magma but not in silicate minerals. Elevated Nb concentrations are found in the
volcanic ash from eruptions and within weathered ash.
References Bellanca, A., Masetti, D., Neri, R., 1997. Rare earth elements in limestone/marlstone couplets
from the Albian-Cenomanian Cismon section (Venetian region, northern Italy): assessing REE sensitivity to environmental changes. Chemical Geology 141, 141-152.
43
Cullers, R.L., Barrett, T., Carlson, R., Robinson, B., 1987. Rare earth element and mineralogical changes in Holocene soil and stream sediment: a case study in the Wet Mountains, Colorado, USA. Chemical Geology 63, 275-297.
Johannesson, K.H., Lyons, W.B., Bird, D.A., 1994. Rare earth element concentration and speciation in alkaline lakes from the western USA. Geophysical Research Letters 21, 773-776.
Liu, Y.G., Miah, M.R.U., Schmitt, R.A., 1988. Cerium: a chemical tracer for paleo-oceanic redox conditions. Geochimica Cosmochimica Acta 52, 1361-1371.
Moller, P., Bau, M., 1993. Rare earth patterns with positive cerium anomaly in alkaline waters from Lake Van Turkey. Earth Planetary Science Letters 117, 671-676.
Nesbitt, H.W., Young, G.M., 1982. Early Proterozoic climates and plate motions inferred from major element chemistry of lutites. Nature 299, 715– 717.
Nesbitt, H.W., Young, G.M., 1984. Prediction of some weathering trends of plutonic and volcanic rocks based on thermodynamic and kinetic considerations. Geochim. Cosmochim. Acta 48, 1523– 1534.
Nesbitt, H.W., Young, G.M., 1989. Formation and diagenesis of weathering profiles. J. Geol. 97, 129– 147.
Pettijohn, F.J., Potter, P.E., Siever, R., 1972. Sand and sandstones. Springer-Verlag, New York. Potter, P.E., 1978. Petrology and chemistry of modern big riber sands. J. Geol. 86, 423-449. Rollinson, H., 1993. Using geochemical data: Evaluation, Presentation, Interpretation. Longman
Scientific and Technical, New York, 352 pp. Sageman, B.B., Murphy, A.E., Werne, J.P., Ver Straeten, C.A., Hollander, D.J., Lyons, T.W.,
2003. A tale of shales: the relative role of production, decomposition, and dilution in the accumulation of organic-rich strata, Middle-Upper Devonian, Appalachian Basin. Chemical Geology 195, 229-273.
Wright, J., Schrader, H., Holser, W.T., 1987. Paleoredox variations in ancient oceans recorded by rare earth elements in fossil apatite. Geochimica Cosmochimica Acta 51, 631-644.
44
IV. CRYPTIC INDICATORS OF PROVENANCE FROM THE GEOCHEMISTRY OF THE OKAVANGO DELTA SEDIMENTS, BOTSWANA
IV.1. La géochimie des sédiments de l’Okavango comme indicateur de provenance Résumé de l’article Les sédiments siliceux du Delta de l’Okavango au nord-ouest du Boswana ont une composition
modale d’arène quartzeuse et une histoire complexe qui inclut le transport fluvial et le dépôt dans
un bassin de rift naissant. L’Okavango est situé dans le désert du Kalahari, qui alimente le
système en sables éoliens remaniés. La composition géochimique des sédiments du Delta de
l’Okavango a été déterminée pour contraindre l’altération à la source et la composition des roches
de la source. Les concentrations et rapports d’éléments chimiques montrent une large gamme de
compositions qui sont proches du PAAS. L’indice chimique d’altération et le diagramme A-CN-
K montrent une évolution qui peut être interprétée en utilisant un modèle de mélange entre une
fraction très altérée correspondant à la fraction sédimentaire transportée par la fleuve Okavango
et une fraction moins altérée correspondant aux apports de sables éoliens. Les données
géologiques de terrain, appuyées par les rapports géochimiques tels que Th/Cr, Th/Sc, La/Sc,
La/Co et Eu/Eu* indiquent une source a affinité mafique-ultramafique et felsique avec ou sans les
termes intermédiaires. Les relations entre certains éléments (Cr-Ni, Na2O-Al2O3, K2O-Al2O3)
améliorent l’interprétation en montrant l’existence d’au moins trois types de roches sources,
comprenant des roches felsiques, riches en pyroxène et mafiques-ultramafiques riches en olivine.
Les granitoïdes-gabbros Protérozoïques et les complexes volcaniques et ortho-métamorphiques
qui sont exposés dans le NW du Botswana et les pays adjacents (Angola et Namibie) sont
proportiennelement les sources des sédiments, à laquelle s’ajoute une contribution des sables
éoliens et une proportion de carbonates diagénétiques. Tous ces differents termes ont contribué à
l’édification du bassin sédimentaire de l’Okavango.

45
IV.2. Cryptic indicators of provenance from the geochemistry of the Okavango
Delta sediments, Botswana
P. Huntsman-Mapilaa,b*, A.B. Kampunzuc, B. Vinkc, S. Ringrosea
a Harry Oppenheimer Okavango Research Centre, University of Botswana, P/Bag 285, Maun, Botswana b UBO-CNRS UMR 6538, Institut Universitaire Européen de la Mer, 29280 Plouzané, France c Geology Department, University of Botswana, P/Bag 0022, Gaborone, Botswana * Corresponding author email: [email protected] Article published by Sedimentary Geology 174 (2005) 123-148 Abstract
The siliciclastic sediments of the Okavango inland Delta of northwest Botswana have a modal
composition of quartz arenites and result from a complex history, including transport by river and
deposition in a nascent rift basin located in a desert environment with input of aeolian sands. The
geochemical composition of sediments from the Okavango Delta was determined in order to
constrain the role of weathering at the source and the composition of the source rocks. The
chemical analyses and the interelement ratios show a broad compositional range usually
encompassing the PAAS composition. The chemical index of alteration (CIA) values and the A–
CN–K diagram define an evolution trend which can be interpreted using a mixing model
involving a strongly weathered component which corresponds to the sedimentary fraction
transported by the Okavango River and a relatively immature component which corresponds to
the aeolian sand component of the Okavango sediments. Field geological data supported by
geochemical ratios involving elements with affinity for mafic–ultramafic and felsic rocks such as
Th/Cr, Th/Sc, La/Sc, La/Co and Eu/Eu* support a source area including mafic–ultramafic and
felsic rocks, with or without intermediate rocks. The relationships between certain elements (Cr–
Ni, Na2O–Al2O3, K2O–Al2O3) refine the interpretation by pointing to the existence of at least
three source rock end-members, including a felsic rock source and pyroxene-rich and olivine-rich
mafic–ultramafic source rocks. Proterozoic granitoid–gabbro and related volcanic and ortho-
metamorphic rock complexes exposed in NW Botswana and adjacent Angola and Namibia are
the source rocks of the sediment component which was mixed with aeolian sand and interacted
with a variable proportion of diagenetic carbonates to produce the Okavango sediments.

46
IV.2.1. Introduction
The geochemical composition of siliciclastic sedimentary rocks is a sensitive indicator of
provenance and weathering at the source of sediments (Taylor and McLennan, 1985; Roser and
Korsch, 1988; Hassan et al., 1999; Cullers, 2000). Concentrations of major,trace and rare earth
elements (REE) of sediments are well suited to constrain provenance and source rock
composition. The REE are transferred with minimal fractionation from the source material into
sediments (Taylor and McLennan, 1985). The negative Eu anomaly commonly recorded in felsic
igneous rocks is usually detected in clastic sedimentary rocks originating from a source made of
felsic rocks (Gao and Wedepohl, 1995). Elemental ratios, e.g., La/Sc, La/Co, are usually good
discriminators between mafic and felsic source rocks because La, Th and Zr are more
concentrated in felsic igneous rocks whereas Co, Sc and Cr have higher concentrations in mafic
rocks (e.g., Wronkiewicz and Condie, 1987). The Okavango siliciclastic sediments, which are the
focus of this study, are particularly important because they occur in a large alluvial fan with a
wetland which is the largest Ramsar site on earth. The sediments result from a complex history
including erosion from a relatively wet hinterland in Angola, transport by river and deposition in
a basin located in a semiarid environment and direct input of aeolian sands from reworked dunes
in the Kalahari desert. In this paper, the term aeolian sand refers to both direct input of fresh
aeolian sand and reworked aeolian sand transported into the basin by the Okavango River. The
objectives of this paper are (1) to present new chemical analyses of Quaternary siliciclastic
sediments from the Okavango inland Delta; (2) to constrain the role of weathering at the source of
the Okavango sediments and the composition of the source rocks for the Okavango Delta
sediments excluding the aeolian sand input.
IV.2.2. Geological setting The Okavango Delta overlies Precambrian igneous –metamorphic rocks that include the
following main units (Figure IV-1): (1) Paleoproterozoic ~2.05 Ga augen gneiss, granites and
amphibolites exposed in the Qangwa area (Kampunzu and Mapeo, unpublished data) and 2.03 Ga
granulites exposed in the Gweta area (Mapeo and Armstrong, 2001); (2) Mesoproterozoic 1.2–1.0
Ga gabbros, granites, metarhyolites and metabasalts (Kampunzu et al., 1998a, 1999); (3)
Neoproterozoic siliciclastic and carbonate sedimentary rocks forming a blanket above older

47
Proterozoic rocks (Kampunzu et al., 2000; Mapeo et al., 2000); (4) Karoo Supergroup (not shown
in Figure IV-1), including mainly siliciclastic sedimentary rocks deposited during the Permo-
Carboniferous and mafic lavas and dolerites emplaced between ca. 181–179 Ma (Carney et al.,
1994; Le Gall et al., 2002). The Okavango Basin is a Quaternary half-graben (McCarthy et al.,
1993; Modisi, 2000; Modisi et al., 2000) which represents the southwestern extension of the East
African rift system (Kampunzu et al., 1998b). It is located within the Kalahari Basin, which is a
shallow intracontinental basin. Aeromagnetic and seismic refraction studies suggest that the
maximum thickness of sediment, in excess of 300 m, occurs in northern Namibia and in the
Okavango graben in Botswana (Reeves, 1978; Modisi et al., 2000). Mineralogical studies of
Kalahari sands suggest that it represents an accumulation of in situ weathering products of pre-
Kalahari lithologies, in addition to material transported into the basin. (Thomas and Shaw, 1991).
The major part of the catchment area comprises loosely consolidated, chiefly aeolian sand of the
presently active Kalahari Basin. The Okavango Delta sediments studied in this paper represent
the youngest (Quaternary) stratigraphic unit of the Kalahari sedimentary basin. Potential source
rocks of the Okavango Delta sediments are mainly Proterozoic granitoids, gabbros and related
volcanic and orthometamorphic rocks exposed in the catchment area in Angola, northern Namibia
and northern Botswana.
IV.2.3. Local setting
The Okavango River enters the Makgadikgadi–Okavango–Zambezi (MOZ) rift depression
(Ringrose et al., 2005) through a narrow NW–SE-trending swamp called the Panhandle (Figure
IV-2) before extending into a large (>12,000 km2) inland alluvial fan (McCarthy et al., 2000).
The Okavango Delta represents the terminus of a fluvial system which drains from the central
highlands of Angola where annual inflow is estimated at 1.01x10¹⁰ m3 measured at the apex of
the Panhandle (McCarthy et al., 2000). The present fan can be divided into distinct geo- morphic
regions: (1) the Panhandle where the Okavango River is confined; (2) the permanent swamps; (3)
the seasonal floodplains and (4) occasional (or intermittent) floodplains of the distal reaches of
the Delta. Sedimentological and geochemical evidence suggests that the wetlands of the MOZ
basin have expanded and contracted over the past 400,000 years and may have been subject to
extensive flooding approximately 120,000 years ago (Ringrose et al., 2005). The latest phase of
contraction appears to have commenced ca. 7000 years BP (the Holocence Altithermal) and is
continuing to the present day. The distal reaches of the Okavango Delta are presently a site of

48
significant subsurface chemical precipitation of calcite and silica (McCarthy and Metcalfe, 1990).
The Okavango Delta sediments contain a high proportion of sand of aeolian origin, and the
floodwater constitutes the major source of the fine sediments. Airborne dust could account for the
presence of clays on islands, but because the content of clay rich fines in floodplain sediments is
greater than on islands, floodwater is believed to be the major source (McCarthy and Ellery,
1995). Few clastic sediments are currently introduced onto the distal reaches of the fan because of
the very low gradient, dense vegetation and low suspended load of the Okavango River
(McCarthy et al., 1991). Throughout the Okavango system, the current chemical sedimentation
volumetrically exceeds the amount of clastic sediment being brought into the fan (McCarthy and
Metcalfe, 1990).

49
Figure IV. 1. Precambrian geology map of NW Botswana (Kampunzu et al., 2000). Box: location of Figure IV..2 in northwestern Botswana. Inset: location of the Okavango Delta in Botswana

50
Figure IV 2. Satellite image of the Okavango region showing the location of sampled boreholes. Fault zones related to the Okavango rift are prominent on this image. Insert: Okavango Delta alluvial fan morphology (courtesy of SAFARI 2000). Red rectangle: position of the main image.
51
IV.2.4. Sampling and analytical procedures
Fifty-eight samples from boreholes sunk in the study area were selected for grain size (sieving)
analysis performed as part of the Maun Groundwater Development Project (DWA (Department of
Water Affairs), 1997). In addition, during the course of this study, grain size was determined on
42 samples taken from shallow (3 m) holes sunk in the study area (see data in Table IV-1).
Thirteen representative samples were selected for microscope investigations conducted on a Zeiss
Axioskop 40 microscope fitted with a Zeiss AxioCam MRc digital camera. Twelve representative
samples were selected for X-ray diffraction analyses using a Philips PW 3710 X-ray Diffraction
unit, operated at 45kV and 40 mA, employing Cu-Kα radiation and a graphite monochromator.
The samples were scanned from 3o to 70o for 2θand their diffractograms were digitally recorded.

52
Table IV 1. Petrographic characteristics of the Okavango sediments Grain size data Location Depth No. of
samples Mean (phi)
Sorting
Shashe1 40-65m 32 1.66 0.56 Thamalakane1 12-38m 8 1.89 0.56 Thamalakane1 42-70m 9 1.94 0.66 Boro1,2 38-65m 3 2.18 0.57 Boro1,2 45-57m 6 2.07 0.77 Shallow depth holes3
0-3m 42 2.40 0.69
Shallow depth holes4
2-3m 2.20 well sorted
Microscopic and XRD data Sample nr Quartz Calcite Dolomite Kaolinite K-feldspar Muscovite Clay5 8157a 96 - - 2 2 - 8157f 100 - - - - - 8159g 93 5 - - Trace 2 - 8159j 28 65 7 - - - 8159n6 44 10 43 - 3 - 8159o 30 23 45 - 2 - 8159t 82 5 13 - - - 8262c 100 - - - - - 8162e 90 - - 3 4 3 8162o 98 - - - - 2 8348d 100 - - - - - 8348j 95 - - 3 2 -
1) DWA (1997) 4) McCarthy and Ellery, 1995
2) Split spoon sample analysis 5) clay minerals other than kaolinite
3) This study 6) possibly some heulandite

53
Ninety samples were collected from seven boreholes (Figure IV-2) drilled during the Maun
Groundwater Development Project (DWA (Department of Water Affairs), 1997) for whole rock
geochemical analyses. Two boreholes (BH8157 and BH8158) are located on the lower reaches of
the Boro channel, a major tributary of the Delta that has active flow throughout most of the year.
This channel abuts on the distal Kunyere and Thamalakane faults which are major normal faults
bounding the Okavango half-graben to the southeast (Figure IV-2). The boreholes BH8351,
BH8162, BH8262 and BH8348 are located along the Thamalakane River valley, and BH8159 is
located in the Shashe valley, which has been dry since the early 1990s. Representative samples
were obtained at 3-m intervals up to depths of between 69–147 m. The chemical analyses of
sediments were performed at Chemex Laboratories in Canada. Major elements were determined
using ICP-AES. Trace and rare earth elements were analysed using ICP-MS (detection limits
generally between 0.1 and 0.5 ppm) with the exception of Li, Cr, Ni and Pb that were determined
by flame AAS (detection limits 1 ppm). The analyses of standards run at the same time as the
studied samples are shown in Table IV-2. The precisions are <1% and <10% for major and trace
elements, respectively. Inorganic CO2 was determined using a Leco-Gasometric and Leco-IR
detector with detection limits of 0.2%.
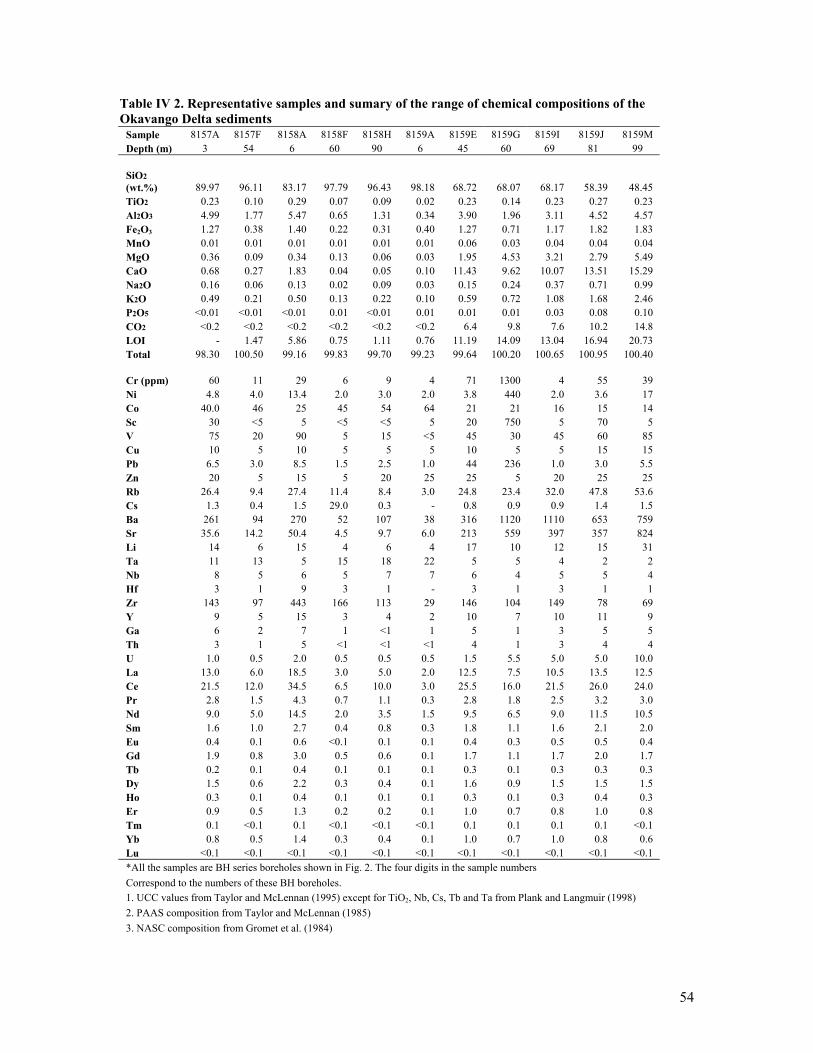
54
Table IV 2. Representative samples and sumary of the range of chemical compositions of the Okavango Delta sediments
Sample 8157A 8157F 8158A 8158F 8158H 8159A 8159E 8159G 8159I 8159J 8159M Depth (m) 3 54 6 60 90 6 45 60 69 81 99 SiO2 (wt.%) 89.97 96.11 83.17 97.79 96.43 98.18 68.72 68.07 68.17 58.39 48.45 TiO2 0.23 0.10 0.29 0.07 0.09 0.02 0.23 0.14 0.23 0.27 0.23 Al2O3 4.99 1.77 5.47 0.65 1.31 0.34 3.90 1.96 3.11 4.52 4.57 Fe2O3 1.27 0.38 1.40 0.22 0.31 0.40 1.27 0.71 1.17 1.82 1.83 MnO 0.01 0.01 0.01 0.01 0.01 0.01 0.06 0.03 0.04 0.04 0.04 MgO 0.36 0.09 0.34 0.13 0.06 0.03 1.95 4.53 3.21 2.79 5.49 CaO 0.68 0.27 1.83 0.04 0.05 0.10 11.43 9.62 10.07 13.51 15.29 Na2O 0.16 0.06 0.13 0.02 0.09 0.03 0.15 0.24 0.37 0.71 0.99 K2O 0.49 0.21 0.50 0.13 0.22 0.10 0.59 0.72 1.08 1.68 2.46 P2O5 <0.01 <0.01 <0.01 0.01 <0.01 0.01 0.01 0.01 0.03 0.08 0.10 CO2 <0.2 <0.2 <0.2 <0.2 <0.2 <0.2 6.4 9.8 7.6 10.2 14.8 LOI - 1.47 5.86 0.75 1.11 0.76 11.19 14.09 13.04 16.94 20.73 Total 98.30 100.50 99.16 99.83 99.70 99.23 99.64 100.20 100.65 100.95 100.40 Cr (ppm) 60 11 29 6 9 4 71 1300 4 55 39 Ni 4.8 4.0 13.4 2.0 3.0 2.0 3.8 440 2.0 3.6 17 Co 40.0 46 25 45 54 64 21 21 16 15 14 Sc 30 <5 5 <5 <5 5 20 750 5 70 5 V 75 20 90 5 15 <5 45 30 45 60 85 Cu 10 5 10 5 5 5 10 5 5 15 15 Pb 6.5 3.0 8.5 1.5 2.5 1.0 44 236 1.0 3.0 5.5 Zn 20 5 15 5 20 25 25 5 20 25 25 Rb 26.4 9.4 27.4 11.4 8.4 3.0 24.8 23.4 32.0 47.8 53.6 Cs 1.3 0.4 1.5 29.0 0.3 - 0.8 0.9 0.9 1.4 1.5 Ba 261 94 270 52 107 38 316 1120 1110 653 759 Sr 35.6 14.2 50.4 4.5 9.7 6.0 213 559 397 357 824 Li 14 6 15 4 6 4 17 10 12 15 31 Ta 11 13 5 15 18 22 5 5 4 2 2 Nb 8 5 6 5 7 7 6 4 5 5 4 Hf 3 1 9 3 1 - 3 1 3 1 1 Zr 143 97 443 166 113 29 146 104 149 78 69 Y 9 5 15 3 4 2 10 7 10 11 9 Ga 6 2 7 1 <1 1 5 1 3 5 5 Th 3 1 5 <1 <1 <1 4 1 3 4 4 U 1.0 0.5 2.0 0.5 0.5 0.5 1.5 5.5 5.0 5.0 10.0 La 13.0 6.0 18.5 3.0 5.0 2.0 12.5 7.5 10.5 13.5 12.5 Ce 21.5 12.0 34.5 6.5 10.0 3.0 25.5 16.0 21.5 26.0 24.0 Pr 2.8 1.5 4.3 0.7 1.1 0.3 2.8 1.8 2.5 3.2 3.0 Nd 9.0 5.0 14.5 2.0 3.5 1.5 9.5 6.5 9.0 11.5 10.5 Sm 1.6 1.0 2.7 0.4 0.8 0.3 1.8 1.1 1.6 2.1 2.0 Eu 0.4 0.1 0.6 <0.1 0.1 0.1 0.4 0.3 0.5 0.5 0.4 Gd 1.9 0.8 3.0 0.5 0.6 0.1 1.7 1.1 1.7 2.0 1.7 Tb 0.2 0.1 0.4 0.1 0.1 0.1 0.3 0.1 0.3 0.3 0.3 Dy 1.5 0.6 2.2 0.3 0.4 0.1 1.6 0.9 1.5 1.5 1.5 Ho 0.3 0.1 0.4 0.1 0.1 0.1 0.3 0.1 0.3 0.4 0.3 Er 0.9 0.5 1.3 0.2 0.2 0.1 1.0 0.7 0.8 1.0 0.8 Tm 0.1 <0.1 0.1 <0.1 <0.1 <0.1 0.1 0.1 0.1 0.1 <0.1 Yb 0.8 0.5 1.4 0.3 0.4 0.1 1.0 0.7 1.0 0.8 0.6 Lu <0.1 <0.1 <0.1 <0.1 <0.1 <0.1 <0.1 <0.1 <0.1 <0.1 <0.1 *All the samples are BH series boreholes shown in Fig. 2. The four digits in the sample numbers Correspond to the numbers of these BH boreholes. 1. UCC values from Taylor and McLennan (1995) except for TiO2, Nb, Cs, Tb and Ta from Plank and Langmuir (1998) 2. PAAS composition from Taylor and McLennan (1985) 3. NASC composition from Gromet et al. (1984)

55
Table IV-2 continued Sample Nr 8159N 8159O 8159T 8162D 8162E 8162J 8162K 8162L 81620 8262A 8262B Depth (m) 102 114 147 15 24 45 51 54 63 3 12 SiO2 (wt.%) 53.82 44.07 89.28 89.46 87.09 80.17 93.97 88.55 90.32 83.28 76.75 TiO2 0.14 0.09 0.05 0.13 0.23 0.22 0.08 0.09 0.15 0.56 0.62 Al2O3 2.67 1.28 0.54 2.41 4.77 3.37 0.90 1.15 2.72 9.49 11.76 Fe2O3 1.33 0.78 0.49 1.01 2.03 1.34 0.39 0.49 1.39 1.73 2.21 MnO 0.04 0.03 0.01 0.01 0.01 0.02 0.01 0.02 0.01 0.03 0.02 MgO 6.65 7.54 1.52 0.32 0.37 1.36 0.81 1.50 0.63 0.39 0.45 CaO 14.60 19.63 3.53 0.10 0.54 4.97 1.20 3.29 0.18 0.39 0.39 Na2O 0.48 0.26 0.14 0.06 0.10 0.31 0.08 0.10 0.09 0.18 0.17 K2O 1.67 0.86 0.27 0.30 0.42 1.16 0.34 0.53 0.69 0.90 0.87 P2O5 0.05 0.04 <0.01 - 0.03 <0.01 - 0.01 0.01 0.01 0.01 CO2 16.4 22.2 4.2 <0.2 0.2 3.6 1.0 3.8 0.8 0.8 0.4 LOI 19.21 23.69 4.54 - 4.34 7.27 2.49 4.80 2.69 - - Total 100.80 98.36 100.40 94.55 100.15 100.35 100.30 100.60 99.03 97.15 93.50
Cr (ppm) 27 22 10 45 28 26 12 80 18 52 74 Ni 27 11 9.0 <2.8 1.6 2.6 0.6 3.0 10.8 17 25 Co 16 10 42 16 25 27 31 41 26 22 21 Sc <5 <5 <5 70 15 15 10 10 5 40 40 V 55 50 10 15 55 60 40 10 35 105 145 Cu 15 20 5 5 5 5 5 5 5 20 20 Pb 4.5 1.5 2.5 7.0 3.0 2.5 2.0 7.0 5.0 12 30 Zn 25 15 15 15 15 10 5 10 15 95 30 Rb 31.0 18.8 6.0 8.0 26.0 38.8 10.0 15.0 29.8 53.0 55.0 Cs 0.7 0.4 0.1 0.3 1.1 1.1 0.1 0.3 0.7 2.4 2.8 Ba 927 388 174 47 204 788 151 212 219 341 364 Sr 871 1910 215 7.0 35.2 199 101 251 16.6 44.8 50 Li 22 16 6 6 12 13 5 5 9 21 25 Ta 2 2 14 4 6 8 11 14 9 5 4 Nb 2 1 4 1 6 6 4 5 5 11 12 Hf <1 <1 <1 - 1 3 3 1 5 6 7 Zr 44 37 54 32 83 136 145 109 223 272 281 Y 7 6 3 2 8 9 4 6 10 19 22 Ga 2 <1 1 1 5 2 1 1 2 11 15 Th 2 2 <1 1 4 3 1 1 2 8 10 U 9.0 12.0 1.5 0.5 1.5 2.0 1.0 1.5 0.5 2.0 4.0 La 8.5 6.5 3.5 3.5 11.0 11.5 6.5 5.5 9.0 25.0 28.5 Ce 16.5 13.0 6.0 6.0 19.5 20.0 9.0 11.0 18.5 61.0 54.5 Pr 2.0 1.4 0.8 0.8 2.6 2.6 1.3 1.3 2.0 5.9 6.7 Nd 7.0 5.0 3.0 3.0 8.5 9.0 4.0 4.5 8.0 20.5 22.5 Sm 1.2 1.0 0.7 0.5 1.5 1.9 0.7 0.7 1.8 3.9 4.7 Eu 0.4 0.2 0.1 0.1 0.4 0.4 0.1 0.1 0.4 0.9 1.0 Gd 1.6 0.9 0.5 0.7 1.6 1.7 0.6 0.9 1.7 3.9 4.1 Tb 0.1 0.1 0.1 0.1 0.2 0.3 0.1 0.1 0.2 0.6 0.6 Dy 1.2 0.9 0.4 0.3 1.2 1.3 0.4 0.9 1.4 2.9 3.6 Ho 0.2 0.1 0.1 0.1 0.2 0.2 0.1 0.1 0.3 0.6 0.7 Er 0.7 0.5 0.2 0.2 0.7 0.8 0.3 0.6 0.9 1.9 1.9 Tm <0.1 <0.1 <0.1 <0.1 <0.1 0.1 0.1 0.1 0.1 0.3 0.3 Yb 0.8 0.4 0.2 0.1 0.8 0.9 0.3 0.5 0.8 1.7 2.3 Lu <0.1 0.1 <0.1 <0.1 <0.1 <0.1 <0.1 <0.1 <0.1 0.3 0.3

56
TableIV- 2 continued Sample Nr 8262C 8262D 8262F 8348A 8348B 8348C 8348D 8348E 8348F 8348G 8348H Depth (m) 21 24 42 6 12 24 33 39 42 45 54 SiO2 (wt.%) 93.15 98.32 92.13 97.42 97.51 98.54 99.04 98.25 91.81 93.73 81.90 TiO2 0.15 0.09 0.14 0.05 0.08 0.04 0.07 0.06 0.16 0.14 0.34 Al2O3 2.70 0.95 2.47 0.57 0.88 0.40 0.65 0.57 2.73 2.53 6.91 Fe2O3 1.01 0.27 0.94 0.16 0.22 0.13 0.31 0.24 1.21 0.81 2.15 MnO 0.01 0.01 0.01 0.01 0.01 0.01 0.01 0.01 0.01 0.01 0.01 MgO 0.25 0.07 0.21 0.04 0.05 0.03 0.06 0.05 0.25 0.27 0.73 CaO 0.14 0.04 0.09 0.01 0.01 <0.01 0.06 0.03 0.41 0.11 0.28 Na2O 0.05 0.05 0.12 0.02 0.04 0.05 0.07 0.05 0.11 0.11 0.38 K2O 0.32 0.18 0.37 0.10 0.14 0.09 0.13 0.1 0.32 0.36 1.14 P2O5 - - <0.01 0.01 0.02 <0.01 - 0.01 0.01 0.01 0.03 CO2 <0.2 <0.2 <0.2 <0.2 0.2 <0.2 <0.2 <0.2 0.2 0.6 <0.2 LOI 2.94 0.88 2.57 0.71 0.89 0.66 - 0.72 3.26 2.21 5.84 Total 97.78 100.90 99.14 99.10 99.87 99.95 100.45 99.37 100.3 100.35 99.95
Cr (ppm) 44 28 15 6 7 5 10 6 20 22 33 Ni 24 32 5.6 4.0 3.0 2.2 1.0 3.0 1.4 1.4 12.4 Co 23 131 33 110 101 98 251 108 71 49 46 Sc 55 40 5 5 5 5 10 5 10 15 5 V 40 10 35 10 15 5 10 5 35 20 130 Cu 5 5 5 <5 <5 <5 <5 <5 <5 5 35 Pb 12 28 4.5 3.0 2.5 1.5 1.0 1.5 3.0 3.5 11 Zn 5 5 10 5 5 15 5 5 15 75 70 Rb 21.0 7.0 19.0 4.0 5.8 3.2 5.0 4.0 17.4 15.6 93.4 Cs 0.6 0.2 0.5 - 0.1 <0.1 0.1 0.1 0.6 0.4 3.0 Ba 132 77 124 37 62 38 86 57 210 179 708 Sr 20.0 8.0 17.4 5.0 6.3 3.0 7.0 6.0 18.0 11.0 79.4 Li 7 3 7 3 4 3 3 4 7 7 18 Ta 6 46 11 39 37 38 81 40 24 16 11 Nb 4 14 6 12 12 11 24 12 10 6 14 Hf 3 1 2 - 1 <1 - 1 1 1 5 Zr 124 92 117 55 87 48 71 69 90 67 227 Y 6 3 6 2 3 2 3 3 9 4 20 Ga 1 1 1 <1 <1 <1 <1 <1 1 1 18 Th 2 1 1 <1 <1 <1 <1 <1 3 1 10 U 0.5 0.5 0.5 <0.5 <0.5 <0.5 <0.5 <0.5 2 0.5 2.5 La 8.0 4.0 8.5 2.5 4.5 4.0 5.0 4.5 14.5 7.0 33.5 Ce 15.0 7.5 16.0 4.0 7.0 5.0 9.5 8.5 31.5 13.5 65.0 Pr 1.8 0.9 1.9 0.5 0.9 0.6 1.2 1 3.6 1.7 8.2 Nd 5.5 3.0 7.0 1.5 3.0 2.0 3.5 3.5 12 5.5 26.0 Sm 1.2 0.5 1.4 0.3 0.5 0.3 0.8 0.7 2.6 0.9 5.0 Eu 0.1 0.1 0.3 0.1 0.1 0.1 0.1 0.1 0.6 0.2 1.3 Gd 1.0 0.5 1.2 0.1 0.3 0.2 0.6 0.7 2.2 0.9 4.0 Tb 0.1 0.1 0.1 <0.1 <0.1 <0.1 <0.1 <0.1 0.3 0.1 0.7 Dy 0.8 0.5 0.8 0.1 0.2 0.1 0.4 0.4 1.6 0.7 3.9 Ho 0.1 0.1 0.1 0.1 0.1 0.1 0.1 0.1 0.3 0.1 0.7 Er 0.6 0.3 0.5 0.1 0.1 0.1 0.4 0.3 1 0.3 2.2 Tm 0.1 0.1 0.1 <0.1 <0.1 <0.1 <0.1 <0.1 <0.1 0.1 0.3 Yb 0.6 0.3 0.6 0.1 0.3 0.1 0.2 0.3 0.7 0.3 1.6 Lu <0.1 <0.1 0.1 <0.1 0.1 0.1 <0.1 <0.1 <0.1 <0.1 0.3
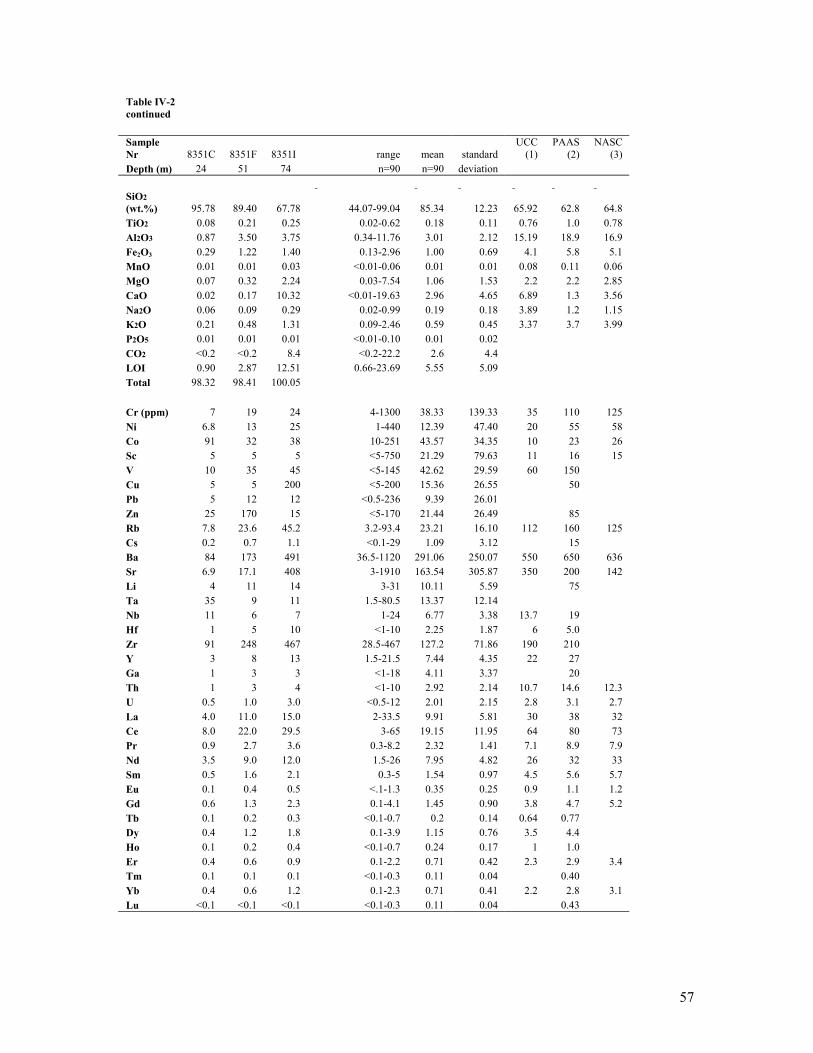
57
Table IV-2 continued Sample Nr 8351C 8351F 8351I range mean standard
UCC (1)
PAAS (2)
NASC (3)
Depth (m) 24 51 74 n=90 n=90 deviation SiO2 (wt.%) 95.78 89.40 67.78 44.07-99.04 85.34 12.23 65.92 62.8 64.8 TiO2 0.08 0.21 0.25 0.02-0.62 0.18 0.11 0.76 1.0 0.78 Al2O3 0.87 3.50 3.75 0.34-11.76 3.01 2.12 15.19 18.9 16.9 Fe2O3 0.29 1.22 1.40 0.13-2.96 1.00 0.69 4.1 5.8 5.1 MnO 0.01 0.01 0.03 <0.01-0.06 0.01 0.01 0.08 0.11 0.06 MgO 0.07 0.32 2.24 0.03-7.54 1.06 1.53 2.2 2.2 2.85 CaO 0.02 0.17 10.32 <0.01-19.63 2.96 4.65 6.89 1.3 3.56 Na2O 0.06 0.09 0.29 0.02-0.99 0.19 0.18 3.89 1.2 1.15 K2O 0.21 0.48 1.31 0.09-2.46 0.59 0.45 3.37 3.7 3.99 P2O5 0.01 0.01 0.01 <0.01-0.10 0.01 0.02 CO2 <0.2 <0.2 8.4 <0.2-22.2 2.6 4.4 LOI 0.90 2.87 12.51 0.66-23.69 5.55 5.09 Total 98.32 98.41 100.05 Cr (ppm) 7 19 24 4-1300 38.33 139.33 35 110 125 Ni 6.8 13 25 1-440 12.39 47.40 20 55 58 Co 91 32 38 10-251 43.57 34.35 10 23 26 Sc 5 5 5 <5-750 21.29 79.63 11 16 15 V 10 35 45 <5-145 42.62 29.59 60 150 Cu 5 5 200 <5-200 15.36 26.55 50 Pb 5 12 12 <0.5-236 9.39 26.01 Zn 25 170 15 <5-170 21.44 26.49 85 Rb 7.8 23.6 45.2 3.2-93.4 23.21 16.10 112 160 125 Cs 0.2 0.7 1.1 <0.1-29 1.09 3.12 15 Ba 84 173 491 36.5-1120 291.06 250.07 550 650 636 Sr 6.9 17.1 408 3-1910 163.54 305.87 350 200 142 Li 4 11 14 3-31 10.11 5.59 75 Ta 35 9 11 1.5-80.5 13.37 12.14 Nb 11 6 7 1-24 6.77 3.38 13.7 19 Hf 1 5 10 <1-10 2.25 1.87 6 5.0 Zr 91 248 467 28.5-467 127.2 71.86 190 210 Y 3 8 13 1.5-21.5 7.44 4.35 22 27 Ga 1 3 3 <1-18 4.11 3.37 20 Th 1 3 4 <1-10 2.92 2.14 10.7 14.6 12.3 U 0.5 1.0 3.0 <0.5-12 2.01 2.15 2.8 3.1 2.7 La 4.0 11.0 15.0 2-33.5 9.91 5.81 30 38 32 Ce 8.0 22.0 29.5 3-65 19.15 11.95 64 80 73 Pr 0.9 2.7 3.6 0.3-8.2 2.32 1.41 7.1 8.9 7.9 Nd 3.5 9.0 12.0 1.5-26 7.95 4.82 26 32 33 Sm 0.5 1.6 2.1 0.3-5 1.54 0.97 4.5 5.6 5.7 Eu 0.1 0.4 0.5 <.1-1.3 0.35 0.25 0.9 1.1 1.2 Gd 0.6 1.3 2.3 0.1-4.1 1.45 0.90 3.8 4.7 5.2 Tb 0.1 0.2 0.3 <0.1-0.7 0.2 0.14 0.64 0.77 Dy 0.4 1.2 1.8 0.1-3.9 1.15 0.76 3.5 4.4 Ho 0.1 0.2 0.4 <0.1-0.7 0.24 0.17 1 1.0 Er 0.4 0.6 0.9 0.1-2.2 0.71 0.42 2.3 2.9 3.4 Tm 0.1 0.1 0.1 <0.1-0.3 0.11 0.04 0.40 Yb 0.4 0.6 1.2 0.1-2.3 0.71 0.41 2.2 2.8 3.1 Lu <0.1 <0.1 <0.1 <0.1-0.3 0.11 0.04 0.43

58
Table IV-2 continued Sample Nr
Accepted value laboratory laboratory
Accepted value laboratory laboratory
Depth (m) for standard obtained obtained for standard obtained obtained SiO2 (wt.%) 59.99 61.51 60.15 49.90 49.83 51.05 TiO2 0.71 0.67 0.71 0.29 0.28 0.29 Al2O3 14.41 13.78 14.27 20.69 19.28 19.95 Fe2O3 7.38 7.20 7.57 6.21 5.90 6.04 MnO 0.11 0.14 0.15 0.11 0.11 0.10 MgO 1.69 1.72 1.82 0.54 0.50 0.51 CaO 3.07 3.09 3.23 8.05 7.79 7.94 Na2O 1.11 1.20 1.28 7.10 7.03 7.13 K2O 2.37 2.14 2.25 1.66 1.57 1.61 P2O5 0.13 0.11 0.10 CO2 1.8 1.8 2.0 LOI 8.37 8.63 8.57 Total Cr (ppm) 74 116 115 74 113 117 Ni 286.0 292 291 286 305 284 Co 18 24 23 3 3 3 Sc 12 10 10 12 10 10 V 170 180 175 5 5 5 Cu 175 190 185 5 5 5 Pb 670 623 638 670 611 601 Zn 165 210 180 95 90 90 Rb 84.5 86.0 88.2 55 54 51 Cs 4.7 4.7 4.5 2 2 1 Ba 1210 1190 1240 340 341 285 Sr 238.0 228.0 254 1190 1120 1175 Li 29 28 29 29 29 28 Ta 1 1 1 0.9 1.0 0.5 Nb 8 8 8 13 12 10 Hf 4 3 3 11 9 9 Zr 138 145 143 517 547 479 Y 24 22 23 119.0 120.0 124.5 Ga 18 17 17 35 38 38 Th 10 7 7 1 1 1 U 11.1 10.5 11.5 0.8 0.5 0.5 La 23.0 22.0 22.0 58.0 54.5 56.5 Ce 45.0 44.5 45.5 122.0 118.5 120.0 Pr 5.2 5.3 5.4 15.0 14.3 14.4 Nd 21.0 19.5 19.5 57.0 51.5 50.5 Sm 4.5 3.9 4.0 12.7 11.7 11.8 Eu 1.0 0.9 1.0 2.0 1.9 1.9 Gd 4.2 4.0 4.0 14.0 13.8 13.4 Tb 0.7 0.7 0.7 2.6 2.7 2.4 Dy 3.8 3.6 3.8 18.2 16.8 16.3 Ho 0.8 0.7 0.7 4.3 4.0 3.9 Er 2.4 2.3 2.2 14.2 13.8 12.9 Tm 0.4 0.3 0.3 2.3 2.0 2.0 Yb 2.3 2.1 2.3 14.8 13.3 13.6 Lu 0.3 0.3 0.3 2.1 1.9 1.8

59
IV.2.5 Petrography
Table IV-1 provides a summary of the grain size data from both drilling and split spoon samples
from boreholes investigated. These data indicate an average grain size of between 1.7 and 2.2 φ,
with a sorting between 0.56 and 0.77 for the different boreholes. Furthermore, the average grain
size of the 42 shallow depth samples collected during this study was 2.40 φ (range 2.13–2.70),
with an average sorting of 0.69. All these data are consistent with previously published grain size
data of McCarthy and Ellery (1995) who pointed out that sediments from the lower Boro region
of the Okavango Delta are dominated by well sorted sand of 2.2 φ average grain size.
Microscopic and X-ray diffraction data (Figure IV-3 and Table IV-1) indicate that the studied
samples contain the following minerals: quartz (28–100 vol.%), calcite (0–65 vol.%), dolomite
(0–45 vol.%), K-feldspar (0–4vol.%), kaolinite (0–3 vol.%), traces of muscovite and other clays
(0–3 vol.%). XRD analysis of the sample 8159G indicates that it containsV-muscovite, in
addition to the minerals reported in other Okavango sediments. Important to stress is that (1) no
detrital muscovite has been observed under the microscope in this sample; (2) submicroscopic
muscovite recorded in young sediments by XRD analyses is usually muscovite–smectite mixed
layers (e.g., Deer et al., 1992). The existence of traces of heulandite in the sample 8159N (XRD
data) is not yet well constrained. The presence of a micritic carbonate cement around quartz
grains can be seen in Figure IV-3c. There are no lithic fragments in the samples documented. The
samples with the lowest quartz modal content (<85 vol.%) are rich in carbonates (>15 vol.%).
Recalculating the modal composition in terms of quartz (Q), feldspars (F) and lithic fragments (L)
result in Q≥94, F≤6% and L=0. In the Q–F–L diagram (Figure IV-4); the data indicate that these
sediments have the modal composition of very mature quartz arenites of continental cratonic
provenance (e.g., Dickinson and Suczec, 1979). However, it is important to keep in mind that this
modal composition is mainly controlled by the aeolian sand component and is not representative
of the other sediment components discussed later.

60
Figure IV 3. Representative thin sections of Okavango sediments. (a) sand grains (some fractured) within a carbonate cement. (b) Sand grains within a minor diagenetic silica overgrowth. (c) Micritic calcrete forming between the sand grains. (d) sand grains showing considerable weathering on the surface.

61
QuartzQuartzarenite
Lithic fragmentsFeldspar
Continental blockprovenances
Magmatic arcprovenances
Recycled orogenprovenances
Decreasing maturityor stability
Okavango Deltasediments
Figure IV 4. Q-F-L diagram for the Okavango sediments (after Dickinson and Suczec, 1979)

62
IV.2.6 Major element composition
The SiO2 content of the Okavango siliciclastic sediments ranges from 53.82 to 99.04 wt.%. Two
samples, BH8159O and BH8159M, have lower SiO2 contents (TableIV-2). These two samples
are also marked by high concentrations of CaO, MgO and CO2. There is a strong negative
correlation between SiO2 and Al2O3 when carbonate-bearing (CO2>0.2 wt.%) samples are
discarded (Figure IV-5a). Al2O3 shows a strong positive correlation with TiO2 (Figure IV-5b) and
total Fe2O3 (Figure IV-5c). In carbonate-free samples (CO2<0.2 wt.%), Al2O3 shows a positive
correlation with MgO (Figure IV-5d) and LOI (Figure IV-5h). There is a weak positive
correlation between Al2O3 and K2O (Figure IV-5e) and Na2O (Figure IV-5f). In the Al2O3–K2O
diagram (Figure IV-5e), the analyses are distributed between the lines K2O/Al2O3=0.09 and 0.67.
Similarly, the samples plot between the lines Na2O/Al2O3=0.02 and 0.22 in the Al2O3–Na2O
diagram (Figure IV-5f). The average K2O/Al2O3 ratios of the Okavango Delta sediments is close
to K2O/Al2O3 ratios in the upper continental crust average composition (UCC), Post-Archaean
Australian shales average composition (PAAS) and North American shale composite average
value (NASC; Table IV-3).

63
1
2
3
1
2
3
KO 2
0.2
0.6
1
90
100
SiO 2
FeO 2
3
0.7.
0.5
0.3
0.1
TiO 2
MgO
NaO 2
8
6
4
2
2 6
Al O2 3
0.25
LOICIA
80
60
2 6
Al O2 3
(a) (b)
(c) (d)
(e)
(g) (h)
(f)
Figure IV 5. Binary diagrams for Okavango Delta sediment: major elements compositions in wt.%
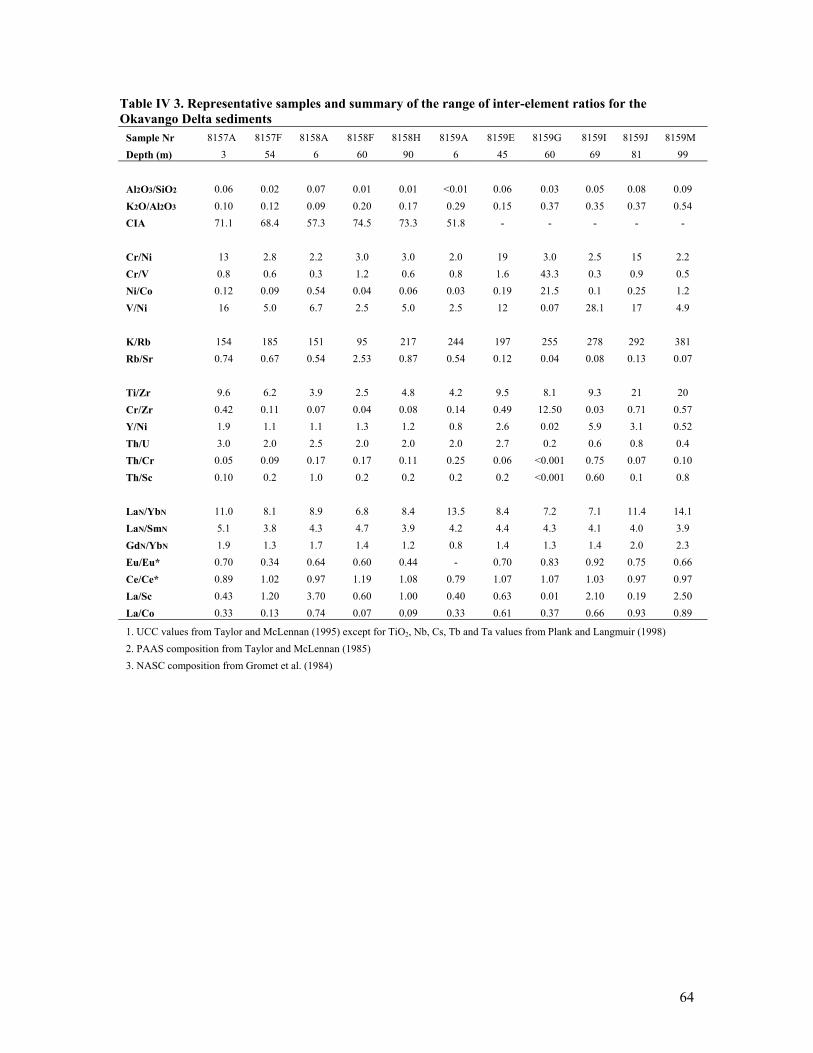
64
Table IV 3. Representative samples and summary of the range of inter-element ratios for the Okavango Delta sediments
Sample Nr 8157A 8157F 8158A 8158F 8158H 8159A 8159E 8159G 8159I 8159J 8159M Depth (m) 3 54 6 60 90 6 45 60 69 81 99
Al2O3/SiO2 0.06 0.02 0.07 0.01 0.01 <0.01 0.06 0.03 0.05 0.08 0.09 K2O/Al2O3 0.10 0.12 0.09 0.20 0.17 0.29 0.15 0.37 0.35 0.37 0.54 CIA 71.1 68.4 57.3 74.5 73.3 51.8 - - - - - Cr/Ni 13 2.8 2.2 3.0 3.0 2.0 19 3.0 2.5 15 2.2 Cr/V 0.8 0.6 0.3 1.2 0.6 0.8 1.6 43.3 0.3 0.9 0.5 Ni/Co 0.12 0.09 0.54 0.04 0.06 0.03 0.19 21.5 0.1 0.25 1.2 V/Ni 16 5.0 6.7 2.5 5.0 2.5 12 0.07 28.1 17 4.9 K/Rb 154 185 151 95 217 244 197 255 278 292 381 Rb/Sr 0.74 0.67 0.54 2.53 0.87 0.54 0.12 0.04 0.08 0.13 0.07 Ti/Zr 9.6 6.2 3.9 2.5 4.8 4.2 9.5 8.1 9.3 21 20 Cr/Zr 0.42 0.11 0.07 0.04 0.08 0.14 0.49 12.50 0.03 0.71 0.57 Y/Ni 1.9 1.1 1.1 1.3 1.2 0.8 2.6 0.02 5.9 3.1 0.52 Th/U 3.0 2.0 2.5 2.0 2.0 2.0 2.7 0.2 0.6 0.8 0.4 Th/Cr 0.05 0.09 0.17 0.17 0.11 0.25 0.06 <0.001 0.75 0.07 0.10 Th/Sc 0.10 0.2 1.0 0.2 0.2 0.2 0.2 <0.001 0.60 0.1 0.8 LaN/YbN 11.0 8.1 8.9 6.8 8.4 13.5 8.4 7.2 7.1 11.4 14.1 LaN/SmN 5.1 3.8 4.3 4.7 3.9 4.2 4.4 4.3 4.1 4.0 3.9 GdN/YbN 1.9 1.3 1.7 1.4 1.2 0.8 1.4 1.3 1.4 2.0 2.3 Eu/Eu* 0.70 0.34 0.64 0.60 0.44 - 0.70 0.83 0.92 0.75 0.66 Ce/Ce* 0.89 1.02 0.97 1.19 1.08 0.79 1.07 1.07 1.03 0.97 0.97 La/Sc 0.43 1.20 3.70 0.60 1.00 0.40 0.63 0.01 2.10 0.19 2.50 La/Co 0.33 0.13 0.74 0.07 0.09 0.33 0.61 0.37 0.66 0.93 0.89
1. UCC values from Taylor and McLennan (1995) except for TiO2, Nb, Cs, Tb and Ta values from Plank and Langmuir (1998) 2. PAAS composition from Taylor and McLennan (1985) 3. NASC composition from Gromet et al. (1984)

65
Table IV-3 continued
Sample Nr 8159N 8159O 8159T 8162D 8162E 8162J 8162K 8162L 8162O 8262A 8262B Depth (m) 102 114 147 15 24 45 51 54 63 3 12
Al2O3/SiO2 0.05 0.03 0.01 0.03 0.05 0.04 0.01 0.01 0.03 0.11 0.15 K2O/Al2O3 0.63 0.67 0.50 0.12 0.09 0.34 0.38 0.46 0.25 0.09 0.07 CIA - - - 79.9 - - - - - - - Cr/Ni 1.0 2.1 1.1 16 14 10 12 27 1.7 3.1 3.0 Cr/V 0.5 0.4 1.0 3 0.5 0.4 0.3 8.0 0.5 0.5 0.5 Ni/Co 1.8 1.1 0.21 0.18 0.07 0.10 0.02 0.07 0.42 0.77 1.22 V/Ni 2.0 4.7 1.1 5.4 28 20 67 3 3.2 6.2 5.8 K/Rb 447 380 374 311 134 248 294 297 192 141 131 Rb/Sr 0.04 0.01 0.03 1.20 0.74 0.20 0.10 0.06 1.80 1.20 1.10 Ti/Zr 19 15 5.6 24.3 16.7 9.7 3.3 5.0 4.0 12.3 13.2 Cr/Zr 0.62 0.60 0.19 1.4 0.34 0.19 0.08 0.73 0.08 0.19 0.26 Y/Ni 0.26 0.57 0.33 0.71 4.0 3.3 4.0 5.8 0.9 1.1 0.86 Th/U 0.2 0.2 0.7 2 2.7 1.5 1.0 0.7 4.0 4.0 2.5 Th/Cr 0.07 0.09 0.10 0.02 0.14 0.12 0.08 0.01 0.11 0.15 0.14 Th/Sc 0.1 0.4 0.2 0.01 0.3 0.2 0.1 0.1 0.4 0.2 0.3 LaN/YbN 7.2 11.0 11.8 23.6 9.3 8.6 14.6 7.4 7.6 9.9 8.4 LaN/SmN 4.5 4.1 3.1 4.4 4.6 3.8 5.8 4.9 3.1 4.0 3.8 GdN/YbN 1.6 1.8 2.0 5.7 1.6 1.5 1.6 1.5 1.7 1.9 1.4 Eu/Eu* 0.88 0.64 0.52 0.51 0.79 0.68 0.47 0.39 0.70 0.71 0.70 Ce/Ce* 0.99 1.04 0.86 0.86 0.92 0.90 0.78 1.02 1.02 1.25 0.99 La/Sc 1.70 1.30 0.70 0.05 0.73 0.77 0.65 0.55 1.80 0.63 0.71 La/Co 0.55 0.65 0.08 0.23 0.45 0.43 0.21 0.14 0.35 1.14 1.39
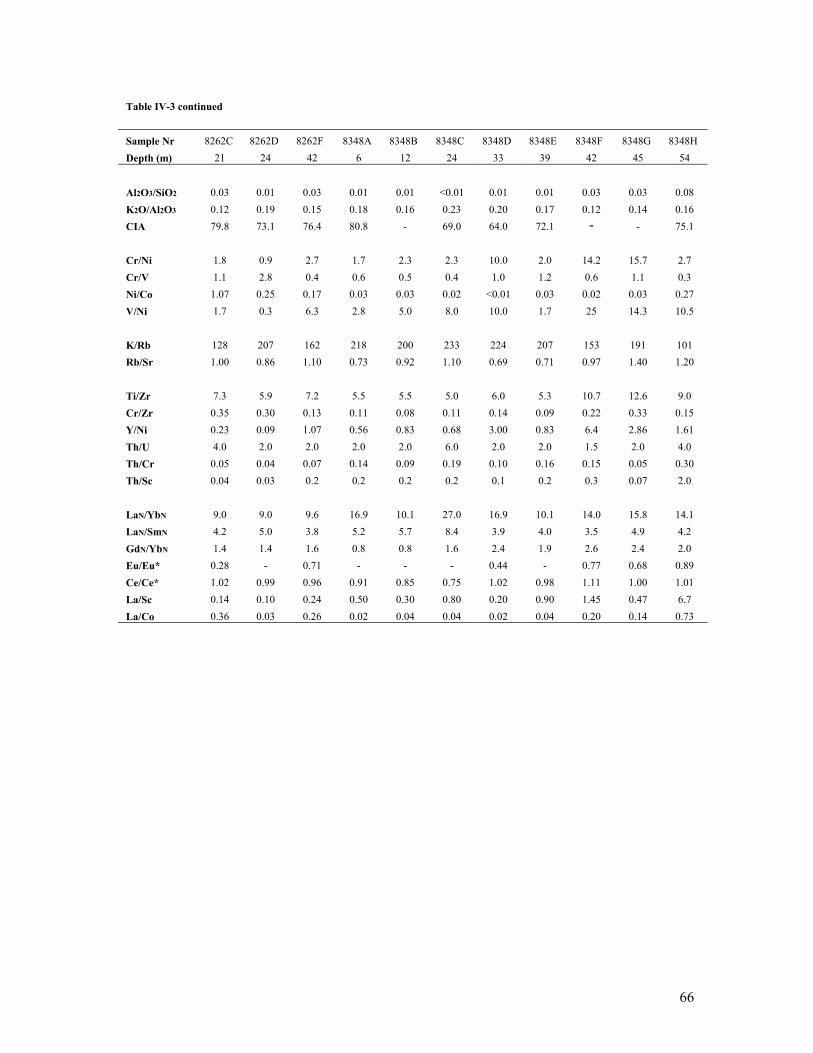
66
Table IV-3 continued
Sample Nr 8262C 8262D 8262F 8348A 8348B 8348C 8348D 8348E 8348F 8348G 8348H Depth (m) 21 24 42 6 12 24 33 39 42 45 54
Al2O3/SiO2 0.03 0.01 0.03 0.01 0.01 <0.01 0.01 0.01 0.03 0.03 0.08 K2O/Al2O3 0.12 0.19 0.15 0.18 0.16 0.23 0.20 0.17 0.12 0.14 0.16 CIA 79.8 73.1 76.4 80.8 - 69.0 64.0 72.1 - - 75.1 Cr/Ni 1.8 0.9 2.7 1.7 2.3 2.3 10.0 2.0 14.2 15.7 2.7 Cr/V 1.1 2.8 0.4 0.6 0.5 0.4 1.0 1.2 0.6 1.1 0.3 Ni/Co 1.07 0.25 0.17 0.03 0.03 0.02 <0.01 0.03 0.02 0.03 0.27 V/Ni 1.7 0.3 6.3 2.8 5.0 8.0 10.0 1.7 25 14.3 10.5 K/Rb 128 207 162 218 200 233 224 207 153 191 101 Rb/Sr 1.00 0.86 1.10 0.73 0.92 1.10 0.69 0.71 0.97 1.40 1.20 Ti/Zr 7.3 5.9 7.2 5.5 5.5 5.0 6.0 5.3 10.7 12.6 9.0 Cr/Zr 0.35 0.30 0.13 0.11 0.08 0.11 0.14 0.09 0.22 0.33 0.15 Y/Ni 0.23 0.09 1.07 0.56 0.83 0.68 3.00 0.83 6.4 2.86 1.61 Th/U 4.0 2.0 2.0 2.0 2.0 6.0 2.0 2.0 1.5 2.0 4.0 Th/Cr 0.05 0.04 0.07 0.14 0.09 0.19 0.10 0.16 0.15 0.05 0.30 Th/Sc 0.04 0.03 0.2 0.2 0.2 0.2 0.1 0.2 0.3 0.07 2.0 LaN/YbN 9.0 9.0 9.6 16.9 10.1 27.0 16.9 10.1 14.0 15.8 14.1 LaN/SmN 4.2 5.0 3.8 5.2 5.7 8.4 3.9 4.0 3.5 4.9 4.2 GdN/YbN 1.4 1.4 1.6 0.8 0.8 1.6 2.4 1.9 2.6 2.4 2.0 Eu/Eu* 0.28 - 0.71 - - - 0.44 - 0.77 0.68 0.89 Ce/Ce* 1.02 0.99 0.96 0.91 0.85 0.75 1.02 0.98 1.11 1.00 1.01 La/Sc 0.14 0.10 0.24 0.50 0.30 0.80 0.20 0.90 1.45 0.47 6.7 La/Co 0.36 0.03 0.26 0.02 0.04 0.04 0.02 0.04 0.20 0.14 0.73
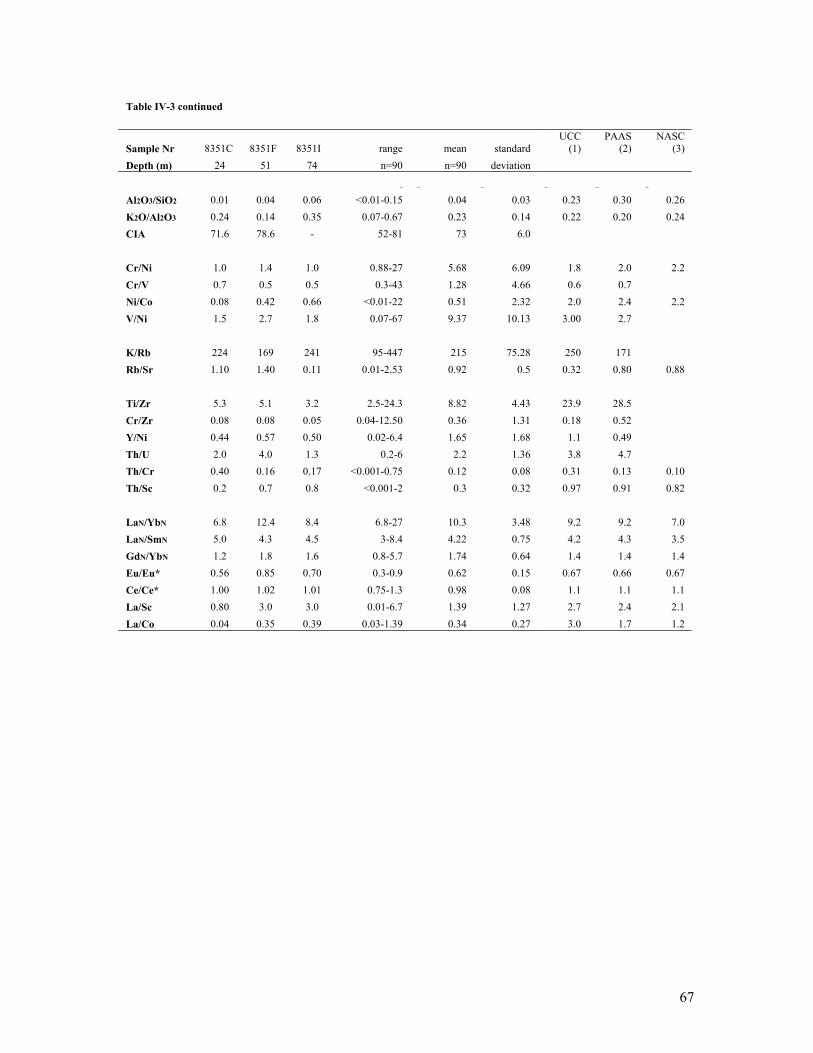
67
Table IV-3 continued
Sample Nr 8351C 8351F 8351I range mean standard UCC
(1) PAAS
(2) NASC
(3) Depth (m) 24 51 74 n=90 n=90 deviation
Al2O3/SiO2 0.01 0.04 0.06 <0.01-0.15 0.04 0.03 0.23 0.30 0.26 K2O/Al2O3 0.24 0.14 0.35 0.07-0.67 0.23 0.14 0.22 0.20 0.24 CIA 71.6 78.6 - 52-81 73 6.0 Cr/Ni 1.0 1.4 1.0 0.88-27 5.68 6.09 1.8 2.0 2.2 Cr/V 0.7 0.5 0.5 0.3-43 1.28 4.66 0.6 0.7 Ni/Co 0.08 0.42 0.66 <0.01-22 0.51 2.32 2.0 2.4 2.2 V/Ni 1.5 2.7 1.8 0.07-67 9.37 10.13 3.00 2.7 K/Rb 224 169 241 95-447 215 75.28 250 171 Rb/Sr 1.10 1.40 0.11 0.01-2.53 0.92 0.5 0.32 0.80 0.88 Ti/Zr 5.3 5.1 3.2 2.5-24.3 8.82 4.43 23.9 28.5 Cr/Zr 0.08 0.08 0.05 0.04-12.50 0.36 1.31 0.18 0.52 Y/Ni 0.44 0.57 0.50 0.02-6.4 1.65 1.68 1.1 0.49 Th/U 2.0 4.0 1.3 0.2-6 2.2 1.36 3.8 4.7 Th/Cr 0.40 0.16 0.17 <0.001-0.75 0.12 0.08 0.31 0.13 0.10 Th/Sc 0.2 0.7 0.8 <0.001-2 0.3 0.32 0.97 0.91 0.82 LaN/YbN 6.8 12.4 8.4 6.8-27 10.3 3.48 9.2 9.2 7.0 LaN/SmN 5.0 4.3 4.5 3-8.4 4.22 0.75 4.2 4.3 3.5 GdN/YbN 1.2 1.8 1.6 0.8-5.7 1.74 0.64 1.4 1.4 1.4 Eu/Eu* 0.56 0.85 0.70 0.3-0.9 0.62 0.15 0.67 0.66 0.67 Ce/Ce* 1.00 1.02 1.01 0.75-1.3 0.98 0.08 1.1 1.1 1.1 La/Sc 0.80 3.0 3.0 0.01-6.7 1.39 1.27 2.7 2.4 2.1 La/Co 0.04 0.35 0.39 0.03-1.39 0.34 0.27 3.0 1.7 1.2

68
The degree of chemical weathering of the source material of sedimentary siliciclastic rocks can be
constrained by calculating the chemical index of alteration (CIA) of Nesbitt and Young (1982),
where CIA=molar [Al2O3/(Al2O3+CaO*+Na2O+K2O)], CaO* being the amount of CaO in silicate
minerals only (i.e., excluding carbonates and apatite). The CIA values vary from about 50 for
unweathered upper crust to about 100 for highly weathered residual soils. The Okavango
sediments contain variable amounts of carbonate minerals and this is reflected by variable CO2
contents. Calcite and dolomite coexist in these rocks, and there are no microprobe data available
on these minerals. Therefore, it is unrealistic to attempt correcting the carbonate-effect on the
total content of CaO and MgO in the Okavango sediments. To avoid the diagenetic carbonate-
effect, only samples devoid of carbonate minerals and marked by CO2<0.2 wt.% are used in the
calculation of CIA and in geochemical diagrams requiring the utilisation of CaO or MgO content
in silicate minerals. The Okavango siliciclastic sediments with CO2 <0.2 wt.% were corrected for
apatite-effect using P2O5 values of the samples (Table IV-2) and yielded CIA values (Table IV-3)
in the range 52–81 (average 73). Nesbitt and Young (1982) indicate that the influence of
weathering processes at the source on the composition of clastic sediments can also be detected
using the A–CN–K diagram [=molar (Al2O3–(CaO*+Na2O)–K2O)] where CaO* represents the
amount of CaO entering into the structure of silicate minerals. Figure IV-6 shows the distribution
of the carbonate-free Okavango sediments in the A–CN–K diagram. For comparison, the
compositions of UCC, PAAS and NASC are also plotted in the diagram along with the predicted
weathering trend for the average upper continental crust (Taylor and McLennan, 1985). This
trend encompasses the majority of the Okavango samples.
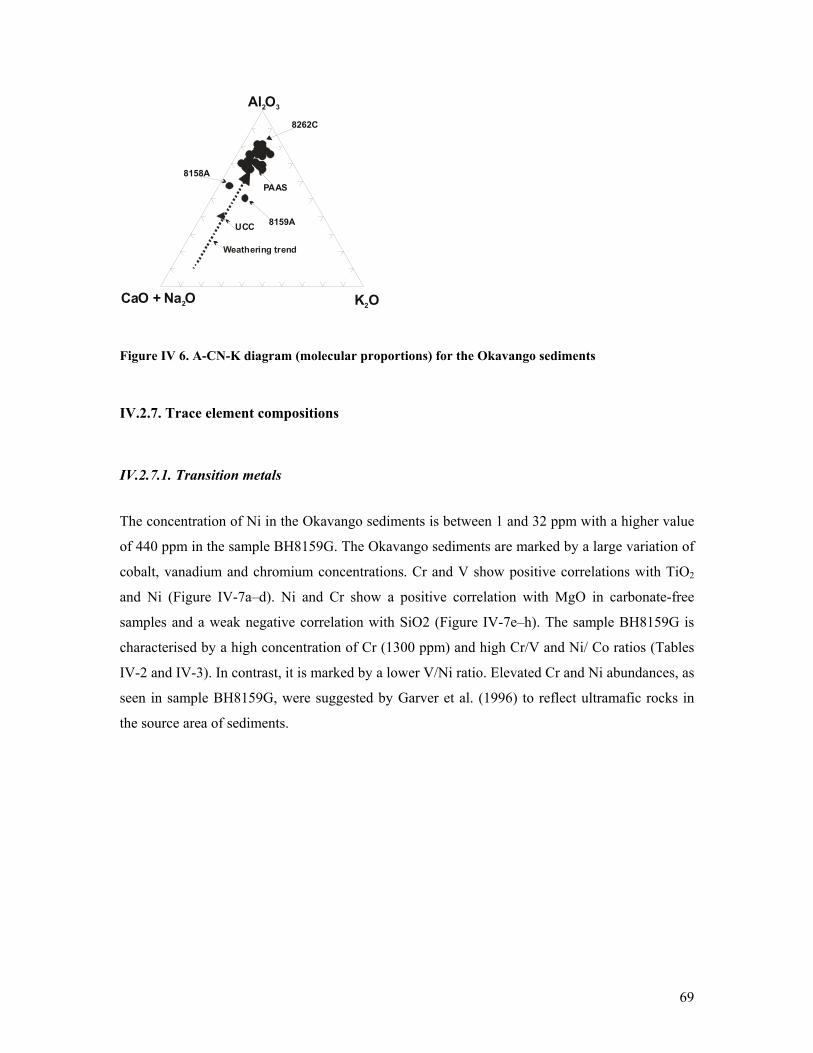
69
Al O2 3
CaO + Na O2
UCC
PAAS
8262C
8159A
8158A
K O2
Weathering trend
Figure IV 6. A-CN-K diagram (molecular proportions) for the Okavango sediments
IV.2.7. Trace element compositions
IV.2.7.1. Transition metals
The concentration of Ni in the Okavango sediments is between 1 and 32 ppm with a higher value
of 440 ppm in the sample BH8159G. The Okavango sediments are marked by a large variation of
cobalt, vanadium and chromium concentrations. Cr and V show positive correlations with TiO2
and Ni (Figure IV-7a–d). Ni and Cr show a positive correlation with MgO in carbonate-free
samples and a weak negative correlation with SiO2 (Figure IV-7e–h). The sample BH8159G is
characterised by a high concentration of Cr (1300 ppm) and high Cr/V and Ni/ Co ratios (Tables
IV-2 and IV-3). In contrast, it is marked by a lower V/Ni ratio. Elevated Cr and Ni abundances, as
seen in sample BH8159G, were suggested by Garver et al. (1996) to reflect ultramafic rocks in
the source area of sediments.

70
Ni
TiO %2
50
100
150
0.2 0.6 1
V
PAAS
UCC
(b)
50
100
UCC
PAAS
NASC(a)
Ni (ppm )
10Nii
(d)
(BH8159G)
50 70 90 SiO 2
(h)
PAAS(g)
(BH8159G)
(c)(BH8159G)
Cr
TiO 2
Cr
(e)
MgO
20
100
50
0.5
30
(f)
Figure IV. 7. Transition metal characteristics of the Okavango sediments in the plots Cr and V vs. TiO2 (a,b); Cr and V vs. Ni (c,d); Cr and Ni vs. MgO (e,f) and Cr and Ni vs. SiO2

71
IV.2.7.2. Alkalis and alkali-earth elements
A strong positive correlation exists between K2O and Rb (Figure IV-8a). Sr shows a large range
and a positive correlation with CO2 (Figure IV-8b). Rb/Sr range of carbonate-free samples
encompasses the Rb/Sr ratio for PAAS. The sample BH8158F is marked by a high Cs
concentration. Rb shows a strong positive correlation with Cs in carbonate-free samples (Figure
IV-8c). There is also a positive correlation between K2O and Ba in carbonate-free samples
(Figure IV-8d), showing relative Ba enrichment or K2O depletion of the Okavango sediments
relative to the variation trendline in Archaean siliciclastic sedimentary rocks (e.g., Lahtinen,
2000).

72
1
3
40 80 120 160Rb
KO 2
UCCPAAS
(a)
5CO2
100
200
300
Sr
(b)
1
2
3
Cs
40 80 120 160
Rb
(C)
200
400
600
800
2 4
Ba UCC
NASC
K O2
Archaean trend(d)
Figure IV. 8. Geochemical characteristics of the Okavango sediments in the binary diagrams: (a) K2O vs. Rb; (b) Sr vs. CO2; (c) Cs vs. Rb and (d) Ba vs. K2O. The Archaean trend for panel (d) is from data from Lahtinen (2000)

73
IV..2.7.3. High-field-strength-elements (HFSE), Th and U
Average Zr concentration in the Okavango sediments (Table IV-2) is 120 ppm, and fine-grained
clastic sedimentary rocks are characterised by an average Zr concentration of 200F100 ppm
(Taylor and McLennan, 1985). Two Okavango samples (BH8158A and BH8351I) have higher Zr
concentrations between ~440 and 470 ppm (Table IV-2). The average Zr/Hf ratio of the
Okavango sediments deduced from the Zr–Hf correlation curve is ~38 (Figure IV-9). This value
is similar to chondritic values and to Zr/Hf ratios in Archaean and Proterozoic sedimentary rocks
in Southern Africa (Wronkiewicz and Condie, 1987; Toulkeridis et al., 1999; David et al., 2000).
200
400
2 6 10
Hf
Zr
Figure IV. 9. Binary diagram Zr vs. Hf for the Okavango sediments Ti/Zr ratios for the Okavango sediments (Table IV-3) are lower than values commonly recorded
in mafic igneous rocks (usually>>50), whereas felsic igneous rocks are characterised by lower
values of <20. Cr/Zr and Y/Ni ratios for the Okavango samples overlap the range of values
reported in both mafic and felsic igneous rocks. Cr/Zr in igneous rocks is usually >1 for mafic
and <0.5 for felsic rocks. The ratio Y/Ni is lower in mafic igneous rocks (<1) than in felsic
igneous rocks (>10 except in some extensional granites/rhyolites). The Nb concentrations are
high in sample BH8348D (Table IV-2). The Th concentrations are lower in the Okavango
sediments compared to average values in UCC, PAAS and NASC. The range of U and Th/U
values in the Okavango sediments encompasses the values obtained from UCC, PAAS and
NASC. With the exception of sample BH8159G, which is marked by an extremely low Th/Cr
ratio, the Th/Cr ratios for the Okavango sediments overlap values recorded in fine
sands/sandstones originating from both felsic and mafic sources (Table IV-4). Archaean pelites

74
from the Kaapvaal craton in southern Africa are characterised by Th/Cr≤0.02 (e.g., Condie and
Wronkiewicz, 1990; Jahn and Condie, 1995), whereas Proterozoic pelites are marked by higher
values, similar to those in the Okavango clastic sediments. With the exception of sample 8159G,
the Th/Sc ratios for the Okavango sediments overlap the range of ratios obtained for sediments
from felsic and mafic source rocks (Table IV-4).
IV.2.7.4. Rare earth elements
The Okavango clastic sediments show a strong positive correlation between individual REE and
Al2O3 contents (Figure IV-10). The rare earth element compositions of these sediments (Table
IV-2) are shown in chondrite-normalized diagrams (Figure IV-11). The chondrite-normalized
REE pattern of PAAS is also shown in the diagrams for comparison. The REE patterns of the
Okavango sediments are characterized by: (1) chondrite-normalized REE values (LaN up to YbN)
greater than one. The REE patterns show that the Okavango sediments are less enriched in REE
than the PAAS; (2) substantial fractionation of light rare earth elements (LREE); (3) flat to
slightly fractionated heavy rare earth element (HREE) patterns; (4) a variable Eu-negative
anomaly. The sample 8159G displays REE contents similar to values in Okavango sediments
with the same SiO2 content (Table IV-2). The range of Eu/Eu* for the Okavango sediments
overlaps the ranges recorded in clastic sediments from felsic and mafic source rocks (Table IV-4);
(5) a weak to strong negative Ce anomaly in some samples with the majority of samples
characterised by Ce/Ce* in the range 0.9–1.2.

75
Table IV. 4.The range of elemental ratios in fine sandstones derived from felsic and maifc rocks and comparison with the range for the Okavango sediments. Potential source rocks from NW Botswana also included (CKP suite).
Ratio Fine sandstone Okavango sediments CKP11220 CKP10926B CKP11277 CKP10A299 CKP samples CKP samples
Range for sediments Range for sediments Range Felsic Felsic Mafic Ultra-mafic Felsic Mafic from felsic source1 from mafic sources1 n= 46 n= 30
Th/Cr 0.13-2.7 0.018-0.046 <0.001-0.75 0.17 0.58 0.01 0.01 0.07-14.50 <0.01-0.50 Th/Sc 0.84-20.5 0.05-0.22 <0.001-2 Eu/Eu* 0.4-0.94 0.71-0.95 0.3-0.9 0.64 1.23 1.18 0.94 0.28-1.23 0.55-1.22 La/Sc 2.5-16.3 0.43-0.86 0.01-6.7 La/Co 1.8-13.8 0.14-0.38 0.03-1.39 2.03 1.09 0.21 0.48 0.42-15.18 0.10-1.58
1) Cullers (2000)

76
10
20
30La
20
40
60
80
Ce
2
4
Sm
2
4
5 15
Al O2 3
Gd
Eu Er
PAAS
UCC
NASC
PAAS
UCC
NASC
PAAS
0.2
0.6
1
UCC
PAAS
NASC
PAAS
1
2
3
5 15
NASC
PAAS
UCC
Al O2 3
NASC
Figure IV. 10. REE vs. Al2O3 diagrams for the Okavango sediments

77
100Sa
mple
/Cho
ndrit
eSa
mple
/Cho
ndrit
e
1
10
100
Figure IV. 11. Chondrite normalized REE plots of the Okavango sediments. PAAS plotted as reference
The La/Sc ratios of the Okavango sediments overlap the ratios recorded in sediments originating
from felsic and mafic source rocks (Table IV-4). La/Co ratios for the Okavango sediments
include low values similar to those recorded in sediments from mafic sources and higher values
(up to 1.39 in sample 8262B) requiring either an intermediate composition source or a
contribution from both mafic and felsic source rocks.
Wronkiewicz and Condie (1987) indicated that the source rock lithology (mafic, intermediate or
felsic) strongly influences the concentrations of Th, Sc, La, Zr, Hf and Co in the siliciclastic
sedimentary rocks. The relationships between these elements were used to devise ternary
diagrams for the identification of the nature of the source rocks of siliciclastic sedimentary rocks.
In the diagrams La–Th–Sc (Figure IV-12a), Th–Sc–Zr (Figure IV-12b) and Th–Hf–Co (Figure
IV-12c), the Okavango sediments define evolutionary trends or a field extending from mafic to
felsic source rock endmembers. Since these elements do not enter in the structure of quartz, these
trends/fields exclude the aeolian sand component of the sediments. The samples BH8158A and
BH8351I plot outside that evolution trend in the Th–Sc–Zr diagram, being displaced towards the
Zr apex.

78
Th
Sc Zr/10
La
Th
Th
Hf Co
Granodiorite PAAS UCCUCC
PAAS
CKP1122008158A
8351I
(a) (b) (c)
8262B
8348H
Granite
BasaltTonalite
Granite
Tholeiite
Komatiite
CKP10296B
CKP11277
CKP10A299
Figure IV. 12. Geochemical characteristics of the Okavango sediments in the ternary diagrams: (a) La-Th-Sc showing a single evolution trend; (b) Th-Sc-Zr/10 and (c) Th-Hf-Co. Note that the Okavango sediment sample BH8262B overlaps with the composition of the Proterozoic granitoids sample CKP11220 from NW Botswana suggesting that these granitoids could be the source of this sediment
IV.2.8. Discussion
IV.2.8.1. Introduction
Several factors control the chemical composition of elements in siliciclastic sedimentary rocks.
The most commonly documented are diagenesis, metamorphism, grain-size and density-
controlled hydraulic sorting, petrological composition of the source rocks, degree of weathering
of the source area and the tectonic setting (e.g., Nesbitt and Young, 1982; McLennan et al., 1983;
Wronkiewicz and Condie, 1987; Roser and Korsch, 1988; Camire´ et al., 1993; Cullers, 1994a;
Fedo et al., 1996; Bock et al., 1998). Metamorphic remobilisation is excluded for the studied
samples because the Okavango sediments are unconsolidated. The first major geochemical
complexity of the Okavango sediments is that they show variable content of CO2, reflecting
variable amounts of diagenetic carbonate minerals and organic matter (organic C in the range ~0–
1.64 wt.%; authors, unpublished data). Carbonates induce a variable dilution on the clastic
component of the studied sediments. However, this study places emphasis on major, trace and
ratios of elements hosted in silicate minerals because when processing or plotting the chemical
composition of elements involved in the structure of carbonates (e.g., CaO and MgO), emphasis
was on carbonate-free samples. The second major geochemical complexity of the Okavango
sediments is that they contain a variable but important amount of quartz that induces a drastic
variation of SiO2 contents. This silica dilution effect induces strong variation on all trace element

79
contents (expressed in ppm). To overcome this complexity, this paper places emphasis on
interelement ratios and ternary diagrams involving elements that do not enter into the structure of
quartz. Most of the discussion below concentrates on unravelling the complex factors controlling
the geochemical characteristics of the Okavango sediments in terms of provenance excluding the
aeolian sand component.
The Okavango alluvial fan is a nascent (Quaternary) rift, and the half-graben is amagmatic
(Modisi et al., 2000). Thus, there is no input of young, weakly weathered volcanoclastic material
in the Okavango sediments. Therefore, this paper focuses on the remaining four main factors
discussed below.
IV.2.8.2. Grain-size and density-controlled sorting
The Okavango Delta sediments, including all the samples studied, are well sorted fine to
mediumgrained sands, with variable amounts of carbonates and minor silt and clay (Table IV-1
and DWA (Department of Water Affairs), 1997). The Okavango River water constitutes the
major source of the fine fraction of the sediments (McCarthy and Ellery, 1995). A number of
studies comparing the chemical composition of fine and coarse clastic sediments from the same
source showed that fine sediments are particularly rich in clay minerals and preferentially
concentrate elements entering in the structure of mafic minerals in igneous rocks (e.g., Cullers,
1994a,b). Coarser sediments contain a higher proportion of quartz and alkali feldspars. In the
Okavango sediments, quartz induces a dilution that is shown by the decrease of all elements with
the increase of silica in carbonate-free sediments (e.g., Figs. IV-5a and IV-7g,h). As stated above,
the quartz dilution effect explains the large variation of the concentration of the individual trace
elements (e.g., 25-fold for Co). Note that the variation of interelement ratios is smaller if samples
with abnormal contents for some elements (e.g., 8159G) are excluded. More complex
compositional variation occurs in clastic sediments when heavy minerals such as zircon, apatite,
monazite and titanite are concentrated in some stratigraphic units due to density-controlled
hydraulic sorting. Such units will be enriched in some elements entering in the structure of those
heavy minerals. In the Okavango sediments, the two samples showing a relatively high content of
Zr (BH8158A and BH8351I) are also marked by high Hf and HREE (e.g., Yb) abundances,
indicating a minor hydraulic concentration of zircon. In the ternary diagram Th–Sc–Zr (Figure
IV-12b), these samples are displaced towards the Zr-apex, indicating a higher amount of zircon
compared to other Okavango sediment samples. Monazite is characterised by high abundances of

80
LREE correlated with high contents of P2O5. This mineral and related geochemical trend has not
been found in the Okavango sediments. Chemical analyses of bulk-suspended solids led Sawula
et al. (1992) to suggest that TiO2-rich phases (e.g., titanite) were probably among the solid phases
transported by the Okavango floodwater. However, our microscopic and XRD data and a detailed
scanning electron microscope (SEM) investigation of Okavango sediments conducted by
McCarthy and Ellery (1995) did not record TiO2-rich phases. The excellent correlation between
Al2O3 and TiO2 (Figure IV-3b) suggests that both elements are hosted within clay minerals, as
previously pointed out by McCarthy and Ellery (1995). Thus, concentration of heavy minerals is
not the main factor controlling the chemical variation of the Okavango sediment composition,
although zircon concentration does occur in a few samples.
IV.2.8.3. Source area weathering and diagenetic processes
K-feldspar is the only feldspar detected in five out of 11 samples examined for XRD. The
apparent absence of plagioclase may be due to its somewhat lower resistance during transport and
weathering. The occurrence of both kaolinite and K-feldspar suggests an advanced weathering
source. This is supported by the absence of any mafic minerals, which are generally less resistant
to weathering. Calcite and dolomite cements are diagenetic. McCarthy and Metcalfe (1990)
estimated that 113,000 t. a-1 of CaCO3 and 135,000 t. a-1 of SiO2 are accumulating in the
Okavango Delta as a result of subsurface precipitation, as opposed to 40,000 t. a-1 of clastic
sediment. Thus, chemical precipitation is currently a major depositional process in the Okavango
basin.
Investigations of siliciclastic sedimentary rocks in several regions of the world show that their
chemical composition is largely inherited from the composition of the weathering profiles at the
source of sediments (Nesbitt and Young, 1982, 1984, 1989; Nesbitt et al., 1996). Nesbitt and
Young (1982) devised the chemical index of alteration (CIA) which provides a good measure of
the degree of alteration of the sediments’ source rocks. CIA value in the main rock-forming
minerals (quartz, plagioclase, alkali feldspars, pyroxene and olivine) is ≤55. Clay minerals yield
higher CIA values (usually ≥75), with the highest value (~100) recorded in kaolinite. Shales are
characterized by CIA values ~70–75, which reflect the predominance of clay minerals in their
composition. The Okavango sediments are marked by a large range of CIA values (52–81) and a
negative correlation of SiO2–Al2O3 (Figure IV-5a). These trends reflect a substantial
quartz±feldspar dilution-effect.. Petrographic studies (Figure IV-3 and Table IV-1) support this

81
observation since the Okavango sediments are predominantly made of quartz sand. CIA values
≥80 in sedimentary rocks are indication of a source severely affected by chemical weathering.
The Okavango sediments contain kaolinite as the dominant clay mineral, and McCarthy and
Ellery (1995) suggest that illuviation of fines, including clays, from the floodwater, into
preexisiting aeolian sand occurs beneath frequently flooded areas in the lower Delta.
In the A–CN–K diagram (Figure IV-6), the Okavango sediments define an evolution trend similar
to soils developing above igneous bedrocks. However, in the case of the Okavango sediments,
this trend should be interpreted with caution, especially when the origin of sediments is
considered. The data in Figure IV-6 can be interpreted using a mixing model involving two
components: (1) a strongly weathered component plotting close to the A-apex (e.g., sample
BH8262C). Kaolinite, which is the most abundant clay in the Okavango sediments (Table IV-1),
plots at this apex; (2) a relatively immature component which predominates in the sediments
plotting closer to the igneous trend line (e.g., sample BH8159A and BH8158A). Important to
keep in mind is that none of the studied samples is a pristine end-member since all the Okavango
Delta sediments contain a large proportion of sand but both end-members defined above should
be located along the mixing line shown in Figure IV-6. The component marking a source area
severely affected by chemical weathering corresponds to the sedimentary fraction transported by
the river from the Angolan hinterlands to the Okavango basin. The component from a weakly
weathered source area corresponds to the currently active aeolian component of the Okavango
sediments. An important observation from these data is that the geochemical trend in the A–CN–
K diagram (Figure IV-6) does not, in this case, reflect a progressive unroofing of a weathering
profile as is commonly the case in sedimentary rocks (e.g., Nesbitt and Young, 1984, 1989).
Therefore, caution should be exercised when interpreting the source area paleoweathering
process, using geochemical data from sedimentary packages containing an aeolian input. In such
cases, CIA values, evolution trends in A–CN–K diagrams and various other geochemical
indicators could underestimate the importance of chemical weathering at the source for the
component of the sediment transported by rivers from wetter regions and entering in a
sedimentary basin located in a semiarid region.
The range of negative Ce anomalies reported in the Okavango sediment samples may have been
associated with the process of soil formation at the source. Changing pH and oxidation state
within the weathering profile allows fractionation of REE, leading to the formation of a range of
Ce/Ce* (e.g., Duddy, 1980; Braun et al., 1990).
82
IV.2.8.4. Source rock lithology
The combination of aeolian and fluviatile processes in the Okavango sedimentary records implies
a diversity of potential source rock components. Several workers showed that a number of
chemical elements are not fractionated by exogene processes and therefore could be used for the
identification of sediments source rock lithologies (e.g., Taylor and McLennan, 1985; McLennan
et al., 1990). The most important among these elements are REE, HFSE and some transition
metals (e.g., Cr, Co and Ni). However, Duddy (1980) and Condie et al. (1995) showed that REE
are in some cases redistributed in weathering profiles. Redox-dependent Ce-negative anomalies
observed in the Okavango sediments are also an indication of fractionation of this element during
weathering, fluvial transportation and/or deposition in the basin. Dupre´ et al. (1996) documented
the composition of suspended and dissolved loads and bedloads of the Congo River and showed
complex variation trends for REE. For example, there is an inverse correlation between river-
dissolved REE with pH (especially at pH>6.5), and a similar correlation has been reported
worldwide (e.g., Goldstein and Jacobsen, 1987; Elderfield et al., 1990). However, REE, HFSE
and the above transition metals are usually immobile elements concentrated in weathering
minerals formed in soils after removal of mobile elements such as the alkali earths. Therefore,
these immobile elements are transferred mainly as suspended sediments to the depositional site of
sediments. This is supported by the fact that REE, HFSE and transition metal concentrations are
up to 10,000 times higher in the suspended load compared to the dissolved load in the major
rivers of the world (Goldstein and Jacobsen, 1988; Dupre´ et al., 1996). Therefore, the
concentrations of these elements in sedimentary rocks are mainly controlled by their abundances
in the clay fraction of suspended sediments. This is supported by the composition of the
Okavango sediments showing excellent correlations between REE and Al2O3 (Figure IV-10),
indicating that the REE is hosted in clay minerals. In this paper, the relationship between
immobile elements (REE, HFSE and the transition metals Cr, Co, Ni and V) is used to constrain
the source rock lithologies.
V, Cr, Co and Ni are compatible elements during igneous fractionation processes and are
generally “depleted” in felsic rocks and “enriched” in mafic–ultramafic rocks. Cr and Ni levels in
the Okavango samples are generally lower than in PAAS (cf. silica dilution effect in the
Okavango sediments), with the exception of one sample, BH8159G, containing extremely high
concentrations of transition metals and MgO (4.5 wt.%), requiring either an ultramafic source or

83
strong adsorption of transition elements on clays or organic matter during deposition or both.
XRD data indicated that this sample contains “V-muscovite”. As stressed above, submicroscopic
muscovite sensu stricto is rather uncommon in sedimentary rocks, and much of the fine-grained
“micaceous” material in sediments is made of muscovite–smectite mixed layers (Deer et al.,
1992). Furthermore, it is known that lateritic horizons above ultramafic rocks contain smectites
(e.g., Trescases, 1997), and presumably, muscovite–smectite mixed layers as inferred to occur in
sample 8159G could accommodate high Cr and Ni contents. The concentration of Al2O3 in this
sample is relatively low (<2 wt.%), indicating that adsorption on clays is unlikely. The authors’
unpublished organic carbon analysis of sample BH8159G (1.02 wt.%) indicates that the high-
transition metal content of this sample is not related to an abnormally high abundance of organic
carbon. Thus, the most likely interpretation is that the source area lithologies of the Okavango
sediments include ultramafic rocks. Cr and Ni show strong positive correlation with MgO and a
negative correlation with SiO2 in the Okavango sediments. These trends support the presence of
ultramafic–mafic rocks at the source of the sediments. The contribution of felsic source rocks is
required by the presence of quartz and kaolinite (after feldspars) in the sediments and by the high
content of silica in several samples (Table IV-1). The plot of Cr vs. Ni (Figure IV-7c) and several
other binary plots (e.g., Figures IV-5c,e,f, IV-7g,h and IV-8a) show two distinct trendlines,
indicating three distinct source end-member compositions. One of these three components is the
felsic end-member marked by Cr and Ni concentrations clustered close to the origin of the axes in
Figure IV-7c. The other endmembers are two distinct mafic–ultramafic source rocks, one marked
by higher Cr content (pyroxene-rich component) and the other marked by higher Ni abundances
(olivine-rich component).
The relative contribution of felsic and ultramafic–mafic rock sources should be reflected in the
distribution of Zr and Cr–Ni, as these elements monitor zircon from felsic rocks and
chromite/pyroxene/olivine from mafic–ultramafic rocks (e.g., Wronkiewicz and Condie, 1987).
Co, Ni and Ti abundances are higher in mafic to intermediate rocks, whereas Y and Zr are higher
in felsic rocks (e.g., Ishiga and Dozen, 1997). The Cr/Zr ratio is expected to decrease if zircons
are concentrated by hydraulic sorting in the sedimentary process. The Cr/Zr ratios in the
Okavango sediments (Table IV-3) show a large range, from low values, 0.04 (e.g., sample
BH8158F), identical to values in sediments originating from a felsic source rock, up to high
values, ~1.4 (sample BH8162D), reflecting a predominantly mafic source rock. The high Cr/Zr
value of ~13 in sample BH8159G indicates ultramafic source rocks. Most Okavango sediments
have Cr/Zr between these two end-members, indicating a source made of bimodal felsic/mafic

84
rocks and/ or intermediate rocks. A similar conclusion is reached using Y/Ni ratios that are
identical to values in sediments from felsic sources for sample BH8348F and from an ultramafic–
mafic source for sample BH8159G. The Okavango sediments are commonly marked by values
intermediate between these two end-members.
The ternary plots La–Th–Sc, Th–Sc–Zr and Th–Hf–Co (Figure IV-12) have been used to deduce
the composition of sediments source rocks (Bhatia, 1983; Taylor and McLennan, 1985; Bhatia
and Crook, 1986; Camire´ et al., 1993; Jahn and Condie, 1995). Th is typically concentrated in
felsic rocks, whilst Sc, although a member of the same group (III) of the periodic table, is more
concentrated in mafic rocks. This is due to the much smaller size of the Sc ion, allowing it to
enter early crystallizing pyroxenes (Taylor and McLennan, 1985). The Okavango sediments
define a single evolutionary trend in the La–Th–Sc, supporting a bimodal ultramafic–mafic and
felsic source rock association. The nonquartz component of sample BH8159G, marked by
extremely high Sc, Cr and Ni, represents a sedimentary material produced almost exclusively
from ultramafic–mafic rocks, whereas that in the sample BH8348H corresponds to a sedimentary
material originating almost exclusively from felsic rocks. The range of Eu/Eu* values for
sands/sandstones derived from felsic and mafic sources partly overlaps, and the Eu/Eu* ratios for
samples BH8159G and BH8348H (Table IV-3) fall in the common field to sediments from mafic
and felsic source rocks. In addition, the range of Eu/Eu* in Okavango Delta sediments (Table IV-
3) also requires both felsic and ultramafic–mafic source rocks. Important to note is that, in Figure
IV-12c, the composition of the sample BH8262B overlaps with that of the sample CKP11220,
which represents Proterozoic granitoids exposed in NW Botswana and in adjacent countries
(Angola and Namibia). These granitoids represent a potential felsic end-member source rock
lithology for the Okavango sediments.
The distribution of analyses in the diagrams Th–Sc–Zr (Figure IV-12b) and Th–Hf–Co (Figure
IV-12c) supports the involvement of at least three distinct source rocks for the Okavango
sediments. Quantitative modelling (Table IV-5) was performed using analyses of potential source
rocks from the catchment area (Kampunzu, unpublished data) represented by CKP11220 and
CKP10926B (granite), CKP11277 (gabbro) and CKP10A299 (ultramafic rock). In this
quantification, quartz (SiO2) was used as one additional mixing component to accommodate the
aeolian input, and carbonates (CaO–MgO) were used to accommodate diagenetic calcite/dolomite
components. In sediments containing substantial diagenetic carbonates where CaO–MgO were
added during quantification, higher least square values were obtained probably because the CO2

85
content of carbonates was not taken into consideration. Otherwise, the results from the mixing
calculations in carbonate-poor samples yield calculated compositions (Table IV-5) matching the
compositions of Okavango Delta sediments, as shown by least square values of <1. This indicates
that the CKP samples listed above represent realistic potential source rocks for the Okavango
sediments.
Table IV 5. Results from quantitative modelling using major and REEs Sample Composition Least squares 8157f 15% CKP 11220 0.99 4% CKP 10296B 81% SiO2 8158f 9% CKP 11220 0.42 91% SiO2 8159g 18% CKP 11277 7.8 Without 15% CKP 10A299 Al2O3 11% CKP 10296B 45% SiO2 3% MgO 8% CaO 8158h 11% CKP 11220 0.83 1% CKP 10A299 3% CKP 10296B 85% SiO2 8162k 12% CKP 11220 1.8 2% CKP 11277 7% CKP 10296B 78% SiO2 1% CaO 8159t 4% CKP 11220 1.7 5% CKP 11277 4% CKP 10A299 1% CKP 10296B 82% SiO2 1% MgO 3% CaO

86
IV.2.9. Conclusions
The Okavango sediments are mainly sands, with variable proportions of silt, clays and carbonates
and show a large variation of most elements. The chemical index of alteration displays a
continuous trend and a large range from low CIA values (52) marking minimal chemical
weathering corresponding to the currently active aeolian component of the Okavango sediments
up to high CIA values (81) indicating severe chemical weathering corresponding to a sedimentary
fraction transported by the river from the Angolan hinterlands to the Okavango basin.
Elemental compositions, binary diagrams (e.g.,Cr–Ni, V–Ni, Ni–SiO2, Cr–SiO2, K2O–Al2O3 and
Na2O–Al2O3), interelements ratios (e.g., Cr/Zr, Y/Ni, Th/Cr, Th/Sc, Eu/Eu*, La/Sc and La/Co)
and source-rock discrimination diagrams (e.g., Th–Sc–Zr and Th–Hf–Co), supported by
quantitative modelling, indicate that the Okavango sediments originate from the mixing of
aeolian quartz, diagenetic carbonates and a component derived from three distinct source rock
groups, including ultramafic–mafic and felsic source rock association, with or without input of
intermediate source rocks. Proterozoic granitoids and mafic–ultramafic rocks exposed in NW
Botswana and in adjacent countries (Angola and Namibia) represent source rocks for the
Okavango sediments.
Acknowledgements
This research project was funded by the University of Botswana Research and Publication Fund
(RP 680-063). The Botswana Geological Survey is acknowledged for allowing us to sample the
boreholes used for this study. Water Resources Consultants is acknowledged for assistance with
grain size data. A. Jellema is acknowledged for assistance with Figure IV-2 and J. J. Tiercelin and
D. Kolokose for assistance with the thin sections. This is a contribution to SAFARI 2000
Research Project. The satellite image used in this paper was acquired through that project. This
paper benefited significantly from comprehensive reviews by R. Cullers, K. Condie, A. Morton
and the Chief-Editor K.A.W. Crook, to whom we extend our thanks.
This paper is dedicated to the memory of Prof. A.B. Kampunzu, a friend, colleague, and mentor,
whose profound knowledge, enthusiasm, and desire to help others will continue to be an
inspiration to all.

87
References Bhatia, M.R., 1983. Plate tectonics and geochemical composition of sandstones. J. Geol. 91, 611
– 627. Bhatia, M.R., Crook, K.A.W., 1986. Trace element characteristics of graywackes and tectonic
setting discrimination of sedimentary basins. Contrib. Mineral. Petrol. 92, 181–193. Bock, B., McLennan, S.M., Hanson, G.N., 1998. Geochemistry and provenance of the Middle
Ordovician Austin Glen Member (Normanskill Formation) and the Taconian Orogeny in New England. Sedimentology 45, 635– 655.
Braun, J.J., Pagel, M., Muller, J.P., Bilong, P., Michard, A., Guillet, B., 1990. Cerium anomalies in laterite profiles. Geochim. Cosmochim. Acta 54, 791–795.
Camire´, G.E., Lafle`che, M.R., Ludden, J.N., 1993. Archaean metasedimentary rocks from the northwestern pontiac subprovince of the Canadian shield; chemical characterization, weathering and modelling of the source areas. Precambrian Res. 62, 285– 305.
Carney, J.N., Aldiss, D.T., Lock, N.P., 1994. The geology of Botswana. Geol. Surv. Dep., Lobatse, Botswana, p. 113.
Condie, K.C.,Wronkiewicz, D.J., 1990. A new look at the Archean– Proterozoic boundary: sediments and the tectonic setting constraint.In: Naqvi, S.M. (Ed.), Precambrian Continental Crust and its Economic Resources. Elsevier, Amsterdam, pp. 61– 84.
Condie, K.C., Dengate, J., Cullers, R.L., 1995. Behaviour of rare earth elements in a paleoweathering profile on granodiorite in the Front Range, Colorado, USA. Geochim. Cosmochim. Acta 59, 279–294.
Cullers, R.L., 1994a. The controls on the major and trace element variations of shales, siltstones, and sandstones of Pennsylvanian –Permian age from uplifted continental blocks in Colorado to platform sediment in Kansas, USA. Geochim. Cosmochim. Acta 58, 4955– 4972.
Cullers, R.L., 1994b. The chemical signature of source rocks in size fractions of Holocene stream sediment derived from metamorphic rocks in the Wet Mountains region, USA. Chem. Geol. 113, 327– 343.
Cullers, R.L., 2000. The geochemistry of shales, siltstones and sandstones of Pennsylvanian–Permian age, Colorado, USA: implications for provenance and metamorphic studies. Lithos 51, 181– 203.
David, K., Schiano, P., Alle`gre, C.J., 2000. Assessment of the Zr/Hf fractionation in oceanic basalts and continental materials during petrogenetic processes. Earth Planet. Sci. Lett. 178, 285– 301.
Deer, W.A., Howie, R.A., Zussman, J., 1992. An Introduction to the Rock-Forming Minerals, 2nd ed. Longman Group Limited, Essex, England. 696 pp.
Dickinson, W.R., Suczec, C.A., 1979. Plate tectonics and sandstone compositions. Am. Assoc. Pet. Geol. Bull. 63, 2171.
Duddy, I.R., 1980. Redistribution and fractionation of rare earth and other elements in a weathering profile. Chem. Geol. 30, 363– 381.
Dupre´, B., Gaillardet, J., Rousseau, D., Alle`gre, C.J., 1996. Major and trace elements of river-borne material: the Congo Basin. Geochim. Cosmochim. Acta 60, 1301– 1321.
DWA (Department of Water Affairs), 1997. Appendix B: geomorphology and sedimentology. Maun Groundwater Development Project Phase 1. Water Affairs Department, Gaborone, Botswana. prepared by Eastend Investments.
Elderfield, H., Upstill-Goddard, R., Sholkovitz, E.R., 1990. The rare earth element in rivers, estuaries, and coastal seas and their significance to the composition of ocean waters. Geochim Cosmochim. Acta 54, 971– 991.

88
Fedo, C.M., Eriksson, K.A., Krogstad, E.J., 1996. Geochemistry of shales from the Archaean (~3.0 Ga) Buhwa Greenstone Belt, Zimbabwe: implications for provenance and source-area weathering. Geochim. Cosmochim. Acta 60, 1751–1763.
Gao, S., Wedepohl, K.H., 1995. The negative Eu anomaly in Archean sedimentary rocks: implications for decomposition, age and importance of their granitic sources. Earth Planet. Sci. Lett. 133, 81– 94.
Garver, J.I., Royce, P.R., Smick, T.A., 1996. Chromium and nickel in shale of the Taconic foreland: a case study for the provenance of fine-grained sediments with an ultramafic source. J. Sediment. Res. 100, 100– 106.
Goldstein, S.J., Jacobsen, S.B., 1987. The Nd and Sr isotopic systematics of river-water dissolved material: implications for the sources of Nd and Sr in seawater. Chem. Geol. 66, 245–272.
Goldstein, S.J., Jacobsen, S.B., 1988. Rare earth elements in river waters. Earth Planet. Sci. Lett. 89, 35– 47.
Gromet, L.P., Dymek, R.F., Haskin, L.A., Korotev, R.L., 1984. The North American shale composite: its compilation, major and trace element characteristics. Geochim. Cosmochim. Acta 48, 2469– 2482.
Hassan, S., Ishiga, H., Roser, B.P., Dozen, K., Naka, T., 1999. Geochemistry of Permian–Triassic shales in the Salt Range, Pakistan: implications for provenance and tectonism at the Gondwana margin. Chem. Geol. 158, 293–314.
Ishiga, H., Dozen, K., 1997. Geochemical indications of provenance change as recorded in Miocene shales: opening of the Japan Sea, San’in region, southwest Japan. Mar. Geol. 144, 211 –228.
Jahn, B.M., Condie, K.C., 1995. Evolution of the Kaapvaal Craton as viewed from geochemical and Sm–Nd isotopic analyses of intracratonic pelites. Geochim. Cosmochim. Acta 59, 2239– 2258.
Kampunzu, A.B., Akanyang, P., Mapeo, R.B.M., Modie, B.N., Wendorff, M., 1998a. Geochemistry and tectonic significance of Mesoproterozoic Kgwebe metavolcanic rocks in northwest Botswana: implications for the evolution of the Kibaran Namaqua–Natal Belt. Geol. Mag. 133, 669– 683.
Kampunzu, A.B., Bonhomme, M.G., Kanika, M., 1998b. Geochronology of volcanic rocks and evolution of the Cenozoic Western branch of the East African rift system. J. Afr. Earth Sci. 26, 441–461.
Kampunzu, A.B., Armstrong, M.P., Modisi, M.P., Mapeo, R.B., 1999. The Kibaran belt in southwest Africa: ion microprobe U– Pb zircon data and definition of the Kibaran Ngami belt in Botswana, Namibia and Angola. Gondwana Res. 2, 571–572.
Kampunzu, A.B., Armstrong, R.A., Modisi, M.P., Mapeo, R.B.M., 2000. Ion microprobe U–Pb ages on single detrital zircon grains from Ghanzi Group: implications for the identification of a Kibaran-age crust in northwestern Botswana. J. Afr. Earth Sci. 30, 579–587.
Lahtinen, R., 2000. Archaean–proterozoic transition: geochemistry, provenance and tectonic setting of metasedimentary rocks in central Fennoscandian Shield, Finland. Precambrian Res. 104, 147–174.
Le Gall, B., Tshoso, G., Jourdan, F., Fe´raud, G., Bertrand, H., Tiercelin, J.J., Kampunzu, A.B., Modisi, M., Dyment, J., Maia, M., 2002. Ar–Ar geochronology and structural data from the Okavango giant mafic dike swarm, Karoo large igneous province, N Botswana. Earth Planet. Sci. Lett. 202, 595–606.
Mapeo, R.B.M., Armstrong, R.A., Kampunzu, A.B., 2000. Ages of detrital zircon grains from Neoproterozoic siliciclastic rocks in Shakawe area: implications for the evolution of the Proterozoic crust in northern Botswana. S. Afr. J. Geol. 103, 156–161.

89
Mapeo, R.B.M., Armstrong, R.A., Kampunzu, A.B., 2001. Ion microprobe U–Pb zircon geochronology of gneisses from the Gweta borehole, NE Botswana: implications for the Paleoproterozoic Magondi belt in southern Africa. Geol. Mag. 138, 299–308.
McCarthy, T.S., Ellery, W.N., 1995. Sedimentation on the distal reaches of the Okavango fan, Botswana, and its bearing on calcrete and silcrete (Ganister) formation. J. Sediment. Res., Sect. A Sediment. Pet. Proc. 65, 77– 90.
McCarthy, T.S., Metcalfe, J., 1990. Chemical sedimentation in the semi-arid environment of the Okavango Delta, Botswana. Chem. Geol. 89, 157–178.
McCarthy, T.S., Stanistreet, I.G., Cairncross, B., 1991. The sedimentary dynamics of active fluvial channels on the Okavango fan, Botswana. Sedimentology 38, 471– 487.
McCarthy, T.S., Green, R.W., Franey, N.J., 1993. The influence of neo-tectonics on water dispersal in the northeastern regions of the Okavango swamps, Botswana. J. Afr. Earth Sci. 17, 23– 32.
McCarthy, T.S., Cooper, G.R.J., Tyson, P.D., Ellery, W.N., 2000. Seasonal flooding in the Okavango Delta, Botswana—recent history and future prospects. S. Afr. J. Sci. 96, 25–33.
McLennan, S.M., Taylor, S.R., Eriksson, K.A., 1983. Geochemistry of Archean shales from the Pilbara Supergroup, Western Australia. Geochim. Cosmochim. Acta 47, 1211– 1222.
McLennan, S.M., Taylor, S.R., McCulloch, M.T., Maynard, J.B., 1990. Geochemistry and Nd–Sr isotopic composition of deep sea turbidites: crustal evolution and plate tectonic associations. Geochim. Cosmochim. Acta 54, 2015– 2050.
Modisi, M.P., 2000. Fault system of the southeastern boundary of the Okavango Rift, Botswana. J. Afr. Earth Sci. 30, 569– 578.
Modisi, M.P., Atekwana, E.A., Kampunzu, A.B., Ngwisanyi, T.H., 2000. Rift kinematics during the incipient stages of continental extension: evidence from nascent Okavango rift basin, northwest Botswana. Geology 28, 939– 942.
Nesbitt, H.W., Young, G.M., 1982. Early Proterozoic climates and plate motions inferred from major element chemistry of lutites. Nature 299, 715– 717.
Nesbitt, H.W., Young, G.M., 1984. Prediction of some weathering trends of plutonic and volcanic rocks based on thermodynamic and kinetic considerations. Geochim. Cosmochim. Acta 48, 1523– 1534.
Nesbitt, H.W., Young, G.M., 1989. Formation and diagenesis of weathering profiles. J. Geol. 97, 129– 147.
Nesbitt, H.W., Young, G.M., McLennan, S.M., Keays, R.R., 1996. Effect of chemical weathering and sorting on the petrogenesis of siliciclastic sediments, with implications for provenance studies. J. Geol. 104, 525– 542.
Plank, T., Langmuir, C.H., 1998. The chemical composition of subducting sediment and its consequences for the crust and mantle. Chem. Geol. 145, 325– 394.
Reeves, C.V., 1978. The gravity survey of Ngamiland: 1970–71. Geol. Surv. Botsw., Bull. 11, 84 pp.
Ringrose, S., Huntsman-Mapila, P., Kampunzu, A.B., Downey, W., Coetzee, S., Vink, B., Matheson, W., Vanderpost, C., 2005. Sedimentological and geochemical evidence for palaeo-environments in Makgadikgadi sub-basin, in relation to the MOZ rift depression, Botswana. Palaeogeogr. Palaeoclimatol. Palaeoecol. (in press).
Roser, B.P., Korsch, R.J., 1988. Provenance signatures of sandstone –mudstone suites determined using discriminant function analysis of major-element data. Chem. Geol. 67, 119–139.
Sawula, G., Martins, E., Nengu, J., Themner, K., 1992. Notes on trace metals in the Boro River, Okavango Delta. Botsw. Notes Rec. 24, 135– 149.
Taylor, S.R., McLennan, S.M., 1985. The Continental Crust: Its Composition and Evolution. Blackwell Scientific, Oxford. 312 pp.
90
Taylor, S.R., McLennan, S.M., 1995. The geochemical evolution of the continental crust. Rev. Geophys. 33, 241–265.
Thomas, D.S.G., Shaw, P.A., 1991. The Kalahari Environment. Cambridge University Press, Cambridge. 284 pp.
Toulkeridis, T., Clauer, N., Krfner, A., Reimer, T., Todt, W., 1999. Characterization, provenance, and tectonic setting of Fig Tree greywackes from the Archaean Barberton Greenstone Belt, South Africa. Sediment. Geol. 124, 113–129.
Trescases, J.-J., 1997. The lateritic nickel–ore deposits. In: Paquet, H., Clauer, N. (Eds.), Soils and Sediments. Mineralogy and Geochemistry. Springer Verlag, Berlin, pp. 125– 138.
Wronkiewicz, D.J., Condie, K.C., 1987. Geochemistry of Archean shales from the Witwatersrand Supergroup, South Africa: source-area weathering and provenance. Geochim. Cosmochim. Acta 51, 2401– 2416.

91
V. SEDIMENT GEOCHEMISTRY, PROVENANCE AND TECTONIC SETTING:
APPLICATION OF DISCRIMINATION DIAGRAMS TO VERY EARLY STAGE
OF INTRACONTINENTAL RIFT EVOLUTION, WITH EXAMPLES FROM
THE OKAVANGO AND SOUTHERN TANGANYIKA RIFT BASINS
V.1. Géochimie et provenance des sédiments, contexte tectonique : application des
diagrammes de discrimination aux sédiments des phases précoces d’un rift
intracontinental, exemples des bassins de l’Okavango et du Sud Tanganyika.
Résumé de l’article
Dans ce papier, nous avons appliqués des diagrammes de variations et de discrimination
tectonique aux données géochimiques acquises sur des sédiments Quaternaires de bassins de rift
précoce du Rift Est Africain. Nous avons utilisé des échantillons de deux segments du rift
correspondant à deux phases différentes d’évolution: le cône alluvial naissant de l’Okavango et le
bassin lacustre mature du Lac Tanganyika. Nous avons définis deux nouveaux domaines dans le
champ des marges passives du diagramme de discrimination tectonique préexistant. Nos
échantillons sont en général, enrichis en SiO2 et appauvris en Na2O, CaO and TiO2 ce qui reflète
le fort degré de maturité de ces sédiments. La distinction entre le domaine des sédiments de
l’Okavango et ceux du Tanganyika est évidente et se manifeste largement dans les concentrations
de SiO2 et d’Al2O3. La géochimie des sédiments du Lac Tanganyika de sous-bassin du Mpulungu
indique que la source immédiate de matériel est une roche sédimentaire quartzeuse mais que la
source ultime est felsique. Celle ci est représentée dans la région par les grès de la formation de
Mbala et le socle granitique qui affleurent tous deux au sud du lac. Les sédiments de l'Okavango
proviennent de roches sources felsiques et mafiques à ultramafiques avec probablement une
source immédiate sédimentaire quartzeuse.

92
V.2 Sediment geochemistry, provenance and tectonic setting: Application of
discrimination diagrams to very early stages of intracontinental rift evolution, with
examples from the Okavango and Southern Tanganyika rift basins
P. Huntsman-Mapila1,2,*, J-J. Tiercelin2, M. Benoit2, J. Cotten2, C. Hémond2
1 Harry Oppenheimer Okavango Research Centre, University of Botswana, P/Bag 285, Maun, Botswana 2UBO-CNRS UMR 6538, Institut Universitaire Européen de la Mer, 29280 Plouzané, France *Author for correspondence (email*: [email protected])
Article to be submitted to the Journal of African Earth Sciences
V.2.1.Introduction
The significance of sedimentary geochemistry in determining the provenance of sedimentary
suites, their evolution, and source weathering is well established in the literature (Bhatia, 1983;
Condie et al., 1995; Cullers, 1994a and b; Cullers et al., 1987, 1988; McLennan et al., 1990,
1993; Roser and Korsch, 1986; Roser and Korsch, 1988; Wronkiewicz and Condie 1987). The
relationship between the tectonic setting and variables such as provenance, relief, physical sorting
and weathering control the composition of sediments. Immobile trace element compositions and
rare earth element (REE) abundances of sediments are good indicators of source rock chemistry,
since these elements are little-fractionated by sedimentary processes and low grade
metamorphism (Taylor and McLennan, 1985; McLennan, 1989) whilst more mobile elements are
helpful for understanding weathering regimes and palaeoenvironmental conditions (Nesbitt and
Young, 1984; Fedo et al., 1996).
Tectonic processes give a distinctive geochemical signature to sediments in two ways: 1) tectonic
settings have characteristic provenance signals and 2) they are characterized by their sedimentary
processes (Rollinson, 1993). For sandstones, the relationship between the geochemical
composition, the provenance of sediments and the tectonic setting can be a useful tool in
elucidating information from ancient rocks. The use of major (Bhatia, 1983; Roser and Korsch,
1986; 1988). and trace element (Bhatia and Crook, 1986) compositions in diagnostic diagrams
has been shown to be useful in determining tectonic settings.

93
In order to test the accuracy of various diagnostic diagrams for tectonic setting of ancient
sediments, they should be tested against modern sediments of a known tectonic setting. This has
been done in the past (Bhatia, 1983; Bhatia and Crook, 1986; Roser and Korsch, 1986; Roser,
1996) but more data are required on recent sediments of known tectonic setting to validate and
refine these established discrimination criteria. In this paper, we use data from young (late
Pleistocene to Holocene) sediments from a known tectonic setting, the East African Rift System
(EARS), an early stage rifted basin, to establish how well discriminant diagrams and bivariate
plots of tectonic settings categorize these sediments. Attention has been devoted to very early
stages of rift creation, using examples of two rift segments at two different stages of evolution in
the EARS for which we attempt to define new fields.
The aims of this study are therefore 1) to compare the tectonic fields defined for Lake Tanganyika
and Okavango Delta sediments and establish how the results correspond with existing tectonic
classifications; 2) to define fields for early stage rift sediments (both nascent alluvial fan (NAF)
and mature lacustrine basin (MLB)) within the passive margin setting and 3) and finally we use
our data to establish the provenance of the Lake Tanganyika sediments from the Mpulungu sub-
basin.
V.2.2. Geological setting
V.2.2.1. Classification of tectonic settings
Bhatia (1983) describes a simplified tectonic classification of continental margins and oceanic
basin based on geochemical composition. The author defines fields for four tectonic settings
being Oceanic Island Arc (OIA), Continental Island Arc (CIA), Active Continental Margins
(ACM) and Passive Margins (PM). The field defined for passive margins include a wide range of
tectonic environments, from rifted continental margins of the Atlantic-ocean type, sedimentary
basins near to collision orogens and inactive or extinct convergent margins (Bhatia, 1983; Bhatia
and Crook, 1986). Passive margin settings have also been grouped into pre-rift, rift-valley or
graben and Atlantic-type trailing edges. Passive margin sediments are highly mature and derived
from recycling of older sedimentary or metamorphic rocks (Bhatia, 1983).
94
V.2.2.2. Description of rift settings Rift basins, which develop in continental crust, will, if the rifting process continues, lead to the
development of an ocean basin flanked by passive margins. They generally consist of a suite of
individual half-grabens (50-100 km long and 20-80 km wide) bounded by major normal faults.
They can be filled with both continental and marine deposits. Rift creation demonstrates several
successive stages of structural and sedimentary evolution, according to pre-rift and syn-rift
structural and magmatic conditions. Successive stages of rift evolution were proposed on the
basis of the interpretation of seismic sequences identified in the Lake Tanganyika Trough
(PROBE Project; Burgess, 1985). In this paper, attention has been devoted to very early stages of
rift creation, using examples of two rift segments at two different stages of evolution in the
EARS. Such early stages were tentatively illustrated by recent to modern tectonic and
sedimentary environments observed in the Southern Complex of the EARS (Tiercelin and
Mondeguer, 1991), and more particularly by the Okavango Basin and the southern end of the
Lake Tanganyika Trough, that represent two successive phases in the very early stage of rift
creation.
The early initiation stage in the development of a continental rift is characterized by the
development of shallow half-graben basins where nascent faults exert a primary control in
drainage evolution and the formation of catchments (Gawthorpe and Leeder, 2000). This stage is
illustrated by the present Okavango alluvial fan located in a broad subsiding half-graben, strongly
controlled by fault growth (Modisi, 2000). The immediate successive stage concerns the
development of deeper basins where swamps and shallow lacustrine environments (<50 m water
depth) occur, as the result of fault growth and propagation, and initiation of basin subsidence. A
more mature stage concerns the development of well-defined, actively subsiding half-graben
basins, where propagation and interaction between fault segments lead to basin linkage and strong
control of drainage. Wider and deeper lacustrine environments characterize this stage, which is
illustrated by the southern Mpulungu subbasin of Lake Tanganyika.
V.2.2.3. The East African Rift System
The East African Rift System is a vast Cenozoic structure with a length of more than 4500 km,
extending from Afar in the north to the south of the African continent (Botswana, Mozambique)
(Figure V-1). It is a major intracontinental extension zone, with two main branches characterized

95
by N-S to NNE-SSW oriented deep troughs, mainly half-grabens. The Eastern Branch with a
length of 1800 km extends from the Afar Depression to the Kenya Rift and the North Tanzanian
Divergence. The early phases of rifting characterizing this branch are dated from Eocene - Lower
Oligocene and resulted in major fissural volcanic activity and half-graben development in
northern Kenya and southern Ethiopia (Morley et al., 1992; Ebinger and Ibrahim, 1994; Ebinger
et al., 2000; Tiercelin et al., 2004). Extensive volcanism is a main characteristic of this part of the
rift, and is represented by volcanism which developed from the early Cenozoic and is active up to
present (Morley, 1999; Chorowicz, 2005).
The Western Branch, with a length of 2500 km, is more complex in structure and includes the
Lake Tanganyika and Lake Malawi Troughs, which are the two largest and deepest structures of
the EARS. Compared to the Eastern Branch, the Western Branch is marked by having only a few
volcanic provinces which are: Virunga, Kivu and Rungwe (Figure V-1). Initial volcanic activity
occurred in these regions at about 8 Ma (Ebinger et al., 1989). Two major NW-SE-trending
transcurrent fault zones, the Aswa Fault Zone and the TRM (Tanganyika-Rukwa-Malawi) Fault
Zone, act as links between the Eastern and Western Branches, and between segments of the
Western Branch, respectively. These transverse structures are recognized as Late Precambrian
features reactivated during the Cenozoic rifting phases (McConnell, 1980).
To the southwest, a suite of half-graben basins extends from the southern Tanganyika-northern
Malawi region in a NE-SW direction, forming the “Southern Complex” (Mondeguer et al., 1989;
Tiercelin and Mondeguer, 1991) (Figure V-1). This Southern Complex, which includes the
Okavango Basin, contrasts to the main directions of the other branches of the EARS as it is much
younger than the other segments of EARS and has no record of volcanic activity during the
Cenozoic.

96
Figure V 1. Map of East African Rift System showing the Western and Eastern Branches and the Southern Complex. Boxes show location of study areas.
97
V.2.2.4. Okavango Delta setting
The Okavango Basin is a typical half-graben (McCarthy et al., 1993; Modisi, 2000; Modisi et al.,
2000) which is considered as the extreme end of a suite of rift basins extending northeast-
southwest from west of Lake Tanganyika and Malawi basins, known as the “Southern Complex”
(Mondeguer et al., 1989) (Figure V-1). On the basis of geophysical characteristics (Reeves, 1972;
Shudofsky, 1985; Ballard et al., 1987), this Southern Complex appears as a broad tectonically
active zone that is interpreted as a nascent southwestern branch of the East African Rift System
(Reeves, 1972). The Okavango Basin is located within the wider Kalahari Basin, which is a
shallow intracontinental basin. This half-graben is today occupied by a large inland alluvial fan of
extremely uniform gradient (Gumbrict et al., 2001) fed by the Okavango River which enters the
Okavango Basin through a narrow NW–SE-trending swamp called the Panhandle (Figure V-2).
Unlike Lake Tanganyika with its high escarpments, the NE-SW orientated Thamalakane and
Kunyere Faults, which bound the basin to the south, are barely visible from the surface with the
exception of the escarpment on the southern shore of Lake Ngami (Huntsman-Mapila et al.,
2006).
The Okavango Delta overlies Precambrian igneous –metamorphic rocks that include the
following main units (Figure V-2): (1) Paleoproterozoic ~2.05 Ga augen gneiss, granites and
amphibolites exposed in the Qangwa area (Kampunzu and Mapeo, unpublished data) and 2.03 Ga
granulites exposed in the Gweta area (Mapeo and Armstrong, 2001); (2) Mesoproterozoic 1.2–1.0
Ga gabbros, granites, metarhyolites and metabasalts (Kampunzu et al., 1998b, 1999); (3)
Neoproterozoic siliciclastic and carbonate sedimentary rocks forming a blanket above older
Proterozoic rocks (Kampunzu et al., 2000; Mapeo et al., 2000); (4) Karoo Supergroup, including
mainly siliciclastic sedimentary rocks deposited during the Permo-Carboniferous and mafic lavas
and dolerites emplaced between ca. 181–179 Ma (Carney et al., 1994; Le Gall et al., 2002).
Elemental compositions, binary diagrams, interelements ratios and source-rock discrimination
diagrams supported by quantitative modeling, indicate that the Okavango sediments originate
from the mixing of reworked aeolian quartz, diagenetic carbonates and a component derived from
three distinct source rock groups, including ultramafic–mafic and felsic source rock association,
with or without input of intermediate source rocks. Proterozoic granitoids and mafic–ultramafic

98
rocks exposed in NW Botswana and in adjacent countries (Angola and Namibia) represent source
rocks for the Okavango sediments (Huntsman-Mapila et al., 2005).

99
Figure V 2. Precambrian geology map of NW Botswana (Kampunzu et al., 2000). Box shows location of boreholes. Inset: location of the Okavango Delta in Botswana

100
V.2.2.5. Lake Tanganyika setting
The Lake Tanganyika Trough (3° 30’-8° 50’ S, 29°-31°20’ E) is the largest structure of the
Western Branch of the EARS. It is structurally divided into two main basins, the northern basin
orientated N0o, and the southern basin oriented in the N150o direction, separated by N130-150°-
trending horst block called the Kalemie-Mahali shoal (Mondeguer, 1991) (Figure V-3 a and b).
These two basins are occupied by Lake Tanganyika, which is 650 km long and the deepest of the
African rift lakes at 1470 m. The basin geometry and stratigraphy of the Tanganyika Basin were
documented by the seismic reflection studies of Projects PROBE and GEORIFT (Rosendahl et
al., 1986, 1988; Tiercelin and Mondeguer, 1991; Lezzar et al., 1996). The central part of the basin
is known to contain a >5-km thick sequence of rift-related sediments (Rosendahl et al., 1986;
Morley, 1988). Age estimates by Cohen et al. (1993) suggest that the central segment of the
Tanganyika Basin began to form between 9 and 12 Ma, whereas the northern basin, characterized
by a 4-km-thick sequence of sediments (Rosendahl et al., 1986; Ebinger, 1989), formed more
recently, at 7-8 Ma. The southern end of the basin, known as the Mpulungu sub-basin
(Mondeguer, 1991), contains a 2.5 km thick pile of rift sediments with an estimated age of 4-2
Ma. The Mpulungu sub-basin is 100 km long, 25 km wide with up to 800 m water depth. (Figure
V-3 b) The sub-basin is delineated by three groups of faults: a main group trending N150°
forming the Mpulungu Border Fault characterized by important vertical throw of at least 2000 m,
a second group of faults oriented N70 that develops on the western flank of the Mpulungu Basin,
and a minor group of faults oriented N30°, respectively. The two main groups of faults deeply
intersect the Upper Precambrian tabular terrains of the northern side of the Zambian craton (also
known as Bangweulu Block) (Unrug, 1984).The craton is of Middle Proterozoic age (around
1820 Ma (Brewer et al., 1979)), and mainly composed of granites, granitoides and
metavolcanites; 2) the Mporokoso Group formed of conglomerates, sandstones, quartzites and
shales; and 3) the Katanga super-group, that include conglomeratic and quartzitic series overlain
by carbonate series (Daly and Unrug, 1983) (Figure V-3 c). To the south-east of the Mpulungu
sub-basin is the Rungwe volcanic province (Figure V-3 a), which is the most southern eruptive
centre in the EARS western branch. Volcanic activity in the Rungwe started in the Late Miocene
(~ 8 Ma) and remained active during the late Pleistocene and Holocene with major pyroclastics
eruptions (Harkin, 1960; Ebinger et al., 1989; Williams et al., 1993).

101
Figure V 3. A) showing location of Lake Tanganyika with respect to the Rungwe volcanic field and Lake Malawi: B) showing the structure and hydrology of Lake Tanganyika. Key 1-littoral platforms; 2-transverse shoals; 3-sub-basin deep zones (after Tiercelin and Mondeguer, 1991): C) geological map of the southern Lake Tanganyika basement (after Mondeguer, 1991); D) Mpulungu sub-basement showing bathymetry and location of MPU-10 and MPU-3 sites.

102
V.2.3 Description of samples and analysis
For the Okavango sediments, ninety samples were collected at 3-m intervals up to depths of
between 69 – 147 m. from seven boreholes drilled during the Maun Groundwater Development
Project (DWA, 1997). Details of the samples are given in Chapter IV (Huntsman-Mapila et al.,
2005). The Okavango Delta sediments are well sorted fine to medium-grained sands, with
variable amounts of carbonates and minor silt and clay (Huntsman-Mapila et al., 2005; DWA,
1997). Chemical analyses of the bulk Okavango sediments were performed at Chemex
Laboratories in Canada. Major elements were determined using inductively coupled plasma-
atomic emission spectrometry (ICP-AES). Trace and rare earth elements were analysed using
inductively coupled plasma –mass spectrometry (ICP-MS) (detection limits generally between
0.1 and 0.5 ppm) with the exception of Li, Cr, Ni and Pb that were determined by flame AAS
(detection limits 1 ppm). The precisions are <1% and <10% for major and trace elements,
respectively.
Lake Tanganyika sediments were recovered from the Mpulungu sub-basin duirng the GEORIFT
Project of Elf-Aquitaine. Several Kullenberg piston cores were collected in December 1985 in the
central part of the Mpulungu sub-basin and on the platform/slope of the Cameron Bay (Figure V-
3 d) (Mondeguer, 1991). Sediments from two cores have been considered for this study: the
MPU-10 core, 8.09 m long, was collected from a water depth of 422 m in the central part of the
basin, and the 11.19 m long MPU-3 core was collected from a water depth of 140 m at the limit
of the slope between the Cameron Bay and the Mpulungu sub-basin (Figure V-3 d) The MPU-3
core is characterized in the lower part (11.19-7.80 m) by a clastic, quartz-rich, silt-sized facies
locally interrupted by diatom-rich laminae. From 7.80 m to the top of the core, the sediments are
laminated, diatom-rich, organic muds. MPU-10 core, from the deeper water site, is a dark grey
vaguely laminated mud (Mondeguer, 1991). Biogenic sedimentation was occasionally interrupted
by wind-blown volcanic ash, interpreted as related to explosive activity in the Rungwe volcanic
centre, which resulted in the formation of thin pinkish yellow layers identified at different depth
in the various cores collected from the Mpulungu sub-basin (Mondeguer, 1991). Transition
between clastic and organic facies at 7.80 m on MPU 3 corresponds to a sedimentary
discontinuity which was also identified on high–resolution seismic lines acquired in the
Mpulungu sub-basin (Tiercelin et al., 1989). These two cores reflect a suite of climate-controlled
lake level fluctuations that, at several times from at least 35000 yr B.P., brought down the level of

103
Lake Tanganyika to about the –300 m depth contour (Mondeguer et al., 1989; Tiercelin et al.,
1989).
For the Lake Tanganyika sediments, analysis of the samples was done on approximately every 20
cm intervals for a total of 80 samples from two cores recovered from the southern part of the
Lake Tanganyika basin. A detailed description of the cores and the sample analysis can be found
in Chapter VIII. Analysis was done on the bulk samples which were all muds and < 0.63 µm in
grain size with the exception of three samples from the MPU-3 core from below the discontinuity
at 780 cm. These three samples were sieved using a 0.63 µm sieve. Sample analysis was
conducted at IUEM-UBO. Major elements were measured by ICP-AES with an ISA Jobin-Yvon
JY 70 Plus apparatus. Trace element and rare earth element (REE) measurements were conducted
using ICP-MS using a Finnigan Element 2 ICP-MS.
V.2.4 Results
V.2.4.1 Discrimination diagrams using major elements
Results from the major element data from both the Okavango Delta sediments and the Lake
Tanganyika sediments were plotted for tectonic setting discrimination. Plots of TiO2, Al2O3/SiO2,
K2O/Na2O and Al2O3/(CaO + Na2O) versus Fe2O3 + MgO are shown in Figure V-4. The different
fields represented in this diagram are Oceanic island arc (OIA), Continental island arc (CIA),
Active continental margin (ACM) and Passive margin (PM) and were drawn from Bhatia, (1983).
Values were recalculated on a volatile free basis. It should be noted that for the Okavango
samples which have variable amounts of carbonates, only samples with CO2 < 0.2 wt. % were
plotted to avoid the diagenetic input of CaO and MgO. For the Tanganyika samples, diagenetic
carbonates represent a negligible component and therefore all samples were used. In addition,
volcanic ash samples were removed as they represent the input of unweathered material into the
passive margin setting. Important also is that both the Okavango and the Tanganyika samples
have an SiO2 dilution factor – the Okavango sediments from Kalahari aeolian sand and the Lake
Tanganyika samples from biogenic silica.
For the plot of TiO2 wt. % versus Fe2O3 + MgO wt. % (Figure V-4 a), the samples from both the
Okavango and Tanganyika fall predominantly in the PM field with some overlap into the ACM

104
field. Figure V-4 b shows the plot of Al2O3/SiO2 versus Fe2O3 + MgO wt. %. Again, the
Okavango and Tanganyika samples trend predominantly towards the PM field. However, the
Tanganyika samples have higher Al2O3/SiO2 ratios than the represented field. This is because the
fields were drawn for sands and sandstones where as the Tanganyika samples, being muds, have a
higher content of Al2O3. Figure V-4 c of K2O/Na2O versus Fe2O3 + MgO wt. % has a broad range
of samples but with all samples falling within the PM field. The plot of Al2O3/(CaO + Na2O)
again has a broad range, due to Al2O3 from the Tanganyika samples, but the samples from both
Okavango and Tanganyika fall predominantly within the PM field with minor overlap with the
ACM field.
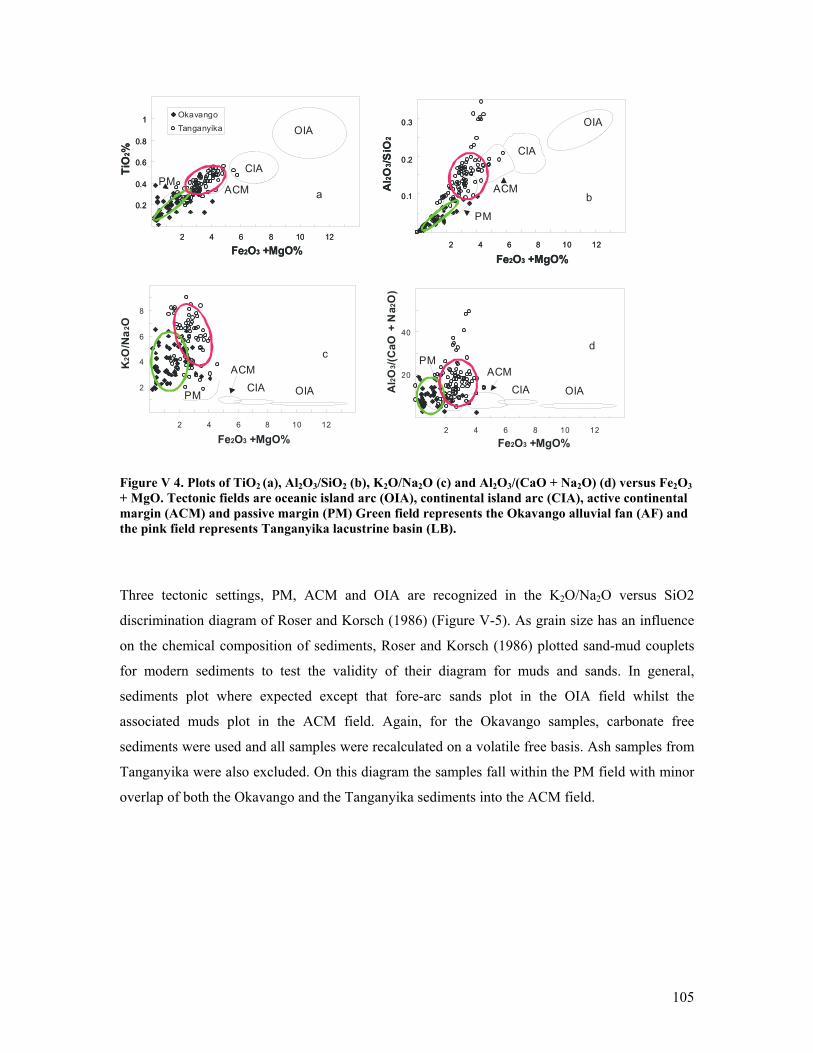
105
2
4
6
8
2 4 6 8 10 12
KO
/Na
O2
2
20
40
2 4 6 8 10 12
AlO
/(CaO
+ N
aO
)2
32
Fe O +MgO%2 3Fe O +MgO%2 3
Okavango
Tanganyika OIA
CIAPM
2 4 6 8 10 12
Fe O +MgO%2 3
2 4 6 8 10 12
Fe O +MgO%2 3
0.2
0.4
0.6
0.8
1Ti
O%2
0.2
0.4
0.6
0.8
1Ti
O%2
ACM0.1
0.2
0.3
2 4 6 8 10 12
AlO
/SiO
23
2
Fe O +MgO%2 3
0.1
0.2
0.3
2 4 6 8 10 12
AlO
/SiO
23
2
Fe O +MgO%2 3
OIA OIA
OIA
CIA
CIACIA
ACM
ACMACMPM
PM
PM
a b
cd
Figure V 4. Plots of TiO2 (a), Al2O3/SiO2 (b), K2O/Na2O (c) and Al2O3/(CaO + Na2O) (d) versus Fe2O3 + MgO. Tectonic fields are oceanic island arc (OIA), continental island arc (CIA), active continental margin (ACM) and passive margin (PM) Green field represents the Okavango alluvial fan (AF) and the pink field represents Tanganyika lacustrine basin (LB).
Three tectonic settings, PM, ACM and OIA are recognized in the K2O/Na2O versus SiO2
discrimination diagram of Roser and Korsch (1986) (Figure V-5). As grain size has an influence
on the chemical composition of sediments, Roser and Korsch (1986) plotted sand-mud couplets
for modern sediments to test the validity of their diagram for muds and sands. In general,
sediments plot where expected except that fore-arc sands plot in the OIA field whilst the
associated muds plot in the ACM field. Again, for the Okavango samples, carbonate free
sediments were used and all samples were recalculated on a volatile free basis. Ash samples from
Tanganyika were also excluded. On this diagram the samples fall within the PM field with minor
overlap of both the Okavango and the Tanganyika sediments into the ACM field.

106
0.1
1
10
100
60 70 80 90
SiO2
KO
/Na
O2
2OkavangoTanganyika
PM
ACMOIA
Figure V 5. K2O/Na2O versus SiO2 discrimination diagram of Roser and Korsch (1986). Tectonic fields are oceanic island arc (OIA), active continental margin (ACM) and passive margin (PM) Green field represents the Okavango alluvial fan (AF) and pink field the Tanganyika lacustrine basin (LB).
The sandstone discriminant function diagram of Bhatia (1983) is based on a bivariate plot of first
and second discriminant functions of major element analyses. The plot represents four different
tectonic settings (OIA, CIA, ACM, PM). The functions and the plotting coordinates are from
Bhatia, (1983). For the Okavango and Tanganyika sediments (Figure V-6), the samples from both
suites all fall within the PM field with the exception of one sample, which is the ash layer from
MPU-10 taken from a depth of 650 cm. This sample falls on the border between PM and CIA.

107
Figure V 6. Sandstone discriminant function diagram of Bhatia (1983). Green field represents the alluvial fan (AF) and the pink field the Tanganyika lacustrine basin (LB).
Figure V-7 shows the discriminant function diagram for the provenance signatures of sandstone-
mudstone suites using major elements (after Roser and Korsch, 1988). Fields for dominantly
mafic, intermediate and felsic igneous provenances are shown with the field for a quartzose
sedimentary provenance. The plotting coordinates were extracted from Roser and Korsch, (1988).
For this diagram, the Okavango sediments plot in the field for a quartzose sedimentary
provenance and the Tanganyika sediments also plot in this field but with a few samples in the
intermediate igneous provenance field and the ash layer in the felsic field.

108
Figure V 7. Discriminant function diagram for the provenance signatures of sandstone-mudstone suites using major elements (after Roser and Korsch, 1988)
V.2.4.2 Discrimination diagrams and ratios of trace and rare earth elements
Cullers et al., (1988) showed that ratios such as La/Sc, Th/Sc Th/Co and La/Co in sediments
could be used to distinguish between a felsic and a mafic source. The immobile elements La and
Th are more abundant in felsic than in mafic rocks but the reverse is true for Sc and Co. Table V-
1 shows the calculated ratios for both the Okavango sediments and the Tanganyika sediments.
The Th/Cr ratios for the Okavango sediments overlap values recorded in sediments originating
from both felsic and mafic sources whereas the Th/Cr ratios for the Tanganyika sediments
encompass the range for fine grained sediments from felsic sources. For the Th/Sc ratios, the
Okavango sediments overlap the range of ratios obtained for sediments from felsic and mafic
source rocks and Tanganyika sediments fall within the range for fine grained sediments from
felsic sources. The range of Eu/Eu* (Eu anomaly) for the Okavango sediments overlaps the
ranges recorded in clastic sediments from felsic and mafic source rocks. For the Tanganyika
sediments, the samples all fall within the range for a felsic source, however, there is some overlap
between this range and the range for a mafic source. The La/Sc ratios of the Okavango sediments
overlap the ratios recorded in sediments originating from felsic and mafic source rocks whereas
the Tanganyika samples fall well within the range for a felsic source. La/Co ratios for the

109
Okavango sediments include low values similar to those recorded in sediments from mafic
sources and higher values (up to 1.39) requiring either an intermediate composition source or a
contribution from both mafic and felsic source rocks. Tanganyika samples all fall within the felsic
source range.
Wronkiewicz and Condie (1987) indicated that the source rock lithology (mafic, intermediate or
felsic) strongly influences the concentrations of Th, Sc, La, Zr, Hf and Co in the siliciclastic
sedimentary rocks. The relationships between these elements were used to devise ternary
diagrams for the identification of the nature of the source rocks of siliciclastic sedimentary rocks.
In the diagram La–Th–Sc (Figure V-8) the Okavango sediments define evolutionary trends or a
field extending from mafic to felsic source rock endmembers. Since these elements do not enter
in the structure of quartz, these trends/fields exclude the quartz component of the sediments. The
Tanganyika sediments are more tightly grouped together, around the field for a felsic source.

110
Figure V 8. La-Th-Sc ternary diagram. Data for Okavango sediments from Huntsman-Mapila et al., 2005.
Chondrite normalized diagrams (Figure V-9) both the Okavango and Tanganyika samples have
similar REE patterns to the pattern of the Post Archean Australian shales (PAAS) (Taylor and
McLennan, 1985). However, the Okavango sediments are less enriched in REE (∑REE range 7.9
– 152 (avg. = 46) ppm) than the Tanganyika samples (∑REE range 101 – 395 (avg. = 203) ppm).
The volcanogenic horizons indicated on the REE diagram show an enrichment of both LREE and
HREE relative to the surrounding matrix with ∑REE range 486 – 778 (avg. = 632) ppm). Similar
enriched REE patterns were reported by Williams et al., (1993) who analyzed ash layers from the
Rungwe volcanic field recorded in the lacustrine sediments of Lake Malawi.
Both suites exhibit light rare earth element (LREE) enrichment with respect to heavy rare earth
elements (HREE). The LaN/SmN for the Okavango sediments is between 3 – 8.4 (avg. = 4.2). For
the Tanganyika sediments, excluding the ash layers, the LaN/SmN ranged between 3.9 – 7.8 (avg.
= 4.9). The ash layers had a LaN/SmN of 4.9 – 8.8 (avg. = 6.8) indicating the highest LREE
enrichment. The REE patterns of both the Okavango and Tanganyika sediments are characterized
by chondrite-normalized REE values (LaN up to YbN) greater than one. The average values for
LaN/YbN for the Okavango samples is 10.3, for the Tanganyika muds is 12.4 and for the
Tanganyika ash layers is 19.7.

111
Table V 1. The range of elemental ratios in shales and fine sandstones derived from felsic and mafic rocks (Pennsylvanian-Permian age, Colorado, USA) and comparison with the range for Okavango and Tanganyika sediments
Ratio Shales fine sandstone Okavango sediments Tanganyika sediments
Range of sediment range of sediment range of sediment range of sediment range2 Range from felsic sources from mafic sources from felsic source from mafic sources
Th/Cr1 0.067-4.0 0.002-0.045 0.13-2.7 0.018-0.046 <0.001-0.75 0.29-3.24 Th/Sc1 0.64-18.1 0.05-0.4 0.84-20.5 0.05-0.22 <0.001-2 0.51-8.36 Eu/Eu*1 0.32-0.83 0.7-1.02 0.4-0.94 0.71-0.95 0.3-0.9 0.49-0.76 La/Sc1 0.7-27.7 0.4-1.1 2.5-16.3 0.43-0.86 0.01-6.7 3.96-30.19 La/Co1 1.4-22.4 1.8-13.8 0.14-0.38 0.03-1.39 3.77-42.65
1) Cullers, 2000 2) Huntsman-Mapila et al. (2005)

112
Figure V 9. Chondrite normalized REE diagram showing the Okavango and Tanganyika sediments. PAAS is shown for comparison (black squares). Data for Okavango sediments from Huntsman-Mapila et al., 2005.
VI.2.5 Discussion
V.2.5.1 Inferred tectonic setting of the depositional basin
Major elements undergo changes during sedimentary processes, for example, in most basins, SiO2
becomes enriched, while Na2O and CaO are depleted in sandstones compared with the source
rock composition. Thus, the major element chemistry gives some clues as to the provenance type
as well as the degree of reworking and weathering conditions, all of which are controlled by the
tectonic setting of the basin (Bhatia, 1983).
113
Useful discriminating parameters of tectonic setting for major elements include Fe2O3 + MgO%,
TiO2% and the Al2O3/SiO2, K2O/Na2O and Al2O3/(CaO+Na2O) ratios (Figure V-4). The ratio
Al2O3/SiO2 in sediments will give an indication of the quartz enrichment. The ratio of K2O/Na2O
is a signal of the K-feldspar and mica content versus plagioclase content in the sediments, whilst
the Al2O3/(CaO+Na2O) is a ratio of the relatively immobile to the more mobile elements. In
general, as the tectonic setting changes from oceanic island arc to continental island arc to active
continental margins to the passive margin type, there is a detectable decrease in Fe2O3+MgO,
TiO2, Al2O3/SiO2 and an increase in K2O/Na2O and Al2O3/(CaO+Na2O) (Bhatia, 1983; Roser and
Korsch, 1986; 1988).
Passive margin sandstones are generally enriched in SiO2 and depleted in Na2O, CaO and TiO2.
They also usually exhibit a large variation in their K2O/Na2O and Al2O3/(CaO+Na2O)
compositions and have a low Fe2O3+MgO content. This is a reflection of the recycled nature of
passive margin sediments with an enrichment of quartz and the depletion of chemically unstable
grains, for example, feldspars (Bhatia, 1983; Roser and Korsch, 1986; 1988). Relative tectonic
stability which results in enhanced weathering leads to the maturity of the sediments of this
setting. Both the Okavango and Tanganyika sediments fall predominantly within the PM field for
major element discriminant plots. There is a clear distinction between the fields for the Okavango
sediments (nascent rift setting) and the Lake Tanganyika (mature rift setting) sediments in these
figures (V-4, V-5 and V-6). This distinction is largely due to the higher quartz content of the
Okavango nascent rift sediments, reflecting the different depositional environment, compared to
the Tanganyika mature lacustrine basin sediments which have a higher Al2O3 content.
The early initiation stage in the development of a continental rift is characterized by the
development of shallow half-graben basins where nascent faults exert a primary control in
evolution of drainage and drainage catchments (Gawthorpe and Leeder, 2000). This stage is
illustrated by the present Okavango alluvial fan which is a broad subsiding half-graben occupied
by an alluvial fan. Quartz rich sediments (reworked aeolian sand) are deposited in a network of
meandering channels in this low gradient alluvial fan. A more mature stage concerns the
development of well-defined, actively subsiding half-graben basins, where propagation and
interaction between fault segments lead to basin linkage and strong control of drainage. Wider
and deeper lacustrine environments characterize this stage, which is illustrated by the southern
Mpulungu subbasin of Lake Tanganyika.

114
The local climatic conditions of both Lake Tanganyika and the Okavango must also be
considered, where more humid phases, for example the last deglacial, would result in enhanced
weathering of the sediments compared to more arid phases such as the Last Glacial Maximum.
The imprint of climate change on the sediments would occur over a much shorter time scale (101
– 104) than the tectonic signature (104 – 106) (le Turdu et al., 1999). Both the Okavango and the
Lake Tanganyika sediments are fairly recently (Late Pleistocene to Holocene) recycled and
deposited sediments of an older origin. Therefore, within each group (ie. Okavango and
Tanganyika) the climatic signature is by far the stronger of the two for describing variability.
However for this work, we use the bulk characteristics of each group and discount the variablilty
within each group to define the tectonic fields.
REE concentrations in sediments is a useful indicator of crustal provenance because of the nearly
quantitative transfer of these elements in sedimentary systems (Taylor and McLennan, 1985) In
general, mud derived from continental crust is LREE enriched (McLennan, 1989). Both the
Okavango and the Tanganyika sediments show REE patterns typical of continentally-derived
sediments.
The samples from the volcanic ash layers in the Lake Tanganyika sediments, provide interesting
results and the geochemistry reflects the different history of these samples. The ash layers would
have been deposited as the result of a major ash fall from the Rungwe Massif to the south of Lake
Tanganyika. The unweathered ash therefore would not have undergone the same mode of
transport (including weathering, erosion and fluvial transport) as the matrix material from the
cores. One ash samples in Figure V-6, plots on the margin of PM and CIA. Sediments from the
CIA are mainly derived from felsic volcanic rocks (Bhatia, 1983). The unweathered silicic
composition of this volcanic ash is reflected in this diagram.
V.2.5.2 Provenance
The majority of the sediments from the Okavango and Tanganyika fall within the quartzose
sedimentary provenance field (Figure V-7). The dilution factor of SiO2 from Kalahari aeolian
quartz for the Okavango sediments may influence this result. In the diagrams La–Th–Sc (Figure
V-8), the Okavango sediments define an evolutionary trend or a field extending from mafic to
felsic source rock endmembers. Since these elements do not enter in the structure of quartz, these

115
trends/fields exclude the reworked aeolian sand component of the sediments. However, if there is
an immediate source material of the Okavango sediments the quartzose sedimentary rock could
be represented in the area by the Karoo Supergroup or by the Kalahri Group which forms the
cover for a large part of the catchment. However, the trace and REE chemistry demonstrate that,
for the non-aeolian quartz component, the ultimate sources require both felsic and ultramafic–
mafic rocks (Huntsman-Mapila et al., 2005). Proterozoic granitoids and mafic–ultramafic rocks
exposed in NW Botswana and in adjacent countries (Angola and Namibia) represent source rocks
for the Okavango sediments. For the Mpulungu basin sediments from Lake Tanganyika, again the
immediate source material is a quartzose sedimentary rocks, probably represented by the
sandstones of the Mbala formation. The ultimate source material was a felsic source, possibly
represented by the basement granites. Both of these possible sources outcrop along both sides of
south Lake Tanganyika
V.2.6 Conclusions Discriminant diagrams for tectonic setting used in this paper place the majority of these East
African Rift sediments analysed in this work within the PM setting. Passive margin sandstones
are generally enriched in SiO2 and depleted in Na2O, CaO and TiO2 reflecting their highly
recycled and matured nature. Based on our results, we have suggested two new fields (alluvial fan
and lacustrine basin), within the previously defined passive margin field, to help discriminate
sediments from an early stage rift setting. The REE patterns from both the Okavango and Lake
Tanganyika exhibit patterns similar to PAAS, with the ash layers from the Rungwe volcanics in
the Tanganyika samples exhibiting an enrichment in REE. The sediment samples from the
Mpulungu sub-basin in Lake Tanganyika indicate that the immediate source material is a
quartzose sedimentary rock but the ultimate source material was a felsic source. These are
represented in the area by the sandstones of the Mbala formation and the granitic basement, both
which outcrop to the south of the lake. The Okavango sediments require both felsic and
ultramafic–mafic source rocks with possibly an immediate quartzose sedimentary source.
Acknowledgements
The Botswana Geological survey is acknowledged for permission to obtain samples from the
Okavango boreholes and the University of Botswana for providing funds for this research project
116
(RP680-063). Susan Ringrose and Sidonie Revillon made improvements to an earlier version of
the text.
References Ballard, S., Pollack, H.N., Skinner, N.J., 1987. Terrestrial heat flow in Botswana and Namibia.
Journal of Geophysical Research 92, 6291-6300. Bhatia, M.R., 1983. Plate tectonics and geochemical composition of sandstones. Journal of
Geology 91, 611-627. Bhatia, M.R., Crook, K.A.W., 1986. Trace element characteristics of graywackes and tectonic
setting discrimination of sedimentary basins. Contributions to Mineralogy and Petrology 92, 181-193.
Brewer, M.S., Halsam, H.W., Darbyshire, P.F.P., Davis, A.E., 1979. Rb/Sr age determinations in the Bangweulu Block, Luapula Provnice, Zambia. Inst. Geol. Sci. London 79 (5), 11 pp.
Burgess, C.F., 1985. The structural and stratigraphic evolution of Lake Tanganyika: a case study of continental rifting. Thesis, Duke University, Durham, 46 pp.
Carney, J.N., Aldiss, D.T., Lock, N.P., 1994. The geology of Botswana. Geological Survey Department, Lobatse, Botswana, pp. 113.
Chorowicz, J. 2005. The East African rift system. Journal of African Earth Sciences 43, 379–410. Cohen, A.S., Soreghan, M.J., Scholz, C.A., 1993. Estimating the age of formation of lakes: an
example from Lake Tanganyika, East African Rift system. Geology 21, 511-514. Condie, K.C., Dengate, J., Cullers, R.L., 1995. Behaviour of rare earth elements in a
paleoweathering profile on granodiorite in the Front Range, Colorado, USA. Geochimica Cosmochimica Acta 59, 279-294.
Coussement, C., 1995. Structures transverse et extension intracontinentale. Le rôle des zones de failles d’Assousa et Tanganyika-Rukwa-Malawi dans la cinématique néogène du système de Rift Est Africain. Thesis, Université de Bretagne Occidentale, Brest, 222 pp.
Cullers, R.L., 1994a. The controls on the major and trace element variations of shales, siltstones, and sandstones of Pennsylvanian-Permian age from uplifted continental blocks in Colorado to platform sediment in Kansas, USA. Geochimica Cosmochimica Acta 58, 4955-4972.
Cullers, R.L., 1994b. The chemical signature of source rocks in size fractions of Holocene stream sediment derived from metamorphic rocks in the Wet Mountains region, USA. Chemical Geology 113, 327-343.
Cullers, R.L., 2000. The geochemistry of shales, siltstones and sandstones of Pennsylvanian-Permian age, Colorado, USA: implications for provenance and metamorphic studies. Lithos 51, 181-203.
Cullers, R.L., Barrett, T., Carlson, R., Robinson, B., 1987. Rare earth element and mineralogical changes in Holocene soil and stream sediment: a case study in the Wet Mountains, Colorado, USA. Chemical Geology 63, 275-297.
Cullers, R.L., Basu, A., Suttner, L.J., 1988. Geochemical signatureof provenance in sand-size material in soils and stream sedimentsnear the Tobacco Root batholith, Montana, USA. Chemical Geology 70, 335-348.
Daly, M.C., Unrug, R. 1983. The Muva Supergroup of northern Zambia: a craton to mobile belt sedimentary sequence. Transaction of the Geological Society of South Africa 85, 155-165.
DWA (Department of Water Affairs), 1997. Appendix B: Geomorphology and Sedimentology. In: Maun Groundwater Development Project Phase 1. Water Affairs Department, Gaborone, Botswana, prepared by Eastend Investments.

117
Ebinger, C.J., 1989. Tectonic development of the western branch of the East African Rift system. Bulletin of the Geological Society of America 101, 885-903.
Ebinger, C.J., Deino, A.L., Drake, R.E., Tesha, A.L., 1989. Chronology of volcanism and rift basin propogation: Rungwe volcani province, East Africa. Journal of Geophysical Research 94, 15785-15803.
Ebinger, C.J., Ibrahim, A., 1994. Multiple episodes of rifting in Central and East Africa: A re-evaluation of gravity data. Geological Rundschau 83, 689-702.
Ebinger, C.J., Yemane, T., Harding, D.J., Tesfaye, S., Kelley, S., Rex, D.C., 2000. Rift deflection, migration, and propagation: Linkage of the Ethiopian and eastern rifts, Africa. Bulletin of the Geological Socciety of America 112, 163-176.
Fedo, C.M., Eriksson, K.A., Krogstad, E.J., 1996. Geochemistry of shales from the Archaean (∼ 3.0 Ga) Buhwa Greenstone Belt, Zimbabwe: implications for provenance and source-area weathering. Geochimica Cosmochimica Acta 60, 1751-1763.
Gawthorpe, R.L., Leeder, R., 2000. Tectono-sedimentary evolution of active extensional basins. Basin Research 12, 195-218.
Gumbrict, T., McCarthy, T.S., Merry, C.L., 2001. The topography of the Okavango Delta, Botswana, and its tectonic and sedimentological implications. South African Journal of Geology 104, 243-264.
Haddon, I.G., 2000. Kalahari Group sediments. In: T.C. Partridge and R.R. Maud (eds).The Cenozoic of Southern Africa. Oxford University Press, pp. 173-181.
Huntsman-Mapila, P., Kampunzu, A.B., Vink, B. and Ringrose, S. (2005) Cryptic indicators of provenance from the geochemistry of the Okavango Delta sediments, Botswana. Sedimentary Geology, 174 (1-2), 123-148.
Huntsman-Mapila, P., Huntsman-Mapila, P., Ringrose, S., Mackay, A.W., Downey, W.S., Modisi, M., Coetzee, S.H., Tiercelin, J-J., Kampunzu, A.B., Vanderpost C., 2006. Use of the geochemical and biological sedimentary record in establishing palaeo-environments and climate change in the Lake Ngami basin, NW Botswana. Quaternary International 148, 51-64.
Kampunzu, A.B., Lubala, R.T. 1991. Magmatism in extensional structural settings: The phanerozic African Plate. Springer-Verlag berlin, 637 pp.
Kampunzu, A.B., Akanyang, P., Mapeo, R.B.M., Modie, B.N., Wendorff, M., 1998a. Geochemistry and tectonic significance of Mesoproterozoic Kgwebe metavolcanic rocks in northwest Botswana: implications for the evolution of the Kibaran Namaqua-Natal Belt. Geological Magazine 133, 669-683.
Kampunzu, A.B., Bonhomme, M.G., Kanika, M., 1998b. Geochronology of volcanic rocks and evolution of the Cenozoic Western branch of the East African rift system. Journal of African Earth Sciences 26, 441-461.
Kampunzu, A.B., Armstrong, M.P., Modisi, M.P., Mapeo, R.B., 1999. The Kibaran belt in southwest Africa: ion microprobe U-Pb zircon data and definition of the Kibaran Ngami belt in Botswana, Namibia and Angola. Gondwana Research 2, 571-572.
Kampunzu, A.B., Armstrong, R.A., Modisi, M.P. Mapeo, R.B.M., 2000. Ion microprobe U-Pb ages on single detrital zircon grains from Ghanzi Group: implications for the identification of a Kibaran-age crust in northwestern Botswana. Journal African Earth Sciences 30, 579-587.
Le Gall, B., Tshoso, G., Jourdan, F., Féraud, G., Bertrand, H., Tiercelin, J.J., Kampunzu, A.B., Modisi, M., Dyment, J., Maia, M., 2002. Ar-Ar geochronology and structural data from the Okavango Giant mafic dike swarm, Karoo large igneous province, N Botswana. Earth Planetary Science Letters 202, 595-606.
Le Turdu, C., Tiercelin, J-J., Gibert, E., Travi, Y., Lezzar, K.E., Richert, J.P., Massault, M., Gasse, F., Bonnefile, R., Decobert, M., Gensous, B., Jeudy, V., Tamrat, E., Mohammed, M.EU., Martens, K., Atnafu, B., Chernet, T., Williamson, D., Taieb, M., 1999. The

118
Ziway-SHala lake basin system, Main Ethiopian Rift: Influence of volcanism, tectonics, and climatic forcing on basin formation and sedimentation. Palaeogeography, Palaeoclimatology, Palaeoecology 150, 135-177.
Lezzar, K.E., Tiercelin, J.J., De Batist, M., Cohen, A.S., Bandora, T., van Rensbergen, P., Le Turdu, C., Wafula, M., Klerk, J., 1996. New seismic stratigraphy and Late Tertiary history of the North Tanganyika Basin, East African Rift system, deduced from multifold reflection and high resolution seismic data and piston core evidence: Basin Research 8, 1-28.
Mapeo, R.B.M., Armstrong, R.A., Kampunzu, A.B., 2000. Ages of detrital zircon grains from Neoproterozoic siliciclastic rocks in Shakawe area: implications for the evolution of the Proterozoic crust in northern Botswana. South African Journal of Geology 103, 156-161.
McCarthy, T.S., Green, R.W., Franey, N.J., 1993. The influence of neo-tectonics on water dispersal in the northeastern regions of the Okavango swamps, Botswana. Journal of African Earth Sciences 17, 23-32.
McLennan, S.M., Taylor, S.R., Eriksson, K.A., 1983. Geochemistry of Archean shales from the Pilbara Supergroup, Western Australia. Geochimica Cosmochimica Acta 47, 1211-1222.
McLennan, S.M., Taylor, S.R., McCulloch, M.T., Maynard, J.B., 1990. Geochemistry and Nd-Sr isotopic composition of deep sea turbidites: crustal evolution and plate tectonic associations. Geochimica Cosmochimica Acta 54, 2015-2050.
McLennan, S.M., Rare earth elements in sedimentary rocks: Influence of provenance and sedimentary processes: Mineralogical Society of America 21, 683-724.
McLennan, S.M., Hemming, S., McDaniel, D.K., Hanson, G.N., 1993. Geochemical approaches to sedimentation, provenance and tectonics. Geological Society of America 284, 21-40.
McConnell, R.B., 1980. A resurgent taphrogenic lineament of Precambrian origin in eastern Africa. Journal of the Geological Society of London 137, 483-489.
Modisi, M.P., 2000. Fault system of the southeastern boundary of the Okavango Rift, Botswana. Journal of African Earth Sciences 30, 569-578.
Modisi, M.P., Atekwana, E.A., Kampunzu, A.B., Ngwisanyi, T.H., 2000. Rift kinematics during the incipient stages of continental extension: evidence from nascent Okavango rift basin, northwest Botswana. Geology 28, 939-942.
Mondeguer, A., Ravenne, C., Masse, P., Tiercelin, J.J., 1989. Sedimentary basin in an extension and strike-slip background : the South Tanganyika troughs complex, East African Rift. Bull. Soc. Geol. Fr., 8 (3), 501-522.
Mondeguer, A., 1991. Bassins sédimentaires en contexte extensif et décrochant: l’exemple du “Complexe des fosses sud-Tanganyika”, Rift Est- Africain. Morphostructures et sédimentation. PhD thesis. l’Université de Bretagne Occidentale.
Morley, C.K., 1988. Variable extension in Lake Tanganyika. Tectonics 7, 785-801. Morley, C.K., Wescott, W.A., Stone, D.M., Harper, R.M., Wigger, S.T., Karanja, F.M., 1992.
Tectonic evolution of the northern Kenyan Rift. Journal of the Geological Society of London 149, 333-348.
Morley, C.K., 1999 (Ed). Geoscience of rift systems- evolution of East Africa. American Association of Petroleum Geologists, Tulsa, 222 pp.
Nesbitt, H.W., Young, G.M., 1984. Prediction of some weathering trends of plutonic and volcanic rocks based on thermodynamic and kinetic considerations. Geochimica Cosmochimica Acta 48, 1523-1534.
Reeves, C.V., 1972. Rifting in the Kalahari? Nature 237, 95-96. Rollinson, H., 1993. Using geochemical data: Evaluation, Presentation, Interpretation. Longman
Scientific and Technical, New York, 352 pp. Rosendahl, B.R., Reynolds, D.J., Lorber, P.M., Burgess, C.F., McGill, J., Scott, D., Lambiase,
J.J., Derksen, S.J., 1986. Structural expression of rifting: lessons from Lake Tanganyika,

119
Africa. In: L.E., Frostick, R.W., Renault, I. Reid and J.J. Tiercelin (eds). Sedimentation in the African Rifts. Geological Society of London Special Publication 25, 29-43.
Rosendahl, B.R., Versfelt, J.W., Scholz, C.A., Buck, J.E., Woods, L.D., 1988. Seismic atlas of Lake Tanganyika, East Africa: Project PROBE Geophysical Atlas Series, Folio 1, Durham, Duke University.
Roser, B.P., Korsch, R.J., 1986. Determination of tectonic setting of sandstone-mudstone suites using SiO2 content and K2O/Na2O ratio. Journal of Geology 94, 75-83.
Roser, B.P., Korsch, R.J., 1988. Provenance signatures of sandstone-mudstone suites determined using discriminant function analysis of major-element data. Chemical Geology 67, 119-139.
Shudofsky, G.N., 1985. Source mechanisms and focal depths of East African earthquakes using Rayleigh-wave inversion and body-wave modeling. Geophysical Journal of the Royal Astronomical Society 83, 563-614.
Taylor, S.R., McLennan, S.M., 1985. The continental crust: its composition and evolution. Oxford, Blackwell Scientific, 312 pp.
Taylor, S.R., McLennan, S.M., 1995. The geochemical evolution of the continental crust. Review of Geophysics 33, 241-265.
Tiercelin, J.-J., Thouin, C., Tshibangu, K., Mondeguer, A., 1989. Discovery of sublacustrine hydrothermal activity and associated massive sulphides and hydrocarbons in the north Tanganyika trough, East African Rift. Geology 17, 1053-1056.
Tiercelin, J-J, Mondeguer, A., 1991. The geology of the Tanganyika Trough. In: Coulter G.W. (ed). Lake Tanganyika and its life. Oxford University Press, Oxford, pp. 7-48.
Tiercelin, J-J., Potdevin, J-L., Morley, C.K., Talbot, M.R., Bellon, H., Rio, A., Le Gall, B., Vetel, W., 2004. Hydrocarbon potential of the Meso-Cenzoic Turkana Depression, northern Kenya. I. Reservoirs: depositional environments, diagenetic characteristics, and source rock-reservoir relationships. Marine and Petroleum Geology 21, 41-62.
Unrug, R., 1984. The mid-proterozoic Mporokoso group of northern Zambia: Stratigraphy, sedimentation and regional position. Precambrian Research 24, 99-121.
Williams, T.M., Henney, P.J., Owen, R.B., 1993. Recent eruptice episodes of the Rungwe Volcanic Field (Tanzania) recorded in the lacustrine sediments of the Northern Malawi Rift. Journal of African Earth Sciences, 17, 33-39.
Wronkiewicz, D.J., Condie, K.C., 1987. Geochemistry of Archean shales from the Witwatersrand Supergroup, South Africa: source–area weathering and provenance. Geochimica Cosmochimica Acta 51, 2401-2416.
120
VI. SEDIMENTOLOGICAL AND GEOCHEMICAL EVIDENCE FOR PALAEO-
ENVIRONMENTAL CHANGE IN THE MAKGADIKGADI SUBBASIN IN
RELATION TO THE MOZ RIFT DEPRESSION, BOTSWANA
VI.1. Changements paléo-environnementaux dans le sous-bassin de Makgadikgadi en relation avec la dépression du rift de MOZ (Botzwana): approche géochimique et sédimentologique Résumé de l’article Ce travail présente de nouvelles évidences pour les changements de paléo-environnement qui ont
eu lieu pendant le Pléistocène dans le nord-ouest du Botswana. Des lignes de rivage encroûtées le
long de la marge nord-est du sous-bassin de Makgadikgadi (MSB) nous donnent des informations
paléo-environnementales dans le contexte de la dépression du rift Makgadikgadi-Okavango-
Zambezi (MOZ). Les données de terrain, les analyses XRD et les mesures géochimiques
montrent que les lignes de rivage de MSB sont composées de calcrète (type LU1), de calcrète
riches en MgO avec de la silice (type LU2), de silice-calcrète (type LU3) et de silcrète (type
LU4). Les épisodes d’eau douce ont été suivis par des épisodes secs ou la calcrète s’est formée,
en alternance avec des silicifications répétitives. La formation des calcrètes dans les sédiments
littoraux de la cuvette était peut être biologique ou fonction de l’environnement. La précipitation
de calcrète étant en partie contrôlée par le rapport de Mg/Ca dans l’eau interstitielle des sédiments
de la marge, cela suggère l’existence de conditions évaporatiques dans un bassin fermé. Les
phases de silicification semblent être liées aux périodes où les conditions géochimiques sur le
littoral de la cuvette ressemblaient aux conditions actuelles, avec de l’eau hyper-sodée type Na-
CO3-SO4-Cl. L’eau souterraine, acide, avec une salinité moyenne et saturée en silice, a précedé la
précipitation du Si au moment où le pH diminuait. La mobilisation du Si est le résultat de la
dissolution du quartz, amplifié par les diatomiées, les bactéries et les algues dans la zone littorale
humide de la cuvette. L’eau interstitielle riche en SiO2 a migré à travers la calcrète desséchée et
craquelée, vers des zones de moindre salinité et de moindre pH entraînant un déplacement
préférentiel de la calcrète et la précipitation de silcrète. Les dates approximatives de TL suggèrent
que le sable littoral a été calcrètisé pendant les périodes sèches des paléo-lacs qui ont eu lieu
avant 110 ka, 80 – 90 ka et 41 – 43 ka. Ces périodes concordent bien avec la chronologie de la
carotte de Vostok pour l’Afrique du sud.

121
VI.2. Sedimentological and geochemical evidence for palaeo-environmental change
in the Makgadikgadi subbasin in relation to the MOZ rift depression, Botswana
Susan Ringrosea,*, Philippa Huntsman-Mapilaa,b, Ali Basira Kampunzuc, William Downeyd,
Stephan Coetzeed, Bernard Vinkc, Wilma Mathesone, Cornelis Vanderposta
aHarry Oppenheimer Okavango Research Centre, University of Botswana, Private Bag 285, Maun, Botswana bUBO-CNRS UMR, 6538 Domaine Oceaniques IUEM, 29280 Plouzane, France cDepartment of Geology, University of Botswana, Private Bag 0022, Gaborone, Botswana dDepartment of Physics, University of Botswana, Private Bag 0022, Gaborone, Botswana eEES (Pty) Ltd., P.O. Box 31024, Gaborone, Botswana Article published in Palaeogeography, Palaeoclimatology, Palaeoecology 217 (2005) 265-287 Abstract This work considers new evidence for palaeo-environmental change taking place during the
Pleistocene in northern Botswana. Duricrusted strandlines along the northeastern margin of Sua
Pan provide palaeo-environmental data pertaining to the Makgadikgadi subbasin (MSB) with
inferences regarding the larger Makgadikgadi–Okavango–Zambezi (MOZ) rift depression. Field,
XRD and geochemical data show that MSB strandlines comprise calcretes (LU1 type), MgO-rich
calcretes with silica (LU2 type), sil-calcrete (LU3 type) and silcrete (LU4 type). Early freshwater
episodes appear to have been followed by calcrete-dominated drying phases interspersed with
repeated silcretisation. Calcretisation through pan littoral sediments may have been both
biogenically and environmentally induced. Calcite precipitation was in part controlled by the
Mg/Ca ratio of pore water in the pan littoral zone suggesting closed basin type evaporative
conditions, which were followed by a major desiccation interval. Phases of silcrete precipitation
appear to be related to periods when the geochemistry of the lake littoral more closely resembled
present-day Na–CO3–SO4–Cl-type brines. Silica saturated acidic, moderately saline groundwater
preceded Si precipitation which took place as the pH reduced. Si mobilisation occurred (inter
alia) as a result of quartz grain dissolution enhanced by diatoms, bacteria and algal growth in the
moist pan littoral. SiO2-rich pore waters migrated through cracked and desiccated calcrete into
areas of lower salinity and lower pH resulting in preferential calcite removal and silcrete
precipitation. Approximate TL dates imply that exposed littoral sand underwent calcretisation

122
during the drying phases of extensive palaeo-lakes which occurred prior to 110 ka, 80–90 ka and
41–43 ka. These wet periods compare fairly well with Vostok core chronologies for southern
Africa
VI.2.1. Introduction Fluvio-lacustrine deposition in northern Botswana has mainly taken place within a large structural
(mega) depression, a southwesterly propagating extension of the east African rift system, which
was initiated approximately 2.4–5.0 Ma (Du Toit, 1933; Tiercelin and Lezzar, 2002). This rift
depression was drained and filled by southeasterly flowing rivers on a number of occasions
during the Tertiary and Pleistocene as the area was faulted and half grabens developed (Cooke,
1980; Mallick et al., 1981; Modisi et al., 2000). Deeper structural subbasins formed mainly on the
southern margin of the rift forming loci for lacustrine deposition (Thomas and Shaw, 1991;
Gumbricht et al., 2001; Ringrose et al., 2002a). The MOZ (Makgadikgadi–Okavango–Zambezi)
depression is controlled by a series of NE–SW normal faults related to incipient rifting which
reactivated Proterozoic and Karoo structures (Baillieul, 1979; Smith, 1984; Modisi et al., 2000).
Tectonic activity along the same trend resulted in uplift along the Zimbabwe–Kalahari axis
possibly during the late Pliocene (Partridge and Maud, 2000; Moore and Larkin, 2001) causing
the impoundment of proto Okavango, Kwando and upper Zambezi drainage and the development
of the Makgadikgadi (MSB), Ngami and Mababe subbasins (Cooke, 1980; Ringrose et al.,
2002b). The MSB comprises two large salt pans referred to as Sua Pan in the east and Ntwetwe
Pan in the west covering some 37000 km2. This work considers new approaches to the
interpretation of palaeo-lacustrine environments from the Makgadikgadi subbasin (MSB) in the
context the MOZ rift depression based on morpho-stratigraphic evidence and
thermoluminescence (TL) dates. To avoid confusion, the term Lake Palaeo-Makgadikgadi which
was intended to encompass all fluvio-lacustrine events in the nascent rift in the older literature
(e.g., Cooke, 1979; Cooke and Verstappen, 1984; Thomas and Shaw, 1991; Ringrose et al.,
1999a) is being discontinued, as it suggests an enlarged version of the present Makgadikgadi Pan
complex (cf. Moore and Larkin, 2001). Hence, the introduction of the term Makgadikgadi–
Okavango–Zambezi (MOZ) rift depression wetlands to help clarify the regional context. The
apparent semi-continuous development of palaeo-lakes in the MSB from possibly late Pliocene to
Recent times has been subject to speculation especially with respect to the nature of feeder
channels and links to the Okavango system. Results of previous work have mainly been based on
height data from assumed strandlines with minimum age 14C dates (Cooke and Verstappen,
1984; Thomas and Shaw, 1991, 2002; Ringrose et al., 1999a). The present work emphasises

123
duricrust strandline morphogenesis from the northeastern MSB to help interpret depositional
environments. This takes place in the context of new indicative thermoluminescence (TL) dates
which are used to amplify geochronological events. Specific aims include the development of
morpho-stratigraphic records and the establishment of geochemical units intended to develop
innovative data for palaeoenvironmental change. Strandline evolution in terms of MSB and MOZ
depression palaeo-environments is further elaborated.
VI.2.2. Study area The study area forms part of the northeastern Makgadikgadi subbasin in north central Botswana
between 19.80 S–21.60 S and 25.75 E–26.40 E covering approximately 3600 km2 (Figure VI-1).
Background geology comprises Archean terrain covered by >250 m of Karoo sediment (Lebung
and Ecca Groups) crossed by the Okavango dyke swarm including Proterozoic and Jurassic mafic
dykes (Geological Survey of Botswana, 2000). These in turn are covered by Kalahari Group
sediments (Mallick et al., 1981). The development and subsequent enlargement of the MSB
appears to have resulted from downwarping at the intersection of NE–SW nascent rift structural
trends with orthogonal NW–SE Karoo trends (Figure VI 1). A significant feature in the study area
is Sua Spit, which in common with other remnant linear features in the MSB follows NW–SE
trends. Sua Pan is infilled with clay, silt and fine sand currently saturated by a near surface brine
aquifer of the Na–CO3–SO4–Cl type (Eugster and Hardie, 1978; Shaw et al., 1990). Sua Pan is
the lowest member of the Pan sequence with a sump level of 890 m a.s.l. The area is sparsely
vegetated with anomalously low rainfall at c. 400 mm/year (Ringrose et al., 1999b). The
precipitation rate is exceeded by the evapotranspiration rate by a factor of three (Bhalotra, 1987).

124
Figure VI 1. Location of the palaeo-Makgadikgadi sub-basin (MSB) in relation to the Makgadikgadi-Okavango-Zambezi (MOZ) rift depression (D=location of TL date sites)

125
VI.2.3. Analytical techniques Field work at three locations took place between 1999 and 2002 and was aimed at characterizing
duricrusts throughout the known range of strandline levels. Observational data and samples were
taken from twenty gravel pits and road cuts in Location 1, ten hand dug pits in Location 2 and
five gravel pits in Location 3 (Figure VI-2). Satellite images provided a basis for the selection of
northwest–southeast and north–south transects which were used to establish topographic profiles
and the locations for duricrust examination. Topographic profiling took place to fit the strandlines
into the existing height-based geochronology. For this, a Trimble 4700 differential GPS was used
in Location 1. Topographic data for Locations 2 and 3 were obtained from topographic maps and
survey beacons the heights of which were available from the Botswana Department of Surveys
and Mapping. Additional contour data were obtained from the Makgadikgadi Pans Development
Plan (Republic of Botswana, 2000). Field methods included the clearing of pit faces, their
differentiation into sedimentary units, the development of a systematic field description following
terminology available in Wright and Tucker (1991) and the sampling of all major units and plant
remains. Units intended for TL analysis were covered by a tarpaulin and sampled in the dark.
Samples comprised large coherent megaaggregates which were dug from the interior of the pit
wall, covered immediately in aluminium foil and placed in a lightproof plastic container. A series
of samples were taken from each location intended to be representative of older litho-clasts,
intermediate indurated and younger friable nodular horizons. Samples were taken from
homogeneous horizons, representative of material supplying the environmental dose rate. Twenty
duricrust samples were sent to the Council for Geoscience, Pretoria for thin sectioning. The thin
sections were later investigated under plain and cross-polarised light using a Zeiss Axioplan
microscope. A Philips XL30 environmental scanning electron microscope (ESEM) with an
electron microprobe (EDAX) was used to obtain preliminary micro-textural information, to
determine the nature of microorganisms and to provide localised qualitative elemental data.
Naturally occurring surfaces were examined without preparatory polishing to preserve micro-
textures.
Twenty bulk samples were subject to X-ray diffraction powder analysis using a Phillips PW 3710
XRD unit, operated at 45 kV and 40 mA, employing Cu-K alpha radiation and a graphite
monochronomator. The samples were scanned from 3o to 70o 2θ and their diffractograms
recorded. After initial scanning, the bulk samples were leached in a dilute 10% HCl solution. The

126
leached residues were scanned for minor and accessory insoluble silicate phases. Whole rock
chemical analyses were performed on twenty-five samples at Chemex Laboratories (Canada).
Major element compositions were determined using an ICP-AES with a detection limit of 0.01
wt.% and precision of ±1%. Inorganic CO2 and organic C were determined using a Leco-
Gasometric and Leco-IR detector with detection limits of 0.2% and 0.01%, respectively. Eleven
samples were dated using TL techniques (Aitken, 1985). This technique was used because it has
provided reliable dates in the past (Blumel et al., 1998; Ringrose et al., 1999a, 2002a,b).
Literature sources suggest a degree of comparability between TL and OSL (optical spin
luminescence) (e.g., Radtke et al., 1999; Huaya et al., 2004). Quartz grains in the size range 90–
125 µm, assumed to have undergone total bleaching in a shallow water environment before
duricrust precipitation, were extracted from litho-clasts and nodules using a series of treatments.
These included removal of carbonates and iron staining using hydrochloric acid and digestion of
organic material using hydrogen peroxide. Fluorosilicic acid was used to dissolve feldspars while
heavy minerals were separated using sodium polytungstate. Remaining magnetic minerals were
removed using an electromagnetic separator. The purity of the final quartz extract was tested
using Infrared Stimulated Luminescence to ensure that no feldspars were present. The clean
sample was subjected to a hydrofluoric acid etch for 40 min at 24 oC to remove the outer a
affected skin. The grains were mounted on 10-mm-diameter stainless steel discs and fixed using
Silkospray silicone oil. Multiple aliquots were used for each additive dose step and regenerated
bleached samples. The strontium 90 β source was calibrated against a known β source to deliver
1.9 Gy min-1. Additive doses +β1, +β2 etc. in Gy were used for natural and bleached samples
(Table VI-1). Following the appropriate irradiations, the sample was stored for 24 h and
preheated at 220 oC for 300 s before TL measurement using a Riso D12 reader (Botter-Jensen and
Duller, 1992). A second glow normalisation was performed on the glowed out samples using a
dose of 6 Gy for each sample. The TL glow curves show convincing temperature plateaux over
the temperature ranges (Table VI-1). Exponential regressions for TL in relation to Dose were
performed for each sample and the equivalent dose (DE) obtained from which the residual TL
was subtracted. The TL data were fitted by exponential regression over the best temperature
plateau range for both the additive dose and bleached regenerated data and a comparison made of
the respective curve forms. In this case, the R2 regenerated TL growth curve coefficient was
within an acceptable range. The environmental dose rate was determined by a low-level alpha
counter (Elsec 7286) using a 42-mm ZnS screen (Zoller and Pernicka, 1989). The values shown
assume secular equilibrium for both U and Th chains (Carl, 1987). Uncertainty levels on Table
VI-1 represent one standard deviation. The potassium content (wt.%) was determined using a

127
Corning 410 flame photometer. The moisture value used in the age equation determination of
these samples is ±5%. The cosmic dose was calculated taking into consideration depth of burial,
overburden density and porosity, sample coordinates and altitude.
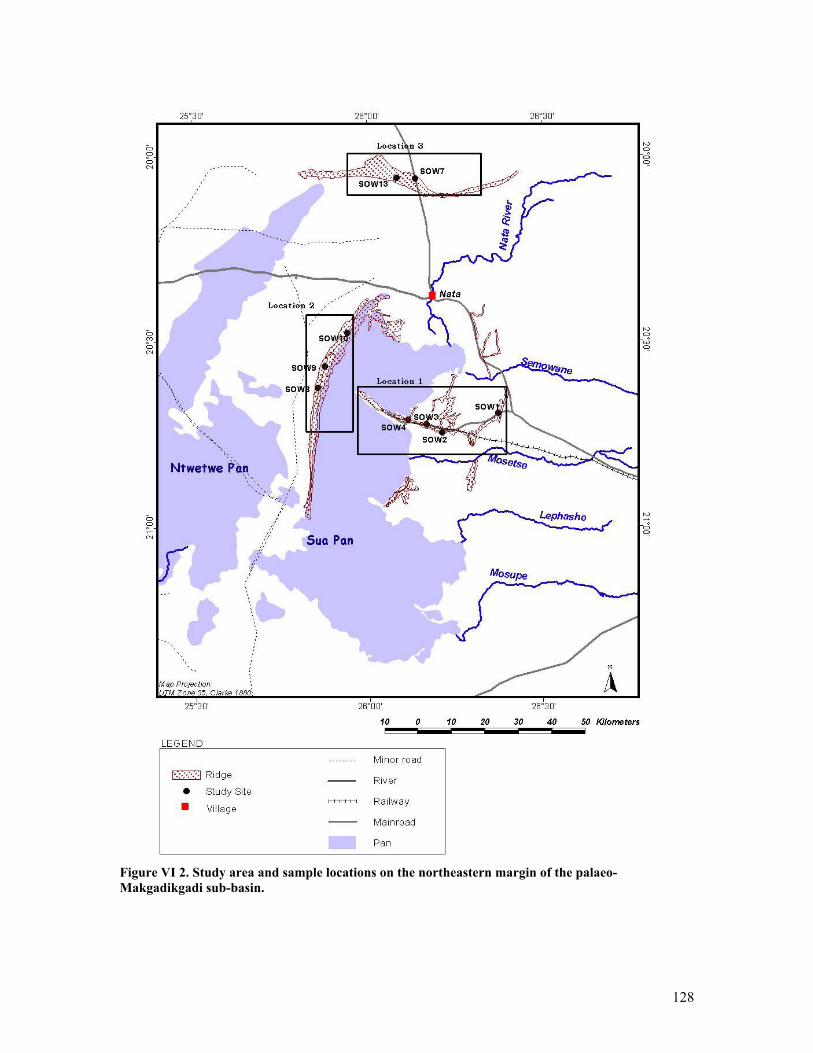
128
Figure VI 2. Study area and sample locations on the northeastern margin of the palaeo-Makgadikgadi sub-basin.

129
Table VI 1. Data inputs for thermoluminescence analysis (see text for explanation)
Sample SOW13S2P SOW13S1 SOW13S3 SOW13S2A SOW7AS2 SOW13S2 SOW1 S6 SOW4 S4 SOW8A MAUNSE12A KVFS3 Sample (De)(Gy) 86.77±0.79 164.851±81 118.78±6.71 72.37±1.79 157.83±15.28 50.02±1.24 219.83±7.20 111.57±9.00 48.66±3.81 337.50±16.90 666.00±33.30 Sediment U ppm 0.92±0.09 1.92±0.19 1117±0.62 1.02±0.15 0.75±0.05 110±90.09 8112±0.26 0.80±0.09 15.73±0.61 1.33±0.18 0.93±0.09 Sediment Th ppm 1.73±0.30 4.14±0.62 4.60±0.62 2.57±0.48 1.14±0.18 1.37±0.28 1.47±0.86 0.92±0.28 16.18±2.03 6.00±0.58 1.47±0.28 K wt% 0.32±0.03 0.740±.03 0.58±0.03 0.30±0.03 1.58±0.03 0.74±0.03 0.28±0.03 2.28±0.33 0.54±0.03 2.00±0.03 1.00±0.03 Dose rate mGya-1 799±66 1613±119 1313±106 866±79 1956±118 1213±84
2423±174 2570±162 5560±401 2813±178 1350±93 Plateau (Temp. range oC)
319-354 316-411 296-365 303-354 328-399 331-435
307-345 334-376 314-377 - - Additive Dose +b1(Gy)
116.67 33.33 66.67 100 100 26.67
133.33 26.67 26.67 - - +b2 233.33 66.67 100 166.67 200 66.67 283.33 166.67 56.67 - - +b3 333.33 266.67 150 266.67 533.33 233.33 500 266.67 100 - - +b4 - - 366.67 - - - - - 166.67 - -

130
VI.2.4. Topographic, Stratigraphic and Petrographic Results Location 1 ridges were examined at eleven locations and in detail at exposures SOW1 to SOW4
(Figure VI-2). The Pan floor immediately adjacent to Sua Spit lies at an elevation of 904 m and
rises up through a series of minor sand and duricrust ridges, the most prominent of which lie at
906 m and 908 m. The exposures examined in detail occur immediately landward of the Spit
such that SOW4 stands at 911 m, SOW3 at 924 m SOW2 at 926 m and SOW1 at 936 m. While
the lowest unit in the upper SOW1 ridge is an indurated, calcareous lithoclastic bed showing
desiccation cracking, the lowest units in the remaining profiles (SOW2-4) comprise well developed
(3-5 cm) rhyzoliths in a green, granular calcareous matrix (Figure VI-3). The rhyzoliths appear to be
root casts (sensu Klappa, 1980) in units which also contain small litho-clasts showing desiccation
cracking and void formation. The rhyzoliths are large, up to 1-2 cm in diameter and 8-10 cm long,
comprising a greenish-white calcareous exterior (1-2 mm) and grey-brown siliceous interior (Figure
VI-4A). This unit grades upwards into moderately indurated nodular calcrete with cracked siliceous
litho-clasts in a partially indurated sandy calcareous matrix. The nodules are small and composed of
concentric shells of CaCO3 accreted around quartz or calcite nuclei and occur more towards the top
of the unit, while the litho-clasts are larger (1-3 cm) and more angular. In SOW2 and 3 the nodules
grade upwards into a more friable, nodular calcrete. In SOW4 the nodular litho-clastic unit is
replaced vertically by calcareous siltstone showing major desiccation cracking (Figure VI-4B)
succeeded by honeycomb calcrete which in turn is capped by an indurated, calcareous hardpan
comprising calcareous litho-clasts (Figure VI-3). SOW2, 3 and 4 are capped by indurated, calcrete
hardpan with calcareous and siliceous litho-clasts. In contrast the higher SOW1 units comprise
lower laminar calcrete which is rhyzolith free and succeeded by a calcareous siltstone showing major
desiccation cracking. This is overlain by friable, nodular calcrete and capped by conglomeratic
hardpan made up of indurated duricrust comprising either large (0.5-3.0 cm) quartz and calcrete
clasts in a micritic, partially Fe stained matrix. The conglomeratic quartz clasts show evidence of
vertical and peripheral cracking in addition to Fe staining.
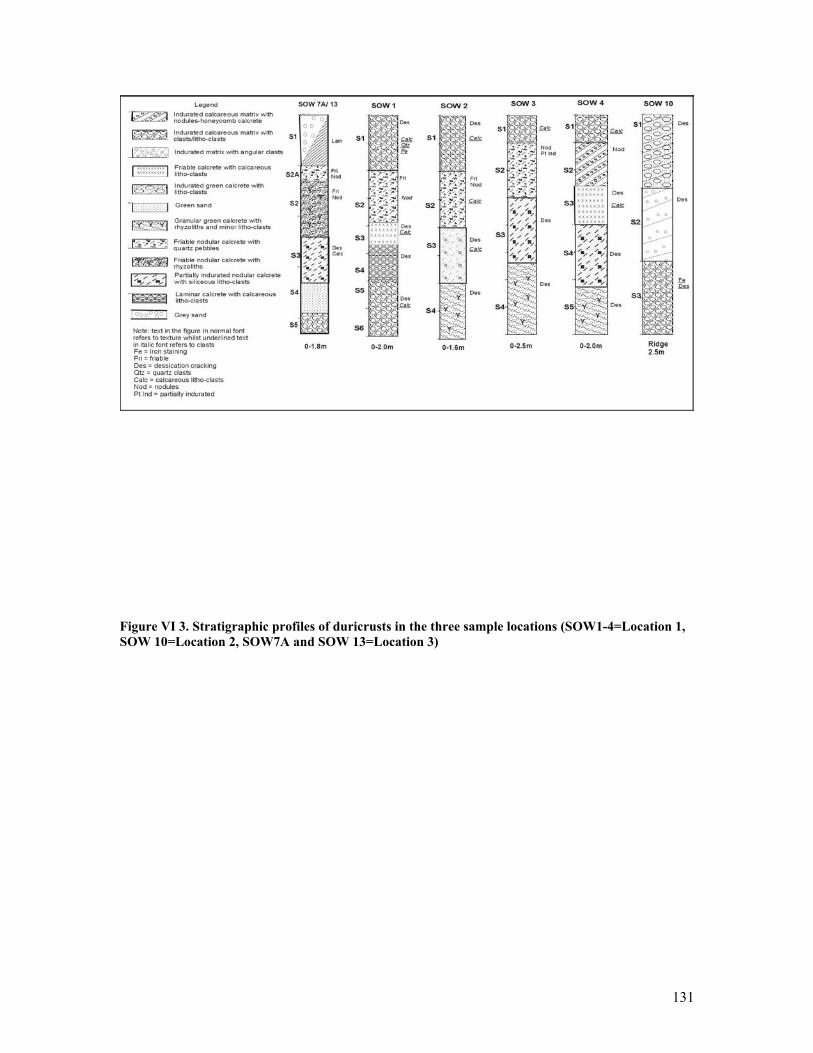
131
Figure VI 3. Stratigraphic profiles of duricrusts in the three sample locations (SOW1-4=Location 1, SOW 10=Location 2, SOW7A and SOW 13=Location 3)
132
A series of ridges were examined Location 2 adjacent to the west side of Sua Pan, in detail at the
indurated SOW10 ridge. The Pan floor west of Sua Spit lies at an elevation of about 900 m and
rises up through a series of lower sand ridges to more prominent duricrust ridges at 904 m and
906 m. The SOW10 906 m ridge is completely lithified and comprises three units (Figure VI-3).
The lower unit is composed of recrystallised green calcrete with calcareous and siliceous litho-
clasts showing extensive cracking. The siliceous litho-clasts are lensoid (terrazzo) in shape with
notable Fe staining (Figure VI-4C). The intermediate unit is made up of brecciated sil-calcrete
litho-clasts in an indurated calcareous matrix with voids and desiccation cracking throughout.
The upper unit is composed of indurated calcareous sediment with severely cracked sub-rounded
green litho-clasts showing laminar to massive infilling. Lower Location 2 sand ridges rise up 1-3
m from the western edge of Sua Pan. The sandy ridges, examined at SOW8B comprise 0.5 m
uniform sand with disseminated calcareous particles and scattered rhyzoliths. A series of silica
rich lensoid terrazo plates are present along the former shoreline. These plates vary in length
from 2-10 cm and are 1-3 cm in thickness and lie on the present pan edge in random
discontinuous sheets (Figure VI-4D).

133
Figure VI 4. 4A-Numerous rhyzoliths (A) in green, granular calcareous matrix at SOW3 S4 (bar=6 cm); 4B-Dessication cracking showing alteration of CaCO3 rich pebbles (A) by silica rich porewater SOW4 S3 (bar=10 cm); 4C-Lensoid terrazzo plates congealed in the SOW10 ridge (bar=5 cm); 4D- Lensoid terrazzo plates along the edge of Sua Pan near SOW10 (bar=8 cm)

134
SOW7A and 13 occur in Location 3 on the northeastern margin of the Makgadikgadi Basin at around
943-945 m (Figure VI-2). In terms of height and lateral continuity, ridges at this elevation have been
described as representing the oldest strandline features in the PMSB (Thomas and Shaw, 1991). The
basal bed of SOW7A comprises an indurated litho-clastic unit with sub-rounded quartz clasts in a
hardened calcareous matrix (S5, Figure VI-3). In contrast, the basal unit of SOW13 (S4, Figure VI-
3) is made up of semi-consolidated light green sand with calcareous fragments and fine quartz
particles interspersed with rhyzoliths. Both lower units are replaced by partially indurated nodular
calcrete with siliceous, angular, large (to 4 cm), litho-clasts showing evidence of desiccation
cracking. This is succeeded in both profiles (SOW13 and 7A) by friable nodular calcrete with
abundant rhyzoliths. The rhyzoliths are mostly large (up to 3.5 cm diameter and 2-6 cm long)
comprising calcareous outer sheaths with a siliceous infilling. This unit grades upwards into a friable
nodular bed with quartz clasts. The nodules are mainly composed of quartz nuclei with carbonate
rich concentric outer shells. The profiles are capped by a massive calcareous hardpan in SOW13 and
massive grey sand in SOW7. The hardpan comprises lenticular siliceous clasts in a calcareous
matrix.
VI.2.5. X Ray Diffraction and Geochemical Results XRD analyses of litho-clastic and nodular samples indicate that the MSB duricrusts may be
subdivided into calcite or quartz dominated types (Table VI-2). In Location 1 SOW1, calcite (or
calcite with dolomite) is dominant and varies from 66 vol% to 80 vol% calcite down profile.
More quartz clasts are found in the upper units. The presence of feldspars is low at 1-2 vol%
microcline and albite, despite the proximity of Karoo bedrock. The proportion of dolomite (3-4
vol%) and the presence of palygorskite (3-8 vol%) with sepiolite (2-8 vol%) confirm the
prevalence of Mg in the strandline duricrusts. The presence of Mg rich clays and dolomites
suggests formation in Mg-rich alkaline environments, normally associated with a closed basin
depositional history (e.g. Watts, 1980; Eugster and Kelts, 1983; Alonso-Zarza et al., 2002).
Results from SOW3 litho-clasts and nodules show a more even proportion of calcite (9-47 vol%)
and quartz (30-45 vol%). Mg is abundant throughout with the S2 unit containing 42 vol%
dolomite. The proportion of feldspars is slightly higher than that found in SOW1 at 4-6 vol%
microcline and 3-6 vol% albite. The presence of illite (3-12 vol%) or possibly glauconite
contrasts with the palygorskite and sepiolite found in SOW1 and may be detrital in origin.

135
On the western side of Sua Pan at Location 2, the ridge at SOW10 comprises an even proportion
of calcite and quartz with minor dolomite (2 vol%) towards the top of the ridge, higher quartz (72
vol%) about half way down and higher calcite (74 vol%) towards the ridge base (Table VI-2).
The feldspar proportion is low throughout. The percentage of illite (or glauconite) increases
towards the base (from 2-7 vol%). Watts (1980) discusses how glauconite is lost during
calcretisation as glauconite and calcite are incompatible (cf. Krumbein and Garrels, 1952). The
pan edge duricrusts (SOW8A/8B) show relatively equal proportions of quartz (33-40 vol%) and
calcite (24-40 vol%) with intermediate feldspars. Two samples contain relatively high
proportions of magadiite and kenyaite whose presence implies that the pan littoral was
exceptionally alkaline and saline during their formation. Both minerals are considered to have
formed from a reaction between dissolved halite and silica (Vink et al., 2001).
Towards the northern edge of the basin at SOW7A, XRD analysis on litho-clasts and nodules
shows that high calcite concentrations (64 vol%) towards the base become lower (to <1 vol%)
towards the top of the profile while the reverse is true for quartz (89-22 vol%). An exceptional
unit to this trend is SOW7A which shows high quartz and low calcite towards the base of the
profile (Table VI-2). Most units contain 3-12 vol% clay which may be either detrital illite or
glauconite and a low feldspar content. A relatively high dolomite percentage (15 vol%) occurs
towards the top of the profile at SOW7A S2. SOW13 also comprises dolomite (38 vol%) towards
the top of the profile in association with a variable quartz (20-66 vol%) and calcite (8-60 vol%)
content. The SOW13 samples contain a high proportion of neoformed sepiolite (10-15 vol%).
The Mg rich mineral suite implies neoformation of clays and dolomite likely under alkaline rich,
closed basin conditions (Watts, 1980; Eugster and Kelts, 1983).

136
Table VI 2. Results of X-Ray diffraction analysis (vol%) on selected MSB strandline sediments. SAMPLE Cal Dol Qtz Mcl Alb Mca Pal Sep Ill Cly Mag Ken Hem Hal
SOW 1-S1 66 3 23 2 <1 - 4 - - - - - - -
SOW 1-S2 72 4 18 1 2 <1 - - - - - - - -
SOW 1-S3 74 5 13 1 1 - 3 2 - - - - <1 -
SOW 1-S4 65 5 18 2 1 - 8 - - - - - - -
SOW 1-S5 62 4 13 3 2 - 7 8 - - - - - -
SOW 1-S6 80 - 14 <1 <1 - 5 - - - - - - -
SOW 3-S1 43 10 36 4 6 2 - - - - - - - -
SOW 3-S2 9 42 36 5 3 - - - - 4 - - - -
SOW 3-S3 36 7 45 5 4 - - - - - - - <1 -
SOW 3-S4 47 - 30 6 3 - - - 12 - - - - -
SOW 7A-S1 <1 - 88 5 1 - - - 5* - - - - -
SOW 7A-S2 30 15 50 2 <1 - - - 3* - - - - -
SOW 7A-S2A
18 2 70 5 1 - - - - 4 - - - -
SOW 7A-S3 2 - 82 5 1 - - - 10 - - - - -
SOW 7A-S4 64 - 22 2 1 - - - 12* - - - - -
SOW 8A 40 - 33 3 4 - - - - - 10 10 - -
SOW 8B 24 - 40 2 3 - - - - - 15 15 - -
SOW 10-S1 44 2 45 1 1 - - - 2 6 - - - -
SOW 10-S2 22 - 72 2 1 - - - 4 - - - - -
SOW 10-S3 74 - 18 1 <1 - - - 7 - - - - -
SOW 13-S1 30 - 52 4 3 - - 10 - - - - - -
SOW 13-S1A 60 - 20 <1 1 - - 14 - - - - - -
SOW 13-S2 8 - 65 5 5 - - 15 - - - - - 2
SOW 13-S2A 10 38 42 3 1 - - - 3 - - - - -
Cal=Calcite, Dol=dolomite,.Qtz=quartz, Mcl=microline, Alb=albite, Mca=micas, Pal=palygorskite, Sep=sepiolite, Ill=Illite, Cly=clay minerals, Mag=magadiite, Ken=kenyaite,Hem=hematite, Hal=halite * Approximate quantities
137
Geochemical results from twenty nodular and litho-clast samples indicate a high correlation
between CaCO3 and SiO2 (R2=0.985) suggesting inverse precipitation trends (cf. Gwosdz and
Modisi 1983) and the incompatibility of precipitation environments of these two elements
(Thomas and Shaw, 1991). AlO2 and Fe2O3 are also correlated (R2=0.751) along with SiO2 and
TiO2 at R2=0.617 implying that most silicates are derived from Precambrian bedrock sources as a
result of weathering and transportation. There is no correlation between CaCO3 and MgO nor
between SiO2 and MgO. Results indicate high LOI values (>30 vol%) in the SOW1, SOW7A S4
and SOW10 S3 implying a high carbon content for these calcretes (Table VI-3). Geochemical
results along with XRD data indicate that the MSB duricrusts may be sub-divided into four sub-
groups broadly following classifications proposed by Walker (1960), Summerfield (1983a,
1983b) and Nash and Shaw (1998). Litho-unit CaCO3 and SiO2 proportions in relation to profile
heights and duricrust type are shown on Table VI-4. Specifically, litho-unit 1 (LU1) is banded
between 60-80 wt% calcite and 10-30 wt% SiO2 and is referred to as calcrete (Figure VI-5).
While examples of LU1 are present at all locations, the high calcite litho-unit is found mainly at
936 m in Location 1, SOW1. Litho-unit 2 (LU2) is banded between 35-50 wt% calcite and 35-52
wt% SiO2, and composed of approximately equal proportions of calcite and siliceous sediment.
This is referred to as calcrete with silica. LU2 duricrusts occur throughout the study area but are
found mainly around 924 m (SOW3). Litho-unit 3 (LU3) is banded between 15-30 wt% calcite
and 58-72 wt% SiO2 and so has a higher proportion of silica rich sediment and occurs at
Locations 2 and 3, but mainly in SOW13 between 943-945 m. This litho-unit is referred to as sil-
calcrete based both on relative composition and matrix epigenesis (Nash and Shaw, 1998). Litho-
unit 4 (LU4) is banded between <10 wt% calcite and 78-95 wt% SiO2 and is therefore composed
mainly of siliceous sediment, including silcrete and occurs entirely along the 943-945 m
strandline at SOW7A and SOW13 (Table VI-4).
Average proportions of low quantity major elements per litho-unit are shown in Figure VI-6,
from which minimal amounts of P2O5, MnO and Cr2O3 are omitted. Trends mainly show
increasing MgO and an increase in the Mg/Ca ratio towards the calcite rich litho-units (i.e.
towards LU1). The dominant major element after SiO2/CaCO3 is MgO which is particularly high
in LU2 samples.These are relatively rich in dolomite while LU1 samples show relatively high
proportions of sepiolite and palygorskite (cf. Table VI-2). This contrasts with the remaining low
quantity major elements all of which increase towards the more silica rich litho-units (LU4). For
instance, in LU1 the Al2O3 content is low between 0.67-1.77 wt% and increases through the

138
remaining litho-units to between 1.09-3.06 wt% in LU2, to between 1.84 to 2.07 wt% in LU3 and
1.72-3.35 wt% in LU4 (Table VI-3, Figure VI-5). K2O, Na2O and Fe2O3 increase with the
proportion of clay minerals and feldspars towards LU4. TiO2 also increases towards the more
SiO2 rich litho-units (Figure VI-6). These overall trends suggest that aggressive
calcretisation/dolomitisation at high pH levels led to the almost complete replacement of most
pre-existing silicates especially in LU1 and LU2 duricrists. The relatively high Mg/Ca ratios of
these sediments suggests the prevalence of alkaline, highly evaporative conditions typified by
closed basin environments. This contrasts with the apparently less intense process of
silcretisation (in the LU4 and LU5 duricrusts) which in the MSB appears to take place under
acidic, moderately saline conditions causing a number of the remaining silicates to survive intact.
The lower than 1.2wt% TiO2 content in all the litho-units infers that the mobilisation of pre-
existing silicates may have been a dominant process in the pan littoral environments
(Summerfield, 1982; Nash et al., 1994).
Table VI 3. Major element composition in wt. % in relation to morpho-stratigraphic sequence from MSB strandlines (missing are Cr2O3 at 0.01 wt.% for all samples and MnO ranging from 0.01-0.09 wt.% for all samples)
SAMPLE SiO2 K2O Al2O3 CaO Fe2O3 MgO Na2O P2O5 TiO2 CO2inorg %
LOI
SOW 1-S1 25.6 0.33 1.5 37.74 0.66 1.96 0.15 0.01 0.09 29.6 32.73
SOW 1-S2 19.24 0.3 1.11 41.19 0.6 1.92 0.17 0.03 0.06 31.8 35.6
SOW 1-S3 14.09 0.2 0.67 42.96 0.31 3.21 0.17 0.05 0.05 33.6 38.65
SOW 1-S4 23.64 0.3 1.12 36.57 0.47 3.71 0.2 0.04 0.08 31 34.39
SOW 1-S5 24.34 0.38 1.42 35.62 0.49 4.72 0.23 0.01 0.08 28.8 33.55
SOW 1-S6 17.15 0.31 1.11 42.67 0.46 1.84 0.15 0.01 0.06 33.6 36.47
SOW 3-S1 42.47 0.78 2.03 25.16 0.62 4.08 0.4 0.01 0.08 22.8 25.05
SOW 3-S2 42.16 1.06 3.06 17.86 0.87 9.38 0.65 0.01 0.12 22.8 24.73
SOW 3-S3 48.88 1.02 2.68 19.95 0.66 4.87 0.52 0.01 0.1 17.8 21.75
SOW 3-S4 38 0.94 2.43 26.5 0.65 4.26 0.5 0.01 0.11 22.4 26.21
SOW 10-S1 47.16 0.76 1.29 25.92 0.5 0.82 0.23 0.27 0.09 20 23.11
SOW 10-S2 72.5 1.1 1.84 12.18 0.69 0.71 0.2 0.03 0.1 10 11.22
SOW 10-S3 20.83 0.65 1.03 41.29 0.42 0.98 0.14 0.03 0.05 32.6 34.37
SOW 8A 50.87 0.74 1.64 21.79 0.47 1.14 1.95 0.01 0.08 17 22.05
SOW 8B 62.03 0.7 1.78 13.35 0.53 1.53 2.68 0.01 0.08 9.6 17.92
SOW 7A-S1 93 0.92 2.18 0.24 0.68 0.43 0.16 0.01 0.14 0.2 2.09
SOW 7A-S2 50.9 0.94 1.94 21.33 0.68 3.55 0.18 0.01 0.09 18.6 20.95
SOW 7A-S2A
72.56 0.92 2.02 10.39 0.61 2.01 0.14 0.01 0.1 8.6 11.04
SOW 7A-S3 86.09 1.64 3.35 1.11 1.23 2.05 0.2 0.01 0.15 0.8 3.79
SOW 7A-S4 28.16 1.11 1.77 36.3 0.75 1.18 0.14 0.03 0.08 28.2 30.77
SOW 13-S1 58.68 0.85 2.07 16.94 0.72 3.09 0.26 0.01 0.15 13.2 17.79
SOW 13-S1A
29.03 0.54 1.26 33.87 0.47 3.53 0.21 0.03 0.08 26 31.5
SOW 13-S2 78.46 0.87 1.72 4.63 0.63 3.43 1.03 0.01 0.16 3.4 10.27
SOW 13-S2A
46.02 0.5 1.09 18.15 0.39 9.09 0.21 0.01 0.11 21.8 25.1
SOW 13-S3 67.03 0.87 1.85 13.43 0.68 2.19 0.14 0.01 0.16 9.6 13.64

139
Table VI 4. Duricrust type and calcite-silica composition (wt.%) in relation to morpho-stratigraphic sequence from MSB strandlines.
SAMPLE Height m.asl CaCO3 SiO2 Litho-unit Duricrust type SOW 1-S1 936 67.32 25.6 1 Calcrete SOW 1-S2 936 72.32 19.24 1 Calcrete SOW 1-S3 936 76.41 14.09 1 Calcrete SOW 1-S4 936 70.5 23.64 1 Calcrete SOW 1-S5 936 65.5 24.34 1 Calcrete SOW 1-S6 936 76.41 17.15 1 Calcrete SOW 3-S1 924 51.85 42.47 2 Calcrete with silica SOW 3-S2 924 51.85 42.16 2 Calcrete with silica SOW 3-S3 924 40.48 48.88 2 Calcrete with silica SOW 3-S4 924 50.94 38 2 Calcrete with silica SOW 7A-S1 943-945 0.45 93 4 Silcrete SOW 7A-S2 943-945 42.3 50.9 2 Calcrete with silica SOW 7A-S2A 943-945 19.56 72.56 3 Sil-calcrete SOW 7A-S3 943-945 1.82 86.09 4 Silcrete SOW 7A-S4 943-945 64.13 28.16 1 Calcrete SOW 8A 905 38.66 50.87 2 Calcrete with silica SOW 8B 908 21.83 62.03 3 Sil-calcrete SOW 10-S1 910 45.48 47.16 2 Sil-calcrete SOW 10-S2 910 22.74 72.5 3 Sil-calcrete SOW 10-S3 910 74.14 20.83 1 Calcrete SOW 13-S1 943-945 30.02 58.68 3 Sil-calcrete SOW 13-S1A 943-945 59.13 29.03 2 Calcrete with silica SOW 13-S2 943-945 7.73 78.46 3 Silcrete SOW 13-S2A 943-945 49.58 46.02 3 Sil-calcrete SOW 13-S3 943-945 21.83 67.03 4 Silcrete

140
0
10
20
30
40
50
60
70
80
90
100
SOW
1-S1
SOW
1-S2
SOW
1-S3
SOW
1-S4
SOW
1-S5
SOW
1-S6
SOW 7A
-S4
SOW 10
-S3
SOW 13
-S1A
SOW
3-S1
SOW
3-S2
SOW
3-S3
SOW
3-S4
SOW 7A
-S2
SOW 8A
SOW 10
-S1
SOW 13
-S2A
SOW
7A-S
2A
SOW 8B
SOW 10
-S2
SOW 13
-S1
SOW 13
-S3
SOW 7A
-S3
SOW 7A
-S1
SOW 13
-S2
Maj
or o
xide
s w
t%
Al2O3SiO2CaC03MgOLitho-unit 1
Litho-unit 2
Litho-unit 3
Litho-unit 4
Figure VI 5. Results of bulk geochemical analysis showing the subdivision of samples into four litho-units based on relative percentages of SiO2 and CaCO3. Amounts of MgO and Al2O3 also shown.

141
0
0.5
1
1.5
2
2.5
3
3.5
4
4.5
5
Litho-unit 1 Litho-unit 2 Litho-unit 3 Litho-unit 4
Oxi
des
wt%
Al2O3
K2O
Fe2O3
MgO
Na2O
TiO2
Mg/Ca ratio
Al203
K20
Fe2O3
MgO
Mg/Ca
Figure VI 6. Trends in the lower quantity macro-elements relative to the four litho-units showing increasing MgO and Mg/Ca ratio with increasing CaCO3 (to left) and increase in remaining elements with increasing SiO2 (to right). Elements shown on histograms from left to right are Al2O3, K2O, Fe2O3, MgO, Na2O, TiO2 and the Mg/Ca ratio.

142
VI.2.6 Thin section and ESEM results Detailed thin section and ESEM analysis was undertaken to augment geochemical and XRD data and
to provide insight into complex calcretisation and especially silicification processes. Litho-clast
samples were selected for this work because these usually demonstrate several stages of silicification
often of an originally calcareous deposit (cf. Ringrose et al., 1999a; Nash and Shaw, 1998). ESEM
investigations in low vacuum mode on sub-samples from SOW1 S5 the indurated litho-clastic
unit, show rounded quartz clasts with evidence of shallow etch marks closely associated with
remobilised crypto-crystalline silica in addition to laminar calcrete fragments (Figure VI-7A). In
this LU1 calcrete sample, EDAX results show equal proportions of Si and Ca on the remobilised
surface indicating the close association of recrystallised quartz and calcite in the matrix (Table
VI-5). The laminar calcrete appears to be relatively untouched and co-exists with remobilized
amorphous silica. In a second slide (not shown) unmodified bedded Karoo sandstone clasts with
circum-peripheral cracking are also evident in the mixed matrix. The SOW4 S4 sample reveals
remobilised silica in the form of large and small interlayered Si plates which appear to be cracked
suggesting a pressure solution mechanism (cf. Monger and Daugherty, 1991). Of particular
interest are sub-samples which contain bacterial mat colonies either coating siliceous plates,
within small voids or occupying pre-existing organically formed casings (Figure VI-7B). The
casing analysed is more Si rich than the background silcrete plates implying that bacteria were
sequestering Si initially from the void lining or casing (Table VI-5). The cocci infill and
individual cocci are further enriched in Si relative to background and casing compositions while
the cocci themselves also show traces of Ti not present in the background sample (Table VI-5).
Once initiated, bacterial growth appears to be uniform with identifiable mound and chain
patterns. Individual cocci are normally rounded and about 5-6 µm in diameter although some
appear to be stunted or truncated (Figure VI-7C).
Thin section analysis of a lensoid shoreline sample from SOW 10 terrazzo plates show several stages
of Si re-crystallisation (Figure VI-4B, Table VI-6). ESEM analysis of a SOW10 shoreline silica
plate indicates that the sample is composed of rounded quartz and calcite pseudomorphs along with
rounded 'onion ring' ghost structures in an amorphous silica rich matrix (Table VI-5, Figure VI-7D).
The matrix contains between 42-76 wt% cryptocrystalline Si with discrete Ti rich minerals. Close
examination of a Ca rich clast shows a transition of increasing silica content from the relatively Ca
rich interior out towards the Si rich matrix (Table VI-6). The transition which is gradual shows a
layered sequence of columnar calcite grains alternating with equiaxial calcite grains (Figure VI-8A).

143
The process seems to imply a systematic incursion (replacement) of Si rich pore fluids into a
disintegrating calcrete clast. A quartz clast with accreted calcite layers also shows impregnation with
Si rich pore fluids (Table VI-5). The calcite layers may have transformed into a porous columnar
structure prior to silica mobilisation (Figure VI-8B). The 'onion ring' structures represent a more
advanced stage in the process which terminates in the total replacement of clast-like shapes with
matrix silica (Figure VI-7D). The fact that some of the original calcite remains in what appears as
matrix material may account for the apparent co-existence and inverse relationship of Ca and Si in
the matrices of MSB duricrusts.
Thin section data from Location 3 (SOW13 S2 S3 units) litho-clasts shows at least three stages of
crystallisation in the matrix. The matrix comprises SiO2 rich earlier microcrystalline and later
cryptocrystalline phases with accompanying voids, some of which are filled by late stage authigenic
silcrete (Table VI-6). ESEM analysis of a nodular sample (from SOW13 S2) shows high
proportions of Mg and Ca in overgrowth structures (agglomerates) developed on quartz rich
clastic sediment (Table VI-5). Further analysis revealed Si rich fungal hyphae and unidentified
diatoms in a Si rich environment. Some of the hyphae occur as branching forms about 100 µm
long, emplaced over inter-particle voids (Figure VI-8C). Others are smaller forming stub like
growths 20 µm long or thin curvilinear forms around 30 µm in length (cf. Monger and Adams,
1996). The diatoms are also long (c. 30 µm) and fragmented in death assemblages adding silica
to the littoral sediment. Both the diatoms and the hyphae suggest a wet (damp) environment
during the time of deposition and both are involved in Si accumulation suggesting that biogenic
sources were an important factor in silica accumulation and mobilisation.
VI.2.7 Thermoluminescence Dating Samples for TL dating were obtained from Locations 1 and 3. Sand grains were dated from upper
and lower units at SOW1, 3 and 4, SOW7A and SOW13 (Figure VI-3). Sand grains were also taken
from a calcrete pit on an upper Thamalakane terrace near Maun (MaunSE12a) and from a lower
terrace adjacent to the Zambezi river west of Kasane (KVFS3) to assist in providing a regional
(MOZ) context (Figure VI-1). The sand was obtained from older litho-clasts or rhyzoliths.
The date KVF S3 was taken from the Chobe confluence with Zambezi river and is estimated at
around 493 309 3 ± 3 985 years which is a minimum age as the sample is saturated. This date tends
to suggest that a lower-mid Zambezi link was re-established during the mid-Pleistocene, inferring

144
that direct outward drainage from the northern margin of the MOZ depression took place around this
time (cf. Thomas and Shaw, 1991). Meanwhile, the MSB may have been operating as a separate
basin, being infilled during major wet periods throughout the mid-late Pleistocene from the northeast,
south and west (Nash et al., 1994b; Ringrose et al., 1999a, 2002a).
Figure VI 7. 7A-SEM photograph showing rounded quartz clast with evidence of shallow etch marks (A) and remobilised silica (B) with laminar calcrete (C) in SOW1 S5 sample. ;7B SEM photograph of silica rich organic casing (A) hosting bacterial cocci coating (B) (SOW4 S4); 7C SEM photograph detail of silica rich bacterial cocci showing developed and stunted growth forms (SOW4 S4); 7D SEM photograph showing Si rich (A) and Ca rich (B) pseudomorphs with 'onion ring' ghost structures (C) in an amorphous silica matrix (SOW10 shoreline SiO2 plate).

145
TL dates were obtained from samples representing different diagenetic stages within the morpho-
stratigraphic units from Location 3 on PMB strandlines. The oldest approximate date in the series is
from the inner portion of a rhyzolith from the lower part of SOW13 S2 (P) from which an estimated
age of post root calcification is given at 108 555 ± 9017 years ago. This earliest date is partially
substantiated by a similar though slightly younger date from a siliceous clast within the hardpan of
SOW13 S1 which is estimated as being formed around 102 194 ± 7621 years ago. These are the
oldest recorded approximate dates on MSB upper strandlines (943-945 m) and appear to indicate the
onset of a drying phase following an earlier late Pleistocene wet interval which occurred more than
110 000 years ago. Data from the Vostock core (Petit, 1999) and archeological data from Butzer
(1984) and Brook et al., (1998) confirm wet conditions in the region around 120 000 years ago.
Peaks in the Vostock data are constrained by 18O data from drill holes off South Africa and Sea
Surface Temperatures off Namibia, all of which appear to relate to Milankovitch precessional cycles
(Partridge et al., 1999; Tyson et al., 2002). An estimated TL age from sand grains within a
calcretised upper Thamalakane terrace north-east of Maun (MAUNSE12a) in the central MOZ
(Okavango) basin gives a minimum sample age of 119 981 ± 9850 years but could be older as it is
saturated. This early wet interval may have manifested as a series of wetland areas emerging from a
"lake Okavango" extending southwards and eventually overspilling into the MSB over gaps in the
Gidikwe ridge (cf. Cooke and Verstappen, 1984; Thomas and Shaw, 1991; Ringrose et al., 1999a,)
more than 110 000 years ago.

146
Table VI 5. Duricrust composition (wt.%) from samples SOW4 (4), SOW 13 (13) and SOW1 (1) from ESEM EDAX microprobe measurements
Location Na
Mg
Al
Si
S
Cl
K
Ca
Ti
Mn
Fe
SOW1calc 13.23 4.41 36.72 0.75 43.13 1.75
SOW1calc 17.34 2.92 38.76 0.72 38.59 1.66
SOW4S4bkgd 0.58 8.41 10.33 64.75 0.72 8.92 6.28
SOW4S4casing 9.65 5.27 78.04 4.27 2.77
SOW4S4infill 4.33 5.46 82.32 4.42 3.47
SOW4S4cocci 5.29 5.16 80.84 4.8 0.36 3.55
SOW10matrix1 1.27 0.69 1.01 41.21 0.08 0.12 0.54 1.86 0.85
SOW10matrix2 0.9 0.69 1.18 47.19 0.11 0.07 0.58 1.28 0.46
SOW10matrix3 2.18 1.95 2.2 76.47 1.35 3.32 0.48 0.36 1.68 SOW10Ti matrix 1.29 1.25 1.26 17.31 0.43 1.13 37.56 1.48 35.45
SOW10Sicentre 1.28 1.07 1.05 37.92 0.17 0.07 0.57 2.34 0.1 0.73
SOW10Sicol2 0.67 0.85 0.68 11.54 0.14 0.15 0.43 28.89 0.06 0.52
SOW10Sicol1 0.72 0.8 0.79 12.92 0.05 0 0.44 26.23 0.11 0.59
SOW10Simatrix 0.85 0.84 0.95 38.57 0.13 0.09 0.44 2.56 0.56
SOW10Cacol3 0.62 0.72 0.62 9.72 0.35 35.42 0.54
SOW10Cacol2 0.6 0.59 0.5 8.28 0.22 37.85 0.28
SOW10Caeqi-ax 0.68 0.95 0.78 11.62 0.05 0 0.41 27.32 0.12 0.69
SOW10Cacol1 0.6 0.72 0.68 14.12 0.12 0.11 0.35 31.46 0.2 0.55
SOW10Camatrix 0.85 0.87 0.95 36.25 0.1 0.07 0.55 3.87 0.42 SOW13agglom 1.37 14.41 4.42 57.59 3.77 2.9 12.54
SOW13hyphae 1.66 15.85 5 50.81 4.45 3.08 16.25 0.38 5.52
SOW13ovrgrths 0.58 6.71 3.83 70.76 2.42 1.86 11.8 2.04

147
A second series of dates were obtained from sand grains in litho-clasts and nodules within the
morpho-stratigraphic sequences at Locations 1 and 3. A siliceous litho-clast from SOW13 S3 was
given an approximate TL date of 90 436 ± 8909 years. A nodule from within the overlying nodular
rhyzolith unit from SOW7A S2 was given an approximate TL age of 80 678 ± 9202 years while a
nodule from the rhyzolith free upper unit (SOW13 S2A) was dated at approximately 83 568 ± 7898
years. Interestingly an approximate age of 90 728 ± 7161 years was also obtained from a litho-clast
from SOW1 S6. These dates may represent the drying phase of a second wet interval which appears
to have attained a similar elevation in the MSB (943-945 m) to the earlier (>110 ka) interval but
which shows evidence of a later decline to the 936 m level. These dates are again consistent with
Milankovitch cycles which suggest that after the 120 ka. warm-wet period, less intense wet
conditions recurred every 23 000 years such that a second warm, wet peak was evident around 97 ka,
a third around 74 ka and a fourth around 51 ka in the southern African region (Tyson et al., 2002).
As similar dates occur at both higher and lower strandline levels these are therefore considered to
represent the close of a major infilling and evaporative event at >80-90 ka yrs. This extended over a
range of heights (from 945 to 936 m) in the MSB with the later 936 m level being more indicative of
strongly evaporative conditions.
Younger dates were obtained from a siliceous litho-clast from within the nodular unit (SOW13 S2)
which resulted in an estimated TL age of 41 243 ± 3033. A litho-clastic sample from SOW4 S4 was
also approximately dated at 43 408 ± 4443 years. These two dates imply a third Late Pleistocene wet
interval which spanned an even wider range of heights (from 943-945 to 911 m) as it dried out in the
MSB around 41 000 years ago. While higher palaeo-lake levels may have extended into MOZ
depression, closed basin conditions may be inferred from the 924-911 m strandline duricrusts which
fall within the LU2 high MgO type (Figure VI-5). The >41-43 ka. palaeo-lake event to some extent
confirms earlier 14C dating (c. 41 ka) previously described in the MSB by Cooke (1975); Cooke
and Verstappen (1984); Shaw and Cooke (1986), Shaw and Thomas (1988), Thomas and Shaw
(1993, 2002). The 41 ka wet interval is in general agreement with isotopic data from southern
Botswana (e.g. Holmgren et al., 1995).
A sample from Location 2, SOW8A taken from a shoreline siliceous, lensoid nodule was TL dated at
approximately 8753 ± 931 years. This date largely corresponds to the last major drying interval
within the MSB, an episode which infers open basin conditions as fresh water from rivers to the west
probably entered the lake during this episode, in a similar way to the ephemeral river inflow which

148
occurs today (Shaw et al., 1997). The post 40 ka period saw a continuation of the calcification
processes in an evaporative transgressive-regressive environment to c. 8 ka with almost complete
drying to the present day (cf. Rust et al., 1984; Scott, 1993). The date from the pan edge
environment suggests that the ultimate drying phase of the Makgadikgadi complex commenced
towards the close of the Holocene altithermal (Partridge et al., 1997).
Figure VI 8. 8A SEM photograph of Ca rich clast showing transition stages from Ca rich interior (A) out towards the Si rich matrix (B) through a layered sequence of columnar and equiaxal calcite (C). (SOW10 shoreline SiO2 plate); 8B SEM photograph of a Si rich clast (B) with accreted columnar calcite (A) inferring impregnation with Si rich matrix silica (SOW10 shoreline SiO2 plate); 8C SEM photograph of Si rich fungal hyphae (A) emplaced over inter-particle voids (SOW13 S2); 8D SEM photograph of Si rich diatoms (A) about 30 µm from a fragmented death assemblage (SOW7A S2).

149
Table VI 6. Summary of depositional and diagenetic characteristics of major duricrust deposits of northern Sua Pan (MSB) Duricrust type and type location
Fabric/texture Composition Structure Late stage overprints
SOW 1 - Calcrete (LU1 type) S20.5249 E26.3740
Clast supported hardpan- Ca and Si lithoclasts-matrix supported Replacive/displacive calcrete matrix surface Fe mottling
Micritic low Mg calcite Microspar pore cement-secondary cements
Calcareous rhyzoliths, qtz clasts and calcareous lithoclasts, laminar and nodular-friable
Coated calcareous and quartz clasts. Secondary zonation and replacement by calcite. Void formation and infill Si cocci
SOW 2-4 Calcrete with silica (LU2 type) S20.5542 E26.1686
Matrix and host fabric supported, Laminar and massive void filling cement, Microcrystalline silica overgrowths
Cryptocrystalline green silica, microcrystalline pore lining cement high Mg calcite
Massive to blocky, friable, conglomeratic, abundant rhyzoliths (8-10cm)
Clast desiccation and cracking, coated buff silc-calc lithoclasts, concentric zonal replacement and void infilling
SOW 10 Sil-calcrete S20.3062 E25.9441
Matrix and host fabric supported, Laminar and massive void filling cement, Microcrystalline silica overgrowths
Dense cryptocrystalline (matrix and clasts)with lensoid microcrystalline crack and void infilling
Laminar massive, rounded silcrete clasts, peripherally layered with elongate silica nodules
Clast desiccation and cracking, coated silcrete lithoclasts, concentric zonal replacement, void infillings and large open voids
SOW 8A Sil-calcrete (LU2 type) S20.54361 E025.85368
Homogeneous cryptocrystalline silica
Cryptocrystalline silica with microcrystalline crack and void infilling
Massive buff siliceous lensoid pan edge nodules terrazzo type
Coated silcrete nodules, void infillings and large open voids
SOW 7A/13 (Silcrete) (LU4 type) S19.8916 E26.1390
Matrix and host fabric supported, Laminar and massive void filling cement, Microcrystalline silica overgrowths
Cryptocrystalline silica and quartz clasts with microcrystalline crack and void infilling
Massive to blocky, friable-partially consolidated abundant rhyzoliths - friable green sand
Clast desiccation and cracking, coated silcrete lithoclasts, nodular, Fe staining, void infillings and large open voids

150
VI.2.8 Discussion and Conclusions Morpho-stratigraphic and geochemical evidence developed in this work imply that both open and
closed basin conditions were prevalent in the MSB throughout the Late Pleistocene mainly as a
result of alternating wet and dry climatic intervals. Events described above imply that early fresh
water episodes which probably resulted from regional wet events were followed by extensive
drying as indicated by freshwater followed by multiple Mg-calcrete dominated phases. Later and
repeated silcretisation appears to have taken as a result of more localised increases in the
groundwater table when the normally saline groundwater was diluted by rain or river inflow.
New evidence suggests three palaeo-lake events in the MSB, two of which precede earlier
recorded wet intervals in Botswana. While the three phases are represented by duricrusted
strandlines at present heights above sea level of 943-945 m , 936 m and 924-910 m, evidence
from TL dates suggests that more than one elevation was occupied at least during the two later
palaeo-lake events. The last major palaeo-lake event recorded here is comparable to existing 14C
dates at c 41 000 BP mainly from the western margin of the MSB (Cooke, 1975; Cooke and
Verstappen, 1984; Shaw and Cooke, 1986, Shaw and Thomas, 1988). The range of strandline
heights with similar dates may result from palaeo-lake levels moving rapidly and frequently
forming transgressive/regressive cycles (Eugster and Maglione, 1978) during sustained drying.
The Late Pleistocene lake margin littoral environment and associated pore water seepage resulted
in morpho-stratigraphic evidence reflecting multi-cyclic geochemical overprinting at all
strandline levels. Early biogenic related calcretisation in Locations 1 and 3 followed the
development of freshwater rhyzoliths in an earlier, open lake system. Later calcretisation events
appear to result from the effect of various controls on calcite dissolution and precipitation in
littoral pore waters during drying phases leading to saturation with respect to calcium and
magnesium ions in the presence of bicarbonate. The ionic content of the major palaeo-lakes is
assumed to have been introduced in solution from the catchment area (cf. McCarthy and Ellery,
1995). Saturation may have been a local, littoral effect induced in part biogenically (by
macrophyte photosynthesis) and probably also by the slow loss of CO2 by degassing (Eugster and
Kelts, 1983). Biogenically and/or climatically induced precipitation took place as pore waters
attained a pH level of >9. Calcite precipitated along with some dolomite as the ultimate nature of
the carbonate phase was controlled by the Mg/Ca ratio of the water (Muller et al., 1972; Folk,
1974; Goudie, 1983). This may have been synchronous with the formation of sepiolite and/or

151
palygorskite which Watts (1980) indicates occurs during or immediately after calcite or dolomite
precipitation. Higher MgO levels were found both in the 943-945 m and lower sequence (936-
911 m) strandlines suggesting that closed basin type evaporative conditions occurred several
times. Calcretisation of littoral sands appears to have been effected as the replacement of pre-
existing silicates such that very low quantities of major elements (relative to the more silicified
units) remain in the calcareous units. The extensive nature of the early calcareous strandline
remnants infers that closed basin conditions were prevalent over long time spans suggesting long
term tectonic stability and consistent drying. At Locations 1 and 3 the biogenic phase appears to
have been followed by nodular (littoral) calcrete formation and is succeeded by major desiccation
intervals, indicated by calcareous silt units in SOW1 and SOW4. The desiccation intervals
suggest extensive drying around the palaeo-lakes following calcretisation.
Intermittent silification of earlier calcrete phases is the most widespread event in the strandline
duricrusts and varies from silicified litho-clasts and nodules in Location 1 to the complete
silicification of already silicified litho-clasts and nodules in Locations 2 and 3. Silicified
duricrust units appear to be related to relatively minor rainfall or inflow events which increased
the level of the groundwater table, maybe forming localised shallow palaeo-lakes. The
geochemistry of the groundwater more closely resembled present day Na-CO3-SO4-Cl type brines.
Silification typically involves a number of mechanisms including mobilisation, transport and
precipitation (Smale, 1973; Summerfield, 1982, 1983b; Chadwick et al., 1987a, 1987b; Thiry et
al., 1988; Borger et al., 2003). Petrographic studies indicate that multiple episodes of
silicification are relatively common in semi-arid areas, particularly in the Kalahari environment
(e.g. Summerfield 1982, 1983c; Arakel et al., 1989; Nash et al., 1994a, 1994b). The inverse
relationships of the major oxides (high CaCO3/low SiO2) normally infers a semi-continuous
process whereby at > pH 9, calcite precipitation takes place thereby lowering the pH and enabling
SiO2 to go into solution in the pore water and begin to occupy interstitial voids and cracks in the
pre-existing duricrust (Gwosdz and Modisi 1983; Ringrose 1996; Nash 1997; Nash and Shaw
1998). However this effect practically discounts the salinity factor which is particularly prevalent
in the warm, shallow littoral zone of semi-arid lakes where declines in near shore lakewater are
associated with groundwater seepage. Recent work Sauer and Straht (2004) shows that in semi-
arid (wet) lacustrine environments enhanced evaporation leads to a lowering of the pH and the
development of a geochemical barrier which leads to the polmerisation and precipitation of silica.
This process also effects the reduction and depletion of the major elements due to intense
leaching while facilitating the concentration of TiO2 (Watts, 1977). Work in Australia shows that

152
most variation in silica concentration is explained by pH and EC values (Lee, 2003). Conclusions
indicate that lower pH and less saline groundwater (pH 2.8-3.99) contains higher concentrations
of dissolved silicon than relatively higher pH (6-7.18) more saline groundwater. Acidic,
moderately saline groundwater is in near equilibrium with respect to amorphous silica whereas
near neutral, saline groundwater corresponds to undersaturated conditions. Hence silica in
various forms may precipitate whenever Si saturation is reached and the required changes in pH
may be inherent in the littoral groundwater and may not necessarily occur as a direct result of
calcite precipitation (cf. Williams et al., 1985; Monger and Adams, 1996). However the two
oxides are co-variant in the MSB which implies that even under different lake water geochemical
conditions the degree (or intensity) of silification varies proportionally with the CaCO3 content
implying preferential replacement of calcite with remobilised silica. Silica appears to enter the
groundwater through the dissolution of quartz grains affected in part by a sloughing-off process.
The sloughed-off silica appears to recrystallise close to the site of dissolution as cryptocrystalline
silica while also forming matrix silica involved in the replacement of calcite clasts. Much of this
process may be enhanced by (inter-alia) diatoms, bacteria and algal growth which are active in Si
uptake in the moist pan littoral. Shaw et al. (1990) and Harrison and Shaw (1995) also describe
almost pure silcrete forming contemporaneously in a hyper-saline pit near Sua Pan by silica
fixing cyanobacteria. Evidence from this work suggests that the abundant silica, often in the form
of silcrete in the MSB is also the result of in situ silica precipitation under acidic, moderately
saline porewater conditions along the pan edges.
Given the evidence presented in this work it is likely that both exogenic (fresh water incurions)
and biogenic agencies were responsible for the extensive silcretisation in the MSB littoral
duricrusts. Silicification episodes appear to post-date early relatively freshwater palaeo-lake
stages (with macrophyte growth) and subsequent calcretisation in multiple stages after palaeo-
lake events as a result of watertable fluctuations in a semi-arid environment similar to that
occurring in Botswana at present (Bhalotra, 1987). The repetition of silica mobilisation through
time may be responsible for prevalent SiO2 increases up-profile. The apparent lack of intense
silica remobilisation at the SOW1 (936 m) level suggests that elevated water table levels
remained for a shorter duration at this height. As generally the similar water table levels (945-
943 m, 924 m, 910 m) were involved in repeated SiO2 re-mobilisation events over the 110 ka
record, it is possible that the MSB was tectonically stable during at least the Late Pleistocene after
initial faulting in the Late Tertiary.

153
Acknowledgements The authors wish to acknowledge financial assistance from the University of Botswana, Research
and Publications Committee (Grant RPC 509). The assistance was given in response to a request
from the local SAFARI2000 committee for funding to consider Botswana palaeo-environments in
the context of global climatic change. Soda Ash Botswana are thanked for allowing access to Sua
Spit.
References. Aitken, M.J., 1985. Thermoluminescence Dating. Academic Press Publishers: London. Alonso-Zarza, A.M., Sanchez-Moya, Y., Bustillo, M.A., Sopena, A., Delgado, A., 2002. Silification
and dolomitization of anhydrite nodules in argillaceous terrestrial deposits: an example of meteoric-dominated diagenesis from the Triassic of central Spain. Sedimentology, 49, 303-317.
Arakel, A.U., Jacobson, G., Salehi, M., Hill, C.M., 1989. Silicification of calcrete in palaeodrainage basins in the Australian arid zone. Aust J. Earth Sci., 36, 73-89.
Baillieul, T.A., 1979. A reconnaisance survey of the cover sands in the Republic of Botswana. J. Sediment. Petrol., 45,494-503.
Bhalotra, Y.P.R., 1987. Climate of Botswana, Part II: elements of climate, rainfall. Department of Meteorological Services, Ministry of Works and Communication, Gaborone, Botswana, 21pp.
Blumel, W.D., Eitel, B., Lang, A., 1998. Dunes in southeastern Namibia: evidence for Holocene environmental changes in the southwestern Kalahari based on thermoluminesence data, Palaeogeogr:, Palaeoclimatol., Palaeoecol., 138, 139-149.
Borger, H., McFarlane, M.J. Ringrose, S., 2004. Processes of silicate karstification associated with pan formation in the Darwin-Koolpinya area of northern Australia. Earth Surf. Proc. Landf., 29,359:371.
Botter-Jensen L, Duller G.T., 1992. A New System for Measuring Optically Stimulated Luminescence from Quaternary Samples. Nucl. Tracks and Radiation Meas,. 20, 202-205.
Brook, G.A., Cowart, J.B, Brandt, S.A., 1998. Comparison of Quaternary environmental change in eastern and southern Africa using cave speleotherm, tufa and rock shelter sediment data. In:Alsharan, A, Glennie, K.W.Wintle, G.L.Kendall, G.C. (Eds) Quaternary Deserts and Climate Change,. Balkema, Rotterdam, pp.239-250.
Butzer, K.W., 1984. Archeogeology and Quaternary environment in the interior of southern Africa. In Southern African Prehistory and Paleoenvironments, Chapter 1, Klein R.G., Balkema, A.A. (eds). Rotterdam, pp. 1-64.
Carl, C., 1987. Investigations of U series disequilibria as a means to study the transport mechanism of uranium in sandstone samples during weathering. Uranium 3, 285-305.
Chadwick, O.A., Hendricks, D.M., Nettleton, W.D., 1987a. Silica in duric soils: I a depositional model. Soil Sci. Soc. Amer. J., 51, 975-982.
Chadwick, O.A., Hendricks, D.M., Nettleton, W.D., 1987b. Silica in duric soils: II Minerology. Soil Sci. Soc. Amer. J., 51, 982-985.
Cooke H.J., 1975. The paleoclimatic significance of caves and adjacent landforms in the Kalahari of western Ngamiland, Botswana. Geog. J., 141, 430-444.
Cooke H.J., 1979. The origin of the Makgadikgadi Pans. Bots. Notes Records 11, 37-42. Cooke H.J., 1980. Landform evolution in the context of climatic changes and neotectonics in the
middle Kalahari of north-central Botswana. Trans. Inst. Brit. Geog., NS 5, 80-99.
154
Cooke H.J., Verstappen H.Th., 1984. The landforms of the western Makgadikgadi basin in northern Botswana, with consideration of the chronology of the evolution of Lake Palaeo-Makgadikgadi. Zeit. Geomorph., N.F.Bd28, Heft 1, 1-19.
Du Toit, A.L., 1933. Crustal movements as a factor in the evolution of South Africa, South Afric., J. Sci., 24, 88-101.
Eugster, H.P., Hardie, L.A., 1978. Saline Lakes, In: Lerman (Ed.) Chemistry, Geology and Physics of Lakes, Springer-Verlag, New York, pp. 273-293.
Eugster, H.P., Maglione, G., 1979, Brines and evaporites of the Lake Chad basin, Africa. Geochim. Cosmochim. Acta, 43, 973-981.
Eugster, H.P., Kelts, K., 1983. Lacustrine chemical sediments In: Goudie, A.G. and Pye, K., Chemical sediments and geomorphology: precipitates and residua in the near surface environment. London, Academic Press, pp.321-368.
Folk, R.L., 1974. The natural history of crystalline calcium carbonate: effect of magnesium content and salinity. J. Sediment. Petrol., 44, 40-53.
Geological Survey of Botswana, 2000. Geological Map of the Republic of Botswana (digital edition). Geological Survey of Botswana, Lobatse, Botswana.
Goudie A.S., 1983. Calcrete, In Chemical Sediments and Geomorphology: Precipitates and Residua in the near-surface environment, Goudie AG, Pye, K (eds). Academic Press Inc. Publishers, London
Gumbricht, T., McCarthy, T.S. Merry, C.L. 2001. The topography of the Okavango Delta Botswana, and its tectonic and sedimentological implications, South Afric. J. Geol., 104, 243-264
Gwosdz W., Modisi, M.P., 1983. The Carbonate Resources of Botswana. Botswana Geological Survey Mineral Resources Report 6, Lobatse, Botswana, 48pp.
Harrison, C.C. Shaw, P.A., 1995. Bacterial involvement in the production of silcretes? Bulletin Institut Oceanographique, Monaco, 14, 291-295.
Holmgren K., Karlen, W, Shaw, P., 1995 Palaeoclimatic significance of the stable isotopic composition and petrology of a late Pleistocene stalagmite from Botswana, Quat. Res., 43, 320-328.
Huaya L., Xiaoyong, W., Haizhou, M., Hongbing, T., Vandenberghe, J., Xiaodong, M., Zhen, L., Youbin, S., Zhisheng, A., Guangchao, C., 2004. The plateau monsoon variation during the past 130 kyr revealed by loess deposit at northeast Qinghai-Tibet, Global and Planetary Change, 41, 207-214.
Klappa C.F., 1980. Rhzyoliths in terrestrial carbonates: classification, recognition, genesis and significance. Sedimentology, 27, 613-629.
Krumbein, W.C., Garrels, R.M., 1952. Origin and classification of chemical sediments in terms of pH and oxidation-reduction potentials. J. Geol., 60, 1-33.
Lancaster, N., 1981. Palaeoenvironmental implications of fixed dune systems in southern Africa, Palaeogeogr:, Palaeoclimatol., Palaeoecol., 33,327-346.
Lancaster, N., 2000. Aeolian deposits. In Partridge T.C. and Maud R.R., (eds) The Cenozoic of Southern Africa, New York, Oxford University Press, 73-84.
Lee, S. 2003. Groundwater geochemistry and associated hardpans in southwestern Australia, In: Roach I.C. (ed) Advances in Regolith, CRC LEME, Curtin University of Technology, Western Australia, pp. 254-258.
Mallick, D.I.J, Habgood F, Skinner AC. 1981. A geological interpretation of Landsat imagery and air photography of Botswana. Overseas Geological and Mineral Resources, London, 56, 1-36.
McCarthy, T.S., Ellery, W.N., 1995. Sedimentation on the distal reaches of the Okavango fan, Botswana, and its bearing on calcrete and silcrete (ganister) formation, J. Sediment. Res, A65(1), 77-90.
155
Modisi, M.P., Atekwana, E.A., Kampunzu, A.B. Ngwisanyi, T.H., 2000. Rift kinematics during the incipient stages of continental expansion: Evidence from the nascent Okavango rift basin, northwest Botswana, Geol., 28, 939-942.
Monger, H.C., Daugherty, L.A., 1991b. Pressure solution: Possible mechanism for silicate grain dissolution in a petrocalcic horizon, Soil Sci. Soc. Amer. J., 55, 1625-1629
Monger, H.C. Adams, H. P., 1996, Micromorphology of calcite-silica deposits. Soil Sci. Soc. Amer. J., 60:519-530.
Moore A. E., Larkin, P. 2001. Drainage evolution in south-central Africa since the breakup of Gondwana. South Afric. J. Geol., 104, 47-68.
Muller, G., Irion, G., Forstner, U., 1972. Formation and diagensis of inorganic Ca-Mg carbonates in a lacustrine environment. Naturwissenschaften, 59 Jg 4, 158-164.
Nash D. J., 1997. Groundwater as a geomorphic agent in drylands. In Arid Zone Geomorphology: Process, Form and Change in Drylands, Thomas, D.S.G (Ed.). John Wiley Publishers, Chichester.
Nash D.J., Thomas D.S.G. Shaw P.A., 1994a. Siliceous duricrusts as palaeoclimatic indicators: evidence from the Kalahari desert of Botswana. Palaeogeogr:, Palaeoclimatol., Palaeoecol., 112, 279-295.
Nash D.J., Shaw P.A., Thomas D.S.G., 1994b. Duricrust development and valley evolution: process-landform links in the Kalahari. Earth Surf. Proc.Landf., 19, 279-317.
Nash D. J., Shaw P.A., 1998. Silica and carbonate relationships in silcrete-calcrete intergrade duricrusts from the Kalahari desert of Botswana and Namibia. J. Afric. Earth Sci. 27, 11-25.
Partridge, T.C., Demenocal, P., Lorentz, S.A., Paiker, M. J., Vogel, J.C., 1997. Orbital forcing of climate over South Africa: a 200,000-year rainfall record from Pretoria Salt Pan. Quat. Sci. Rev., 16, 1125-1133.
Partridge, T.C., Scott, L., Hamilton, J.E., 1999. Synthetic reconstructions of southern African environments during the Last Glacial Maximum (21-28 kyr) and the Holocene Altithermal, (8-6 kyr). Quat. Inter., 57/58, 207-214.
Partridge, T.C., Maud, R.R., 2000. The Cenozoic of southern Africa. New York: Oxford University Press, 406 pp.
Petit, J.R. 1999. Climate and atmospheric history of the past 420 000 years from the Vostock ice core, Antarctica. Nature 399:429-436.
Radtke, U., Janotta, A., Hilgers, A., Murray, A., 1999. The potential of OSL and TL for dating late-glacial and Holocene dune sands tested with independent age controls of the Laacher See tephra (12, 880a) at the section Mainz-Gonsenheim, 9th International Conference on Luminescence and ESR dating (LED99), Rome.
Republic of Botswana, 2000. Makgadikgadi Pans Development Plan, National Conservation Strategy Implementing Agency, Gaborone, Botswana, 211pp.
Ringrose, S., 1996. The geomorphological context of calcrete depositions in the Dalmore Downs area, Northern Territory Australia, J. Arid Environ 33, 291-307.
Ringrose, S., Downey, B., Genecke, D., Sefe, F., Vink, B., 1999a. Nature of calcareous deposits in the western Makgadikgadi basin, Botswana, J. Arid Environ, 43, 375-397.
Ringrose, S, Lesolle, D, Botshoma, T., Gopolang, B, Vanderpost, C., Matheson, W., 1999b. An analysis of vegetation cover components in relation to climatic trends along the Botswana Kalahari Transect. Bots. Notes Records, 31, 33-52.
Ringrose, S, Kampunzu, A.B., Vink, B., Matheson, W., Downey, W., 2002a. Origin and palaeo-environments of calcareous sediments in the Moshaweng dry valley, southeast Botswana. Earth Surf. Proc. Landf., 27, 591-611.
Ringrose, S., Huntsman-Mapila, P., Kampunzu, A.R., Matheson, W., Downey, W.S., Vink, B., 2002b. Geomorphological evidence for MOZ palaeo-wetlands in northern Botswana; implications for wetland change. Presentation to Monitoring of Tropical and Sub-

156
tropical Wetlands Conference, December 2002, Maun, Botswana, Published by HOORC and the University of Florida, Centre for Wetlands.
Rust U., Schmidt H., Dietz K., 1984. Palaeoenvironments of the present day arid southwestern Africa 30 000-50 000BP: results and problems. Palaeoecol. Africa 16, 109-148.
Sauer D., Straht K., 2004 Formation of calcretes and silcretes in the Alentejo (Portugal) and consequences for the landscape, ecosystems and land use. http://www.bodenkunde.ini-freiburg.de/eurosoil/abstracts/id256_Sauer.pdf.
SAFARI2000 website. 2000. http://www.safari.gecp.virginia.edu Scott L., 1993. Palynological evidence for late Quaternary warming episodes in Southern Africa.
Palaeogeogr., Palaeoclimatol., Palaeoecol., 101, 229-235. Shaw, P.A., 1985. Late Quaternary landforms and environmental change in northwest Botswana; the
evidence of Lake Ngami and the Mababe Depression. Trans. Inst. Brit. Geog., NS10, 333-346.
Shaw P., Cooke, H.J., 1986. Geomorphic evidence for the late Quaternary palaeoclimates of the middle Kalahari of northern Botswana. Catena. 13, 349-359.
Shaw P.A., Thomas, D.S.G., 1988. Lake Caprivi: a late Quaternary link between the Zambezi and middle Kalahari drainage systems. Zeit. Geomorph., 32, 329-337.
Shaw, P.A., Cooke, H.J., Perry, C.C., 1990. Microbalitic silcretes in highly alkaline environments: some observations from Sua Pan, Botswana. South Afric. J. Geol., 93:5/6, 803-808.
Shaw P.A, Stokes S, Thomas D.S.G., Davies F., Holmgren K., 1997. Palaeoecology and age of a Quaternary high level lake in the Makgadikgadi basin of the middle Kalahari. South Afric. J. Sci., 93, 273-277.
Smale. D., 1973. Silcretes and associated silica diagenesis in southern Africa and Australia. J. Sediment. Petrol., 43, 1077-1089.
Smith, R.A., 1984, Lithostratigraphy of the Karoo stratigraphy in Botswana, Botswana Geological Survey Bulletin, Lobatse, Botswana, 26, 34pp.
Stokes, S., Thomas D.S.G., Washington R., 1997. Multiple episodes of aridity in southern Africa since the last interglacial period. Nature 388, 154-158.
Summerfield, M. A., 1982. Distribution, nature and probable genesis of silcrete in arid and semi-arid southern Africa. In Aridic Soils and Geomorphic Processes. Yalon, DH (Ed). Catena Supplement 1, 37-65.
Summerfield M. A., 1983a. Silcrete as a palaeoclimatic indicator: evidence from southern Africa. Palaeogeogr., Palaeoclimatol., Palaeoecol., 41, 65-79.
Summerfield M. A., 1983b. Silcrete. In: Chemical Sediments and Geomorphology. Goudie, AS, Pye K (eds). Academic Press Publishers: London, pp. 19-91.
Summerfield, M. A., 1983c. Petrography and diagenesis of silcrete from the Kalahari basin and Cape coastal zone, southern Africa, J. Sediment. Petrol., 53, 895-909.
Thomas D.S.G., Shaw, P.A., 1991. The Kalahari Environment. Cambridge University Press Publishers: Cambridge, 248pp.
Thomas D.S.G., Shaw P.A. 1993. The evolution and characteristics of the Kalahari, southern Africa. J. Arid Environ. 25, 97-108.
Thomas D.S.G., Shaw, P.A. 2002. Late Quaternary environmental change in central southern Africa: new data, synthesis, issues and prospects, Quat. Sci. Rev., 21, 783-797.
Tyson, P.D. Fuchs, R., Fu, C, Lebel, L., Mitra, A.P. Odada, E, Perry, J., Steffen, W., Virji, H., (Eds) 2002, Global-Regional Linkages in the Earth System, START, Springer-Verlag, New York, 198pp.
Thiry, M., Ayrault, M.B., Grisoni, J., 1988. Ground water silicification and leaching in sands, example of the Fontainebleau Sand in the Paris Basin, Bull. Geol. Soc. Amer., 100, 1283-1290.
Tiercelin, J.J., Lezzar, K.E, 2002. A 300 million year history of rift lakes in Central and east Africa: an updated broad review. In: The East African Great Lakes, Limnology,

157
Palaeolimnology, and Biodiversity, (eds) E.O. Odada and D.O. Olago, Kluwer Academic Publishers, Dordrecht, pp. 3-60.
Vink, B., Ringrose, S., Kampunzu, A.R., 2001. The presence of magadiite and kenyaite in Sua pan, Central Botswana. Bots. J. Earth Sci., 5, 32-34.
Walker T.R., 1960. Carbonate replacement of detrital crystalline silicate minerals as a source of authigenic minerals in sedimentary rocks. Bull. Geol. Soc. Amer., 71, 145-152.
Watts N.L., 1980. Quaternary pedogenic calcretes from the Kalahari (southern Africa): mineralogy, genesis and diagenesis. Sedimentology 27, 661-686.
Watts S.H. 1970. Major element geochemistry of silcrete from a portion of inland Australia. Geochim. Cosmochim. Acta, 41, 1164-1167.
Williams, L.A., Parks, G.A., Crear, D.A., 1985. Silica diagenesis 1. Solubility controls. Journ Sed. Petrol. 55,301-311.
Wright V.P., Tucker ME., 1991. (Eds) Calcretes, Reprint Series Volume 2 of the International Association of Sedimentologists. Blackwell Scientific Publications, London, 352 pp.
Zoller L, Pernicka E. 1989. A note on overcounting in alpha-counters and its elimination. Ancient TL 7, 11-14.

158
VII. USE OF THE GEOCHEMICAL AND BIOLOGICAL SEDIMENTARY RECORD IN ESTABLISHING PALAEO-ENVIRONMENTS AND CLIMATE CHANGE IN THE LAKE NGAMI BASIN, NW BOTSWANA
VII.1. Enregistrement sédimentaire des variations du niveau du lac Ngami au Pléistocène supérieur et à l’Holocène Résumé de l’article Les sediments d’un profil de 4.6 m dans le lac asséché de Ngami dans le Nord-ouest du Botswana
ont été analysés: mesures géochimiques (elements majeurs et trace) et datations (14C et TL).
Certains niveaux du profil sont riches en diatomées et ont été utilisés comme indicateurs des
hauts et bas niveaux du lac. Les sédiments du Lac Ngami ont une teneur élevée en SiO2 (51 –
92.5 wt.%, avg. 72.4 wt.%) et des teneurs variables en Al2O3 (2.04 – 17.2 wt.%, avg. = 8.88
wt.%). Des concentrations élevées en Al2O3 et en matière organique (LOIorgC) indiquent que les
conditions physico-chimiques dans le lac étaient stables de 42 ka jusqu’à 40 ka. La presence de
diatomées suggère un milieu peu profond et saumâtre. A 40 ka, l’enregistrement par les sédiments
lacustres s’arrête, peut-être à cause de l’activité tectonique. A 19 ka des conditions aérobie et
turbulentes dominaient et le niveau du lac était a son maximum jusqu’à 17 ka. Les résultats
d’analyse des terres rares, indiquent que des conditions alcalines prévalaient à 12 ka. La presence
de diatomées suggère également un niveau peu profond pour cette période. L’augmentation du
rapport Sr/Ca, la diminution du LOIorgC et de Al2O3 durant la periode de 16 ka à 5 ka suggèrent un
écoulement moindre dans le bassin et une diminution du niveau de lacustre. Ces conditions ont
été maintenues par les pluies locales car la région a connu une période plus humide entre 16 et 11
ka. Ensuite, le niveau du lac a crû rapidement en quatre mille ans, probablement en réponse à de
plus fortes précipitations en Angola. Ces resultats indiquent que les niveaux du lac Ngami sont
lies à des changements de regime de precipitation en Angola et localement. Ces résultats
confirment que l’actuel déphasage entre l’Afrique du sud et les region équatoriale d’Afrique
existait au cours du Quaternaire supérieur à la hauteur des hauts-plateaux de l’Angola et du nord-
ouest du Botswana.

159
VII.2 Use of the geochemical and biological sedimentary record in establishing
palaeo-environments and climate change in the Lake Ngami basin, NW Botswana
P. Huntsman-Mapilaa,b*, S. Ringrosea, A.W. Mackayc, W.S. Downeyd, M. Modisie, S. H.
Coetzeed, J-J Tiercelinb, A.B. Kampunzue, C. Vanderposta
aHarry Oppenheimer Okavango Research Centre, University of Botswana, Private Bag 285, Maun, Botswana bUMR-CNRS 6538, Institut Universitaire Européen de la Mer, 29280, Plouzané, France c Environmental Change Research Centre, Department of Geography, University College London, 26 Bedford Way, London, WC1H 0AP, United Kingdom
d Physics Department, University of Botswana, Private Bag 0022 Gaborone, Botswana eGeology Department, University of Botswana, Private Bag 0022, Gaborone, Botswana
Article published by Quaternary International 148 (2006) 51-64
Abstract
Sediment samples from a 4.6 m profile in the dry bed of Lake Ngami in NW Botswana were
analysed for geochemistry and dated using both 14C and TL methods. Certain units in the profile
were found to be diatom rich and these, with the geochemical results, were used as indicators of
high and low lake levels within the basin. The Lake Ngami sediments contain a high proportion
of SiO2 (51-92.5 wt.%, avg. 72.4 wt.%) and variable levels of Al2O3 (2.04-17.2 wt.%, avg. 8.88
wt.%). Based on elevated Al2O3 and organic matter (LOIorgC ) results, lacustrine conditions
occurred at c. 42 ka until 40 ka and diatom results suggest that relatively deep but brackish
conditions prevailed. At 40 ka, the lacustrine sedimentary record was terminated abruptly,
possibly by tectonic activity. At ca.19 ka, shallow, aerobic, turbulent conditions were prevalent,
but lake levels were at this time increasing to deeper water conditions up until c. 17 ka. This
period coincides with the Late Glacial Maximum, a period of increased aridity in the central
southern Africa region. Generally, increasing Sr/Ca ratios and decreasing LOIorgC and Al2O3, from
c. 16 ka to 5 ka, suggest decreasing inflow into the basin and declining lake levels. Based on the
enrichment of LREE results, slightly alkaline conditions prevailed at c. 12 ka. Diatom results also
support shallow alkaline conditions around this time. These lake conditions were maintained
primarily by local rainfall input as the region experienced a warmer, wetter phase between 16 –

160
11 ka. Lake levels rose rapidly by 4 ka, probably in response to enhanced rainfall in the Angolan
catchment. These results indicate that lake levels in the Lake Ngami basin are responding to
rainfall changes in the Angolan catchment area and local rainfall. The results confirm that the
present day anti-phase rainfall relationship between southern Africa and regions of equatorial
Africa was extant during the late Quaternary over the Angolan highlands and NW Botswana.
VII.2.1 Introduction
The geochemistry of sediments reflects a combination of provenance, chemical weathering,
hydraulic sorting, abrasion, redox condition and diagenesis (Taylor and McLennan, 1985;
Condie, 1993). Lake deposits provide a continuous record of environmental changes which record
climatic, hydrologic, sedimentological, tectonic, geochemical, biological and biochemical
conditions. The focus of this study is the currently dry Lake Ngami, a 3000 km2 basin at the
distal reaches of the Okavango Delta (Shaw et al., 2003). The Okavango Delta in north-west
Botswana is an unstable hydrological system and change to this system is assumed to take place
along five major pathways. These are characterised in terms of their driving agents as, climatic
(with inputs of rainfall and solar energy); geological (neotectonic inputs); hydrological (surface
and sub-surface water inputs); vegetational-geomorphological (channel blockages, island-
floodplain building inputs); zoological (wildlife inputs) and human induced (fire and land-use
change inputs) (McCarthy and Ellery 1993, Gieske 1996, McCarthy et al, 1998a and 1998b,
Government of Botswana 2002, Ringrose et al., 2003).
Nicholson and Entekhabi (1986) report an inverse correlation between annual rainfall over
southern Africa and parts of equatorial Africa for the period of meteorological record. Tyson et
al., (2002a) compare data from lake sediments in Lake Naivasha in Kenya and a stalagmite record
from Cold Air cave in Makapansgat valley in South Africa over the past 1,100 years. They report
that during drier, cool periods in Lake Naivasha, conditions were warmer and wetter at
Makapansgat. Conversely, cool dry conditions at Makapansgat correspond to periods of high lake
levels at Naivasha.
Given the contrasting controls of weather in the equatorial region and subtropical Africa, inverse
links between climates of the Angolan Highland catchment and the Lake Ngami basin may be
expected. With future climate change scenarios (in particular, rainfall), there is often a
discrepancy between the models and how well the models represent the present day climate.
However, the model of change in wet season (December- February) precipitation from 1960-1990

161
to 2070-2100 (HadCM2 IS92a) developed by the Hadley Centre
(http://www.metoffice.com/research/hadleycentre/models) shows an anti-phase effect in
precipitation where a net decrease in precipitation for this period is shown for central southern
Africa and an increase for tropical Africa, including the Angolan highlands.
The goals of this paper are: 1) to describe and interpret the Quaternary sediments deposited in the
Lake Ngami basin, 2) to document climate-related changes in the sediment and 3) to indicate
tectonically induced shifts in sedimentation patterns.
VII.2.2. Local setting and climate
The Okavango River which drains from the Angolan highlands, enters the Makgadikgadi-
Okavango-Zambezi (MOZ) rift depression (Ringrose et al., 2005), through a narrow NW-SE-
trending swamp called the Panhandle before extending into a large inland alluvial fan (McCarthy
et al., 2000). Lake Ngami (Figure VII-1) is a depression at the distal end of the Okavango Delta,
laterally linked by a network of low gradient channels to the Makgadikgadi and Mababe
depressions.

162
Figure VII 1. Okavango Delta in NW Botswana showing Lake Ngami to the south-west.

163
Flooding in the Okavango Delta is influenced by local rainfall and in-flow from the catchment in
the Angolan highlands. Under the current climatic conditions, rainfall over the Okavango Delta is
influenced by the anticyclonic conditions that dominate the interior of southern Africa and
rainfall patterns are subject to an 18 year oscillation. The Angolan catchment climate is currently
more strongly influenced by the Inter-Tropical Convergence Zone (ITCZ) and the Congo Air
Boundary (CAB). The Okavango River derives its water from two major tributaries, the Cubango
in the west and the Cuito in the east. The Cubango River responds to variability in the Atlantic
equatorial westerlies and the Cuito River responds to tropical lows in the Indian Ocean easterlies.
Rainfall over the Cubango catchment shows a quasi-18-year rainfall oscillation which is out of
phase with that of central southern Africa (McCarthy et al., 2000).
Fluvio-lacustrine deposition in northern Botswana has predominantly occurred within a large
structural depression formed by a southwesterly propagating extension of the East African rift
system. This depression was drained and filled periodically by south easterly flowing rivers
during the Tertiary and Pleistocene as the area was faulted and half grabens developed (Cooke,
1980; Mallick et al., 1981; Modisi et al., 2000). The MOZ depression is controlled by a series of
NE-SW normal faults related to incipient rifting which reactivated Proterozoic and Karoo
structures (Ballieul, 1979; Smith, 1984; Modisi et al., 2000). Tectonic activity along the same
trend resulted in the uplift along the Zimbabwe-Kalahari axis possibly during the late Pliocene-
early Pleistocene (Partridge and Maud, 2000, Moore and Larkin, 2001) causing the impoundment
of proto Okavango, Kwando and upper Zambezi drainage and the development of the
Makgadikgadi, Ngami and Mababe sub-basins (Cooke, 1980; Ringrose et al., 2005).
VII.2.3. Previous work on climate change and lake levels
VII.2.3 1. Regional palaeo-environmental studies
Climate forcing due to changes in the eccentricity of the earths orbit (Milankovitch cycles) and to
the precession of the equinoxes have both been evident in southern Africa during the late
Quaternary (Tyson and Preston-Whyte, 2000). Based on oxygen isotope temperatures from deep
sea sediment cores, cycles with periods of about 100 000 years, 43 000 years, 24 000 years and
19 000 years have been identified (Imbrie et al., 1984). During perihelion conditions, wetter

164
summers prevail as the meridional temperature gradient between the equator and the South Pole
strengthens as does the ITCZ (Tyson and Preston-Whyte, 2000). The 23 000 year cycles have
been detected in the granulometric analysis of the sediments in a 90 m core taken from the
Tswaing impact crater lake (formerly the Pretoria Saltpan) in the northern South Africa. The
proxy rainfall series indicate five major rainfall intervals occurring between 100 ka and 200 ka
with less well developed peaks occurring over the past 100 ka (Partridge et al., 1997).
Tyson and Preston-Whyte (2000) cite evidence for a warm period in southern Africa during the
Last Interglacial at 125 ka and a short period of cooling during the Pleniglacial at about 75 ka.
The Inter-Pleniglacial from 65 to 25 ka was a long period of cooler conditions that changed just
before the start of the Last Glacial Maximum (LGM) at c. 21 ka. A minimum of less than 40% of
present mean annual rainfall was experienced over the Kalahari during this time (Partridge et al.,
1997). Between 16 ka and 11 ka a rapid increase of temperature occurred in southern Africa.
Across much of the sub-continent the temperature rise seems to have been accompanied by
increased moisture supply, as in the Kalahari (Shaw and Cooke, 1986).
During the Holocene Altithermal between 7 and 4.5 ka, the currently semi-arid western interior of
southern Africa, which includes the Lake Ngami basin, received between 10-20 % more
precipitation than the current mean annual precipitation for the region (Partridge et al., 1997). A
regional high-resolution record from the middle Holocene (6.6 ka) to the present is the stable
isotope record for the Cold Air Cave in the Makapangsgat Valley in northern South Africa
(Repinski et al., 1999). A number of events are apparent in the δ18O record. The first is the end of
the warm Holocene altithermal until just after 6 ka BP. Warmer conditions occurred again at
around 4 ka and 2.2 ka. Five centuries of cooling associated with the Little Ice Age from A.D.
1300 to 1800 were also recorded.
VII.2.3.2. Palaeo-environmental studies conducted in the MOZ Basin
Sedimentological and geochemical evidence suggests that the Okavango Delta has expanded and
contracted over the past 400,000 years and the region may have been subject to extensive
flooding prior to 110 ka, 80-90 ka and 41-43 ka (Ringrose et al., 2005). Past levels of palaeo-
Lake Tsodilo, in northwestern Botswana are a reflection of direct local precipitation as channels
do not drain into the basin (Thomas et al., 2002). Mollusc remains found in palaeo-Lake Tsodilo,
165
suggest that permanent deep water occurred from 40-32 ka and diatom evidence suggests that
from 36-32 ka the lake became more eutrophic and seasonal. In addition, dune construction
around Tsodilo, probably associated with drier and windier climatic conditions occurred at 36-28
ka. Lacustrine conditions occurred in palaeo-Lake Tsodilo from 27-22 and 19-12 ka (Thomas et
al., 2002). It is possible that the period between 22 and 19 ka may indicate a drying period in the
region which coincides with the LGM in southern Africa (Partridge et al., 1999; Thomas et al.,
2002).
Diatomite beds in Lake Ngami were first reported in the Southern Okavango Intergrated Water
Development Phase 1 final report (SMEC, 1987) covering an area of approximately 30km2 over
the eastern portion of the basin. A study of lake Ngami shorelines, diatoms and Holocene
sediments conducted by Shaw et al. (2003) suggested an extensive and slightly alkaline lake at 11
ka. They suggest that lake levels rose between 4 and 3 ka and conclude that this increase in lake
levels must represent increase flow from the Okavango Delta and a more humid climate at least in
the region of the rivers headstreams in Angola. In addition, Shaw et al. (2003) investigate diatoms
at six sites in Lake Ngami. They report that the diatom taxa in the lake contrast with the Eunotia
dominated acid pH taxa of the present day Okavango system reported in Ellery (1987). Robbins
et al., (1998) based on archaeological investigations near Toteng, further suggested that a deep
lake existed around 4 ka after which lake levels fell slightly between 3.8 and 2.4 ka (Figure VII-
2).

166
Figure VII 2. Satellite image of the Lake Ngami basin depicting the location of sampling site Ng-02, shoreline features and the faultscarp bounding the lake to the south.

167
Shaw (1985) reported that, based on documentary records, Lake Ngami was still a substantial
lake in the 1850s but was becoming seasonal and by 1880 became a closed lake when inflow
from the Thaoge channel ended. Inflow through the Kunyere was also significant, based on the
presence of extensive diatom beds near Toteng (SMEC, 1987). Having been dry since 1989, Lake
Ngami received water through the Kunyere in 2004. Prior to this, satellite imagery shows that
1984 and 1989 were the last two years with substantial water in the lake. These two years and
2004 correspond to the highest Okavango Delta inflow at Mohembo between 1981 and 2004 (P.
Wolski, pers. comm.), suggesting that the lake is an integral part of the Okavango system.
VII.2.4. Sampling and analytical procedures
Field work took place between 2003 and 2004. A topographic profile across the lake bed was
conducted using a Trimble 4700 Differential GPS to determine the elevation of the pit (Ng-02)
and related lake basin and shoreline features. GPS points were corrected to benchmark BPS274
with an elevation of 926.550 masl. Sediments from a 4.6 m pit (Ng-02) dug into the lake bed
(Figure VII-2) were collected at 10cm intervals to give 46 samples. Dried subsamples were used
for the analysis of major, trace and rare earth elements (REE), loss on ignition (LOI) and S.
Major, trace and REE analyses were performed at Chemex Laboratories in Canada. Major
elements were determined using ICP-AES. Trace and rare earth elements were analysed using
ICP-MS (detection limits generally between 0.1 and 0.5 ppm) with the exception of Cr, Ni and Pb
that were determined by flame AAS (detection limits 1 ppm). Total S was measured at the
HOORC Environmental Laboratory on 300 mg samples by combustion and infrared absorption
spectrometry using a Leco S-144DR sulphur analyser. The organic and carbonate contents were
estimated from weight loss on ignition (LOI) at 550oC (LOIorgC) and 950oC (LOIinorgC)
respectively. For all geochemical data, the significance of correlation was tested using the two
sided test at a 95% confidence limit (Rollinson, 1993).
Three samples were dated at the University of Botswana using thermo-luminescence (TL)
techniques (Aitken, 1985) after protecting the samples from exposure to sunlight. It was assumed
that the samples had undergone total bleaching in a shallow water environment before deposition.
TL was used because it provided reliable dates in the past (Blumel et al., 1998; Ringrose et al., 2002)
and literature sources suggest a degree of comparability between TL and OSL (Optically Stimulated

168
Luminescence) (e.g. Radtke et al., 1999, Huaya et al., 2004). Alpha counting was carried out on a
portion of the whole sample using an Elsec 7286 (Low Level Alpha Counter) to determine
abundances of Uranium and Thorium (ppm) and a Corning 410 Flame Photometer to determine
Potassium weight percentage (Table VII-1). Carbonates and iron staining was removed using
hydrochloric acid and organic matter using hydrogen peroxide. TL values were determined using
a Riso D12 reader. The environmental dose rate was determined by a low level alpha counter (Elsec
7286) using a 42 mm ZnS screen (Zoller and Pernicka, 1989). The values shown assume secular
equilibrium for both U and Th chains (Carl, 1987). Uncertainty levels (Table VII-2) represent one
standard deviation. The cosmic dose was calculated taking into consideration depth of burial,
overburden density and porosity, sample co-ordinates and altitude.
AMS 14C dating was conducted at Poznan Laboratory in Poland. The samples were mechanically
cleaned under binocular microscope to remove root fragments. The
datable pieces of sample were collected, rinsed with 4% HCl (room temperature), 0.5M NaOH
(60°C) and again 4% HCl (room temperature) to remove all traces of carbonates in the samples.
The combustion to CO2 was performed in a closed quartz tube together with CuO and Ag wool to
900°C. The sample CO2 was then reduced with H2 over approximately 2 mg of Fe powder as a
catalyst, and the resulting carbon/iron mixture is pressed into a pellet in the target holder (Czernik
and Goslar, 2001). The 14C concentration of the samples was measured with a National
Electrostatics Corporation "Compact Carbon AMS" spectrometer by comparing the
simultaneously collected 14C, 13C and 12C beams of each sample with those of oxalic acid
standard, CO2 and coal background material (Goslar et al., 2004). Conventional 14C ages were
calculated with a δ13C correction for isotopic fractionation (Stuiver and Polach, 1977) based on
the 13C/12C ratio measured by the AMS-system simultaneously with the 14C/12C ratio. As this δ13C
includes the effects of fractionation during graphitisation in the AMS-system and, therefore,
cannot be compared with δ13C values obtained per mass spectrometer on CO2. For the
determination of the measurement uncertainty (standard deviation) both the counting statistics of
the 14C measurement and the variability of the interval results that, together, make up one
measurement were observed. The larger of the two was adopted as the measurement uncertainty.
To this the uncertainty connected with the subtraction of the background was added. The quoted
1-sigma error is thus the best estimate for the full measurement and not just based on counting
statistics.

169
ESEM analysis was undertaken at the University of Botswana using a Philips XL30
environmental scanning electron microscope to obtain micro-textural information and to make
critical taxonomic identifications on some of the main diatom species found in the sediments. An
in-depth quantitative investigation of diatom changes in the lake is currently being prepared, but
here we report briefly on summary, qualitative diatom composition of several samples spanning
the length of the stratigraphic sequence. This information is useful because species composition
can further highlight relative changes in lake chemistry associated with prevailing climatic
conditions (Mackay et al., 2003) and diatoms have shown to be particularly useful proxies in
African lakes (Gasse et al., 1997; Stager et al., 1997). Sediment samples were prepared according
to standard laboratory procedures (Battarbee et al., 2001) and examined at high magnification
(x1000) using oil-immersion light microscopy with phase contrast. Taxa were identified using a
range of diatom flora, especially those of African lakes (e.g. Gasse, 1986) and oligotrophic,
temperate lakes (e.g. Krammer & Lange-Bertalot, 1986-1991).

170
Table VII 1. Data inputs for TL. Sample Ng-02 T220 Ng-02 T380 Ng-02 T440
Equivalent Dose (Gy)
32.59±0.48 33.57±1.64 73.89±2.29
Diameter of grains (um)
107±17 107±17 107±17
Density of quartz grains g.cm-3
2.65 2.65 2.65
Sediment U ppm 3.68±0.25 0.73±0.06 2.83±0.19Sediment Th ppm 9.62±0.0.82 1.18±0.0..18 5.90±0.62K wt% 1.22±.03 0.64±.03 0.86±0.03Water content (Wt.%)
12 +-8 12 +-8 15+-5
Cosmic Dose rate uGya-1
170.00±17.00 150.00±15.00 140±14
Dose rate uGya-1 2,672±277 943±91 1824±132Age (years BP) 12,197+-1,277 35,602 +-3,851 40,499+-3,187Additive Dose +b1(Gy)
19.9 26.53 66.33
+b2 39.8 66.33 132.67 +b3 82.92 116.08 232.17
+b4 149.25 199 331.67
+b5 331.67 497.5
Table VII 2. Results from C14 and TL dating. Sample Description Depth (cm) Age estimate Method Ng-02 T90 Organic FeO rich fired clay 90 3.675 +-0.030 ka BP C14 Ng-02 T220 Diatom rich organic silt 220 12.197 +-1.277 ka TL Ng-02 T220 Diatom rich organic silt 220 14.740 +- 0.080 ka BP C14 Ng-02 T320 Organic rich lake sediment 320 17. 890 +- 0.080 ka BP C14 Ng-02 T380 Fine pale yellow sand with minor diatoms 380 35.602 +- 3.851 ka TL Ng-02 T440 Diatom rich lake sediments 440 40.499+- 3.187 ka TL

171
VII.2.5. Topographic and stratigraphic results
Ng-02 lies at an elevation of 922 m, close to the lake sump at 921 m. The lake bed rises gradually
to 925 m in a southerly direction (B) with a terrace at 934 m and up to 948 m along the fault scarp
(Figure VII-2). The lowest unit of Ng-02, UP460 (Figure VII-3) comprises an unconsolidated
silty sand with minor calcrete. Freshwater diatoms are present in this unit as evidenced by the
presence of valves of genus Aulacoseira ambigua (Fig 4a) and fragments of a periphyton taxon
belonging to the genus Surirella engleri (Figure VII-4b). The unit directly above (UP440)
consists of a compact fine grain pale yellow sand with minor diatom fragments and calcrete
nodules (Figure VII-4c and d). Early stages of amorphous silica forming on the quartz grains is
also evident in Figure VII-4d. The sand unit changes abruptly into a white diatomite (UP350)
with a thickness of about 20 cm (Figure VII-4e). Diatoms in this bed include fragmented pieces
of genus Nitzschia (e.g. N. amphibia) before changing abruptly into an organic rich silty sand of
30 cm thickness (UP330). This grades gradually into a gray laminar (cm scale) diatomaceous silt
with FeO staining (UP300) and then a diatom rich silt of 80 cm thickness (UP240). Silt with
minor calcrete nodules (UP160) is overlain by a dark gray laminar diatomite (UP120) of 20 cm
thickness. Large intact valves of S. engleri from UP120 were found in the sample collected at
110 cm depth. Valves from A. ambigua and broken fragments of genus Surirella were found at
100 cm depth (Figure VII-4f, g and h). UP120 is overlain by organic rich clay with laminar (cm
scale) and columnar structure (UP100) with evidence of burnt peat. The top 10 cm of the profile
is an organic rich silt. More detailed diatom descriptions are given below.

172
0
-20
-40
-60
-80
-100
-120
-140
-160
-180
-200
-220
-240
-260
-280
-300
-320
-340
-360
-380
-400
-420
-440
-460
3.7 ka BP(C14)
14.7 ka BP (C14)12.2 ka (TL)
17.9 ka BP (C14)
35.6 ka (TL)
40.5 ka (TL)
Up10
Up100
Up120
Up160
Up240
Up300
Up330
Up350
Up440
Up460
4.1 ka*
5,4 ka*
8,1 ka*
* = extrapolated dates.
Organic rich sandy/silt
Organic FeO rich fired clay
Dark gray diatomite
Silt with calcrete nodules
Diatom rich silt
Laminar diatomite with FeO staining
Organic rich sediment
White diatomite
Fine pale yellow sand withminor calcrete and diatomfragments
Diatom rich sediment
cm
cm
Figure VII 3. Stratigraphic log of Ng-02 depicting the units within the sampling pit

173
VII.2.6. Geochemical characteristics of the Ng-02 samples
The Lake Ngami sediments contain a high proportion of SiO2 (51-92.5 wt.%, avg. 72.4 wt.%) and
variable levels of Al2O3 (2.04-17.2 wt.%, avg. 8.88 wt.%) (Table VII-3). Al2O3 and SiO2 are
significantly negatively correlated (r = -0.94). TiO2 varies between 0.23-0.77 wt. % with an
average value of 0.51 wt. %. TiO2 and SiO2 are significantly negatively correlated (r = -0.94).
TiO2 and Al2O3 are positively correlated (r = 0.91) being both associated with the flux of fine
sediment into the basin.
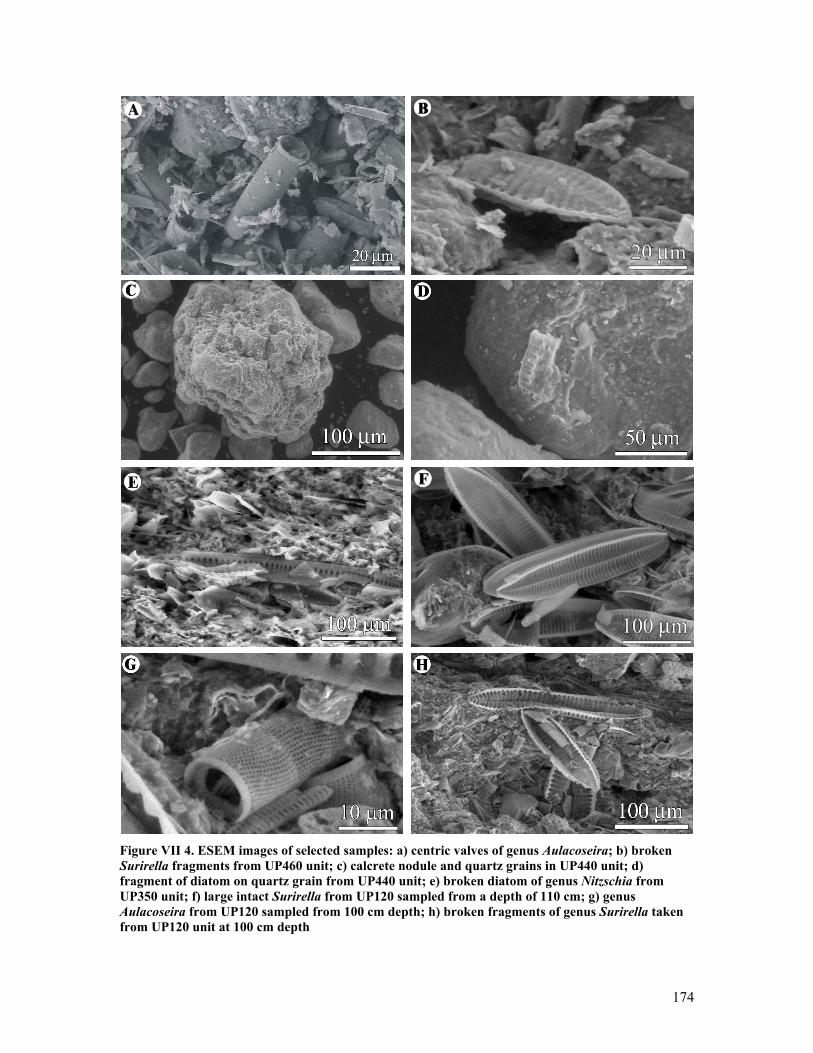
174
A B
C D
E F
GH
Figure VII 4. ESEM images of selected samples: a) centric valves of genus Aulacoseira; b) broken Surirella fragments from UP460 unit; c) calcrete nodule and quartz grains in UP440 unit; d) fragment of diatom on quartz grain from UP440 unit; e) broken diatom of genus Nitzschia from UP350 unit; f) large intact Surirella from UP120 sampled from a depth of 110 cm; g) genus Aulacoseira from UP120 sampled from 100 cm depth; h) broken fragments of genus Surirella taken from UP120 unit at 100 cm depth
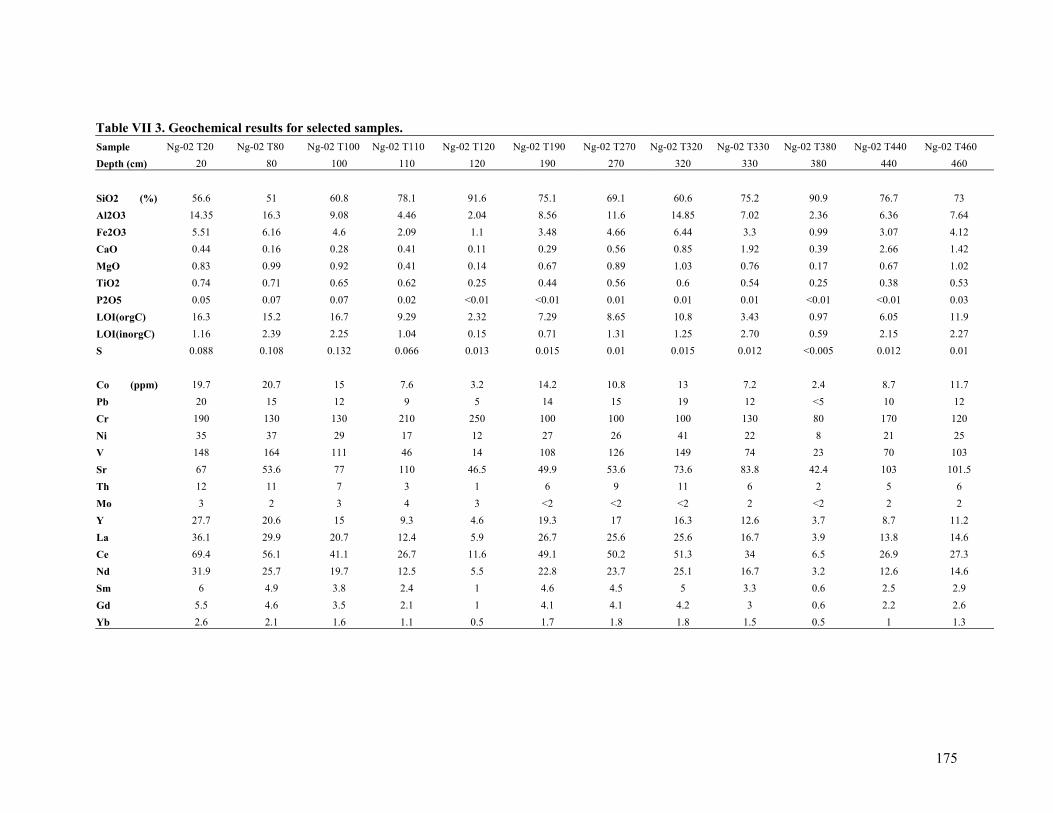
175
Table VII 3. Geochemical results for selected samples. Sample Ng-02 T20 Ng-02 T80 Ng-02 T100 Ng-02 T110 Ng-02 T120 Ng-02 T190 Ng-02 T270 Ng-02 T320 Ng-02 T330 Ng-02 T380 Ng-02 T440 Ng-02 T460 Depth (cm) 20 80 100 110 120 190 270 320 330 380 440 460
SiO2 (%) 56.6 51 60.8 78.1 91.6 75.1 69.1 60.6 75.2 90.9 76.7 73 Al2O3 14.35 16.3 9.08 4.46 2.04 8.56 11.6 14.85 7.02 2.36 6.36 7.64 Fe2O3 5.51 6.16 4.6 2.09 1.1 3.48 4.66 6.44 3.3 0.99 3.07 4.12 CaO 0.44 0.16 0.28 0.41 0.11 0.29 0.56 0.85 1.92 0.39 2.66 1.42 MgO 0.83 0.99 0.92 0.41 0.14 0.67 0.89 1.03 0.76 0.17 0.67 1.02 TiO2 0.74 0.71 0.65 0.62 0.25 0.44 0.56 0.6 0.54 0.25 0.38 0.53 P2O5 0.05 0.07 0.07 0.02 <0.01 <0.01 0.01 0.01 0.01 <0.01 <0.01 0.03 LOI(orgC) 16.3 15.2 16.7 9.29 2.32 7.29 8.65 10.8 3.43 0.97 6.05 11.9 LOI(inorgC) 1.16 2.39 2.25 1.04 0.15 0.71 1.31 1.25 2.70 0.59 2.15 2.27 S 0.088 0.108 0.132 0.066 0.013 0.015 0.01 0.015 0.012 <0.005 0.012 0.01 Co (ppm) 19.7 20.7 15 7.6 3.2 14.2 10.8 13 7.2 2.4 8.7 11.7 Pb 20 15 12 9 5 14 15 19 12 <5 10 12 Cr 190 130 130 210 250 100 100 100 130 80 170 120 Ni 35 37 29 17 12 27 26 41 22 8 21 25 V 148 164 111 46 14 108 126 149 74 23 70 103 Sr 67 53.6 77 110 46.5 49.9 53.6 73.6 83.8 42.4 103 101.5 Th 12 11 7 3 1 6 9 11 6 2 5 6 Mo 3 2 3 4 3 <2 <2 <2 2 <2 2 2 Y 27.7 20.6 15 9.3 4.6 19.3 17 16.3 12.6 3.7 8.7 11.2 La 36.1 29.9 20.7 12.4 5.9 26.7 25.6 25.6 16.7 3.9 13.8 14.6 Ce 69.4 56.1 41.1 26.7 11.6 49.1 50.2 51.3 34 6.5 26.9 27.3 Nd 31.9 25.7 19.7 12.5 5.5 22.8 23.7 25.1 16.7 3.2 12.6 14.6 Sm 6 4.9 3.8 2.4 1 4.6 4.5 5 3.3 0.6 2.5 2.9 Gd 5.5 4.6 3.5 2.1 1 4.1 4.1 4.2 3 0.6 2.2 2.6 Yb 2.6 2.1 1.6 1.1 0.5 1.7 1.8 1.8 1.5 0.5 1 1.3
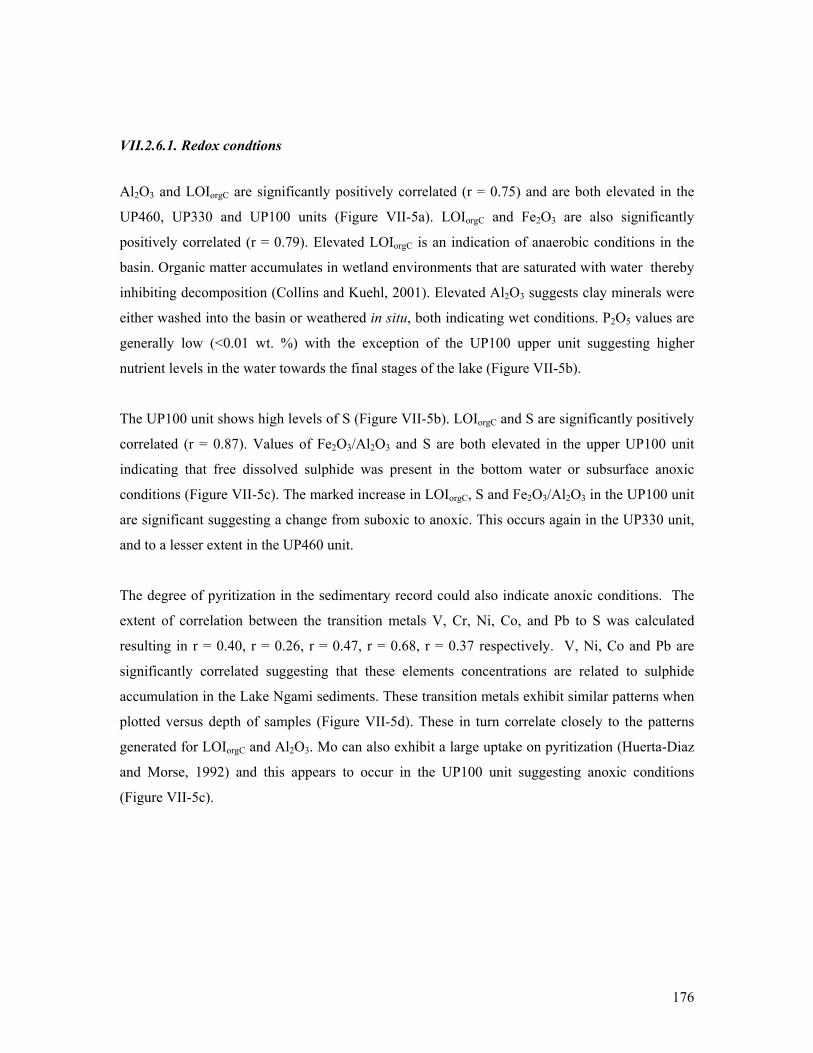
176
VII.2.6.1. Redox condtions
Al2O3 and LOIorgC are significantly positively correlated (r = 0.75) and are both elevated in the
UP460, UP330 and UP100 units (Figure VII-5a). LOIorgC and Fe2O3 are also significantly
positively correlated (r = 0.79). Elevated LOIorgC is an indication of anaerobic conditions in the
basin. Organic matter accumulates in wetland environments that are saturated with water thereby
inhibiting decomposition (Collins and Kuehl, 2001). Elevated Al2O3 suggests clay minerals were
either washed into the basin or weathered in situ, both indicating wet conditions. P2O5 values are
generally low (<0.01 wt. %) with the exception of the UP100 upper unit suggesting higher
nutrient levels in the water towards the final stages of the lake (Figure VII-5b).
The UP100 unit shows high levels of S (Figure VII-5b). LOIorgC and S are significantly positively
correlated (r = 0.87). Values of Fe2O3/Al2O3 and S are both elevated in the upper UP100 unit
indicating that free dissolved sulphide was present in the bottom water or subsurface anoxic
conditions (Figure VII-5c). The marked increase in LOIorgC, S and Fe2O3/Al2O3 in the UP100 unit
are significant suggesting a change from suboxic to anoxic. This occurs again in the UP330 unit,
and to a lesser extent in the UP460 unit.
The degree of pyritization in the sedimentary record could also indicate anoxic conditions. The
extent of correlation between the transition metals V, Cr, Ni, Co, and Pb to S was calculated
resulting in r = 0.40, r = 0.26, r = 0.47, r = 0.68, r = 0.37 respectively. V, Ni, Co and Pb are
significantly correlated suggesting that these elements concentrations are related to sulphide
accumulation in the Lake Ngami sediments. These transition metals exhibit similar patterns when
plotted versus depth of samples (Figure VII-5d). These in turn correlate closely to the patterns
generated for LOIorgC and Al2O3. Mo can also exhibit a large uptake on pyritization (Huerta-Diaz
and Morse, 1992) and this appears to occur in the UP100 unit suggesting anoxic conditions
(Figure VII-5c).

177
S %0.020.040.060.080.1
0.120.140.160.18
0.01
0.03
0.05
0.07
P2O5 %
S%
P2O
5
0.1
0.2
0.3
0.4
0.5
0.6
0.7Fe2O3/Al2O3
0.5
1.5
2.5
3.5
4.5
Mo (ppm)
Fe2O3/A
l2O3
Mo
2 4 6 8 10 12 14 16 18
100200
300400
500
depth (cm)
Fe2O3 %, Al2O3%
1 2
0
LOI (orgC) %
Al2O
3Fe2O
3LO
I
Gd (ppm)
1 2 3 4 5 6
La, Ce (ppm) Sr/Ca
depth (c
10 20 30 40 50 60 70
Ce
LaGd
.005
.01
.015
0.02
.025Sr/Ca
Co, Pb (ppm)
0.5
1.5
A B C
E F
depth (cm)
5
10 15 20 25
010
020
030
040
050
0 50 150
Co
Pb
V
V (ppm)
D
depth (cm)
Gd (ppm)
2 4 6
ka40.5
35.6 ka
17.9 ka
3.7 ka
14.7 ka
ka40.5
35.6 ka
17.9 ka
14.7 ka
3.7 ka
Figure VII 5. Selected elements and ratios plotted versus depth for profile Ng-02
178
REEs are used as chemical indicators of geologic processes, including assessment of crustal
sources, the redox state of water and depositional environment. The REEs are relatively insoluble
and are present in low concentrations in terrestrial waters; thus the REEs present in terrigenous
sediment are chiefly transported as particulate matter and reflect mainly the chemistry of their
source. Studies have indicated that high pH water show enrichments in heavy REEs (HREE) and
the degree of enrichment appears to increase with increasing alkalinity (Moller and Bau, 1993;
Johannesson et al., 1994). For the high pH alkaline waters, speciation modelling (Johannesson et
al., 1994) indicates that REE dicarbonate complexes are the only important form of dissolved
REE. The HREE are more strongly complexed in alkaline solution leading to enrichment of the
HREEs over light REEs (LREE) in the water. This implies that certain sediments should be the
site of preferential accumulation of LREE.
LaN/YbN ratios vary slightly between the different units with values ranging between 0.53 to 1.16
with an average value of 0.93. Values are lower (0.53-0.84, avg. 0.68) for the UP440 unit
indicating a moderate depletion of LREE. Samples Ng-02 T190 and Ng-02 T200 taken from the
UP240 unit show slight enrichment in LREE, indicating possible alkaline conditions.
Normalization of Ce abundances to those of its neighbouring REE, measured in various biogenic
and authigenic components has been used to deduce redox conditions of the water column at the
time of REE uptake by these phases. Unlike the other REE, cerium can undergo oxidation from
soluble Ce(III) to highly insoluble Ce (IV). Its fixation in particulate matter, including organics is
thought to be responsible for distinctive depletion of Ce in well oxygenated seawater (Wright et
al., 1987; Liu et al., 1988; Bellanca et al., 1997).
Ce/Ce* variations can be explained by simple mixing of various components (essentially biogenic
and authigenic) and of detrital materials (dominantly alumino-silicates) with crust-like Ce
signatures. A positive correlation (r = 0.88) exists between Al2O3 and Ce concentrations for the
Lake Ngami sediments (Figure VII-5e), and a comparison of Ce/Ce* values with concentrations
of terrigenous indices SiO2 and TiO2 indicate that there are weak significant correlations (r = -
0.37, r = 0.34 respectively) between these factors suggesting that fine sediment detrital flux does
contribute to Ce/Ce* distribution. However, significant correlations exist between Ce/Ce* and S
(r = 0.59) and Ce/Ce* and LOIorgC (r = 0.44) indicating that redox conditions does play a role in
the Ce/Ce* distribution in Lake Ngami sediments.

179
Samples from Ng-02 in general show a slight depletion in Ce/Ce* (0.84-1.02, avg. 0.93)
indicating aerobic, alkaline conditions did not predominate in the basin. Only samples from
UP120 show a slightly positive Ce/Ce* suggesting that at this stage the water was relatively more
oxygenated and alkaline.
Liu et al. (1988) report an enrichment of middle REE (MREE) in fossil apatite. We interpret the
lower LaN/SmN ratios (0.75- 1.08, avg. 0.87) as an expression of MREE enrichments, possibly
due to diagenetic phosphates. The weak significant positive correlation between Sm and Nd and
P2O5 (r = 0.46 for both) suggests that phosphate precipitation contributed to MREE distribution. It
is also noteworthy that P2O5 values are also weakly correlated with Th and Y (r = 0.38 and 0.48
respectively) which is consistent with substitution of Th, Y and MREE in the lattice of Ca-
phosphate.
VII.2.6.2. Salinity and alkalinity levels
In a closed lake, as the volume of the lake changes as a result of variations in the hydrological
regime of the catchment, so the chemistry of the water evolves. As the water level drops during
periods of decreased precipitation/ evaporation (P/E) ratio, the dissolved ions are concentrated
until a point is reached where the least soluble minerals start to precipitate. Calcium carbonate
(CaCO3) is precipitated early in this process and is virtually insoluble except at low salinities
(Eugster and Hardie, 1978). The trace element chemistry of Mg and Sr is an indicator of
palaeosalinity as during evaporative concentration of lake water in closed basins, precipitation of
CaCO3 often gives rise to an increase in the Mg/Ca and Sr/Ca meq ratio of the water and
consequently a positive correlation with salinity (Eugster and Kelts, 1983).
CaO values in the lake Ngami sediments are generally low (0.1-3.84 wt. %, avg. 0.62 wt. %) with
higher values associated with the UP460 unit. MgO values range between 0.14-1.09 wt. % with
an average value of 0.68 wt. %. Sr levels in the Lake Ngami sediments range between 41.1 to 132
ppm (avg. 64.4 ppm). The significant positive correlation between MgO and LOIinorgC (r = 0.72)
and Sr and LOIinorgC (r = 0.57) is an indication that Mg and Sr in the sediments is partially
controlled by chemical sedimentation of carbonates. However, unlike Sr and CaO, MgO values
are also correlated with Al2O3 and TiO2 (r = 0.77 and r = 0.90 respectively, which demonstrates
that MgO concentrations are also controlled by the input of clay minerals into the basin.

180
Consequently, only Sr and CaO are used for palaeo-salinity reconstruction of the Ng-02
sediments.
There appears to be an overall increase in the Sr/Ca ratio between 320 cm and 120 cm suggesting
a period of increased salinity. This corresponds to a period of decreasing LOIorgC implying
aerobic conditions and lower Al2O3, therefore less clastic input which again suggests a lowering
of lake levels. At a depth of 120 cm (UP120), the 20 cm bed of diatomite indicates that diatoms
were the dominant component in the lake, with very little clastic input.
VII.2.7. Diatom composition of Ng-02 samples
The lower section of the core (sample Ng-02 T440 ) taken from unit UP460 (c.40.5 ka) contains
abundant diatom remains. The assemblage is dominated by A. ambigua, Denticula kuetzingii and
Fragilaria construens, while other common taxa include Fragilaria brevistriata, Nitzschia
amphibia, Synedra ulna, Rhopolodia gibba and Cyclotella pseudostelligera. This assemblage
suggests that well-mixed conditions prevailed as A. ambigua is an obligate planktonic diatom that
grows in open freshwaters (Gasse and van Campo, 2001). D. kuetzingii may also be found
growing in open water, although it can be classified as epiphytic too, i.e. it grows attached to
aquatic macrophytes growing in the littoral regions of the lake. However, it is usually classified
as growing in waters with high electrolytic composition, suggesting that the lake at this time was
relatively deep (compared with other sections of the core) but brackish. The presence of R. gibba
confirms this interpretation.
Sample Ng-02 T410 from unit UP440 contains very few diatoms, but for those that are present,
Denticula kuetzingii is the most common. This perhaps suggests a shallow water environment
with abundant macrophytes in littoral regions.
Sample Ng-02 T320 occurs in the unit UP330 (c. 18 ka). In this section, there were rather fewer
diatoms present than in Units UP460-440, and many valves were broken, making positive
identifications of some of the smaller benthic taxa more difficult. Nevertheless, the assemblage
was dominated by F. construens, while D. kuetzingii, F. brevistriata and N. amphibia were all
common. A. ambigua was present too, although this species can grow in shallower waters, but
still as a planktonic diatom (Gasse 1986; Kilham 1990). It is likely therefore that the lake was

181
deep enough to support populations of A. ambigua, although the distribution of this species is
likely to have been restricted.
Samples Ng-02 240 & 180 between units UP300-240 (c. 15 ka – 10 ka) contains the largest
number of different taxa (i.e. these units are characterised by a large alpha diversity) and diatom
valves were relatively well preserved. The assemblage was dominated by the brackish species D.
kuetzingii and N. amphibia, while other common taxa included the shallow water, epiphytic
species F. construens, F. pinnata, Achnanthes minutissima and Cymbella gracilis and the
alkalophilous species Cyclotella meneghiniana. The lake is likely to have been shallow at this
time, and fairly alkaline with a basic pH, and with significant macrophyte growth in the extended
littoral regions of the lake. Interestingly though, taxa such as A. ambigua was also found,
suggesting that either pockets of deeper water remained, or lake levels were perhaps undergoing
considerable fluctuations, between marshy to deeper water environments. The presence of C.
stelligera also suggests fluctuating water levels, as this species can grow both in pelagic and
littoral regions of a lake.
Samples Ng-02 110 & 100 in unit UP120 (c. 5 ka - 4 ka) are characterised mainly by shallow
water taxa including the periphytic A. minutissima, Cymbela silesiaca (which grows mainly in
shallow water, circumneutral waters, attached to plants), D. kuetzingii, N. amphibia, R. gibba
(another epiphyte which grows in waters with moderate to fairly high conductivity) and the very
large S. engleri (valves were over 200 µm long). The ecology of this latter taxon is not well
known, although Gasse (1986) has found it both in the plankton and living on the bottom
sediments of freshwater lakes often in slightly alkaline waters.
The final two samples in this qualitative assessment were Ng-02 T80 & T40, from unit UP100 (c.
3 ka – 2 ka). In both these samples, very few diatoms were present, with considerable numbers of
broken valves, making positive identifications of small benthic taxa difficult. Sample Ng02-T80
contained very few taxa (e.g. N. amphibia and low numbers of F. construens and an unidentified
Eunotia spp.). Palaeoenvironmental reconstructions are therefore difficult, except to say perhaps
that very shallow water conditions prevailed. Sample Ng-02 T40 was dominated by F. pinnata
and N. amphibia, but also abundant were the taxa A. ambigua and C. stelligera, suggesting lake
water conditions perhaps becoming deeper, with increased mixing of the water column.

182
VII.2.8. Palaeo-environmental interpretation
Based on slightly elevated but declining Al2O3 and LOIorgC results, lacustrine conditions occurred
in Lake Ngami at c. 42 ka until c. 40 ka. Diatom results indicate that relatively deep but brackish
conditions prevailed. The higher CaO values of the UP460 unit might suggest more saline
conditions however, Sr/Ca ratios are relatively low in this unit. Work conducted on stalagmites in
the Gcwhiaba Caves, approximately 70 km from Lake Ngami, reported enhanced local rainfall
between 45 and 37 ka (Cooke, 1984). Lake Tsodilo had lacustrine conditions between 40 – 32 ka.
This suggests that enhanced local rainfall in addition to in-flow through the Okavango River
system contributed to lacustrine conditions in the Lake Ngami basin.
The lacustrine conditions in the basin appear to have been terminated rapidly at ca. 40 ka. Within
the margins of error, the sample dated at 40 ka (UP460) and the sand unit (UP440) sample dated
at 36 ka, are identical, suggesting that these events could be co-incidental events. This would
suggest that the lower sand unit was deposited rapidly implying fluvial sedimentation. Shaw et
al., (2003) also report compact yellow sand at the bottom of one of their profiles in the lake bed
on the northern edge of the lake. We believe that the sand unit occurs as a result of shallow flow-
through conditions in the basin, and this is supported by grain size data. Samples from this unit
show a distinct 3 Φ peak. Ringrose et al., (submitted paper) report an increase in the 3 Φ peak in
fluvial environments as opposed to the 2 Φ ‘dune’ peak. The onset of this sedimentary
environment may have resulted from tectonic tilting of the basin. Strandline bifurcation (Figure
VII-2) is evidence that tilting has occurred in the basin. Gumbricht et al., (2001) describe tilting
of palaeo-shorelines in the Mababe Depression and relate this to neo-tectonic activity in the
Okavango Delta.
The sharp transition between the sandy UP440 unit and the overlying diatom unit (UP350) and
the large gap between the dates of UP440 and UP330 suggests a depositional hiatus and possible
erosion. This could reflect a possible seismic and/or fluvial event in the basin, or just non-
deposition due to dessication of the lake.
At 19 ka, shallow, aerobic, turbulent lake conditions were prevalent, but lake levels were at this
time increasing to deeper water conditions up until c. 17 ka. This period coincides with the Late

183
Glacial Maximum (LGM), a period of increased aridity and cooler conditions in the region
(Partridge et al., 1999). The fact that the Lake Ngami Basin appears to have been filling during
this time of regional aridity appears to result from increased flow from the Okavango River and a
more humid climate in the region of the rivers headwaters in Angola, suggesting an anti-phase
climate between the two regions.
Increasing Sr/Ca ratio and decreasing LOIorgC and Al2O3, from c. 16 ka, suggest decreased inflow
into the basin and a lowering of lake levels. Lacustrine conditions were probably maintained
primarily by local rainfall input as the region experienced a warmer, wetter phase between 16 –
11 ka (Shaw and Cooke, 1986). Based on the enrichment of LREE in the UP240 unit, slightly
alkaline conditions may have prevailed at c. 12 ka and again in the UP120 unit (c. 5 ka). Diatom
results from Ng-02 T240 and T180 also support shallow alkaline conditions at this time. Shaw et
al. (2003) suggested an extensive and slightly alkaline lake at 11 ka.
Fairly shallow lake levels prevailed at UP120 but the lake was filling rapidly by 4 ka. Shaw et al.,
(2003) proposed that lake levels rose between 4 and 3 ka. Talma and Vogel (1992) report a
cooling event in southern Africa at 4.7 to 4.2 ka (post Holocene Altithermal) recorded in the
Cango Cave isotope record. Based on our results, the basin continued to fill until 3.7 ka BP and
from then, it appears to have fluctuated and eventually gone into decline as indicated by
decreasing S and LOIorgC values until 2.4 ka. Based on LOIorgC values, the lake levels began to
rise again until ca. 0.8 ka, when it fell again. This corresponds well with findings of Robbins et al.
(1998) who suggested a deep lake around 4 ka and a slightly lower lake between 3.8 and 2.4 ka.
VII.2.9. Conclusions
Inorganic and organic carbon content, S, Al2O3 and various REE have been used in conjunction
with diatoms to distinguish between high and low lake levels in the Lake Ngami basin.
Lacustrine conditions in the Lake Ngami basin are suggested 42 ka - 40 ka consistent with events
in palaeo-Lake Makgadikgadi (Ringrose et al., 2005) and Milankovitch cycles. The sedimentary
record at 40 ka appears to have been influenced by tectonic activity, as lacustrine sediments are
abruptly replaced with fine grained yellow sands. Deeper lake levels are reported for the period
19 ka -17 ka (LGM) followed by predominantly shallower alkaline conditions between 16 ka -5

184
ka. Lake levels were high at c. 4 ka and continued to fill until 3.7 ka, declined until 2.4 ka,
increased until 0.8 ka and from then, lake levels declined.
During the LGM of southern Africa, a period of cooling and drying in the region, Lake Ngami
levels were rising. Conversely, when the southern African region started to become warmer and
wetter following the LGM, Lake Ngami was going through a phase of reduced inflow. The results
indicate that the present day dipole effect in precipitation between central southern Africa and
regions of equatorial Africa, was extant during the late Quaternary over NW Botswana and the
Angolan highlands.
Acknowledgements
University of Botswana Research and Publication Fund is acknowledged for the grant (RP116) to
conduct this research. This is an IUEM contribution no. 959. Piotr Wolski is acknowledged for
assistance with the topographic survey and Figure 1. Thebe Kemosodile and Dikitso Kolokose are
thanked for assistance with field work and sampling. Martin Todd is acknowledged for
discussions on climate models. We gratefully acknowledge the constructive comments Tine
Laerdal and one anonymous reviewer.
References
Aitken, M.J., 1985. Thermoluminescence Dating. Academic Press Publishers: London. Baillieul, T.A., 1979. A reconnaisance survey of the cover sands in the Republic of Botswana.
Journal of Sedimentary Petrology 45,494-503. Battarbee R.W., Jones V.J., Flower R.J., Cameron N.G., Bennion, H., Carvalho L. and Juggins S.
2001. Diatom analysis. In: Last W.M. and Smol J.P. (eds), Tracking Environmental Change Using Lake Sediments, Vol. 3: Terrestrial, Algal and Siliceous Indicators. Kluwer Academic Publishers, Dordrecht, The Netherlands, pp. 171–205.
Bellanca, A., Masetti, D., Neri, R., 1997. Rare earth elements in limestone/marlstone couplets from the Albian-Cenomanian Cismon section (Venetian region, northern Italy): assessing REE sensitivity to environmental changes. Chemical Geology 141, 141-152.
Blumel, W.D., Eitel, B., Lang, A., 1998. Dunes in southeastern Namibia: evidence for Holocene environmental changes in the southwestern Kalahari based on thermoluminesence data. Palaeogeography, Palaeoclimatology, Palaeoecology 138, 139-149.
Botter-Jensen L, Duller G.T., 1992. A New System for Measuring Optically Stimulated Luminescence from Quaternary Samples. Nucl. Tracks and Radiation Measures 20, 202-205.
Carl, C., 1987. Investigations of U series disequilibria as a means to study the transport mechanism of uranium in sandstone samples during weathering. Uranium 3, 285-305.
185
Condie, K.C., 1993. Chemical composition and evolution of the upper continental crust: contrasting results from surface samples and shales. Chemical Geology 104, 1-37.
Collins, M.E., Kuehl, R.J., 2001. Organic matter accumulation and organic soils. In: Richardson, J.L., Vepraskas, M.J., (Eds) Wetland soils. Lewis Publishers, USA, pp. 13-162.
Cooke H.J., 1980. Landform evolution in the context of climatic changes and neotectonics in the middle Kalahari of north-central Botswana. Trans. Inst. Brit. Geog., NS 5, 80-99.
Cooke, H.J., 1984. The evidence from northern Botswana of climatic change. In: J. Vogel (ed.), Late Cenozoic palaeoclimates of the Southern hemisphere. Balkema, Rotterdam, pp. 265-278.
Czernik J., Goslar T., 2001. Preparation of graphite targets in the Gliwice Radiocarbon Laboratory for AMS 14C dating. Radiocarbon, 43, 283-291.
Ellery, K., 1987. Wetland plant community composition and successional processes in the Maunachira River system of the Okavango Delta. Unpublished MSc thesis. Johannesburg.
Eugster, H.P., Hardie, L.A., 1978. Saline Lakes, In: Lerman (Ed.) Chemistry, Geology and Physics of Lakes, Springer-Verlag, New York, pp. 273-293.
Eugster, H.P., Kelts, K., 1983. Lacustrine chemical sediments In: Goudie, A.G. and Pye, K., Chemical sediments and geomorphology: precipitates and residua in the near surface environment. London, Academic Press, pp.321-368.
Gasse, F. 1986. East African diatoms: taxonomy, ecological distribution. Bibliotheca Diatomologica, J. Cramer, Berlin. 201 pp + 44 plates.
Gasse, F., Barker, P., Gell, P.A., Fritz, S.C., Chalie, F. 1997. Diatom-inferred salinity in palaeolakes: an indirect tracer of climatic change. Quaternary Science Reviews, 16, 547-563.
Gasse, F. & Van Campo, E. 2001. Late Quaternary environmental changes from a pollen and diatom record in the southern tropics (Lake Tritrivakely, Madagascar). Palaeogeography, Palaeoclimatology and Palaeoecology, 167, 287-308.
Gieske, A., 1996. Vegetation driven groundwater recharge below the Okavango delta, (Botswana) as a solute sink mechanism - an indicative model. Botswana Journal of Earth Sciences 3, 33-44.
Goslar T., Czernik J., Goslar E., 2004. Low-energy 14C AMS in Poznań Radiocarbon Laboratory, Nuclear Instruments and Methods B, 223-224, 5-11.
Government of Botswana, 2002. Okavango Delta Management Plan, National Conservation Strategy Implementing Agency, Gaborone, Botswana, 156pp.
Gumbricht, T., McCarthy, T.S., Merry, C.L., 2001. The topography of the Okavango Delta, Botswana, and its tectonic and sedimentological implications. South African Journal of Geology 104, 243-264.
Huaya L., Xiaoyong, W., Haizhou, M., Hongbing, T., Vandenberghe, J., Xiaodong, M., Zhen, L., Youbin, S., Zhisheng, A., Guangchao, C., 2004. The plateau monsoon variation during the past 130 kyr revealed by loess deposit at northeast Qinghai-Tibet, Global and Planetary Change, 41, 207-214.
Huerta-Diaz, M.A., Morse, J.W., 1992. Pyritization of trace metals in anoxic marine sediments. Geochimica Cosmochimica Acta 56, 2681-2702.
Imbrie, J. et al., 1984. The orbital theory of Pleistocene climate: support from a revised chronology of the marine δO18 record. In Berger, A.L., Imbire, J., Hays, J., Kukla, G., and Saltzman, B., (eds.). milankovitch and climate, Part 1. Dordrecht: D. Reidel. 269-305.
Johannesson, K.H., Lyons, W.B., Bird, D.A., 1994. Rare earth element concentration and speciation in alkaline lakes from the western USA. Geophysical Research Letters 21, 773-776.
186
Kilham, P. (1990). Ecology of Melosira species in the Great Lakes of Africa. In Tilzer, M.M. & Serruya, C. (Eds): Large lakes, ecological structure and function. Springer-Verlag Berlin, pp 414-427.
Krammer K. and Lange-Bertalot H. 1986–1991. Bacillariophyceae. Gustav Fisher Verlag, Stuttgart
Liu, Y.G., Miah, M.R.U., Schmitt, R.A., 1988. Cerium: a chemical tracer for paleo-oceanic redox conditions. Geochimica Cosmochimica Acta 52, 1361-1371.
Mackay, A.W., Jones, V.J. & Battarbee, R.W. (2003) Approaches to Holocene climate reconstruction using diatoms. In Global change in the Holocene; eds: Mackay, A.W., Battarbee, R.W., Birks, H.J.B. & Oldfield, F. Published by Arnold. (Chapter 20) pp 294-309.
Mallick, D.I.J, Habgood F, Skinner AC. 1981. A geological interpretation of Landsat imagery and air photography of Botswana. Overseas Geological and Mineral Resources, London, 56, 1-36.
McCarthy, T.S., Ellery, W.N., 1993, The Okavango Delta, Geobulletin 36(2):5-8. McCarthy, T.S., Ellery, W.N., Bloem, A., 1998a. Some observations on the geomorphological
impact of hippopotamus (Hippopotamus amphibius L.) in the Okavango Delta, Botswana. African Journal of Ecology, 36, 44-56.
McCarthy, T.S., Ellery, W.N., Dangerfield, J.M., 1998b. The role of biota in the initiation and growth of islands on the floodplains of the Okavango alluvial fan, Botswana. Earth Surface Processes and Landforms, 23, 291-316.
McCarthy, T.S., Cooper, G.R.J., Tyson, P.D., Ellery, W.N., 2000. Seasonal flooding in the Okavango Delta, Botswana – recent history and future prospects. South African Journal of Science 96, 25-33.
Modisi, M.P., Atekwana, E.A., Kampunzu, A.B. Ngwisanyi, T.H., 2000. Rift kinematics during the incipient stages of continental expansion: Evidence from the nascent Okavango rift basin, northwest Botswana, Geology, 28, 939-942.
Moller, P., Bau, M., 1993. Rare earth patterns with positive cerium anomaly in alkaline waters from Lake Van Turkey. Earth Planetary Science Letters 117, 671-676.
Moore A. E., Larkin, P. 2001. Drainage evolution in south-central Africa since the breakup of Gondwana. South African Journal of Geology 104, 47-68.
Nicholson S.E., Entekhabi, D., 1986. The quasi-periodic behaviour of rainfall variability in Africa and its relationship to the Southern Oscillation. Archives for Meteorology, Geophysics and Bioclimatology 34, 311-348.
Partridge, T.C., Demenocal, P., Lorentz, S.A., Paiker, M. J., Vogel, J.C., 1997. Orbital forcing of climate over South Africa: a 200,000-year rainfall record from Pretoria Salt Pan. Quaternary Science Review 16, 1125-1133.
Partridge, T.C., Scott, L., Hamilton, J.E., 1999. Synthetic reconstructions of southern African environments during the Last Glacial Maximum (21-28 kyr) and the Holocene Altithermal, (8-6 kyr). Quaternary International 57/58, 207-214.
Partridge, T.C., Maud, R.R., 2000. The Cenozoic of southern Africa. New York: Oxford University Press, 406 pp.
Petit, J.R. 1999. Climate and atmospheric history of the past 420 000 years from the Vostock ice core, Antarctica. Nature 399:429-436.
Radtke, U., Janotta, A., Hilgers, A., Murray, A., 1999. The potential of OSL and TL for dating late-glacial and Holocene dune sands tested with independent age controls of the Laacher See tephra (12, 880a) at the section Mainz-Gonsenheim, 9th International Conference on Luminescence and ESR dating (LED99), Rome.
Repinski, P., Holmgren, K., Lauritzen, S.E., Lee-Thorp, J.A., 1999. A late Holocene climate record from a stalagmite, Cold Air Cave, Northern Province, South Africa. Palaeogeography, Palaeoclimatology, Palaeoecology 150, 269-277.

187
Ringrose, S., Vanderpost, C. and Matheson, W., 2003. Mapping ecological conditions in the Okavango delta Botswana using fine and coarse resolution systems including simulated SPOT VEGETATION imagery, International Journal of Remote Sensing, 24(5): 1029-1052.
Ringrose, S., Huntsman-Mapila, P., Kampunzu, A. B., Matheson, W., Downey, W., Vink, B., Coetzee, C., and Vanderpost, C., 2005. Sedimentological and geochemical evidence for palaeo-environmental change in the Makgadikgadi subbasin, in relation to the MOZ rift depression, Botswana. Palaeogeography, Palaeloclimatology, Palaeoecology, V. 217 (3-4) pp. 265-287.
Ringrose, S., Huntsman-Mapila, P., Downey, W., Coetzee, S., Vink, B., Kemosidile, T., Vanderpost, C., Kolokose, D., (submitted paper) Impact of poast and present sedimentary processes on morpho-unit development in the distal okavango alluvial fan, Botswana. Earth Surface Processes and Landforms.
Robbins, L., Murphy, A., Campbell, A., brook, G., Reid, D., Haberyan, K., Downey, W., 1998. Test excavations and reconnaissance palaeoenvironmental work at Toteng, Botswana. South African Archaeological Bulletin 53, 125-132.
Rollinson, H., 1993. Using geochemical data: evaluation, presentation, interpretation. Longman, Singapore.
Shaw, P.A., 1985. Late Quaternary landforms and environmental change in northwest Botswana; the evidence of Lake Ngami and the Mababe Depression. Trans. Inst. Brit. Geog., NS10, 333-346.
Shaw P., Cooke, H.J., 1986. Geomorphic evidence for the late Quaternary palaeoclimates of the middle Kalahari of northern Botswana. Catena. 13, 349-359.
Shaw P.A, Stokes S, Thomas D.S.G., Bateman, M., Davies F., 2003. Holocene fluctuations of Lake Ngami, Middle Kalahari: chronology and responses to climatic change. Quaternary International, 111, 23-35.
Smith, R.A., 1984, Lithostratigraphy of the Karoo stratigraphy in Botswana, Botswana Geological Survey Bulletin, Lobatse, Botswana, 26, 34pp.
Snowy Mountain Engineering Corporation (SMEC), 1987. Southern Okavango Integrated Water Development Phase 1: Final Report, Technical Study, Vol 11. Irrigated Agricultural Development Potential. Government of Botswana, Department of Water Affairs, Gaborone.
Stager, J.C., Cumming, B. & Meeker, L.D. 1997. An 11,400-year high resolution diatom record from Lake Victoria, East Africa. Quaternary Research, 47, 81-89.
Stuiver, M., Polach, H.A., 1977. Discussion: Reporting of 14C Data. Radiocarbon 19 (3), 355-363.
Talma, A. S. and J. C. Vogel. 1992. Late Quaternary paleotemperatures derived from a speleothem from Cango Caves, Cape Province, South Africa. Quaternary Research, 37, 203-213.
Taylor, S.R., McLennan, S.M., 1985. The Continental Crust: its composition and evolution. Blackwell, Oxford, 312pp.
Thomas D.S.G., Shaw, P.A. 2002. Late Quaternary environmental change in central southern Africa: new data, synthesis, issues and prospects, Quaternary Science Reviews 21, 783-797.
Thomas, D.S.G., Brook, G., Shaw, P., Bateman, M., Haberyan, K., Appleton, C., Nash, D., McLaren, S., Davies, F., 2002. Late Pleistocene wetting and drying in the NW Kalahari: an interated study from the Tsodilo Hills, Botswana. Quaternary International.
Tyson, P.D., Preston-Whyte, R.A., 2000. The weather and climate of Southern Africa. Oxford University Press, Cape Town, 396pp.

188
Tyson, P.D., Lee-Thorp, J., Holmgren, K., Thackeray, J.F., 2002a. Changing gradients of climate change in southern Africa during the past millennium: implications for population movements. Climate Change 52, 129-135.
Tyson, P.D. Fuchs, R., Fu, C, Lebel, L., Mitra, A.P. Odada, E, Perry, J., Steffen, W., Virji, H., (Eds) 2002b, Global-Regional Linkages in the Earth System, START, Springer-Verlag, New York, 198pp.
Wright, J., Schrader, H., Holser, W.T., 1987. Paleoredox variations in ancient oceans recorded by rare earth elements in fossil apatite. Geochimica Cosmochimica Acta 51, 631-644.
Zoller L, Pernicka E. 1989. A Note on Overcounting in Alpha-Counters and its Elimination. Ancient TL 7, 11-14.

189
VIII. MAJOR AND TRACE ELEMENT GEOCHEMISTRY OF LAKE
TANGANYIKA SEDIMENTS: IMPLICATIONS FOR LATE QUATERNARY
CLIMATIC VARIABILITY
VIII.1. Changements paléo-environnementaux dans le bassin du Tanganyika au
Quaternaire : approche géochimique des éléments traces et majeurs
Résumé de l’article
Au cours de ce travail, nous avons étudiés les changements paléo-environnementaux du bassin du
Tanganyika pendant la fin du Pléistocène et durant Holocène à l’aide d’outils géochimiques
(mesure des éléments majeurs et traces). Les sédiments des deux sondages étudiés (MPU-3 et
MPU-10) proviennent du sous bassin de Mpulungu. Ils sont essentiellement laminés, constitués
de boues organiques riches en diatomées et sont occasionnellement interrompus par des niveaux
de cendres volcaniques aériennes. Ces cendres viennent du système volcanique de Rungwe, situé
au sud-est du bassin du Tanganyika. Les sédiments du sous-bassin Mpulungu proviennent d’un
matériel modérément à fortement altéré, typique de la zone climatique tropicale. Les variations du
rapport Ti/Al sont, selon notre interprétation, liées aux variations de flux de kaolinite et de
feldspath et non aux variations de taille de grains des apports détritiques. Durant le Dryas récent
(12.5 – 11.5 ka BP) les rapports Ti/Al et K/Al des sédiments diminuent fortement, indiquant que
les sédiments proviennent d’une source altérée. A partir de 11.2 ka, les rapports Ti/Al et K/Al
augmentent et atteignent un plateau à ca. 6.5 ka. Ces résultats indiquent que pendant les périodes
humides, l’augmentation du couvert végétal limite l’érosion des sols, favorisant leur stabilité. Il
en résulte une érosion mécanique moindre, mais une érosion chimique accrue. Pendant les
périodes plus sèches, la végétation est plus clairsemée ce qui favorise la désagrégation
mécanique. Ceci entraîne l’érosion et le transport, dans le bassin, du matériel fortement altéré au
cours des épisodes humides précédents. Les éléments traces, sensibles aux changements de
conditions d’oxydoréduction, ont été utilisés pour reconstruire les variations du niveau du lac. Les
concentrations en éléments traces du site en eaux peu profondes MPU-3 sont plutôt contrôlés par
le flux détritique et sont donc peu représentatives pour reconstruire les variations du niveau du
lac. En revanche, les résultats pour le site en eaux profondes MPU-10 suggèrent que même
pendant le dernier maximum glaciaire (LGM), les conditions sont restées euxiniques. Ainsi, le

190
niveau du lac n’est pas descendu à moins de 200 – 300 m durant cette période. Les variations du
rapport Nb/Ti sont utilisées comme indicateur du transport des cendres volcaniques. Ces
variations indiquent des conditions relativement instables entre la fin du Pleistocène jusqu’à ca.
15.4 ka. Les directions de vent étaient variables avec une dominante au Nord, principalement
pendant le dernier maximum glaciaire (21.5 – 18.3 ka). Entre 13.2 ka et 11 ka, ce qui couvre le
Dryas récent, les rapports Nb/Ti sont élevés, ce qui reflète des épisodes majeurs de retombées de
cendres volcaniques. Ces rapports diminuent ensuite au cours du temps. Le pic en Nb/Ti, observé
à 13.2 ka et représentatif de l’éruption majeure, pourrait aussi refléter l’érosion et le transport des
cendres volcaniques déposées sur l’ensemble de la zone entre le sud du lac Tanganyika et le nord
du lac Malawi. Les rapports Nb/Ti des sédiments Holocène sont généralement plus faibles et plus
stables que ceux des sédiments de la fin du Pléistocène. Cette régularité pourrait indiquer un
retour à des conditions plus stables avec des vents de Nord dominant pendant cette période
humide.

191
VIII.2. Major and trace element geochemistry of Lake Tanganyika sediments:
implications for late Quaternary climatic variability
P. Huntsman-Mapila1,2,*, J-J. Tiercelin2, M. Benoit2, J. Cotten2, M. Talbot3, C. Hémond2, D.
Hureau-Mazundier2
1 Harry Oppenheimer Okavango Research Centre, University of Botswana, P/Bag 285, Maun, Botswana 2UMR-CNRS 6538, Institut Universitaire Européen de la Mer, 29280 Plouzané, France 3Department of Earth Sciences, University of Bergen, Allegt. 41, 5007 Bergen, Norway * Author for correspondence (email : [email protected]) Article to be submitted to: Palaeogeography, Palaeoclimatology, Palaeoecology
Abstract
In this study, geochemical proxies for climate change were employed on samples from two cores
from the Mpulungu sub-basin, southern Lake Tanganyika. The sedimentation in these cores,
which are predominantly laminated, diatom-rich organic muds, was occasionally interrupted by
wind-blown volcanic ash, interpreted as related to volcanic activity in the Rungwe volcanic
province to the south-east of the Tanganyika basin. The Lake Tanganyika sediments from the
MPU-3 and MPU-10 core represent sediments originating from moderate to strongly weathered
source material typical of a tropical climate zone. The Ti/Al flux has been interpreted as
variations due to the kaolinite and feldspar flux rather than grain size variations in the terrestrial
input. During the Younger Dryas (YD) event, both Ti/Al and K/Al fall drastically, indicating the
input of more weathered source material. By 11.2 ka, both Ti/Al and K/Al rise rapidly, reaching a
plateau at ca. 6.5 ka. These results reflect the fact that during more humid periods, the increased
tree cover would limit soil erosion through enhanced soil stability, resulting in less physical
weathering but more pronounced chemical weathering. The sparser vegetation of drier periods
would enhance physical weathering leading to the erosion and transport into the basin of material
chemically weathered during the previous wet phase. Redox sensitive trace elements used as
geochemical proxies for past climate induced lake levels fluctuations indicate that at the shallow
MPU-3 site, these elements are ultimately controlled by detrital flux and therefore have limited
use in palaeoredox reconstruction. The MPU-10 deeper water site suggests that even during the

192
Last Glacial Maximum (LGM), euxinic conditions were maintained. This suggests that the water
did not fall much below 200 – 300 m during this time. Nb/Ti results suggest that in the late
Pleistocene, until ca 15.4 ka, fairly unstable conditions, with changing wind directions but more
frequent north winds particularly between 21.5 – 18.3 ka (LGM). From the time of the major ash
fall at 13.2 ka to ca 11 ka, which covers the YD event, our records show Nb/Ti ratios that are
diminishing with time. The very high peak at 13.2 ka representing the major ash fall followed by
diminishing values could in fact be reflecting erosion and river transport of ash falls deposited on
land as the whole area between southern Lake Tanganyika and northern Lake Malawi would have
been covered in ash from this eruption. The Holocene sediments show a generally more stable
and relatively low pattern for Nb/Ti value than for the late Pleistocene. This stable pattern could
reflect a general return to predominantly north winds during this humid period.
VIII.2.1. Introduction
Lake sediments are highly sensitive indicators of climate variability and environmental change. A
number of proxies exist for tracking environmental dynamics, including geochemistry which can
provide valuable information on changes in weathering profiles and depositional environments.
During more humid periods, chemical weathering may be enhanced (White et al., 1999; Ding et
al., 2001; Singh and Rajamanni, 2001) while the thicker vegetation cover and more stable soils
typical of wetter environments may reduce physical weathering (Kauppila and Salonen, 1997).
Concentrations of the redox-sensitive elements in sediments can reflect water levels and allow us
to reconstruct palaeodepositional conditions in the sedimentary basin (Werne et al., 2002; Lyons
et al., 2003; Sageman et al., 2003; Tribovillard et al., 2006).
Studies on lake cores from Tropical Africa have focussed more on using biofactors such as
pollen, (e.g. Bonnefille et al., 1991; Vincens, 1991; Vincens et al., 1993; Vincens et al., 2005) and
diatoms (e.g. Barker et al., 2002; Gasse et al., 1989; Gasse and Van Campo, 1998; Gasse et al.,
2002) to detect palaeoclimate variations. Geochemical methods have not been extensively used in
this region with the exception of organic geochemistry and stable isotopes (e.g. Beuning et al.,
1997; Russell and Johnson, 2005; 2006; Talbot and Livingstone, 1989; Talbot and Laerdal., 2000;
Talbot et al., 2006) and magnetic susceptibility (e.g. Williamson et al., 1991; Garcin et al.,
2006a). By approaching this study of climate variability and past environmental dynamics in the
Lake Tanganyika Basin from a geochemical perspective (major and trace element), we attempt to
present a new perspective on previous climate change work done on cores from the Mpulungu
Basin. The objectives of this paper are therefore: 1) to present new geochemical data from Lake

193
Tanganyika sediments; 2) to determine climate induced changes in the sedimentary geochemistry
and 3) to compare the geochemically based climate proxies with existing diatom, pollen and
organic geochemistry data from the same cores and regional work.
VIII.2.2. Geological and limnological setting
Lake Tanganyika is part of the western branch of the East African Rift System and lies at an
altitude of 773m. It is 650 km long and up-to 70 km wide (Scholz and Rosendahl, 1988) and at
1470 m is the deepest of the African rift lakes (Figure VIII-1 a and b). Lake Tanganyika occupies
a series of linked, axial-rift, half-graben basins (Figure VIII-1 c). The southern end of Lake
Tanganyika basin, known as the Mpulungu sub-basin (Mondeguer, 1991), contains a 2.5 km thick
pile of rift sediments with an estimated age of 4-2 Ma. The Mpulungu sub-basin is 100 km long,
25 km wide with up to 800 m water depth (Figure VIII-1 d). To the south-east of the Mpulungu
sub-basin is the Rungwe volcanic massif, which is the southernmost eruptive centre in the EARS
western branch. Volcanic activity in the Rungwe started in the Late Miocene (~ 8 Ma) and
remained active during the late Pleistocene and Holocene with major pyroclastics eruptions
(Harkin, 1960; Ebinger et al., 1989; Williams et al., 1993). Thin tephras have been identified in a
number of cores from southern Lake Tanganyika (Livingstone, 1975 (T2 core); Haberyan and
Hecky, 1987; Tiercelin and Mondeguer, 1991). The Holocene sediments of Lake Tanganyika are
predominantly laminated, organic-rich diatomaceous silts (Degens et al., 1971) with minor clays
(primarily kaolinite, with lesser amounts of chlorite and illite) (Cohen, 1989).
Hydrogen sulphide, carbon dioxide and methane are present in the deeper lake where below 240
m conditions are permanently anoxic (Coulter and Spigel, 1991; Barrat et al., 2000). Most of the
river discharge into the lake is from the Malagarasi River from the east and Ruzizi Rivers from
the north. The Lufubu river (Figure VIII-1 c) drains into the basin from the south, traversing the
sandstones of the Mbala formation and the granitic basement. The Ruzizi is reported to be the
major source of water and salts for Lake Tanganyika (Hecky, 1978). The steep escarpments of the
rift basin have streams which also contribute to the water budget. Because of high evaporation
rates, under modern conditions, closure of Lake Kivu would result in closure of Lake
Tanganyika, as the Ruzizi inflow is greater (3.2 km3/yr) than the Lukuga discharge (2.7 km3/yr)
(Casanova and Hillaire-Marcel, 1992). The lake was divided into two or more separate basins
during major lowstands (Tiercelin and Mondeguer, 1991).

194
Figure VIII 1. A) Present ITCZ seasonal migration over Africa shown as dark grey band. Predominant wind directions are represented as black arrows. Figure from Grand Atlas du Continent Africain (1973): B) location of Lake Tanganyika with respect to the Rungwe volcanic field and Lake Malawi: C) the structure and hydrology of Lake Tanganyika. Key 1-littoral platforms; 2-transverse shoals; 3-sub-basin deep zones (after Tiercelin and Mondeguer, 1991): D) Mpulungu sub-basin showing bathymetry and location of MPU-10 and MPU-3 sites in addition to MPU-11 and MPU-12 (Mondeguer, 1991) and the T2 core (Livingstone, 1975).

195
There is a single rainy season in the 231,000 km2 catchment area from November to April
with a mean annual rainfall of 1000-1100mm (Coulter and Spigel, 1991). In this tropical
summer rainfall zone, the northeast and southeast trade winds converge in a low pressure
zone known as the Intertropical Convergence Zone (ITCZ). Rainfall in the region is strongly
influenced by the seasonal migration of the ITCZ to the north and south of the equator (Figure
VI-1 a). When the ITCZ migrates northwards during winter, southern Africa is dominated by
a high pressure cell that surpresses convection of moisture off the Indian Ocean (Lindesay,
1998). South easterly winds predominate during the dry season, resulting in seasonal
upwelling of deep water at the southern end of Lake Tanganyika (Coulter and Spigel, 1991).
During the rainy season, solar heating forces air to rise through convection, resulting in the
African monsoon. The strength of African monsoon and variations of the mean ITCZ position
over tropical Africa were mainly driven by the earths 23 kyr precessional cycle which results
in changes in the amount of solar radiation received at low latitudes (deMenocal et al., 2000;
Tyson and Preston-Whyte, 2000; Baker et al., 2001; Barker et al., 2004)
VIII.2.3. Previous work on climate change and lake levels
A greater understanding of climate variability in the African tropics is needed as the area is a
centre of atmospheric convection which forces regional atmospheric circulation patterns
(Barker, et al., 2004). Major climate forcing factors influencing the region at the glacial-
interglacial time-scale include orbital configurations, the volume of high latitude ice sheets,
and atmosphere, ocean and land surface conditions (Street-Perrott and Perrott., 1990;
Kutzbach and Liu, 1997; Barker et al., 2004).
VIII.2.3.1 Last Glacial Maximum
The hydrological record reconstructed from sediments from tropical African lakes have
shown that most of the East African lakes from the ITCZ region were at a low level (Beuning
et al., 1997; Gasse et al., 1989; Gasse et al., 2002; Barker and Gasse, 2003, Scholz et al.,
2003; Talbot et al., 2006) during the cooler and drier Last Glacial Maximum (LGM). During
the LGM (23-18 ka BP) generally dry conditions prevailed in both hemispheres associated
with lower tropical land and sea surface temperatures. Sedimentological studies from
Tswaing Crater (Pretoria Salt Pan) indicate that whilst enhanced summer rainfall is predicted
due to orbital forcing during the LGM, the grain-size (Partridge et al., 1997) and diatom data
(Metcalfe, 1999) indicate increased aridity. High resolution seismic profiles in Lake

196
Tanganyika indicate a LGM low stand ca. 250-300m below current lake levels (Tiercelin and
Mondeguer, 1991). This is supported by a multi-proxy study of a core from central Lake
Tanganyika where Scholz et al. (2003), from abundances of benthic diatoms, infer that the
lake was about 350 m lower than present during the LGM. South east African lakes Malawi
and Rukwa indicate from diatom records, a negative water balance during the LGM (Johnson
et al., 2004; Barker et al., 2002). Pollen records from Lake Rukwa spanning the last 23 kyr
indicate that between 23 and 20 kyr cal BP vegetation indicates cooler and probably drier
climatic conditions than today (Vincens et al., 2005). Pollen records from cores in the
Mpulungu sub-basin suggest a mean temperature decrease of about 4.2oC and mean annual
precipitation decrease of about 180 mm/yr (Vincens et al., 1993).
However, during the LGM, summer insolation, which is under the control of orbital
precession (Berger, 1978), was at a maximum in the southern tropics, and might normally
have been expected to strengthen the summer African monsoon (Kutzbach and Liu., 1997),
resulting in higher rainfall inland. Recent studies from Lake Masoko have suggested water
levels in this crater basin were higher, reflecting a moister climate locally at this time (Garcin
et al., 2006b). In addition, work conducted at Lake Ngami, situated in NW Botswana has
suggested that this basin, which receives inflow from Angola, was at a highstand during the
LGM (Huntsman-Mapila et al., 2006). Reconstructions of the equatorial river discharge, on
the other hand, indicate significantly lower discharge and dry conditions in the Congo basin
during the LGM (Adegbie et al., 2003; Schefuss et al., 2005).
VIII.2.3.2 Deglacial period
Lake Tanganyika diatom records (Gasse et al., 1989) of MPU 3 and MPU 12 (location shown
in Figure VIII-1 d) suggest that the lake was between 350 – 400 m lower than today at ca. 21
ka and an initial P-E increase between 21 and 15 ka followed by a substantial rise at 15 ka
during the African humid period. These results agree with those of Talbot et al., (2006) who
report marked increase in TOC between 19 and 16.5 ka and 15.5 and 14.5 in the Mpulungu
basin cores MPU-3 and MPU-10. Pollen evidence from two other cores (MPU 11 and MPU
12) from the Mpulungu Basin (Vincens, 1991) suggest a cold episode between 22 and 15 ka
with a woodland vegetation that was limited in distribution and not very diverse. The
woodland cover was scattered and had herbaceous vegetation groundcover. This was
followed by a transitional period until 12 ka. The development of woodland vegetation,
implying an increase in rainfall occurred after 12 ka.

197
In equatorial Africa, significantly wetter conditions followed the LGM which leading to a rise
in water levels in many of the lakes. Most equatorial lakes rose substantially at ca. 15 ka
although in some lakes an earlier humid phase is apparent. Rapid refilling of Lake Victoria
commenced at ca. 15 ka BP (Talbot and Laerdal, 2000) and flow from Lake Victoria via Lake
Albert into the Nile was re-established no later than 14.5 ka (Williams et al., 2006). Talbot et
al., 2006 report major changes in organic matter (OM) composition in Mpulungu cores (Lake
Tanganyika) during and following the period of lake level change. Diatom records from Lake
Rukwa indicate that deep water conditions were reached by 13.5 ka BP (Barker et al., 2002).
VIII.2.3.3 The Younger Dryas cold event (ca. 12.5 – 11.5 kyr)
During the Younger Dryas (YD), event, dry climatic conditions with increased northerly trade
winds prevailed over much of Africa. This resulted in the failure of the African monsoon
which in turn led to lower lake levels in a number of East African lakes at ca. 12.5 – 11.5 ka
cal BP) (Street-Perrott and Perrott, 1990: deMenocal et al., 2000; Gasse, 2000; Peck et al.,
2004). The failure of the African monsoon during the Younger Dryas, was then followed by a
return to more humid climatic conditions leading into the generally more humid Holocene
period (Barker et al., 2004; Johnson et al., 2004; Schefuss et al., 2005).
VIII.2.3.4 The Holocene
Diatom records from Lake Rukwa show that between 11.8 and 6.7 ka cal BP the lake was
deep and fresh (Barker et al., 2002) and may have overflowed into Lake Tanganyika
(Haberyan, 1987). Based on sedimentologic and geochemical analyses of cores from Lake
Edward, Russell et al. (2003) propose a well-mixed, deep waterbody between 11 and
approximately 9 ka BP and increased wetness from approximately 9 to 7.5 ka BP. From 12.1
to 5.5 ka cal BP more humid conditions in Lake Rukwa are confirmed from the pollen record
(Vincens et al., 2005). Barker et al. (2002) report saline conditions from the diatom record of
Lake Rukwa after 5.5 ka cal BP and Russell et al. (2003) report the onset of drier conditions
in Lake Edward from about 5.2 ka BP based on the occurrence of authigenic calcite. From 5.5
ka cal BP drier conditions are also indicated from the pollen record of Lake Rukwa, which
intensify ca. 3.5 ka cal BP towards modern conditions (Barker et al., 2002).
198
VIII.2.4. Description of cores
The two Kullenberg piston cores (MPU-3, 11.19 m and MPU-10, 8.09 m) were collected
from the Mpulungu sub-basin at the southern end of Lake Tanganyika (Figure VI-1 d) in 1985
as part of the Georift project. MPU-3 was retrieved from a water depth of 130 m and MPU-10
from a water depth of 422 m. The MPU-3 core is characterized in the lower part (11.19-7.80
m) by a clastic, quartz-rich, silt-sized facies locally interrupted by diatom-rich laminae
(Figure VIII-2). Transition between clastic and organic facies at 7.80 m on MPU 3
corresponds to a sedimentary discontinuity which was also identified on high–resolution
seismic lines acquired in the Mpulungu sub-basin (Tiercelin et al., 1989). From 7.80 m to the
top of the core, the sediments are laminated, diatom-rich, organic muds. In this paper, we
discuss results from 7.80 m to the top of the core. MPU-10 core, from the deeper water site, is
a dark grey vaguely laminated mud (Mondeguer, 1991) (Figure VIII-2). There are no apparent
discontinuities in the core which spans the period 30 – 7 ka (Talbot et al., 2006). The
uppermost part of the core was lost during coring. For this paper we present results from 23.3
ka to 7 ka which spans the period of transition from the LGM to the Holocene.
Sedimentation in the Lake Tanganyika basin was occasionally interrupted by wind-blown
volcanic ash, interpreted as related to explosive activity in the Rungwe volcanic centre, which
resulted in the formation of thin pinkish yellow layers identified at different depth in the
various cores collected from the Mpulungu sub-basin (Mondeguer, 1991). One particularly
prominent tephra with an age of ca. 13.2 ka is present in all the cores from the Mpulungu sub-
basin (Livingstone, 1975; Tiercelin and Mondeguer, 1991; Talbot et al., 2006).
VIII.2.5. Sampling and analysis
Analyses was performed on bulk mud samples which all had a grain size of < 0.63 µm.
Approximately 1.00000 g of finely ground sample was weighed in a crucible and heated for 2
hours at 1000oC for the determination of loss of ignition (LOI). Major elements were then
measured by inductively coupled plasma-atomic emission spectrometry (ICP-AES) with an
ISA Jobin-Yvon JY 70 Plus apparatus. 230 mg of the sample was digested in 3 ml of
concentrated acid mixture (1:7 HNO3-HF) at 90oC for 2 hours and at 110oC for ¼ hours. All
reagents used were analytical grade. 96 ml of H3BO3 aqueous solution (20g/l H3BO3 and
0.5g/l CsCl) were added to neutralize the excess HF and dissolve the precipitated fluoride,
CsCl acting as a buffer of the ionization phenomena in the flame and the argon plasma. After
a two day complexation process where fluoride complexes as HBF4 a clear solution is

199
obtained. The major elements were determined from the final solution without selective
extraction, with boron being used as an internal standard. Calibrations were performed using
the international standard JB2. Sediment standard LKSD-1 was also analysed to determine the
recovery.

200
Figure VIII 2. MPU-3 and MPU-10 lithology: stratigraphic distribution of the main facies (after Mondeguer, 1991)

201
Trace element measurements were conducted using inductively coupled plasma-mass
spectrometry (ICP-MS). Approximately 0.10000 g of finely ground sample was weighed into
a clean Teflon beaker. 4 ml of H2O2 was added to each beaker and reacted for 2 hrs without
heating and then at 60oC overnight to breakdown the organic matter. 1ml of HNO3 and 3 ml
of HF was added to each beaker and digested overnight at 110oC. Then the acid was allowed
to evaporate. 2 ml of 3N HCl was added to the evaporate and left for approximately 1hr at
80oC with the lid on to re-dissolve all the sample. The solution was transferred to a bottle and
diluted to 40 ml with 3N HCl and 4 drops of HF. The weight of the solution was recorded in
order to be able to calculate dilution factors. Approximately 0.90000 g of the solution was
weighed into a clean Teflon beaker and then 0.07000 g of pure Tm solution was added except
to the blank and the internal standard (BHVO-2 or BEN). This was evaporated at 135oC and
then 5 drops of HNO3 was added followed by 14 ml of H20. The samples were then analysed
using a on a Finnigan Element 2 ICP-MS. Analyses were done at IUEM-UBO.
The chronologies were determined using AMS 14C dating and the age model described in
Talbot et al. (2006).
VIII.2.6. Results
A summary of results for major and trace elements for from MPU-3 and MPU-10 are
presented in Table VIII-1 along with results for LKSD-1. The results indicate poor recovery
of Zr and Hf in LKSD-1, which is attributed to incomplete digestion of Zr and Hf bearing
minerals so these results have been discarded. The value we obtained for Nb on the ICP-MS
differs from the reported value for LKSD-1 (Nb = 7 ppm) although our results were
reproducible (avg = 3.69 ppm , sd = 0.53, n = 6). The standard was then re-analysed by XRF
at IFREMER, Brest and a value of 3.85 ppm was obtained. We believe therefore that our Nb
results are reliable and that the reported value for the standard may be overestimated. Poor or
incomplete mixing of the LKSD-1 powder, especially where Nb-enriched phases occur as
sparse sulphides minerals could be the cause of this (M. Benoit, pers. comm.).

202
Table VIII 1. Geochemical compositional ranges of Lake Tanganyika sediments for selected elements
Sample LKSD-1 std dev LKSD-1 MPU -3 range average MPU-10 Range average avg results reference (n = 36) (n = 23)
SiO2 (%) 39.7 0.02 40.1 54.68 - 72.80 65.22 59.31 - 77.86 66.70 TiO2 0.5 0.00 0.5 0.20 - 0.55 0.40 0.19 - 0.43 0.32 Al2O3 7.6 0.16 7.8 6.42 - 19.55 11.66 5.44 - 12.42 9.54 Fe2O3 4.1 0.04 4.1 1.54 - 3.17 2.38 1.63 - 4.14 2.73 MnO 0.1 0.00 0.1 0.01 - 0.11 0.02 0.01 - 0.06 0.02 MgO 1.8 0.04 1.7 0.23 - 0.48 0.38 0.30 - 0.57 0.40 CaO 11.1 0.04 10.8 0.19 - 1.64 0.48 0.29 - 1.13 0.48 Na2O 1.9 0.04 2 0.09 - 0.99 0.20 0.10 - 0.57 0.24 K2O 1.1 0.03 1.1 0.47 - 1.88 1.36 0.47 - 1.23 0.84 P2O5 0.2 0.01 0.2 0.09 - 0.54 0.18 0.04 - 0.14 0.09 LOI 29.1 0.40 29.9 12.28 - 19.62 15.53 12.92 - 20.36 17.17 Total 96.9 0.10 99.9 82.85 - 100.06 97.82 97.49 - 99.75 98.54 Rb (ppm) 22.3 2.17 24 65.1 - 166.2 108.9 40.9 - 115.0 66.4 U 8.4 0.45 9.7 1.4 - 4.4 2.4 1.5 - 7.0 3.6 Nb 3.7 0.53 7 12.8 - 151.7 51.1 10.6 - 141.6 34.0 Cu 43.8 4.53 44 7.6 - 34.6 19.2 10.8 - 43.0 26.5 Pb 81.3 11.14 82 11.9 - 37.5 19.3 7.3 - 23.2 14.1 Co 10.89 0.75 11 2.4 - 9.0 5.8 3.4 - 12.2 6.6 Zn 376.57 14.45 331 24.6 - 103.6 50.3 38.0 - 122.9 66.5 Ni 16.79 1.23 16 7.2 - 27.7 15.4 8.8 - 51.6 18.4 V 48.42 3.94 50 12.6 - 47.7 27.6 6.6 - 61.9 31.0 Cr 24.91 1.53 31 8.8 - 45.6 25.4 4.6 -31.9 21.2

203
VIII.2.6.1 Major elements
VIII.2.6.1.1 Elements affected by weathering processes
The SiO2 content in the MPU-3 core ranges between 54.68 - 72.80 wt. % (avg. = 65.22 wt. %)
and between 59.31 - 77.86 wt. % (avg. = 66.7 wt. %) in the MPU-10 core. Al2O3 varies between
6.42 - 19.55 wt. % (avg = 11.22 wt. %) and 5.44 -12.42 wt. % (avg. = 9.54 wt. %) in MPU-3 and
MPU-10 respectively and is negatively correlated with SiO2 (r2 = .69). In plots against Al2O3 (not
shown), the oxides TiO2, Fe2O3, MgO and K2O and to a lesser extent, P2O5 and MnO show a
correlation, indicating that they are associated with micaceous/clay minerals in the sediments.
The samples from both cores are all enriched in SiO2 with respect to the upper continental crust
(UCC) and post-Archaean Australian shales (PAAS) (Taylor and McLennan, 1985; 1995; Plank
and Langmuir, 1998). All samples are depleted in MgO, K2O, Na2O and CaO (with the exception
of a sample at the top of the MPU-3 core). This is an indication of sediment from weathered
source areas.
Ti is often contributed by heavy minerals such as rutile and anatase and the ratio of Ti/Al has
been used to reflect grain size and consequently the strength of transport processes (Zabel et al.,
1999; Meyers et al., 2001). K is usually associated with potassium feldspar or illite and the
presence of either is representative of lower rates of chemical weathering suggesting arid
conditions where physical weathering predominates. Feldspar and illite are relatively reduced in
sediments from humid periods as the formation of kaolinite occurs. A depletion of potassium in
sediments can be used therefore as an index of the chemical maturity of sediments and
consequently a proxy for the intensity of chemical weathering (Schneider et al., 1997; Zabel et
al., 2001).
Ti/Al and K/Al show strikingly similar distributions (Figure VIII-3 a and b). Similar patterns
were reported by Schneider et al. (1997) in a study on Zaire (Congo) sediment load and by Zabel
et al. (2001) in a study on sediment input to the Niger Fan. The ratio of Ti/Al of the Lake
Tanganyika sediments ranges between 0.027 - 0.049 (avg. = 0.039) for MPU-3 and 0.031 - 0.045
(avg. = 0.039) for MPU-10. Results for both cores are in good agreement. Results indicate fairly
elevated but unstable Ti/Al for the late Pleistocene in Lake Tanganyika up until ca. 18 ka where
values become more stable. Values decline rapidly at 13.0 ka above the ash layer, until 12.1 ka
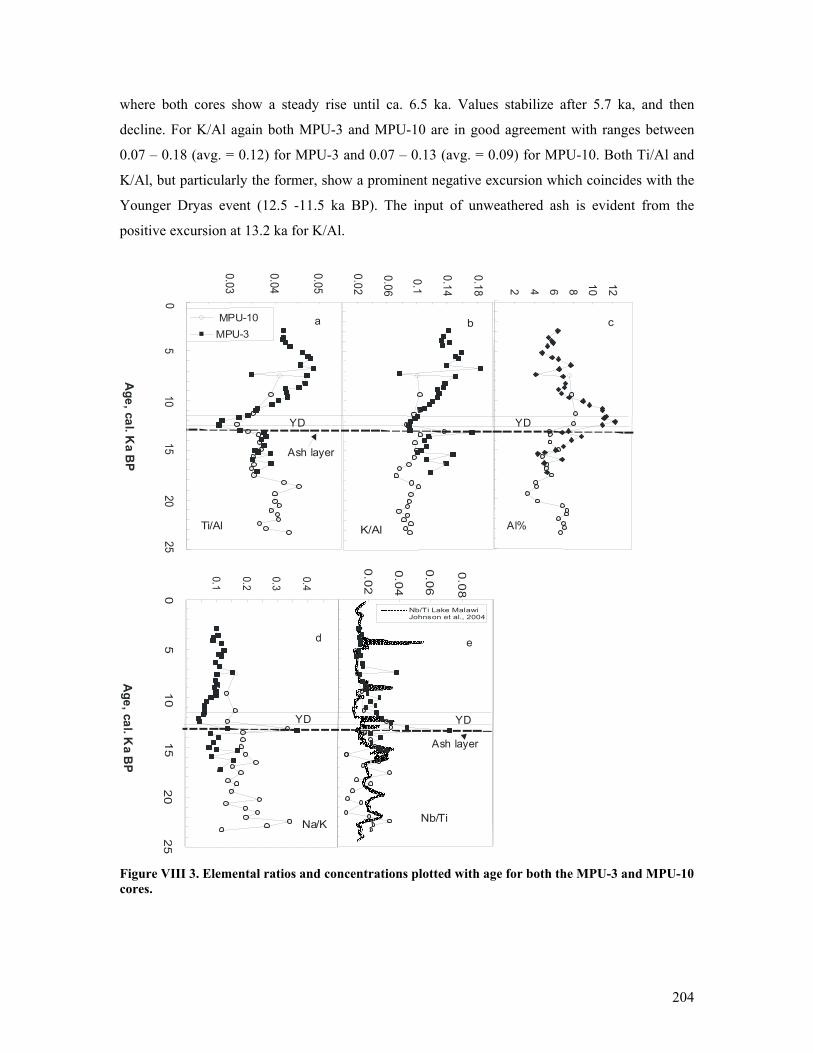
204
where both cores show a steady rise until ca. 6.5 ka. Values stabilize after 5.7 ka, and then
decline. For K/Al again both MPU-3 and MPU-10 are in good agreement with ranges between
0.07 – 0.18 (avg. = 0.12) for MPU-3 and 0.07 – 0.13 (avg. = 0.09) for MPU-10. Both Ti/Al and
K/Al, but particularly the former, show a prominent negative excursion which coincides with the
Younger Dryas event (12.5 -11.5 ka BP). The input of unweathered ash is evident from the
positive excursion at 13.2 ka for K/Al.
0.03
0.04
0.05
05
1015
2025
MPU-10 MPU-3
Ti/Al
Age , ca l. K
a BP
Age , ca l. K
a BP
05
1015
2025
a
0.02
0.04
0.06
0.08
Nb/Ti Lake MalawiJohnson et al., 2004
Nb/Ti
Ash layer
0.1
0.2
0.3
0.4
Na/K
d e
0.02
0.06
0.1
0.14
0.18b
K/Al
2 4 6 8 10 12
Ash layer
Al%
YDYD
YDYD
c
Figure VIII 3. Elemental ratios and concentrations plotted with age for both the MPU-3 and MPU-10 cores.

205
VIII.2.6.1.2 Indicators of relative abundance of volcaniclastic debris in sediments
Ratios of Na/K given an indication of changes of input of volcanic ash, (sodium) – which reflects
aeolian delivery relative to detrital flux such as potassium input as illite (Dean and Arthur, 1998).
Na/K ratios for the MPU-3 core range between 0.04 – 0.37 (avg. = 0.11) and for MPU-10
between 0.09 – 0.52 (avg. = 0.17). The positive excursions for the Na/K ratio agree well with the
ash layer at 13.2 ka (Figure VIII-3 d). It is interesting to note that positive excursion of Na/K at
22.4 ka, 16.5 ka and 7.4 ka correspond exactly with negative excursions in the Ti/Al ratio which
supports the idea that Na/K reflects windblown ash and Ti/Al reflecting sediment transported by a
hydrogenous source. In addition, the marked steady rise in Ti/Al after 12.1 ka is reflected by
generally low Na/K values.
VIII.2.6.2 Trace elements
VIII.2.6.2.1. Indicators of relative abundance of volcaniclastic debris in sediments
Niobium is an incompatible element which becomes concentrated in magma and not in silicate
minerals. Elevated Nb concentrations are found in the volcanic ash from eruptions and within
weathered ash. Nb/Ti ratios for both cores are in good agreement, with Nb/Ti between 0.01 – 0.07
(avg. = 0.02) for MPU-3 and between 0.005 – 0.08 (avg. = 0.02) for MPU-10. Results indicate
clear positive excursions corresponding to the ash layer at 13.2 ka with additional positive
excursion at ca. 22.4, 17.6, 16.5, 10.0 and 7.4 ka. Values are noisy for the late Pleistocene with
low values (0.005) interspersed with positive excursions. After the ash layer at 13.2 ka, values
drop off slowly and stabilize during the Holocene at 6.7 ka to average values of 0.014. The values
show a roughly anti-phase relationship between Nb/Ti data from Lake Malawi (Johnson et al.,
2004) (Figure VI- 4 e) more apparent in the record between 23 – 13.5 ka. It should be noted
however that the Lake Malawi record has a much higher resolution and that some of our peaks
are based on a single point.
VIII.2.6.2.2. Indicators of redox conditions
Reconstructing palaeoredox conditions is an attempt to determine whether conditions in the
depositional sedimentary basin were oxidizing or reducing. Reducing conditions in a water
column arise from one or more of the following 1) minimal lateral circulation in a deep water
column; 2) thermohaline stratification and 3) levels of primary production that result in an oxygen

206
demand that exceeds renewal (Cruse and Lyons, 2004). Well-oxygenated surface waters are
separated from anoxic or anoxic-sulfidic (euxinic) deeper waters by a transition zone called the
chemocline. Oxic conditions were defined by Tyson and Pearson (1991) as having > 2 ml O2/l
H2O in the bottom waters. Suboxic is defined as having 2 > O2 > 0.2. In anoxic conditions, O2 is
< 0.2 and no free H2S is present. In euxinic conditions, free H2S is present in the water column
and O2 = 0 ml O2/l H2O (Tyson and Pearson, 1991).
Metals that occur as minor and trace elements in clastic sediments may become concentrated by
precipitation under appropriate redox conditions and thus have redox-proxy potential. These
include Cu, Fe, Mo, U, Pb, Co, Zn, Ni, V and Cr (Sageman et al., 2003). Trace element ranges
and averages are higher in the MPU-10 core with the exception of Pb and Cr. The Cu values
range between 7.6 – 34.6 ppm (avg. = 19.2 ppm) for MPU-3 and between 10.8 – 43.0 (avg. =
26.5) for MPU-10. For Fe, values range between 1.85 – 3.94 wt. % (avg. – 2.9 wt. %) for MPU-3
and 1.88 – 5.21 wt. % (avg. = 3.06 for MPU-10). For Mo, the range of values for MPU-10 are
0.13 – 2.1 ppm (avg. = 0.74 ppm). For U, values are 1.4 – 4.4 ppm (avg. = 2.4 ppm) for MPU-3
and 1.5 – 7.0 ppm (avg. 3.8 ppm) for MPU-10. For Pb, in MPU-3 values range between 11.9 –
37.5 ppm (avg. = 19.3 ppm) and between 7.3 – 23.2 ppm (avg. = 14.1 ppm) for MPU-10. Co
values range between 2.4 – 9.0 ppm (avg. = 5.8 ppm) in MPU-3 and between 3.4 – 12.2 ppm
(avg. = 6.6 in MPU-10). Zn concentrations in MPU-3 range between 24.6 – 103.6 ppm (avg. =
50.3 ppm) and 38.0 -122.9 ppm (avg. = 66.5 ppm) for MPU-10. Ni values for MPU-3 are
between 7.2 – 27.7 ppm (avg. = 15.4 ppm) for MPU-3 and between 8.8 – 51.6 ppm (avg. = 18.4
ppm) for MPU-10. V ranges between 12.6 – 47.7 ppm (avg. = 27.6 ppm) for MPU-3 and between
6.6 – 61.9 ppm (avg. = 31.0 ppm) for MPU-10. Cr ranges between 8.7 – 45.6 ppm (avg. = 25.5
ppm) for MPU-3 and between 4.6 – 39.1 ppm (avg. = 19.8 ppm) for MPU-10.
In order to look at the palaeoredox potential of the trace metals in the Mpulungu sub-basin
sediments, it was necessary to eliminate those metals which had an over-riding non-hydrogenous
source. For the Mpulungu sub-basin that would mean primarily the detrital and volcanoclasitc
flux. A fraction of the trace-metal content of most sediments is of detrital origin. To determine
which trace elements are predominantly controlled by detrital flux, we tested the correlation of
these elements (at a 5 % confidence limit) versus aluminium and titanium, both of which are
usually strongly detrital and immobile during diagenesis. In addition, to test the control by
volcaniclasitc debris, we tested the correlation of these elements versus the Nb/Ti ratio.
207
In the MPU-3 core, the overwhelming majority of the elements tested (U, V, Cr, Co, Ni, Cu, and
Pb) showed a significant correlation with Ti (U r2 = 0.56, V r2 = 0.66, Cr r2 = 0.65, Co r2 = 0.49,
Ni r2 = 0.68, Pb r2 = 0.53 (n = 36)) and Al (U r2 = 0.51, V r2 = 62, Cr r2 = 0.57, Co r2 = 0.44, Ni r2
= 0.63, Cu r2 = 0.54, Pb r2 == 0.50 (n = 36)) which suggests that detrital flux controls the
concentration of these elements at the shallow water site. In addition, Pb, U, Zn and Mn showed
significant correlation with the Nb/Ti ratio (Pb r2 = 0.38, U r2 = 0.53, Zn r2 = 0.47, Mn r2 = 0.74
(n = 36)) indicating that the input of volcanoclastic material controls the concentrations of these
elements. The only element to show a significant correlation with (total organic carbon) TOC at
this shallow water site is Zn (r2 = 0.33, n = 36). Therefore, one must conclude that the MPU-3
record has limited use in palaeoredox reconstructions.
In the MPU-10 core, the only element to show a significant correlation with TOC and a non-
significant correlation with Ti, Al and Nb/Ti is V (TOC r2 = 0.53). The elements U and Mo show
a significant positive correlation with TOC (U r2 = 0.49, Mo r2 = 0.46, n = 23) in addition to
significance to Ti and Al for U and Nb/Ti for Mo. All these elements have been plotted on Figure
VIII-4. There is a mild significant correlation between Mo and V (r2 = 0.46, n = 23) and positive
excursion of V are generally accompanied by an excursion in Mo. This has implications on the
redox conditions as discussed later.
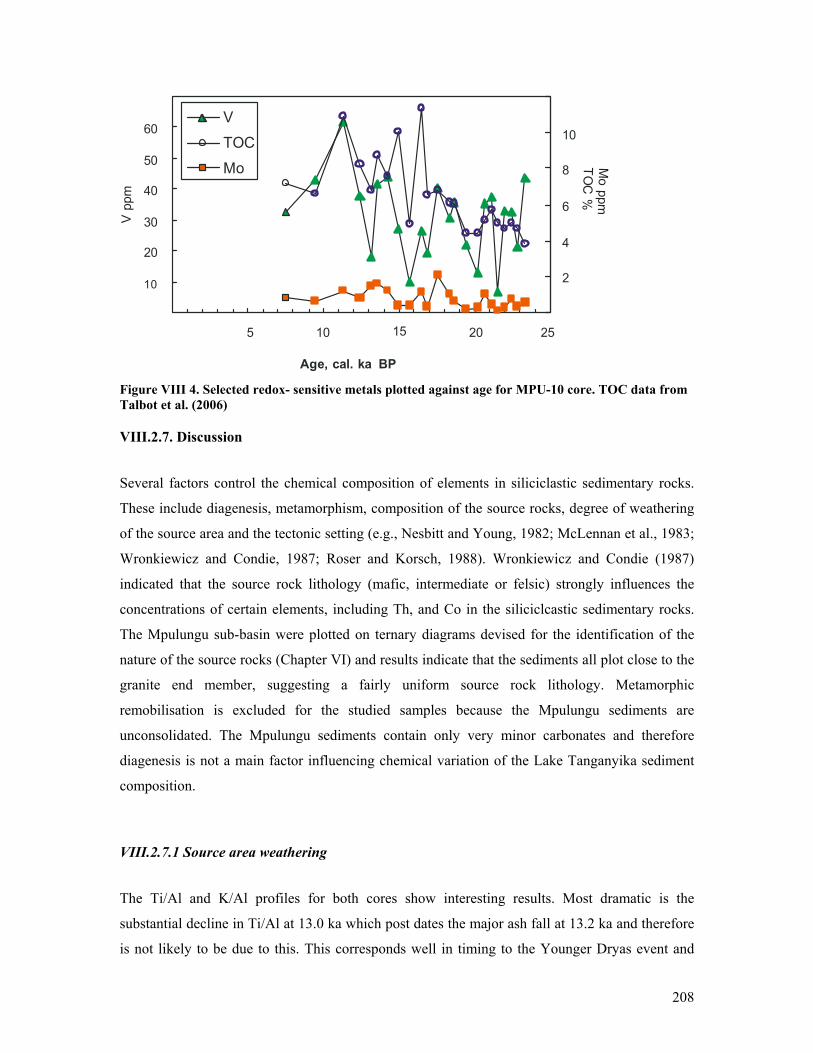
208
10
20
30
40
50
60
5 10 15 20 25
Age, cal. ka BP
2
4
6
8
10V
TOC
Mo
V p
pm
Mo ppm
TOC
%
Figure VIII 4. Selected redox- sensitive metals plotted against age for MPU-10 core. TOC data from Talbot et al. (2006)
VIII.2.7. Discussion
Several factors control the chemical composition of elements in siliciclastic sedimentary rocks.
These include diagenesis, metamorphism, composition of the source rocks, degree of weathering
of the source area and the tectonic setting (e.g., Nesbitt and Young, 1982; McLennan et al., 1983;
Wronkiewicz and Condie, 1987; Roser and Korsch, 1988). Wronkiewicz and Condie (1987)
indicated that the source rock lithology (mafic, intermediate or felsic) strongly influences the
concentrations of certain elements, including Th, and Co in the siliciclcastic sedimentary rocks.
The Mpulungu sub-basin were plotted on ternary diagrams devised for the identification of the
nature of the source rocks (Chapter VI) and results indicate that the sediments all plot close to the
granite end member, suggesting a fairly uniform source rock lithology. Metamorphic
remobilisation is excluded for the studied samples because the Mpulungu sediments are
unconsolidated. The Mpulungu sediments contain only very minor carbonates and therefore
diagenesis is not a main factor influencing chemical variation of the Lake Tanganyika sediment
composition.
VIII.2.7.1 Source area weathering
The Ti/Al and K/Al profiles for both cores show interesting results. Most dramatic is the
substantial decline in Ti/Al at 13.0 ka which post dates the major ash fall at 13.2 ka and therefore
is not likely to be due to this. This corresponds well in timing to the Younger Dryas event and

209
shows that in terms of palaeoclimate, the YD event was the most prominent event between 23 ka
to 3 ka BP. Both the Ti/Al and K/Al show very similar time distributions and we interpret the
trends in element/Al ratios as do Schneider et al. (1997) where variations are due to the kaolinite
and feldspar flux rather than grain size variations in the terrestrial input. One must note that
during the YD event, both Ti/Al and K/Al fall drastically, indicating the input of more weathered
source material. By 11.2 ka, both Ti/Al and K/Al rise rapidly, reaching a plateau at ca. 6.5 ka.
These results suggest that during the dry Younger Dryas event the material being delivered to the
basin is from a more weathered source and during the more humid Holocene up until 6.5 ka, the
material is derived from a less weathered source. In order to attempt to interpret these results, one
must not only consider detrial fluvial input into the basin but also vegetation cover and erosion
processes in the basin. Vincens (1991) from a study on the MPU-11 and MPU-12 core describes
the period between 15 and 12 ka BP as a period of expansion of wooded communities around
Lake Tanganyika which reach their maximum expansion only after 12 ka BP. Garcin et al.
(2006a) describes that from 15 ka BP to between 13.4 and 12 ka BP, arboreal cover developed in
the Masoko catchment (9o20.0’S, 33o45.3’E) possibly suggesting a shorter or less severe dry
season during this phase. At ca. 11.7 ka BP, Garcin et al. (2006a) report an abrupt change in
vegetation cover to a semi-deciduous more sparse vegetation cover indicating the establishment
of a more pronounced seasonality at this time which remained throughout the early Holocene.
Our data may well be reflecting the fact that during more humid periods, the increased tree cover
would limit soil erosion through enhanced soil stability, resulting in less physical weathering but
more pronounced chemical weathering (Kauppila and Salonen, 1997; White et al., 1999; Ding et
al., 2001; Singh and Rajamanni, 2001). The sparser vegetation of drier periods would enhance
physical weathering leading to the erosion and transport into the basin of material chemically
weathered during the previous wet phase.
VIII.2.7.2 Palaeoclimatic conditions determined from volcanic ash in sediment
Elevated Nb/Ti levels in the Lake Tanganyika sediments are interpreted to reflect stronger south-
east winds as volcanic ash or its weathered residue is transported from the Rungwe volcanics into
the lake basin. Similar work has been conducted in Lake Malawi (Johnson et al., 2004), with
elevated Nb/Ti in this case interpreted to reflect more frequent or stronger northerly winds. Lake
Tanganyika is exposed to northerly winds in austral summer, when the ITCZ has migrated to its
southern position and southerly winds in austral winter when the ITCZ migrates northwards. The
results from Lake Tanganyika and Lake Malawi, when plotted together (Figure VIII-3 e) show a

210
rough antiphase relationship which is used in our interpretation. Our results suggest that in the
late Pleistocene, until ca 15.4 ka, fairly unstable conditions prevailed, with changing wind
directions but more frequent north winds particularly between 21.5 – 18.3 ka (LGM). This is
supported by results from Johnson et al., 2004 who also report a predominance of north winds
suggesting the migration of the ITCZ further southward or that it remained in the southern
terminus longer, during the late Pleistocene. This would mean that a southward excursion of the
ITCZ occurred during past northern hemisphere cold periods (Johnson et al., 2004). This
southward excursion should imply that Tanganyika would experience longer summer rains and
therefore have been at a highstand during the LGM. Johnson et al., 2004 suggest that the vertical
convection associated with the ITCZ could be weakened during these periods, leading to less
rainfall. During the humid deglacial period, both north and south winds blew over the basin, as
suggested by the fluctuating Nb/Ti ratios which would have brought, the north winds in
particular, more rain to the catchment area. From the time of the major ash fall at 13.2 ka to ca 11
ka, which covers the Younger Dryas event, our records show Nb/Ti ratios that are diminishing
with time. During the Younger Dryas event, low lake levels have been observed in a number of
African lakes which has been interpreted as resulting from dry climatic conditions with increased
north tradewinds (Street-Perrott and Perrott, 1990; deMenocal et al., 2000; Gasse, 2000). The
very high peak at 13.2 ka representing the major ash fall followed by diminishing values could in
fact be reflecting erosion and river transport of ash falls deposited on land as the whole area
between southern Lake Tanganyika and northern Lake Malawi were covered in ash from this
eruption. The Holocene sediments show a more stable and relatively low pattern for Nb/Ti value
than for the late Pleistocene with the exception of an input of volcanic ash at 7.4 ka. This stable
pattern could reflect a general return to predominantly north winds during this humid period.
VIII.2.7.3 Redox conditions
Of the trace elements, Cr, U and V can be reduced and precipitate under anoxic conditions and
the other elements Ni, Co, Cu, Zn, Cd and Mo accumulate predominantly under sulphate-
reducing conditions (Tribovillard et al., 2006). In this work, we only use trace metal data from the
MPU-10 core as the other core had an overwhelming influence of detrital flux on trace element
composition. The fact that V enrichments are generally accompanied by Mo enrichment would
suggest that euxinic conditions have prevailed in Mpulungu sub-basin at the sediment-water
interface throughout the Late Pleistocene and Holocene. This has particular implications for the
LGM, as even points at ca. 23 ka show this trend. This would suggest that water levels in Lake

211
Tanganyika did not drop sufficiently to develop oxic-anoxic conditions at this deeper water site.
If water in Lake Tanganyika is reported to be permanently anoxic at depths of greater than 240 m
and the MPU-10 site has a present day depth of 422 m, this would suggest that the water level
would have dropped closer to 200 - 300 m during the LGM in order to maintain euxinic
conditions even at this time, although during the LGM, the cooler climate and stronger winds
may have led to decreased stability of the water column. A drop of closer to 350 - 400 m as
suggested by from diatom records of Gasse et al. (1989) may lead to oxic conditions developing.
The MPU-3 site, at a current water depth of 130 m, is not sufficiently deep for the accumulation
of redox sensitive metals.
VIII.2.8. Conclusions
Geochemical proxies of lake sediments are shown here to provide convincing evidence for past
climate-induced environmental changes in the southern Tanganyika basin. In particular that:
1) the Lake Tanganyika sediments from the MPU-3 and MPU-10 core represent sediments
originating from moderate to strongly weathered source material typical of a tropical climate
zone. The input of unweathered volcanic ash comes from air-borne volcanic ash linked to
explosive activity in the Rungwe volcanic centre;
2) the Ti/Al flux has been interpreted as variations due to the kaolinite and feldspar flux rather
than grain size variations in the terrestrial input. During the YD event, both Ti/Al and K/Al fall
drastically, indicating the input of more weathered source material. By 11.2 ka, both Ti/Al and
K/Al rise rapidly, reaching a plateau at ca. 6.5 ka. These results reflect the fact that during more
humid periods, the increased tree cover would limit soil erosion through enhanced soil stability,
resulting in less physical weathering but more pronounced chemical weathering. The sparser
vegetation of drier periods would enhance physical weathering leading to the erosion and
transport into the basin of material chemically weathered during the previous wet phase.
3) redox sensitive trace elements at the shallow MPU-3 site are ultimately controlled by detrital
flux and therefore have limited use in palaeoredox reconstruction. The MPU-10 deeper water site
suggests that even during the LGM, euxinic conditions were maintained. This suggests that the
water did not fall much below 200 – 300 m during this time
212
4) Nb/Ti results suggest that in the late Pleistocene, until ca 15.4 ka, fairly unstable conditions
prevailed, with changing wind directions but more frequent north winds particularly between 21.5
– 18.3 ka (LGM). From the time of the major ash fall at 13.2 ka to ca 11 ka, which covers the
Younger Dryas event, our records show Nb/Ti ratios that are diminishing with time. The very
high peak at 13.2 ka representing the major ash fall followed by diminishing values could in fact
be reflecting erosion and river transport of ash falls deposited on land as the whole area between
southern Lake Tanganyika and northern Lake Malawi would have been covered in ash from this
eruption. The Holocene sediments show a more stable and relatively low pattern for Nb/Ti value
than for the late Pleistocene with the exception of an input of volcanic ash at 7.4 ka. This stable
pattern could reflect a general return to predominantly north winds during this humid period.
Acknowledgements PH-M would like to acknowledge the University of Botswana for financial support and Claire
Bassoullet for guidance in the laboratory and for insightful discussions on the Nb data. Joël
Etoubleau is acknowledged for conducting the Nb analysis at IFREMER.
References Adegbie, A.T., Schneider, R.R., Röhl, U., Wefer, G., 2003. Glacial millennial-scale fluctuations
in central African precipitation recorded in terrigenous sediment supply and freshwater signals offshore Cameroon. Palaeogeography, Palaeoclimatology Palaeoecology 197, 323-333.
Baker, P.A., Rigsby, C.A., Seltzer, G.O., Fritz, S.C., Lowenstein, T.K., Bacher, N.P., Veliz, C., 2001. Tropical climate changes at millennial and orbital timescales on the Bolivian Altiplano. Nature 409, 698-701.
Barker, P., Telford, R., Gasse, F., Thevenon, F., 2002. Late Pleistocene and Holocene palaeohydrology of lake Rukwa, Tanzania, inferred from diatom analysis. Palaeogeography, Palaeoclimatology, Palaeoecology 187, 295-305.
Barker, P., Gasse, F., 2003. New evidence for a reduced water balance in East Africa during the Last Glacial Maximum; implication for model-data comparison. Quaternary Science Reviews 22, 823-837.
Barker, P.A., Talbot, M.R., Street-Perrott, F.A., Marret, F., Scourse, J., Odada, E.O., 2004. Late Quaternary climatic variability in intertropical Africa. In: R.W. Battarbee, F. Gasse and C.E. Stickley (eds). Past climate variability through Europe and Africa. Springer, Dordrecht.pp. 117-137.
Barrat, J.A., Boulègue, J., Tiercelin, J-J., Lesourd, M., 2000. Strontium isotopes and rare earth element geochemistry of hydrothermal carboante deposits from lake Tanganyika, East Africa. Geochimica et Cosmochimica Acta 64, 2, 287-298.
Berger, A., 1978. Long-term variations of caloric insolation resulting from the earth’s orbital elements. Quaternary Research 9, 139-167.
Beuning, K.R.M., Talbot, M.R., Kelts, K., 1997. A revised 30,000-year paleoclimatic and paleohydrologic history of Lake Albert, East Africa. Palaeogeography, Palaeoclimatolgy, Palaeoecology 136, 259-279.

213
Bonnefille, R., Riollet, G., Buchet, G., 1991. Nouvelle séquence pollinique d’une tourbière de la crête Zaire-Nil (Burundi). Review of Palaeobotany and Palynology 67, 315-330.
Casanova, J., Hillaire-Marcel, C., 1992. Late Holocene hydrological history of Lake Tanganyika, east Africa, from isotopic data on fossil stromatolites. Palaeogeography, Palaeoclimatology, Palaeoecology 91, 35-48.
Cohen, 1989. Facies relationships and sedimentation in large rift lakes and implications for hydrocarbon exploration: Examples from Lakes Turkana and Tanganyika. Palaeogeography, Palaeoclimatology, Palaeoecology 70, 65-80.
Coulter, G.W., Spigel, R.H., 1991. Hydrodynamics. . In: Coulter G.W. (ed), Lake Tanganyika and its life. Oxford University Press, Oxford, pp. 49-75.
Cruse, A.M., Lyons, T., 2004. Trace metal records of regional paleoenvironmental variability in Pennsylvanian (Upper Carboniferous) black shales. Chemical Geology 206, 319-345.
Degens, E., Von Herzen, R., Wong, H.K., 1971. Lake Tanganyika: Water Chemistry, sediments, geological structure. Naturwissenschaften 58, 229-241.
deMenocal, P., Ortiz, J., Guilderson, T., Adkins, J., Sarnthein, M., Baker, L., Yarusinsky, M., 2000. Abrupt onset and termination of the African humid Period: rapid climate responses to gradual insolation forcing. Quaternary Science Reviews 19, 347-361.
Ding, Z.L., Sun, J.M., Yang, S.L., Liu, T.S., 2001. Geochemistry of the Pliocene red clay formation in the Chinese Loess Plateau and implications for its origin, source provenance and paleoclimate change. Geochimica Cosmochimica Acta 65 (6), 901-913.
Ebinger, C.J., Deino, A.L., Drake, R.E., Tesha, A.L., 1989. Chronology of volcanism and rift basin propogation: Rungwe volcanic province, East Africa. Journal of Geophysical Research 94, 15785-15803.
Garcin, Y., Vincens, A., Williamson, D., Buchet, G., Guiot, J., 2006a. Abrupt resumption of the African Monsoon at the Younger Dryas-Holocene climatic transition. Quaternary Science Reviews (submitted article).
Garcin, Y., Williamson, D., Taieb, M., Vincens, A., Mathe, P., Majule, A., 2006b. Centennial to millennial changes in lake deposition during the last 45,000 years in Tropical Southern Africa (Lake Masoko, Tanzania). Palaeogeography, Palaeoclimatology, Palaeoecology 239 (3-4), 334-354.
Gasse, F., Lédée, V., Massault, M., Fontes, J.Ch., 1989. Water-level fluctuations of Lake Tanganyika in phase with oceanic changes during the last glaciation and deglaciation. Nature 342, 57-69.
Gasse, F., Van Campo, E., 1998. A 40,000 yrs pollen and diatom record from southern tropics Lake Tritrivakely, Madagascar Plateaux). Quaternary Research 49, 299-311.
Gasse, F., 2000. Hydrological changes in the African tropics since the Last Glacial Maximum. Quaternary Science Reviews 19, 189-211.
Gasse , F., Barker, P., Johnson,T.C., 2002. A 24,000 yr diatom record from the northern basin of Lake Malawi. In: Odada E.O., and Olago, D.O. (eds), The East African Great lakes: Limnology, Palaeolimnology and Biodiversity. Dordrecht, Kluwer, pp. 393-414.
Grand atlas du continent Africain 1973. Première éditions. Editions Jeune Afrique. Haberyan, K.A., 1987. Fossil diatoms and the history of Lake Rukwa, Tanzania. Freshwater
Biology 17, 429-436. Haberyan, K.A., Hecky, R.E., 1987. The late Pleistocene and Holocene stratigraphy and
paleolimnology of lakes Kivu and Tanganyika. Palaeogeography, Palaeoclimatology, Palaeoecology 61, 169-197.
Harkin, D.A., 1960. The Rungwe volcanics at the northern end of Lake Nyasa. Mem. Geol. Surv. Tanganyika, II: 172pp.
Hecky, R.E., 1978. The Kivu-Tanganyika basin: the last 14,000 years. Pol. Arch. Hydrobiol., 25: 159-165.

214
Huntsman-Mapila, P., Huntsman-Mapila, P., Ringrose, S., Mackay, A.W., Downey, W.S., Modisi, M., Coetzee, S.H., Tiercelin, J-J., Kampunzu, A.B., Vanderpost C., 2006. Use of the geochemical and biological sedimentary record in establishing palaeo-environments and climate change in the Lake Ngami basin, NW Botswana. Quaternary International 148, 51-64.
Johnson, T.C., Brown, E.T., McManus, J., 2004. Diatom productivity in northern Lake Malawi during the past 25,000 years: implications for the position of the intertropical convergence zone at millennial and shorter time scales. In: R.W. Battarbee, F. Gasse and C.E. Stickley (eds). Past climate variability through Europe and Africa. Springer, Dordrecht. pp. 93-115.
Kauppila, T., and Salonen, V.-P. 1997. The effect of Holocene treeline fluctuations on the sediment chemistry of Lake Kilpisjarvi, Finland. Journal of Paleolimnology 30: 291-296.
Kutzbach, J.E., Street-Perrott, F.A., 1985. Milankovitch forcing of fluctuations in the level of tropical lakes from 18 to 0 kyr BP. Nature 317, 130-134.
Kutzbach, J.E. , Liu, Z., 1997. Response of the African monsoon to orbital forcing and ocean feedbacks in the middle Holocene. Science 278: 440-443.
Livingstone, D.A., 1975. Late Quaternary climatic change in Africa. Review of Ecology and Systematics 6, 249-280.
Lindesay, J.A., 1998. Present climates of Southern Africa. In: Hobbs, J.E., Lindesay, J.A., and Bridgeman, H.A., (eds), Climates of the Southern Continents: Present, Past and Future. John Wiley and Sons, New York, pp. 5-62.
Lyons, T.W., Werne, J.P., Hollander, D.J., Murray, R.W., 2003. Contrasting sulphur geochemistry and Fe/Al and Mo/Al ratios across the last oxic-to-anoxic transition in the Cariaco Basin, Venezuela. Chemical Geology 195, 131-157.
McLennan, S.M., Taylor, S.R., Eriksson, K.A., 1983. Geochemistry of Archean shales from the Pilbara Supergroup, Western Australia. Geochimica Cosmochimica Acta 47, 1211-1222.
Metcalfe, S.E., 1999. Diatoms from the Pretoria Salt Pan- a record of lake evolution and environmental change. In: Partridge, T.C. (ed.), Investigations into the origin, age and palaeoenvrionments of the Pretoria Saltpan. Geological Survey of South Africa. pp. 192-192.
Meyers, S., Sageman, B., Hinnov, L., 2001. Integrated quantitative stratigraphy of Cenomanian-Turonian Bridge Creek Limestone Member using evolutive harmonic analysis and stratigraphic modelling. Journal of Sedimentary Research 71, 628-644.
Mondeguer, A., Ravenne, C., Masse, P., Tiercelin, J.J., 1989. Sedimentary basin in an extension and strike-slip background : the South Tanganyika troughs complex, East African Rift. Bull. Soc. Geol. Fr., 8 (3), 501-522.
Mondeguer, A., 1991. Bassin sedimentaires en contexte extensive et decrochant: L’example du “Complexe des fosses sud-Tanganyika”, Rift Est- Africain. Morphostructure et sedimentation. PhD thesis. L’Universite de Bretagne Occidentale.
Nesbitt, H.W., Young, G.M., 1982. Early Proterozoic climates and plate motions inferred from major element chemistry of lutites. Nature 299, 715-717.
Nesbitt, H.W., Young, G.M., 1984. Prediction of some weathering trends of plutonic and volcanic rocks based on thermodynamic and kinetic considerations. Geochimica Cosmochimica Acta 48, 1523-1534.
Nesbitt, H.W., Young, G.M., 1989. Formation and diagenesis of weathering profiles. Journal of Geology 97, 129-147.
Nesbitt, H.W., Young, G.M., McLennan, S.M., Keays, R.R., 1996. Effect of chemical weathering and sorting on the petrogenesis of siliciclastic sediments, with implications for provenance studies. Journal of Geology 104, 525-542.

215
Partridge, T.C., de Menocal, P.B., Lorentz, S.A., Paiker, M.J., and Vogel, J.C., 1997. Orbital forcing of climate over South Africa : A 200,000 year rainfall record from the Pretoria Saltpan. Quaternary Science Reviews 16, 1125-1133.
Peck, J.A., Green, R.R., Shanahan, T., King, J.W., Overpeck, J.T., Scholz, C.A., 2004. A magnetic mineral record of Late Quaternary tropical climate variability from Lake Bosumtwi, Ghana. Palaeogeography, Palaeoclimatology, Palaeoecology 215, 37-57.
Plank, T., Langmuir, C.H., 1998. The chemical composition of subducting sediment and its consequences for the crust and mantle. Chemical Geology 145, 325-394.
Roser, B.P., Korsch, R.J., 1988. Provenance signatures of sandstone-mudstone suites determined using discriminant function analysis of major-element data. Chemical Geology 67, 119-139.
Russell, J.M., Johnson, T.C., Kelts, K., Laerdal, T., Talbot, M.R., 2003. An 11000-year lithostratigraphic and paleohydrologic record from Equatorial Africa: Lake Edward, Uganda-Congo. Palaeogeography, Palaeoclimatology, Palaeoecology 193, 25-49.
Russell, J.M., Johnson, T.C., 2005. A high resolution geochemical record from Lake Edward, Uganda, Congo and the timing and causes of tropical African drought during the late Holocene. Quaternary Science Reviews 24, 1375-1389.
Russell, J.M., Johnson, T.C., 2006. The water balance and stable isotope hydrology of lake Edward, Uganda-Congo. Journal of Great Lakes Research 32 (1), 77-90.
Sageman, B.B., Murphy, A.E., Werne, J.P., Ver Straeten, C.A., Hollander, D.J., Lyons, T.W., 2003. A tale of shales: the relative role of production, decomposition, and dilution in the accumulation of organic-rich strata, Middle-Upper Devonian, Appalachian Basin. Chemical Geology 195, 229-273.
Schefuss, E., Schouten, S., Schneider, R.R., 2005. Climatic controls on central African hydrology during the past 20, 000 years. Nature 437, 1003-1006.
Schneider, R.R., Price, B., Muller, P.J., Kroon, D., Alexander, I., 1997. Monsoon related variations in Zaire (Congo) sediment load and influence of fluvial silicate supply on marine productivity in the east equatorial Atlantic during the last 200,000 years. Paleoceanography 12 (3) 463-481.
Scholz, C.A., Rosendahl, B.R., 1988. Low lake stands in lakes Malawi and Tanganyika, East Africa, delineated with multifold seismic data. Science 240, 1645-1648.
Scholz, C.A., King, J.W., Ellis, G.S., Swart, P.K., Stager, J.C., Colman, S.M., 2003. Paleolimnology of Lake Tanganyika, East Africa over the past 100 k yr. Jounral of Paleolimnology 30, 139-150.
Singh, P., Rajamani, V., 2001. REE geochemistry of recent clastic sediments from the Kaveri floodplains, southern India: Implication to source area weathering and sedimentary processes. Geochim. Cosmochim. Acta 65 (18), 3093-3108.
Street-Perrott, F.A., Perrott, R.A., 1990. Abrupt climate fluctuations in the tropics-the influence of Atlantic Ocean circulation. Nature 343, 607-612.
Talbot, M.R., Livingstone, D.A., 1989. Hydrogen index and carbon isotopes of lacustrine organic matter as lake level indicators. Palaeogeography, Palaeoclimatology, Palaeoecology 70, 121-137.
Talbot, M.R., Williams, M.A.J., Adamson, D.A., 2000. Strontium isotope evidence for late Pleistocene reestablishment of an intergrated Nile drainage network. Geology 28, 343-346.
Talbot, M.R., Laerdal, T., 2000. The Late Pleistocene-Holocene palaeolimnology of Lake Victoria, East Africa, based upon elemental and isotopic analyses of sedimentary organic matter. Journal of Paleolimnology 23, 141-164.
Talbot, M.R., Jensen, N.B., Laerdal, T., Filippi, M.L., 2006. Geochemical responses to a major transgression in giant African lakes. Journal of Paleolimnology. 35 (3), 467-489.

216
Taylor, S.R., McLennan, S.M., 1985. The continental crust: its composition and evolution. Oxford, Blackwell Scientific, 312 pp.
Taylor, S.R., McLennan, S.M., 1995. The geochemical evolution of the continental crust. Review of Geophysics 33, 241-265.
Tiercelin, J.-J., Thouin, C., Tshibangu, K., Mondeguer, A., 1989. Discovery of sublacustrine hydrothermal activity and associated massive sulphides and hydrocarbons in the north Tanganyika trough, East African Rift. Geology 17, 1053-1056.
Tiercelin, J-J, Mondeguer, A., 1991. The geology of the Tanganyika Trough. In: Coulter G.W. (ed), Lake Tanganyika and its life. Oxford University Press, Oxford, pp. 7-48.
Tribovillard, N., Algeo, T.J., Lyons, T., Riboulleau, A., 2006. Trace metals as paleoredox and paleoproductivity proxies: an update. Chemical Geology 232, 12-32.
Tyson, P.D., Preston-Whyte, R.A., 2000. The weather and climate of Southern Africa. Oxford University Press, Cape Town, 396pp.
Tyson, R.V., Pearson, T.H., 1991. Modern and ancient continental shelf anoxia: an overview. In: Tyson, R.V., Pearson, T.H., (Eds.), Modern and Ancient Continental Shelf Anoxia. Geological Society Special Publication 58, 1-26.
Vincens, A., 1991. Late Quaternary vegetation history of the South-Tanganyika Basin. Climatic implications in South Central Africa. Palaeogeography, Palaeoclimatology, Palaeoecology 86, 207-226.
Vincens, A., Chalié, F., Bonnefille, R., Guiot, Tiercelin, J-J., 1993. Pollen-derived rainfall and temperature estimates from lake Tanganyika and their implications for late Pleistocene water levels. Quaternary Research 40, 343-350.
Vincens, A., Buchet, G., Williamson, D., Taieb, M., 2005. A 23,000 yr pollen record from Lake Rukwa (8oS, SW Tanzania): New data on vegetation dynamics and climate in Central Eastern Africa. Review of Palaeobotany and Palynology 137, 147-162.
Werne, J.P., Sageman, B.B., Lyons, T., Hollander, D.J., 2002. An intergrated assessment of a “type euxinic” deposit: evidence for multiple controls on black shale deposition in the Middle Devonian Oatka Creek Formation. American Journal of Science 302, 110-143.
White, A.F., Blum, A.E., Bullen, T.D., Vivit, D.V., Schulz, M., and Fitzpatrick J., 1999. The effect of temperature on experimental and natural chemical weathering rates of granitoid rocks. Geochimica Cosmochimica Acta 63, 3277-3291.
Williams, M., Talbot, M., Aharon, P., Salaam, Y.A., Williams, F., Brendeland, K.I., 2006. Abrupt return of the summer monsoon 15,000 years ago: new supporting evidence from the lower White Nile valley and Lake Albert. Quaternary Science Reviews 25 (19-20) 2651-2665.
Williams, T.M., Henney, P.J., Owen, R.B., 1993. Recent eruptice episodes of the Rungwe Volcanic Field (Tanzania) recorded in the lacustrine sediments of the Northern Malawi Rift. Journal of African Earth Sciences, 17, 33-39.
Williamson, D., Thouveny, N., Hillaire-Marcel, C., Mondeguer, A., Taieb, M., Tiercelin, J.J., Vincens, A., 1991. Chronological potential of palaeomagnetic oscillations recorded in late Quaternary sediments from Lake Tanganyika. Quaternary Science Reviews 10, 351-361.
Wronkiewicz, D.J., Condie, K.C., 1987. Geochemistry of Archean shales from the Witwatersrand Supergroup, South Africa: source–area weathering and provenance. Geochimica Cosmochimica Acta 51, 2401-2416.
Zabel, M., Bickert, T., Dittert, L., Haese, R.R., 1999. Significance of the sedimentary Al:Ti ratio as an indicator for variations in the circulation patterns of the equatorial North Atlantic. Paleoceanography 14, 789-799.
Zabel, M., Schneider, R.R., Wagner, T., Adegbie, A.T., de Vries, U., Kolonic, S., 2001. Late Quaternary climate changes in central Africa as inferred from terrigenous input to the Niger Fan. Quaternary Research 56, 207-217.
217
IX. CONCLUSIONS
IX.1. Conclusions (Version française) Cette thèse présente les résultats d’une étude géochimique des sédiments de deux bassins du Rift
Est-africain à des stades précoces de leur développement, le Bassin de Makgadikgadi-Okavango-
Zambezi (MOZ) situé au Botswana, et le Bassin de Mpulungu, qui constitue la terminaison sud
du fossé du lac Tanganyika. Les bassins de rift qui se développent dans la croûte continentale
vont, si le processus du rifting se poursuit, évoluer en un bassin océanique bordé par des marges
passives. Le stade le plus avancé de rifting précoce concerne le développement de demi-grabens
bien individualisés et subsidents, où la propagation des failles et leurs interactions vont conduire à
des connections entre les bassins et un fort contrôle du drainage. Les environnements lacustres
francs caractérisent ce stade qui est illustré par le Bassin de Mpulungu dans le fossé du lac
Tanganyika. Le stade précédent concerne le développement d’environnements palustres et
lacustres peu profonds (<50 m) qui se forment à la suite de la croissance et de la propagation des
failles et de l’initialisation de la subsidence du bassin. Ce stade est représenté dans cette étude par
le grand bassin de Makgadikgadi-Okavango-Zambezi. Le stade initial du développement d’un rift
continental est caractérisé par la formation d’un hémi-graben peu profond, où les failles
naissantes exercent un contrôle primaire sur l’évolution du drainage et sur la formation du bassin
versant (Gawthorpe and Leeder, 2000). Ce stade est illustré par le cône alluvial actuel de
l’Okavango qui occupe un hémi-graben subsident, fortement contrôlé par la réactivation de failles
à l’intérieur du Bassin de Makgadikgadi-Okavango-Zambezi (Modisi, 2000; Ringrose et al.,
2005).
Dans un premier temps, nous avons appliqué la technique des diagrammes de variations et de
discrimination des environnements tectoniques aux données géochimiques obtenues acquises sur
des échantillons de deux segments du rift correspondant à deux phases différentes d’évolution: le
cône alluvial naissant de l’Okavango et le bassin lacustre mature de Mpulungu, Sud-Tanganyika.
Nous avons utilisé le domaine tectonique défini pour les marges passives, lequel inclut une large
gamme d’environnements tectoniques, pré-rift, rift, marges de rift, bassins sédimentaires d’avant-
pays et marges convergentes inactives ou abandonnées (Bhatia, 1983; Bhatia and Crook, 1986).
Nous avons ainsi pu définir deux nouveaux domaines d’environnement tectonique dans le champ
« marges passives » du diagramme de discrimination tectonique préexistant, celui d’un bassin
naissant caractérisé par le développement d’un delta continental (« alluvial fan », AF), et celui
d’un bassin lacustre mature (« lacustrine basin », LB). Les nouveaux champs ainsi définis dans ce

218
travail pourront aider les chercheurs travaillant sur les sédiments anciens à définir les conditions
tectoniques dont ces sédiments dérivent.
La provenance des sédiments de l’Okavango et de Mpulungu a également été identifiée dans cette
étude. Cette notion de provenance des sédiments dans un bassin peut être un excellent indicateur
des changements climatiques et /ou tectoniques dans un bassin (Leeder et al., 1998). Pour le
Bassin de Mpulungu, nos résultats indiquent que la source immédiate de matériel est une roche
sédimentaire quartzeuse mais que la source ultime est une roche felsique. Ces deux roches sont
respectivement représentées dans la région par les grès de la Formation de Mbala et par le socle
granitique que les grès de Mbala surmontent et qui constitue le craton zambien. Ces deux
formations affleurent tous les deux dans le proche bassin-versant au sud du Bassin de Mpulungu.
Ces résultats sont conformes au réseau hydrologique actuel de la rivière Lufubu, principal
affluent du Bassin de Mpulungu, dont le bassin-versant est entièrement installé dans ces deux
lithologies. Cela suggère que, pour la période de temps représentée par les sédiments du Bassin
de Mpulungu concernés par cette étude (23 à 3 ka BP), le réseau hydrologique de la rivière
Lufubu a été le pourvoyeur principal de sédiment dans le Bassin de Mpulungu.
Un des objectifs majeurs de cette thèse a été la compréhension des processus bio-géochimiques
qui ont eu lieu dans ces bassins de rift à la suite des changements environnementaux. Ce travail
contribue à une meilleure compréhension du processus de formation de calcrètes ou silcrètes en
relation avec les changements climatiques dans des bassins lacustres de faible profondeur, où les
épisodes d’eau douce sont suivis de phases arides dominées par la formation de calcrètes alternant
avec des phases répétitives de formation de silcrètes. La précipitation de calcrètes est en partie
contrôlée par le rapport Mg/Ca dans l’eau interstitielle de la zone littorale. La valeur de ce rapport
peut permettre d’identifier des périodes de fermeture du bassin. Le développement des silcrètes
est à relier à des épisodes de faibles précipitations ou d’écoulements ayant conduit à une
remontée du niveau de la nappe d’eau souterraine, résultant en la formation de paléolacs peu
profonds et localisés.
Les données géochimiques ont également été utilisées comme marqueur des changements du
climat dans les bassins de Ngami et de Mpulungu. Les résultats obtenus pour le bassin du lac
Ngami indiquent que les précipitations dans le bassin de l’Okavango au cours du Dernier
Maximum Glaciaire étaient contrôlées par l’insolation aux basses latitudes (ie. forçage de la
précession des équinoxes) par rapport au forçage glaciaire des hautes latitudes. Des résultats

219
similaires ont été obtenus par Garcin et al. (2006) pour le lac Masoko en Tanzanie. Les données
des éléments traces des sédiments carottés dans le Bassin de Mpulungu suggèrent que le niveau
du lac Tanganyika a subi une chute de l’ordre de 200–300 m durant le Dernier Maximum
Glaciaire, bien plus faible que celle indiquée par des paramètres biologiques dans d’autres
travaux. Ces sédiments révèlent aussi une excursion remarquable qui coïncide avec le Younger
Dryas. Cet événement environnemental apparaît comme le plus important dans la région sud du
lac Tanganyika pour la période 23 – 3 ka, caracterisé par un apport de matériel altéré dans le
bassin suite à une modification importante du couvert végétal.
L’utilisation de la composition géochimique d’un sédiment se révèle être un outil
particulièrement utile pour la reconstruction des conditions de dépôt dans un bassin sédimentaire,
depuis l’identification des sources des différents éléments minéraux du sédiment, leur degré
d’évolution en fonction de leur transport et également des conditions d’altération (liées à la fois
au climat et au couvert végétal), et les conditions de transformation post-dépôt, en particulier au
contact des eaux souterraines. Les conditions climatiques dans une région peuvent ainsi être
déduites directement ou indirectement des associations d’éléments chimiques issues du bassin
versant ou résultant de modifications pendant et après leur dépôt.
Certains forages réalisés dans le Delta de l’Okavango ont révélé la présence de fortes
concentrations d’arsenic dans les eaux souterraines, résultat de la dissolution sous conditions
réductrices des oxydes et des hydroxydes dans les sédiments avec le carbone organique. Les
sédiments à forte teneur en arsenic sont des argiles riches en matière organique se présentant sous
la forme de fines lentilles dans les dépôts sableux de la partie distale du Delta de l’Okavango. Ces
lentilles se sont déposées dans des conditions lacustres résultant de périodes de pluviosité plus
forte qu’aujourd’hui et du barrage des écoulements de la rivière Okavango par la faille de
Thamalakane (Shaw, 1988). La teneur élevée en arsenic dans les eaux souterraines de l’Okavango
pose désormais un problème pour la gestion de la demande en eau de bonne qualité dans cette
région aride. Plus de travail est nécessaire pour une bonne compréhension de ce problème. Une
étude systématique de tous les puits qui sont utilisés couramment pour l’eau potable dans la
région est en cours. En raison de l’impact majeur de certains éléments chimiques sur la santé
humaine, il est très pertinent que nous déterminions l’extension de la distribution en arsenic dans
les eaux souterraines dans l’intégralité du Bassin de Makgadikgadi-Okavango-Zambezi, étant
donné que l’ensemble de cette zone présente des dépôts d’environnements lacustres d’âges variés.
Les eaux souterraines sont la source majeure de l’eau potable au Botswana.

220
En ce qui concerne les études paléoclimatiques, il serait extrêmement instructif de réaliser un
sondage carotté dans une cuvette alimentée par l’eau de pluie au voisinage du bassin de MOZ,
afin de pouvoir distinguer les apports des précipitations locales et les apports provenant du bassin
angolais dans ce bassin. En plus, il serait extrêmement instructif de repeter le travail fait dans le
bassin Lac Ngami mais en plus de detaile pour voir si les conditions climatiques peuvent etre
deduites pendant le Younger Dryas et aussi pendant le Holocene.
IX.2 Conclusions (English version) This thesis presents the results of a geochemical study of sediments from two rift basins in the
East African Rift, the Makgadikgadi-Okavango-Zambezi (MOZ) basin and the Mpulungu sub-
basin of Lake Tanganyika. Rift basins, which develop in continental crust, will, if the rifting
process continues, lead to the development of an ocean basin flanked by passive margins. Rift
basins consist of a suite of individual half-grabens bounded by major normal faults. The more
mature stage of early rifting concerns the development of well-defined, actively subsiding half-
graben basins, where propagation and interaction between fault segments lead to basin linkage
and strong control of drainage. Wider and deeper lacustrine environments characterize this stage,
which is illustrated by the southern Mpulungu subbasin of Lake Tanganyika. The immediate
earlier stage concerns the development of basins where swamps and shallow lacustrine
environments (<50 m water depth) occur, as the result of fault growth and propagation, and
initiation of basin subsidence which is represented by the larger Makgadikgadi-Okavango-
Zambezi basin. The early initiation stage in the development of a continental rift is characterized
by the development of shallow half-graben basins where nascent faults exert a primary control in
drainage evolution and the formation of catchments (Gawthorpe and Leeder, 2000). This stage is
illustrated by the present Okavango alluvial fan which is a broad subsiding half-graben occupied
by an alluvial fan, strongly controlled by the reactivation of faults within the larger
Makgadikgadi-Okavango-Zambezi basin (Modisi, 2000; Ringrose et al., 2005).
The use of geochemical compositions of sediments in diagnostic diagrams has been shown to be
useful in determining tectonic settings (Bhatia, 1983; Roser and Korsch, 1986; 1988). The field
defined for passive margins include a wide range of tectonic environments, from rifted
continental margins of the Atlantic-ocean type, sedimentary basins near to collision orogens and
inactive or extinct convergent margins (Bhatia, 1983; Bhatia and Crook, 1986). Passive margin
221
settings have also been grouped into pre-rift, rift-valley or graben and Atlantic-type trailing
edges. In this work we define two new fields for an alluvial fan (AF) and lacustrine basin (LB)
tectonic environment within the passive margin field. We believe that these results will assist
researchers working on ancient sedimentary rocks in classifying the tectonic environment of their
samples.
The provenance of the sediments of both the Okavango Delta and Mpulungu sub-basin sediments
was determined in this study. The provenance of sediments in a depositional basin can be a useful
indicator of the past climatic and tectonic record (Leeder et al., 1998) in the catchment area. For
the Mpulungu sub-basin, our results indicate that the immediate source material is a quartoze
sedimentary rock represented by the sandstones of the Mbala formation. The ultimate source
material was a felsic source represented by the basement granites. These results agree very well
with the current hydrological conditions in the basin, where the Lufubu River traverses these two
source rocks. This suggests that at least for the time period for the age of the Mpulungu sediments
from this study (23 ka to 3 ka BP) that this has been the predominant hydrological link to the
Mpulungu sub-basin. For the Okavango Delta sediments, the interpretation is more complex as
the sediments the source of the sediments include a felsic rock source and a pyroxene and olivine
rich mafic-ultramafic rock complexes which are mixed with sand and diagenetic carbonates to
produce the Okavango sediments.
A major aim of this thesis was to improve our understanding of the biogeochemical processes
occurring within these rift basins as a result of environmental changes. As a result of this work,
we have improved our understanding of calcrete-silcrete formation in relation to climate change
events in shallow lacustrine basins/ pans where freshwater episodes are followed by calcrete
dominated drying phases interspersed with repeated silcretisation. Calcrete precipitation is in part
controlled by the Mg/Ca ratio of pore water in the pan littoral zone and thus can be used to
identify closed basin type conditions in the pan. Silicified duricrust units appear to be related to
relatively minor rainfall or inflow events which increased the level of the groundwater table,
maybe forming localised shallow palaeo-lakes.
Geochemical data was used as proxies for climate change in both the Lake Ngami (SW
Okavango) and Mpulungu sub-basin of Lake Tanganyika. Results for Lake Ngami indicate that
rainfall in the Okavango catchment area during the Last Glacial Maximum was controlled by
low-latitude insolation (ie. precessional forcing) over high latitude glacial forcing. Garcin et al.,

222
(2006) report similar results for Lake Masoko, Tanzania. Trace element data of redox-sensitve
metals from Mpulungu sediments suggests that the drop in lake level for Lake Tanganyika was
closer to 200 – 300 m than the 350 – 400 m suggested from earlier work based on biological
indicators. The Lake Tanganyika data shows a remarkable excursion coinciding with the Younger
Dryas (YD) event, reflecting the input of previously chemically weathered material into the basin
due to a change of vegetation cover. This illustrates that YD event brought about significant
environmental in southern Lake Tanganyika.
The occurrence of elevated arsenic in groundwater of the Okavango Delta system is the result of a
biogeochemical process whereby under reducing conditions, oxides and hydroxides from the
sediments are dissolved thereby releasing arsenic into the system. The sediments with elevated
arsenic are organic rich clays which occur as thin lenses in the sandy sediments of the lower
Okavango Delta. These lenses were thought to have been deposited under lacustrine conditions,
when water ponded up against the Thamalakane Fault during periods of higher rainfall than today
(Shaw, 1988). The occurrence of arsenic in the groundwater will put a further strain on water
demand managers who struggle to provide sufficient good quality groundwater in this arid
country. Further work is needed in this area and we are currently undertaking a survey of existing
wells in use for water supply in the region.
The use of the geochemical composition of sediments has been shown in this work to be a very
useful tool for the reconstruction of the depositional conditions in a sedimentary basin, from the
identification of source rocks, their degree of weathering (linked to climate and vegetation cover)
and alteration due to transport and the post-depositional transformations, in particular those due to
contact with groundwater. The climatic conditions of a region can be directly or indirectly
deduced from the elemental composition of the sediments issued from the catchemnt or as a result
of modifications both during and after deposition. A geochemical analysis of sediments for past
climate reconstruction should be considered by researchers, in particular in situations where the
pollen and diatom record are not well preserved.
Further work is needed in the use of geochemical tracers in climate change and tectonic
evolution. With rest to past climates, it would be very informative to conduct a study in the MOZ
basin where one collects a core from a rain-fed pan and another core from a basin which is fed by
rivers originating in Angola. In this way it may be possible to distinguish between higher lake
levels due to local rainfall as opposed to higher lake levels due to increased precipitation in the

223
Angolan highlands. In addition, it would be very informative to be able to repeat work carried out
in the Lake Ngami Basin but on a much finer scale. In the work reported in this thesis, samples
were collected over every 10 cm in the 4.6 m pit. Each 10 cm represents approximately 1000 yrs.
Because of this we were not able to capture some of the interesting climate events such as how
the lake basin responded during the Younger Dryas event or during climate events during the
Early and Late Holocene. With respect to arsenic and human health, it is crucial that we
determine the extent of arsenic distribution in groundwater in the entire Makgadikgadi-
Okavango-Zambezi basin, as the whole area has, at different stages, had a lacustrine depositional
environment. Groundwater is the major source of potable water in this region.
References
Bhatia, M.R., 1983. Plate tectonics and geochemical composition of sandstones. J. Geol. 91, 611-627.
Bhatia, M.R., Crook, K.A.W., 1986. Trace element characteristics of graywackes and tectonic setting discrimination of sedimentary basins. Contr. Mineral. Petrol. 92, 181-193.
Garcin, Y., Williamson, D., Taieb, M., Vincens, A., Mathe, P., Majule, A., 2006b. Centennial to millennial changes in lake deposition during the last 45,000 years in Tropical Southern Africa (Lake Masoko, Tanzania). Palaeogeography, Palaeoclimatology, Palaeoecology 239 (3-4), 334-354.
Gawthorpe, R.L., Leeder, R., 2000. Tectono-sedimentary evolution of active extensional basins. Basin Research 12, 195-218.
Leeder, M.R., Harris, T., Kirkby, M.J., 1998. Sediment supply and climate change: implications for basin stratigraphy. Basin Research 10, 7-18.
Modisi, M.P., 2000. Fault system of the southeastern boundary of the Okavango Rift, Botswana. J. Afr. Earth Sci. 30, 569-578.
Ringrose, S., Huntsman-Mapila, P., Kampunzu, A. B., Matheson, W., Downey, W., Vink, B., Coetzee, C., and Vanderpost, C., 2005. Sedimentological and geochemical evidence for palaeo-environmental change in the Makgadikgadi subbasin, in relation to the MOZ rift depression, Botswana. Palaeogeography, Palaeloclimatology, Palaeoecology 217 (3-4), 265-287.
Roser, B.P., Korsch, R.J., 1986. Determination of tectonic setting of sandstone-mudstone suites using SiO2 content and K2O/Na2O ratio. J. of Geol. 94, 75-83.
Roser, B.P., Korsch, R.J., 1988. Provenance signatures of sandstone-mudstone suites determined using discriminant function analysis of major-element data. Chem. Geol. 67, 119-139.
Shaw, P., 1988. After the floods: The fluvio-lacustrine landforms of northern Botswana. Earth Sci. Rev. 25, 449-456.

224
APPENDIX 1. CHARACTERIZATION OF ARSENIC OCCURRENCE IN THE
WATER AND SEDIMENTS OF THE OKAVANGO DELTA, BOTSWANA
A1.1 Caractérisation de la distribution de l’Arsenic dans l’eau et les sédiments du Delta de l’Okavango, Botswana. Résumé de l’article Les analyses géochimiques ont été faites sur les eaux de surface, les eaux souterraines et les
sédiments de l’Okavango en 2003 afin d’examiner la distribution et la géochimie de l’arsenic
dans la région. L’eau de surface de l’Okavango, qui a un pH neutre - acide et un niveau de
carbone organique dissout (COD) élevé présente des teneurs en arsenic un peu élevées par rapport
à une valeur moyenne mondiale pour les fleuves. Dans vingt puits mesurés dans le cadre de ce
projet, nous avons trouvé six niveaux d’arsenic dont la valeur dépasse 10 µg/l. Cette valeur est
celle admise provisoirement par l'Organisation Mondiale de la Santé pour l'arsenic dans l’eau
potable. Les résultats de spéciation suggèrent que As (III) est plus prédominant que As (V). Il
existe une corrélation positive entre l’As et le pH et entre l’As et le COD dans l’eau souterraine.
Pour les sédiments, il existe un corrélation positive entre l’As et le Co, l’As et le Fe, l’As et la
perte au feu (LOI) et l’As et le pourcentage de la fraction fine. La dissolution sous condition
réductrice des oxydes et des hydroxydes dans les sédiments avec le carbone organique comme
accepteur d'électron est le mécanisme probable pour le dégagement de l’As des sédiments dans
les eaux souterraines.
225
A1.2. Characterization of Arsenic occurrence in the water and sediments of the Okavango Delta, NW Botswana P. Huntsman-Mapila*,a,b, T. Mapilac, M. Letshwenyoa , P. Wolskia , C. Hemondb a Harry Oppenheimer Okavango Research Centre, University of Botswana, P/Bag 285, Maun, Botswana b UMR-CNRS 6538, Institut Universitaire Européen de la Mer, 29280 Plouzané, France c Pangolin Enterprises, P/Bag BR 159, Gaborone, Botswana Article published in Applied Geochemistry 21 (2006) 1376-1391 * Corresponding author: E-mail: [email protected] Abstract Detailed chemical analyses were performed on surface water, groundwater and sediment samples
collected from the Okavango Delta between February and November, 2003 in order to examine
the distribution and geochemistry of naturally occurring arsenic in the area. Surface water in the
Okavango Delta, which is neutral to slightly acidic and has a high dissolved organic carbon
(DOC), was found to be slightly enriched in As when compared to a global value for stream
water. Of the 20 new borehole analyses from this project, six were found to have values
exceeding 10 µg/l, the current World Health organization provisional guideline value for arsenic.
The results from field speciation indicate that As (III) is slightly more predominant than As (V).
There exists a positive correlation between As and pH and between As and DOC in the
groundwater samples. For the sediment samples, there exists a positive correlation between As
and Co, As and Fe, As and loss on ignition (LOI) and between As and the percent fines in the
sample. Reductive dissolution of oxides and hydroxides in the sediments with organic carbon as
an electron acceptor is the likely mechanism for the release of As from the sediments into the
groundwater.
A1.2.1. Introduction Botswana is a relatively large (582,000 sq. km) flat country with mean annual rainfall varying
from 650 mm/a in the north to 250 mm/a in the south. Mean annual potential evapo-transpiration
is estimated to be 4 to 5 times higher than the average mean annual rainfall (450 mm/a). Although
groundwater recharge rates are generally low in Botswana, averaging 2.7 mm/a (Snowy
Mountains Engineering Corporation (SMEC) et al., 1991), groundwater has been the main source

226
of potable water supply. Figures released in the National Water Master Plan (SMEC et al., 1991),
indicate that groundwater accounted for 67% of the 1990 total water consumption in Botswana.
The Okavango Delta (Figure A1-1) is part of a large alluvial fan complex in north-western
Botswana. Flow into the Delta system through the Okavango River, which originates in Angola,
peaks after the rainy season in Angola. Only 2% of the mean annual inflow leaves the system as
surface water outflow through the Thamalakane and Boteti Rivers.
Arsenic in the environment has received renewed attention due to the recent studies of elevated
arsenic in Bangladesh and neighbouring West Bengal, India (Chatterjee et al, 1995; Das et al.,
1995; Nickson et al., 1998; BGS and DPHE, 2001; Welch and Stollenwerk, 2003), and the
debates in the United States over the maximum contaminant level (MCL) for drinking water (US
Environmental Protection Agency (US EPA), 2001a; SenGupta and Greenleaf, 2002).
Evidence shows that high-As groundwater can be associated with reducing conditions prevalent
in alluvial and deltaic environments (Sengupta et al., 2004). Occurrence of As-enrichment in
Bangladesh groundwater shows a close relationship with the geomorphological units. Quaternary
sediments provide good aquifers in Bangladesh and As-enrichment is mainly resticted to the
Holocene alluvial aquifers at shallow and intermediate depths (BGS and DPHE, 2001). The
sediments are dominantly composed of sands, silts and clays (Ahmed, 2004).
The issue of potentially elevated arsenic in groundwater of the Okavango Delta was first raised
during the second phase of the Maun Groundwater Development Project (MGDP) (Department of
Water Affairs (DWA), 2003). Based on those preliminary results, it was decided to conduct a
more comprehensive study. The objectives of this paper are therefore: (1) to present new
chemical analyses of groundwater and surface water samples and Quaternary sediments from the
Okavango Delta; (2) to relate the presence of arsenic in the Okavango Delta environment to the
hydrogeological setting and geochemical processes; and (3) to determine the speciation of arsenic
in the groundwater of the Okavango Delta.
A1.2.2. Hydrological setting In semi-arid NW Botswana, the development potential of the Okavango Delta has included plans
for agriculture and water for mining, whilst more recent interest in development has focused on
water supply for human consumption (UNDP, 1977; DWA, 2003). Maun, with a population of

227
49,822 in 2001 (Central Statistics Office, 2001), is the main source of demand for potable water
in the region. The rapid growth of Maun, estimated at 3.5% per annum, has necessitated
exploration of groundwater resources.

228
Figure A1 1. Location map of the Okavango Delta in NW Botswana with rectangles showing the location of the surface water sampling.

229
The construction of the Shashe wellfield (Figure A1-2) began in 1986 and has subsequently been
expanded by three groups of boreholes between the 1980’s and 1990’s. The main source of
recharge to the lower Okavango Delta is river recharge with localised rainfall providing minimal
groundwater recharge (DWA, 2003) With no river flow in the Shashe river since 1989 and
increasing extraction, the Shashe wellfield was becoming stressed and the shallow unconfined
aquifer dewatered. Recent groundwater development strategies (MGDP) have focussed on
assessing the Matsibe, Xudum, Kunyere and Gomoti areas (Figure A1-2) (DWA, 2003).

230
Figure A1 2. Detailed map of the southern Okavango region showing the location of borehole sampling points.

231
The Okavango Basin is a Quaternary half-graben (McCarthy et al., 1993a; Modisi, 2000; Modisi
et al., 2000) inferred to represent the south-western tip of the East African rift system (Kampunzu
et al., 1998). It is located within the Kalahari Basin which is a shallow intracontinental basin
covered by sand dunes, minor lacustrine deposits and precipitates (e.g. Thomas and Shaw, 2002).
The Okavango River enters the Middle Kalahari, through the Panhandle (Figure A1-1 and 2)
before extending into an inland alluvial fan. The Okavango River drains from the central
highlands of Angola where annual inflow is estimated at 1.01 x 10¹⁰m3 measured at the apex of
the Panhandle (McCarthy et al., 2000). The Okavango Delta shows progressive degrees of
inundation throughout its length and is subdivided into distinct geomorphic regions: (1) the
Panhandle where the Okavango River is constrained; (2) the permanent swamps (3) the seasonal
floodplains and (4) occasional (or intermittent) floodplains (Gumbricht and McCarthy, 2003).
In the Upper Panhandle zone at Mohembo, the bulk of the water is confined to the main channel
but immediately downstream, the Panhandle zone broadens and the main channel is flanked by
areas of permanent swamp fringed by seasonal swamp. Guma Lagoon, located in the Lower
Panhandle, is in the form of an old ox-bow. Narrow channels still link the lagoon to the main
channel, however it now receives water primarily from the fringing swamp. In the Maunachira
channel portion of the Okavango Delta, the water spreads out into numerous smaller channels
with flow-through lagoons, such as Gadikwe and Xakanaxa. The Boro River on the south-western
tip of Chief’s Island is a major tributary of the Okavango Delta and has active flow throughout
most of the year.
The sediments building up the Okavango Delta show a stratified profile and are predominantly
sands with minor silts and clays that support both shallow unconfined and deeper semi-confined
aquifers (DWA, 2003) which are hydraulically interconnected at a sub-regional scale.
Groundwater recharge in the Okavango Delta is dominated by flood water infiltration whilst the
role of rainfall recharge is rather limited. Wolski and Savenije (2006), during 7 years of
observation of floodplain and island groundwater, recognized only 2 diffuse recharge events. In
contrast, the arrival of the annual flood to the distal parts of the Delta caused recharge of the
shallow phreatic aquifer raising the groundwater table by 1-3 m within one month. The shallow
groundwater was, however, subject to evaporation and transpiration after flood recession, and
thus only some part of the infiltration flux contributed to the net annual groundwater recharge.
Groundwater flows in the Okavango Delta are dominated by local flow systems developed

232
between the floodplains where recharge occurs and islands, which are the discharge zones due to
evapo-transpiration. The typical groundwater table gradients observed in these flow systems
suggest that 95% of groundwater flow takes place in the top 60 m of the aquifer. The effect of
groundwater discharge taking place through evapo-transpiration in islands, is that the island
groundwater is enriched in dissolved salts (McCarthy and Ellery, 1994). That enrichment can
reach the level where the shallow island groundwater is of much higher density than the
underlying fresh groundwater, and can be subject to density-driven fingering and sinking to the
bottom of the aquifer (Bauer et al., 2005).
A1.2.3. Sampling and analytical procedures
A1.2.3.1 Water sampling Nine surface water samples were collected in February 2003 as part of the Conservation
International AquaRAP project (Huntsman-Mapila et al., 2005a). Surface water samples were
collected from 4 different areas of the Okavango Delta: (1) the Upper Panhandle; (2) Guma
Lagoon in the Lower Panhandle; (3) Maunachira Channel and eastern portion of the Okavango
Delta and (4) the Boro River on the south-western tip of Chief’s Island (Figure V-2). Readings of
pH, temperature, dissolved oxygen (DO) and electrical conductivity (EC) were taken in situ using
a Hanna 991001 pH and temperature meter, a YSI 85 DO meter and a Hanna HI 9033
conductivity meter. Samples for metal analysis were filtered on site through a 0.45µm cellulose
nitrate filter and acidified to pH < 2 with HNO3. Samples for dissolved organic carbon were
filtered through a Whatman glass fibre filter (GFF) and acidified with HNO3. Anion samples
were not filtered. Alkalinity titrations were conducted on site. Field blanks were filtered and
acidified as the samples to ensure no contamination from this process each time the acid was
renewed. All samples were stored in acid precleaned bottles (rinsed with 1% HNO3 followed by
thorough rinsing with water). Samples were stored in a cooler box until transport to the laboratory
where they were stored in a refrigerator until analysis.
Twenty groundwater samples were collected between June and November 2003 from boreholes
in the occasional floodplain region of the Okavango Delta (Figure A1-2). pH , temperature, DO,
EC and alkalinity measurements were taken immediately. In the field, a 250 ml sample was
filtered through a 0.45 µm filter and acidified with H2SO4 to pH < 2. Field blanks were filtered
and acidified as the samples to ensure no contamination from this process each time the acid was

233
renewed. Anion samples were filtered but not acidified. All water samples were collected in
HDPE bottles and refrigerated until analysis. Anion exchange columns for the speciation work
were prepared in the laboratory using Bio-Rad econo-pac disposable 20 ml columns and the
acetate form of Bio-Rad AG 1-X8 resin (100 – 200 mesh). Calibration of the packed columns
using a spiked groundwater was conducted to ensure that the correct fractions were collected. 25
ml of the acidified filtered sample was passed through the column followed by 5 ml of 0.12N
HCl. This fraction was labelled as As (III). The column was then eluted with 20 ml of the same
acid to collect the As (V) fraction. According to Ficklin (1990), the volume of eluent required for
the removal of As(V) can be variable but has occurred when the dark yellow colour of the acetate
form of the resin has been entirely converted to the light yellow chloride form.
A1.2.3.2 Sediment sampling and pre-treatment
Sediments were collected at 1m intervals as boreholes were being drilled in the occasional
floodplains of the distal reaches of the Okavango Delta. A shallow core (1 m) was also collected
using an Eijkelkamp Beeker sampler for undisturbed sediments from a shallow backwater lagoon
near Xakanaxa Lagoon (FigureA1-1). Samples from the core were collected from every cm and
pore water was extracted, using a Buchner funnel, before storing the samples in plastic
containers. An additional set of sediment samples was obtained from Lake Ngami, a drainage
basin in the western portion of the Okavango Delta, where shallow (4 m) holes have been dug
into the dry lake bed. All these sites are part of the Okavango Delta basin and receive water from
the same source, the Okavango River.
Sediment samples were digested at 95 oC in 1:1 HNO3 and 1:4 HCl according to the US EPA
method 200.9 (US EPA, 2001b). A total of 29 sediment samples were digested at the Harry
Oppenheimer Okavango Research Centre (HOORC) Environmental Laboratory. In addition a
sample of STSD-4, a stream sediment composite sample from the Geological Survey of Canada
was digested in triplicate to determine recovery as well as three blanks to ensure that
contamination did not occur. A sample of the lubricant used during drilling was also digested to
ensure no contamination of the sediments from the drilling process had occurred. The samples
from Lake Ngami (NG) for As analysis were digested in aqua regia at Chemex Laboratories in
Canada.

234
A1.2.3.3 Sample analysis
For the water samples, Ca, Mg, Fe and Mn were analysed on the flame atomic absorption
spectrophotometer (Varian Spectra 220). Na and K were analysed on a Sherwood 410 flame
photometer. Anion samples were analysed on a Dionex DX-120 ion chromatograph. All analyses
were conducted at the HOORC Environmental Laboratory. Water samples for As analysis were
analysed on a Varian SpectrAA 220 atomic absorption spectrophotometer equipped with a Varian
GTA 110 graphite furnace (GFA), a deuterium arc background correction system, and
pyrolytically coated graphite tubes. A nickel nitrate solution in nitric acid was used to stabilize
the solution. The detection limit was 0.5 µg/l. An external reference was run every tenth sample.
For surface water analyses, SLRS-4, a river water sample from the National Research Council of
Canada was used (As concentration of 0.68 µg/l). Multiple injections were required for the
surface water samples. For groundwater, two samples from the South African Bureau of
Standards were used (As concentration of 15 and 33 µg/l) as external references. A blank and
standard were run for resloping every twenty samples. An approximation of DOC was obtained
by measuring the absorbance of the water samples at 280 nm using a Perkin Elmer Lamda 20
UV/Vis spectrophotometer (American Public Health Association (APHA) et al., 1995). Some
organic compounds found in water such as lignin, tannin, humic substances and some aromatic
compounds absorb ultraviolet radiation. The UV absorption is a useful approximate measure of
DOC in the water of the Okavango Delta and absorbance at 280 nm in surface water has been
found to give the best correlation (r=0.97) (Mladenov et al., 2005) for water samples from the
Okavango Delta.
For the analysis of As, Ni, Co and Fe in the sediments, samples were run using the GFA and
STSD-4 was used as an external reference. For the samples from Lake Ngami (NG) analysed at
Chemex, Co and Ni were analysed on ICP-MS, As on GFA and Fe on ICP-AES. Loss on ignition
(LOI) was determined on the sediments by combustion of the sample at 500oC for 2 hours.
Particle size analysis of the sediments was conducted using sieving techniques (Smith and
Atkinson, 1975).
A1.2.4. Results

235
A1.2.4.1 Water samples
For all geochemical data, the significance of correlation was tested at 95% confidence limit
(Rollinson, 1993).
Results of the nine surface water analyses are presented in Table V-1. Surface water samples
presented in this paper have a low conductivity (35.9 – 75.2 µS/cm) and a near neutral to slightly
acidic pH (5.53 – 7.24) typical of surface water from the Okavango Delta. DO values are variable
(0.70 – 5.70 mg/l) as can be expected given the different habitats sampled (lagoons and channels).
DOC in the surface water samples range between 5.5 – 16.6 mg/l. The predominant ions in the
Okavango Delta water are Ca-HCO3 and Ca-Na-HCO3 as can be seen from the Piper Diagram
(FigureV-3). As concentrations and precisions (% RSD) in these samples range from 1.1 – 3.1
ug/l and 4.0 – 11.7 % with an average concentration and precision of 2.3 µg/l and 6.2 %
respectively. Recovery of As in the SLRS-4 reference material averaged at 107 %.

236
Table A1 1. Results from water quality analyses of the Okavango Delta samples Sample UPO1* UP02* LP03* LP04* LP05* MC06* MC07* MC08* B09* type*** sw sw sw sw sw sw sw sw sw date sampled 2-Feb-03 3-Feb-03 7-Feb-03 6-Feb-03 7-Feb-03 11-Feb-03 12-Feb-03 11-Feb-03 14-Feb-03PH 6.55 6.45 6.5 6.62 5.53 7.09 7.2 7.24 6.67 temperature C 28.5 29.1 27.3 28.7 27.2 29 28.8 28.9 27.9 conductivity (uS/cm) 35.9 39 63 49.2 51.2 51.5 51.7 49.7 75.2 DO (mg/L) 5.7 0.79 2.3 2.58 0.70 5.16 5.28 5.52 1.13 Location U. Panhandle U. Panhandle L. Panhandle L. Panhandle L. Panhandle Maunachira Maunachira Maunachira Boro Habitat lagoon channel channel lagoon channel channel lagoon lagoon channel Ca mg/l 4.1 4.3 5.9 6.5 5.9 5.8 5.9 5.7 8.4 Mg 0.9 0.9 1.5 1.5 1.4 1.2 1.2 1.1 1.7 Na 2 2 3 2 3 3 3 3 5 K 2 2 3 1 3 2 2 2 3 Mn <0.03 <0.03 <0.03 <0.03 0.03 <0.03 <0.03 <0.03 0.14 Fe 0.48 0.29 1.89 0.11 0.84 0.24 0.25 0.46 0.1 Alkalinity as CaCO3 25.6 26.8 27.7 35.4 31.7 34.2 34.2 31.7 50 Cl 0.28 0.48 0.88 0.24 0.24 0.61 0.29 0.35 0.31 SO4 0.23 0.20 0.26 0.07 0.25 0.30 0.09 NO3 0.45 0.20 0.03 0.60 0.04 0.01 0.84 DOC 5.6 5.5 14.1 6.5 7.7 8.4 11.1 16.6 13.3 As (ug/l) 2.1 2.1 2.5 1.1 2.1 2.6 2.7 2.6 3.1 % As (III) % As (V) % recovery As(III) / As (v) * field data from Huntsman-Mapila et al., 2005a ** borehole data from MGDP (DWA, 2003) *** sw = surface water, gw = groundwater **** result from unfiltered sample

237
Table A1-1. Results from water quality analyses of Okavango Delta samples continued
Sample SHM01 SHM02 SHM03 SHM04 MAM05 MAM06 MAM07 KUM08 KUM09 KUM10 KUM11 KUM12 KUM13
type*** gw gw gw gw gw gw gw gw gw gw gw gw gw
date sampled 3-Oct-03 17-Oct-03 30-Nov-03 30-Nov-03 12-Aug-03 1-Jun-03 16-Jun-03 19-Aug-03 23-Jun-03 19-Jun-03 3-Jul-03 27-Jun-03 29-Aug-03
PH 7.94 8.45 7.18 7.22 7.5 8.19 8.46 8.06 8.07 8.53 8.21 7.64 7.04
temperature C 29.8 27.6 26.6 27 27.3 26.9 27.2 26.1 25.7 25.1 24.8 23.9 24.7
cond. (uS/cm) 2230 1747 1740 3770 686 1046 948 810 13830 728 1296 471 1420
DO (mg/L) 4.91 2.38 2.45 2.95 1.85 1.96 2.01 2.85 2.14 1.95 1.54 1.88 1.84
Location Shashe Shashe Shashe Shashe Xudum Xudum Xudum Matsibe Matsibe Matsibe Matsibe Kunyere Kunyere
Habitat
Ca mg/l 36.6 5.0 22.0 84.5 0.6 3 1.4 83.6 2.3 1.6 16.3 56.6
Mg 12.1 0.8 8.0 63.3 0.1 0.3 0.3 75.8 0.2 0.2 5.7 19.1
Na 440 390 350 720 190 270 230 1680 220 310 100 230
K 14 15 14 20 4 9 9 48 5 6 10 30
Mn <0.03 <0.03 <0.03 <0.03 <0.03 <0.03 <0.03 0.17 <0.03 <0.03 <0.03 0.27
Fe 0.14 0.94 1.16 1.1 1.49 0.38 0.7
Alk 503 516 488 486 417 425 430 1026 437 543 264 632
Cl 380.1 158.4 224.5 419.0 1.2 11.0 4.5 1596.7 9.9 56.9 165.3 85.9
SO4 411.5 345.7 203.9 1162.0 4.6 38.0 24.2 666.4 31.3 138.8 318.8 59.4
NO3 0.4 0.5 0.2 4.7 0.3 0.1
DOC 3.2 2.8 3.6 2.6 5.5 19.1 4.3 8.6 13.8 5.6 5.3 5.7
As (ug/l) 4.2 4.0 5.2 14.6 8.3 97.5**** 116.6 2.7 58.3 112.0 9.1 6.6 3.9
% As (III) 50.8 57.3
% As (V) 44.1 29.3
% recovery 94.8 86.7
As(III) / As (v) 1.2 1.95

238
Table A1-1. Results from water quality analyses of Okavango Delta samples continued
Sample KUM14 KUM15 GOM16 GOM17 GOM18 GOM19 GOM20 9830** 9834** 9837** 9904** 9906**
type*** gw gw gw gw gw gw gw gw gw gw gw gw
date sampled 3-Jul-03 3-Sep-03 4-Nov-03 20-Nov-03 12-Nov-03 12-Nov-03 30-Nov-03 15-Feb-03 8/27/2002 9/2/2002 12/18/2002 1/26/2003
PH 7.44 6.78 6.29 7.49 7.39 7.51 6.81 8.1 8.5 8.6 7.5 8.1
temperature C 24.4 26.5 33.8 28.3 29.5 27.9 26.7 25.3 24.3 25.4 26.5 28
conductivity (uS/cm) 725 809 398 1394 483 1025 542 1560 1457 1668 1340 1930
DO (mg/L) 2.43 1.67 0.81 1.22 1.02 1.59 1.57 1.7 1.25 3.5
Location Kunyere Kunyere Gomoti Gomoti Gomoti Gomoti Gomoti Boro Boro Boro Gomoti Gomoti
Habitat
Ca mg/l 17.7 7.5 33.9 2.7 1.1 3.4 9.5 2.8 2.9 7.6 1.9 3.3
Mg 4.4 1.0 9.0 0.3 0.2 0.3 1.0 0.72 0.75 1.7 0.37 0.71
Na 150 170 28 300 170 260 130 454 392 390 370 404
K 10 10 8 3 2 10 12 6.6 14 9.3 5.2 4.2
Mn <0.03 <0.03 0.19 <0.03 <0.03 <0.03 <0.03 <0.05 <0.05 <0.05 <0.05 <0.05
Fe 0.32 0.39 13.22 1.32 1.83 0.07 0.22 0.19 0.08 0.75
Alk 212 210 217 353 219 518 297 693 711 607 624 375
Cl 19.4 98.6 2.4 175.7 19.8 7.9 2.5 137.0 80.0 139.0 64.0 238.0
SO4 11.0 67.7 19.1 191.6 24.2 50.1 10.5 94.0 50.0 73.0 85.0 196.0
NO3 0.1 0.2 0.3 0.2 0.1 0.1 0.1 <0.1 <0.1 <0.1 <0.1 <0.1
DOC 3.5 3.6 10.4 3.1 4.4 4.6 2.2
As (ug/l) 1.8 2.4 7.0 10.1 8.0 6.1 4.7 30 35.0 29.0 90 60
% As (III) 53.5 74.0 57.3 50.0
% As (V) 56.7 48.3 79.0 58.6
% recovery 110.3 122.4 136.3 108.6
As(III) / As (v) 0.94 1.53 0.73 0.85

239
The results of the twenty boreholes sampled during this study are presented in Table V-1. In
addition, results of five boreholes sampled during MGDP have been included. Analysis of the
MDGP samples were conducted at CSIR in South Africa. Conductivity values of all samples
range between 398 – 13 830 µS/cm with an average of 1762 µS/cm. pH values range between
6.29 – 8.60 with an average value of 7.72. DO values range between 0.81 – 4.91 with an average
value of 2.06 mg/l. Na is the predominant cation in all groundwater samples with the exception of
sample GOM16 where Ca is the predominant ion (Figure A1-3). Thirteen of the boreholes have
HCO3 as the predominant anion (> 50 % meq) The remainder of the samples have variable
proportions of HCO3, SO4 and Cl. Samples SHM04 is Na-SO4-Cl type waters.
As values for all field blanks were less than the detection limit of 0.5 µg/l. All As values for the
groundwater samples have precisions (% RSD) of less than 10 % with the exception of one
sample (SHM04) with a RSD of 15 % which had a high background reading.

240
Figure A1 3. Piper diagram for surface and groundwater samples. Surface water samples are represented by squares and groundwater samples by spheres. In the 20 new borehole analyses assessed in this study, As in groundwater ranges between 3.2
µg/l to 116.6 µg/l. Sample MAM06 with an As concentration of 97.5 is only available as an
unfiltered As sample. Of the 20 boreholes, six have As concentrations higher than 10 µg/l, four
have concentrations higher than 50 µg/l and two are higher than 100 µg/l.
For the speciation work, reliable results were only obtained for six of the boreholes tested due to
difficulties experienced with calibration of the columns. Recovery of the As in the sample passed
through the columns ranged between 86.7 – 136.3 % with an average of 109.8 %. As (III) in the
sample ranged between 50.0 – 74.0 % of the total As with an average of 57.1 %. As (V) in the
sample ranged between 29.3 – 79.0 % with an average value of 52.7 % of the total As in the
sample.

241
The data indicates a relationship between As and pH in groundwater where As occurs at
concentrations greater than 50 µg/l only in water at pH greater than 8.0 with the exception of
sample 9904 with an As concentration of 90 µg/l and a pH of 7.5 (Figure A1-4a). This is also
indicated by a significant positive correlation of As and pH in groundwater where r = 0.50 (n =
25) for groundwater. There exists a relatively strong positive correlation between As and DOC
(Figure A1-4b) with r = 0.64 (n = 9) for surface water and r = 0.89 (n = 19) for groundwater.
There is no significant correlation between As and EC (Figure A1-4c) and no significant
correlation between As and alkalinity (Figure A1-4d), although pH and alkalinity are significantly
correlated in groundwater. No correlation exists between Fe and As for surface water and
groundwater samples.
A1.2.4.2 Sediment samples
In this study, the fraction of sediments between 0.5mm – 0.25 mm (2 Φ) has been classified as
medium grain sand whilst the fraction between 0.25 – 0.125 mm (3 Φ) has been termed fine grain
sand. The fraction that is < 0.06 mm has been classified as “fines” (ie silts and clays). The
samples analysed are predominantly fine to medium grain sands with the exception of KUM10-
28 which has a high (> 70 %) amount of fines and the lake sediment samples from Lake Ngami,
which also have a higher percentage of fines than the samples from the Okavango Delta proper.
There was insufficient sample from the Xak core to conduct particle size analyses.
The sediment sample STSD-4 that was analysed in triplicate for As had an average recovery of
100.7 %. The precision of the sediment sample data is < 13 % RSD for all samples with an
average of 6.5 %. As concentrations in the sediments analysed range between 0.2 – 7.0 mg/kg
with an average value of 2.2 mg/kg (Table A1-2). Values are highest in the samples from KUM10
which also had elevated As in the water sample. There exists a significant positive correlation
between As and Co and between As and Fe (Figure A1-5a and b) in the sediment samples (both r
= 0.54, n = 35). However, the samples from the shallow core, Xak, do not plot with the other
samples. With Ni, there is no clear relationship with As. There exists a relatively strong
correlation between As and the % fines in the samples (r = 0.64, n = 25) and between Fe and the
% fines (r = 0.65, n= 18) and to a lesser extent between Co and the % fines (r = 0.30, n = 25)
(Figure A1-5c, d and e).

242
A strong positive correlation exists between LOI and As (Figure A1-5f) for the samples from
KUM10 and MAM05 (r = 0.96, n = 21) and Xak, although plotting separately from the other data
points has r = 0.78 (n = 8). There is no correlation between As and LOI for the NG samples.

243
Table A1 2. Results of sediment sample analysis of the Okavango Delta sediments.
Sample Sample depth As (mg/kg) Co (mg/kg) Ni (mg/kg) Fe (%) LOIorgC % % medium % fine % fines
(m) sand sand
MAM05-2 2 2.6 8.2 39.5 0.40 4.9 27.4 12.3 4.6
MAM05-7 7 1.5 5.0 38.8 0.45 1.7 21.9 14.2 1.3
MAM05-13 13 2.6 7.1 92.4 0.53 4.5 23.3 8.2 9.9
MAM05-22 22 0.8 2.0 43.4 0.19 1.4 12.5 6.7 2.2
MAM05-33 33 1.2 5.8 42.8 0.26 1.5 41.0 20.6 6.6
MAM05-42 42 2.4 4.9 37.3 0.49 2.8 21.1 13.1 15.9
MAM05-63 63 0.4 3.9 50.4 0.24 0.1 51.1 38.1 0.2
KUM10-5 5 0.4 4.2 42.8 <0.05 0.3 51.6 29.3 0.2
KUM10-13 13 3.3 9.2 40.2 0.49 4.4 31.2 33.9 10.4
KUM10-17 17 3.7 7.6 40.0 0.57 5.2 21.6 20.1 32.3
KUM10-28 28 6.2 6.0 38.4 0.71 8.6 1.3 1.7 70.5
KUM10-29 29 3.6 5.8 32.1 0.44 5.0 17.6 5.7 16.1
KUM10-30 30 1.8 6.4 42.5 0.43 1.9 26.0 18.8 2.2
KUM10-32 32 2.3 6.6 44.4 0.39 2.0 24.3 14.9 4.9
KUM10-34 34 2.1 4.8 39.1 0.34 1.7 38.5 11.6 34.5
KUM10-47 47 1.4 5.6 36.1 0.44 2.3 30.7 10.8 10.7
KUM10-48 48 1.1 3.8 35.0 0.44 1.7 32.6 8.7 4.8
KUM10-49 49 0.9 2.6 32.6 0.37 1.3 15.0 21.1 10.5
KUM10-62 62 1.3 6.5 39.6 <0.05 1.7 51.9 15.0 3.7
KUM10-64 64 1.0 3.8 36.2 0.54 1.2 29.5 9.0 17.0
M10-65 65 0.9 2.8 62.3 0.42 1.3
XAK-2 0.02 1.3 6.7 90.5 0.35 45.0
XAK-7 0.07 1.2 6.7 83.5 0.72 30.0
XAK-11 0.11 0.7 6.1 75.2 0.67 26.8
XAK-18 0.18 0.9 3.2 64.3 0.53 14.2
XAK-21 0.21 0.9 3.8 71.7 0.42 23.1
XAK-24 0.24 0.8 1.8 80.6 0.52 21.8
XAK-30 0.3 0.9 0.3 56.9 0.54 6.9
XAK-49 0.49 0.2 0.4 58.4 0.35 0.5
NG210* 2.1 4 13.5 29 1.32 11.3 6.5 7.8 20.1
NG260 2.6 4 9.5 22 1.39 10.3 5.9 22.5 31.2
NG430 4.3 7 4.2 12 0.52 2.8 32.8 10.5 14.0
NG440 4.4 6 8.7 21 1.07 7.5 35.0 13.1 26.9
NG450 4.5 7 10.1 23 1.33 10.5
NG460 4.6 2 11.7 25 1.44 10.8 28.0 25.8 27.9
*Co, Ni and Fe values for NG samples from Huntsman-Mapila et al., (2006)

244
Figure A1 4. Binary diagrams for Okavango Delta surface and groundwater compositions.

245
0
10
20
30
40
50
60
70
80
0 2 4 6 8
As (mg/kg)
% fi
nes
0
2
4
6
8
10
12
14
16
0 2 4 6 8
As (mg/kg)
Co
(mg/
kg)
MAM05KUM10
XAKNG
MAM05KUM10
XAKNG
% fi
nes
MAM05KUM10
XAKNG
0
10
20
30
40
50
60
70
80
0 5 10 15
Co (mg/kg)
% fi
nes
MAM05KUM10
XAKNG
0
10
20
30
40
50
60
70
80
0.00 0.20 0.40 0.60 0.80 1.00
Fe %
MAM05KUM10
XAKNG
% fi
nes
% fi
nes
0.00 2 4 6 8
As (mg/kg)
10.0
LOI %
MAM05KUM10
XAKNG
a
c d
e f
0 2 4 6 8
As (mg/kg)
1.6
1.2
b
0.8
0.4
0
Fe (%
)
MAM05KUM10
XAKNG
MAM05KUM10
XAKNG
Figure A1 5. Binary diagrams for the Okavango Delta sediment compositions.
A1.2.5. Discussion
A1.2.5.1 General hydrochemistry
The Okavango Delta surface water has a low conductivity with the major cation being Ca and the
major anion being HCO3 (Hutton and Dincer, 1976; Sawula and Martins, 1991; Cronberg et al.,
1995) with exceptions occurring in small saline pans on islands where the groundwater has come
to the surface during the seasonal flood and experienced evaporative concentration. The surface
water of the Delta has a typical tea colour from dissolved organic compounds, in particular fulvic

246
acids which are present in the water (Mladenov et al., 2005). The conductivity of the outflow of
the Delta in Maun is typically double that of the inflow in the Panhandle caused by evaporative
concentration. This bicarbonate dominant fresh surface water dominates the ground-water
recharge during the advance of the seasonal flood. McCarty et al., 1998 plotted groundwater
chemistry of 251 boreholes and found that bicarbonate dominated water is confined to the area of
the Delta proper whilst chloride dominated water predominates in the region outside of the Delta.
Three apparently isolated pockets of sulphate dominated water occur in the western fringe of the
Delta. These authors concluded that neither the chloride nor the sulphate dominated water could
have originated from recharge from the Okavango Delta surface water. Several studies have
shown that lower salinity water frequently overlies water of higher salinity (Aquatec, 1982;
BRGM, 1986; DWA, 2003; Bauer et al., 2005). In addition, salinity is spatially very variable, and
that salinity can change by up to three orders of magnitude over a horizontal distance of a few
tens of meters (McCarthy et al., 1993b).
A1.2.5.2 Nature and source of surface water arsenic
The As concentrations in the surface water of the Okavango Delta exceed the global average
value of 1.7 µg/l for dissolved As in stream water (Martin and Whitfield, 1983) in all but one
sample. The neutral to slightly acidic pH of the Delta water would suggest that the H2AsO4-
inorganic species predominates. The relatively high DOC of the surface water would also suggest
the presence of the methylated form of As.
Dowling et al., 2002 suggest that dissolved arsenic in the Bengal Basin is carried by the rivers
and then removed by either flocculation of fine grained particles or bacterially reduced and
precipitated to be stored in deltaic sediments. The suspended sediment component in the
Okavango Delta needs also to be assessed. The particulate load in the Okavango Delta is however
very low compared to the chemical precipitates. McCarthy et al., 2002 estimated that, under
present conditions, 381,000 t of chemical sediment are accumulating on the fan each year
compared to approximately 209,000 t of clastic load consisting of 170,000 t of bedload and
39,000 t of suspended load.
Slightly elevated As levels, compared to the global average, are occurring in the Okavango Delta
surface water and possibly originate from the weathering of the bedrock in the region which
comprises Proterozoic granitoids and mafic-ultramafic rocks (Huntsman-Mapila et al., 2005b).

247
No As values are available for these source rocks. Koljonen (1992) in Matschullat, 2000 reports
that gabbros and basalts have an average concentration of 0.7 mg/kg and granites and
granodiorites have an average As concentration of 3 mg/kg. Sulphide minerals in mineralised
bedrock are vunerable to attack in humid environments rich in O2 despite being relatively
insoluble in pure water. The free O2 in the water causes the oxidation of pyrite and arsenopyrite
and liberates H2SO4. Under these acid conditions, As is highly mobile.
The transport of arsenic from source rocks in the Okavango Delta probably involves arsenic being
stored in various geochemical environments while in transit. This may include the short-lived
iron-monosulphide rich sediment which could accumulate in the system during wet periods.
A1.2.5.3 Nature and source of sediment arsenic
Sediment extraction work in this study reveals As concentrations of 0.2 – 7 mg/kg. The Delta
sediments are predominantly fine to medium grain sands and the average As concentration for
sandstones is given as 0.5 mg/kg (Onishi, 1969). Sediment samples from the Ganges-
Brahmaputra-Meghna (GBM) Delta range between 0.5 – 17.7 mg/kg (Ahmed at al., 2004).
Sengupta et al. 2004, in their study on arsenic in clay and sand sediments in the Bengal Delta,
recorded 10 mg/kg and 4 mg/kg respectively.
The collection of the shallow core in Xakanaxa Lagoon was of interest as the core was taken in an
active backwater swamp, where a vigorous release of gas was observed when the corer was
placed in the organic rich sediments. This suggested a reducing environment perhaps comparable
to the environment where the layers of the more fine grained/ organic rich sediments of the
occasional floodplain were deposited in the past when this region was inundated with water
(Huntsman-Mapila, 2006). It is thought that in the past, during periods of higher rainfall than
today, water would pond up against the Thamalakane fault, resulting in the formation of what is
referred to as Lake Thamalakane (Shaw, 1988).
It was hypothesized that the Xakanaxa lagoon site might represent a typical environment for
active As deposition. In reducing environments, arsenite in the form of H3AsO3O is present at pH
values less than 9.2 (Sracek et al., 2004) and a pH of about 7.0 is the adsorption optimum for
arsenite. In these conditions, As can diffuse to adsorption sites on Fe(OH)3 surfaces. In a reducing
248
environment, the electron donor for the reduction of Fe (III) oxides and hydroxides can be
organic matter in sediments.
Other potential adsorbents of As include Al oxides and hydroxides (Stollenwerk, 2003) with
halloysite and chlorite found to adsorb As (V) to a much greater extent than kaolinite, illite and
montmorillonite (Lin and Puls, 2000). XRD work on the Okavango sediments (Huntsman-Mapila
et al., 2005b) have shown that kaolinite is the predominant clay mineral in the Okavango
sediments present at no more than 3 % for the samples analysed. It is therefore suggested that
adsorption on Al oxides and hydroxides does not play a major role in fixing As in the sediments.
An earlier study of the sediments of the Okavango Delta revealed that of 90 samples analysed, the
average S concentration was 0.04 % with a range of <0.01 – 0.52 %. The same samples had and
average organic C content of 0.40 % with a range of <0.01 – 1.64 % (Huntsman-Mapila,
unpublished data). This would suggest that organic C contributes to a much greater extent than S
to the LOI of the sediments in the Delta. The strong positive correlation between As and LOI in
this study suggests that the combustible elements of the sample play an important role in the
adsorption of As in the Okavango Delta sediments.
A1.2.5.4 Nature and source of groundwater arsenic
The occurrence of elevated As in the groundwater of the Okavango Delta is not attributed to any
anthropogenic activities as minimal agricultural activities occur in the region. The current study
suggests a natural source and the release in groundwater through natural processes. Oxidation of
arsenopyrite due to a lowering of the groundwater table was postulated as the dominant process
for As mobilisation in the Ganges-Brahmaputra-Meghna (GBM) Delta (Bhattacharya et al.,
1997; Nickson et al, 2000) However, recent studies (McArthur et al., 2001; Dowling et al., 2002;
Anawar et al, 2003; Ahmed et al., 2004) have indicated that the reduction and dissolution of iron
oxy-hydroxide coating on sand grains is another likely release mechanism. This is coupled to the
degradation of organic matter in sediments whereby organic matter facilitates the transformation
of Fe (III) to Fe (II) and As (V) to As (III). Because dissolved As, Fe and HCO3 are positively
correlated in some GBM groundwaters and because organic carbon is abundant in the GBM
sediments, reduction of Fe oxides and release of As may be coupled with organic carbon
oxidation (Nickson et al., 2000).
249
Results from the MGDP (DWA, 2003) indicate that there is a higher occurrence of elevated
arsenic in boreholes screened below 72.6 mbgl than boreholes screened between 27.7 – 50.3 mbgl
suggesting that elevated As levels are predominantly occurring in the deeper aquifers. This would
suggest that the oxidation of sulphide minerals due to lowering of the groundwater table is not a
probable mechanism in this case.
Recent studies have shown that certain Fe reducing bacteria can use humic substances as electron
acceptors and reduce amorphous ferric oxide and crystalline iron oxides with a resulting product
of siderite, in bicarbonate buffered solution (Little et al., 1997; Dong et al., 2000; Sengupta et al.,
2004). There is a significant correlation between As and Fe in the Okavango sediments and
between As and organic matter in both the sediments and groundwater. The oxidative degradation
of DOC in the groundwater can produce high HCO3 and create a favourable environment for the
reduction of Fe and As. This hypothesis would suggest that the mechanism for the mobilisation of
As into the Okavango Delta groundwater is similar to the processes occurring in the GBM Delta.
However, no correlation exists between As and Fe in the Okavango Delta groundwater. Zheng et
al., 2004 had similar results in Bangladesh, where not all As-rich waters had elevated dissolved
Fe. They suggest a “re-oxidation scenario” whereby the introduction of O2 to SO4 reducing
groundwater can induce the oxidation of Fe (II) and As (III). This re-oxidation can lead to As and
PO4 co-precipitation or sorption onto newly formed Fe-oxyhydroxide. PO4 analyses were not
conducted on the Okavango Delta samples so it is not possible to determine if a correlation exists
between As and PO4. This requires further investigation.
A1.2.6. Conclusions
From this preliminary study of the occurrence of naturally occurring arsenic in the sediments and
water of the Okavango Delta, it has been found that:
Surface water in the Okavango Delta is slightly enriched in As when compared to a global value
for stream water. The water is neutral to slightly acidic with a high DOC.
Of the 20 new borehole analyses from this study, six were found to have values exceeding 10
µg/l, the current World Health organization provisional guideline value for Arsenic (WHO,
2001).

250
There is an indication that As (III) is slightly more predominant than As (V) in groundwater.
Reductive dissolution of Fe oxides and hydroxides in the sediments using organic carbon as an
electron acceptor is a likely mechanism for the release of As from the sediments into the
groundwater. Further work is required in order to understand the mechanisms involved in the
release of As into the groundwater of the Okavango Delta.
The quantity of available water for supply to Maun was significantly increased through the
drilling of the MGDP boreholes. It is evident that to address water shortages and associated
problems, significant emphasis has to be given to water quality. Non-selective continual
incrementing of quantity could lead to increased deterioration of water quality in Maun’s water
supply
Acknowledgements
The Director of the Department of Water Affairs, Botswana is acknowledged for granting
permission to publish this work. This investigation was supported by a research grant (R050)
from the University of Botswana Research and Publication Fund. Water Resources Consultants,
in particular V. Masedi, are acknowledged for assistance in sample collection. H.A.B. Kampunzu,
H. Jamieson, A. Charbonneau, B. Acheson and S. Ringrose are gratefully acknowledged for
guidance, comments and support. This paper was significantly improved by comments from
reviewers T.S. McCarthy and S. Appleyard. This is an IUEM contribution no. 984.
References Ahmed, K.M, Bhattacharya, P., Aziz Hasan, M., Humayun Akhter, S., Mahbub Alam, S.M.,
Hossain Bhuyian, M.A., Badrul Iman, M., Khan, A.A., Sracek, O., 2004. Arsenic enrichment in groundwater of the alluvial aquifers in Bangladesh: an overview. Appl. Geochem. 19, 181-200.
Anawar, H.M., Akai, J., Komaki, K., Terao, H., Yoshioka, T., Ishizuka, T., Safiullah, S., Kato, K., 2003. Geochemical occurrence of arsenic in groundwater of Bangladesh: sources and mobilization processes. J. Geochem. Explor. 77, 109-131.
Aquatec, 1982. Watering point survey: Ngamiland cattle trek route. Aqua Tech Groundwater Consultants, Gaborone, pp.132.
APHA, AWWA, WFA, 1995. Standard Methods for the Examination of Water and Wastewater (19th Edition). APHA, Washington, pp. 5/60-5/62.
Bauer, P., Zimmermann, S., Held, R., T., G. and Kinzelbach, W., 2002. Is density fingering balancing the salt budget of the Okavango Delta? Evidence from field and modelling studies, 17th Salt Water Intrusion Meeting, Delft.
251
Bhattacharya, P., Chatterjee, D., Jacks, G., 1997. occurrence of arsenic-contaminated groundwater in alluvial aquifers from delta plains, eastern India: options for safe drinking water supply. J. Water Resour. Dev. 13, 79-92.
BGS, DPHE, 2001. Arsenic contamination of groundwater in Bangladesh, Vol. 2. Final Report, BGS Technical Report WC/00/19.
BRGM, 1986. Maun water supply hydrogeological survey. Bur. Rech. Geol. Mineres, Orleans, France, Vol 1 and 2, pp.99.
Central Statistics Office, 2001. Population of Towns, Villages and associated localities. Government Printer, Gaborone, pp.297.
Chatterjee, A., Das, D., Mandal, B.K., Chowdhury, T.R., Samanta, G., Chakraborti, D., 1995. Arsenic in groundwater in six districts of West Bengal, India: the biggest arsenic calamity in the world. Part 1: arsenic species in drinking water and urine of affected people. Analyst 120, 643-650.
Cronberg, G., Gieske, A., Martins, E., Nengu, J., Stenstrom, I.M., 1995. Hydrobiological studies of the Okavango Delta and Kwando/Linyanti/Chobe River, Botswana. Botsw. Notes Rec. 27, 151-225.
Das, D., Chatterjee, A., Mandal, B.K., Samanta, G., Chakraborti, D., 1995. Arsenic in groundwater in six districts of West Bengal, India: the biggest arsenic calamity in the world. Part 2: arsenic concentration in drinking water, hair, nails, urine, skin-scale and liver tissue (biopsy) of affected people. Analyst 120, 917-924.
Dong, H., Fredrickson, J.K., Kennedy, D.W., Zachara, J.M., kukadapu, R.K., Onstott, T.C. 2000. Mineral transformation associated with the microbial reduction of magnetite. Chem. Geol. 169, 299-318.
Dowling, C.B., Poreda, R.J., Basu, A.R., Peters, S.L., 2002. Geochemical study of arsenic release mechanisms in the Bengal Basin groundwater. Water Resour. Res. 38, 1173-1190.
DWA (Department of Water Affairs), 2003. Maun Groundwater Development Project Phase 2, Project Review Report. Department of Water Affairs, Gaborone, Botswana, prepared by Water Resources Consultants.
Ficklin, W., 1990. Extraction and speciation of arsenic in lacustrine sediments. Talanta 37, 831-834.
Gumbricht, T., McCarthy, T.S., 2003. Spatial patterns of islands and salt crusts in the Okavango Delta, Botswana. S. Afr. Geographic. J., 85, 164-169.
Huntsman-Mapila, P., Ringrose, S., Mackay, A.W., Downey, W.S., Modisi, M., Coetzee, S.H., Tiercelin, J-J., Kampunzu, A.B., Vanderpost, C., (2006) Use of the geochemical and biological sedimentary record in establishing palaeo-environments in the Lake Ngami Basin, NW Botswana. Quat. Int. 148, 51-64.
Huntsman-Mapila, P., Masamba, W.R.L., Masundire, H., and Nyateka, N., (2005a) Surface water quality of the Okavango Delta, Botswana: AquaRAP II – Low water survey. Final report for Conservation International.
Huntsman-Mapila, P., Kampunzu, A.B., Vink, B. and Ringrose, S. (2005b) Cryptic indicators of provenance from the geochemistry of the Okavango Delta sediments, Botswana. Sed. Geol. 174 (1-2), 123 -148.
Hutton, L.G., Dincer, T., 1976. Chemical and stable isotope composition of Okavango Delta waters. Tech. Note 23, UNDP/FAO, BOT/71/706, pp.18.
Kampunzu, A.B., Bonhomme, M.G., Kanika, M., 1998. Geochronology of volcanic rocks and evolution of the Cenozoic Western branch of the East African rift system. J.Afr. Earth Sci. 26, 441-461.
Koljonen, T., 1992. Geochemical Atlas of Finland, Part 2: Till. Espoo, Finland: Geological Survey of Finland.
Lin, Z., Puls, R.W., 2000. Adsorption, desorption and oxidation of arsenic affected by clay minerals and aging process. Environ. Geol. 39, 753-759.

252
Little, B., Wagner, P., Ray, R., Hart, K., Lavoie, D., Nealson, K., Aguilar, C., 1997. The role of biomineralisation in microbiologically influenced corrosion. Biodegradation 9, 1-10.
Martin, J.M., Whitfield, M., 1983. The significance of the river input of chemical elements to the ocean. In: Wong, C.S., Boyle, E., Bruland, K.W., Burtons, J.D., Goldberg, E.D., (Editors), Trace metals in sea water. Plenum, New York, pp. 265-296.
Matschullat, J., 2000. Arsenic in the geosphere – a review. Sci. Total Environ. 249, 297-312. McArthur, J.M., Ravenscroft, P., Safiullah, S., Thirlwall, M.F., 2001. arsenic in groundwater
:testing pollution mechanisms for sedimentary aquifer in Bangladesh. Water Resour. Res. 37, 109-117.
McCarthy, T.S., Green, R.W., Franey, N.J., 1993a. The influence of neo-tectonics on water dispersal in the northeastern regions of the Okavango swamps, Botswana. J. Afr. Earth Sci. 17, 23-32.
McCarthy, T.S., Ellery, W.N., Alar, K., 1993b. Vegetation induced subsurface precipitation of carbonate as an aggradational process in the permanent swamps of the Okavango (Delta) fan, Botswana. Chem. Geol. 107, 111-131.
McCarthy, T.S. and Ellery, W.N., 1994. The effect of vegetation on soil and groundwater chemistry and hydrology of islands in the seasonal swamps of the Okavango Fan, Botswana. J.Hydrol. 154(1-4), 169-193.
McCarthy, T.S., Bloem, A., Larkin, P., 1998. Observations on the hydrology and geohydrology of the Okavango Delta. S. Afr. J. Geol. 101(2), 101-117.
McCarthy, T.S., Cooper, G.R.J., Tyson, P.D., Ellery, W.N., 2000. Seasonal flooding in the Okavango Delta, Botswana – recent history and future prospects. S. Afr. J. Sci. 96, 25-33.
McCarthy, T.S., Smith, N.D., Ellery, W.N., Gumbricht, T., 2002. The Okavango Delta- Semiarid alluvial fan sedimentation related to incipient rifting. In: Renault, R.W., and Ashley, G.M. (editors) Sedimentation in Continental Rifts, SEPM Special Publication No. 73, 179-193.
Mladenov, N., McKnight, D.M., Wolski, P., Ramberg L., 2005. Effects of the annual flood on dissolved organic carbon dynamics in the Okavango Delta, Botswana. Wetlands, 25 (3), 622-638.
Modisi, M.P., 2000. Fault system of the southeastern boundary of the Okavango Rift, Botswana. J. Afr. Earth Sci. 30, 569-578.
Modisi, M.P., Atekwana, E.A., Kampunzu, A.B., Ngwisanyi, T.H., 2000. Rift kinematics during the incipient stages of continental extension: evidence from nascent Okavango rift basin, northwest Botswana. Geol. 28, 939-942.
Nickson, R., McArthur, J., Burgess, W., Ahmed, K.M., Ravenscroft, P., Rahman, M., 1998. Arsenic poisoning of Bangladesh groundwater. Nature, 395, 338.
Nickson, R., McArthur, J.M., Ravenscroft, P., Burgess, W.G., Ahmed, K.M., 2000. Mechanisms of As release to groundwater, Bangladesh and West-Bengal. Appl. Geochem. 15, 403-413.
Onishi, H., 1969. Arsenic. In: Wedepohl, K.H., (Editor), Handbook of geochemistry. Springer, Berlin.
Ringrose, S., Huntsman-Mapila, P., Kampunzu, A. B., Matheson, W., Downey, W., Vink, B., Coetzee, C., and Vanderpost, C., 2005. Sedimentological and geochemical evidence for palaeo-environmental change in the Makgadikgadi subbasin, in relation to the MOZ rift depression, Botswana. Palaeogeogr., Palaeloclimatol., Palaeoecol., 217 (3-4), 265-287.
Rollinson, H., 1993. Using geochemical data: evaluation, presentation, interpretation. Longman, Singapore.
Sawula, G., Martins, E., 1991. Major ion chemistry of the Lower Boro River, Okavango Delta, Botswana. Freshwater Biology 26, 481-493.

253
SenGupta, A.K., Greenleaf, J., 2002. Arsenic in subsurface water: Its chemistry and removal by engineered process. In: SenGupta , A.K. (Editor), Environmental separation of heavy metals. CRC Press, USA, pp. 265-305.
Sengupta, S., Mukherjee, P.K., Pal, T., Shome, S., 2004. Nature and origin of arsenic carriers in shallow aquifer sediments of Bengal Delta, India. Environ. Geol. 45, 1071-1081.
Schwartz, E.H.L. 1919. The Kalahari or thirstland redemption. Maskew Miller, Cape Town. Shaw, P., 1988. After the floods: The fluvio-lacustrine landforms of northern Botswana. Earth
Sci. Rev. 25, 449-456. Smith, R.T., Atkinson, K., 1975. Techniques in pedology. Paul Elek Scientific Books, London,
pp.113-121. Snowy Mountain Engineering Corporation Ltd (SMEC), WLPU Consultants, Swedish Geological
International AB, 1991. Botswana National Water Master Plan. Prepared for Department of Water Affairs, Botswana.
Sracek, O., Bhattacharya, P., Jacks, G., Gustafsson, J., von Bromssen, M., 2004. Behaviour of arsenic and geochemical modelling of arsnic enrichment in aqueous environments. Appl. Geochem. 19, 169-180.
Stollenwerk, K.G., 2003. Geochemical processes controlling transport of arsenic in groundwater: a review of adsorption. In: Welch, A.H., Stollenwerk, K.G. (Eds.), Arsenic in Groundwater: Geochemistry and Occurrence. Kluwer Academic Publishers, Boston, MA, pp. 67-100.
Thomas, D.S.G., Shaw, P.A., 2002. Late Quaternary environmental change in central southern Africa: new data, synthesis, issues and prospects. Quat. Sci. Rev. 21, 783-797.
UNDP, 1977. Investigation of the Okavango Delta as a primary source of water for Botswana. UN/ FAO DP/BOT/71/506. Report for the Department of water Affairs, Botswana.
US EPA, 2001a. Drinking water standard for arsenic. On line at http://www.epa.gov/safewaters/ars/ars_rule_factsheet.html
US EPA, 2001b. Method 200.9: Trace elements in water, solids and biosolids by stabilized temperature graphite furnace atomic absorption spectrometry. EPA-821-R-01-011.
Welch, A.H., Stollenwerk, K.G., 2003. Arsenic in groundwater: geochemistry and occurrence. Kluwer academic Publishers, Norwell, MA.
Wellington, J.H., 1948. The food-producing possibilities of the Okavango Delta. S. Afr. Sci., 11, 65-67.
World Health Organization (WHO), 2001. Arsenic in drinking water. http://www.who.int/inf-fs/en/fact210.html
Wolski, P., Savenije, H., 2006. Dynamics of surface and groundwater interactions in the floodplain system of the Okavango Delta, Botswana. J. Hydrol. 320, 283-301.
Zheng, Y., Stute, M., van Geen, A., Gavrieli, I., Dhar, R., Simpson, H.J., Schlossser, P., Ahmed, K.M., 2004. Redox control of arsenic mobilization in Bangladesh groundwater. Appl. Geochem. 19, 201-214.

254
LISTE DES FIGURES Figure I 1. Map of East African Rift System showing the Western and Eastern Branches and the Southern Complex. Study areas are located within boxes............................................................. 22 Figure I 2. The Okavango Delta within the MOZ rift depression. Extent of rift depression is shown by the dashed lines. ............................................................................................................ 24 Figure I 3. The structure and hydrology of Lake Tanganyika Basin. Key 1-littoral platforms; 2-transverse shoals; 3-sub-basin deep zones (after Tiercelin and Mondeguer, 1991). ..................... 26 Figure I 4. Present ITCZ seasonal migration over Africa shown as dark grey band. Predominant wind directions are represented as black arrows. Figure from Grand Atlas du Continent Africain (1973). ........................................................................................................................................... 28 Figure IV. 1. Precambrian geology map of NW Botswana (Kampunzu et al., 2000). Box: location of Figure IV..2 in northwestern Botswana. Inset: location of the Okavango Delta in Botswana.. 49 Figure IV 2. Satellite image of the Okavango region showing the location of sampled boreholes. Fault zones related to the Okavango rift are prominent on this image. Insert: Okavango Delta alluvial fan morphology (courtesy of SAFARI 2000). Red rectangle: position of the main image........................................................................................................................................................ 50 Figure IV 3. Representative thin sections of Okavango sediments. (a) sand grains (some fractured) within a carbonate cement. (b) Sand grains within a minor diagenetic silica overgrowth. (c) Micritic calcrete forming between the sand grains. (d) sand grains showing considerable weathering on the surface......................................................................................... 60 Figure IV 4. Q-F-L diagram for the Okavango sediments (after Dickinson and Suczec, 1979) ... 61 Figure IV 5. Binary diagrams for Okavango Delta sediment: major elements compositions in wt.%............................................................................................................................................... 63 Figure IV 6. A-CN-K diagram (molecular proportions) for the Okavango sediments.................. 69 Figure IV. 7. Transition metal characteristics of the Okavango sediments in the plots Cr and V vs. TiO2 (a,b); Cr and V vs. Ni (c,d); Cr and Ni vs. MgO (e,f) and Cr and Ni vs. SiO2 ..................... 70 Figure IV. 8. Geochemical characteristics of the Okavango sediments in the binary diagrams: (a) K2O vs. Rb; (b) Sr vs. CO2; (c) Cs vs. Rb and (d) Ba vs. K2O. The Archaean trend for panel (d) is from data from Lahtinen (2000) .................................................................................................... 72 Figure IV. 9. Binary diagram Zr vs. Hf for the Okavango sediments ........................................... 73 Figure IV. 10. REE vs. Al2O3 diagrams for the Okavango sediments .......................................... 76 Figure IV. 11. Chondrite normalized REE plots of the Okavango sediments. PAAS plotted as reference ........................................................................................................................................ 77 Figure IV. 12. Geochemical characteristics of the Okavango sediments in the ternary diagrams: (a) La-Th-Sc showing a single evolution trend; (b) Th-Sc-Zr/10 and (c) Th-Hf-Co. Note that the Okavango sediment sample BH8262B overlaps with the composition of the Proterozoic granitoids sample CKP11220 from NW Botswana suggesting that these granitoids could be the source of this sediment .................................................................................................................. 78 Figure VI 1. Location of the palaeo-Makgadikgadi sub-basin (MSB) in relation to the Makgadikgadi-Okavango-Zambezi (MOZ) rift depression (D=location of TL date sites) ......... 124 Figure VI 2. Study area and sample locations on the northeastern margin of the palaeo-Makgadikgadi sub-basin.............................................................................................................. 128 Figure VI 3. Stratigraphic profiles of duricrusts in the three sample locations (SOW1-4=Location 1, SOW 10=Location 2, SOW7A and SOW 13=Location 3)...................................................... 131

255
Figure VI 4. 4A-Numerous rhyzoliths (A) in green, granular calcareous matrix at SOW3 S4 (bar=6 cm); 4B-Dessication cracking showing alteration of CaCO3 rich pebbles (A) by silica rich porewater SOW4 S3 (bar=10 cm); 4C-Lensoid terrazzo plates congealed in the SOW10 ridge (bar=5 cm); 4D- Lensoid terrazzo plates along the edge of Sua Pan near SOW10 (bar=8 cm).. 133 Figure VI 5. Results of bulk geochemical analysis showing the subdivision of samples into four litho-units based on relative percentages of SiO2 and CaCO3. Amounts of MgO and Al2O3 also shown. ......................................................................................................................................... 140 Figure VI 6. Trends in the lower quantity macro-elements relative to the four litho-units showing increasing MgO and Mg/Ca ratio with increasing CaCO3 (to left) and increase in remaining elements with increasing SiO2 (to right). Elements shown on histograms from left to right are Al2O3, K2O, Fe2O3, MgO, Na2O, TiO2 and the Mg/Ca ratio. ...................................................... 141 Figure VI 7. 7A-SEM photograph showing rounded quartz clast with evidence of shallow etch marks (A) and remobilised silica (B) with laminar calcrete (C) in SOW1 S5 sample. ;7B SEM photograph of silica rich organic casing (A) hosting bacterial cocci coating (B) (SOW4 S4); 7C SEM photograph detail of silica rich bacterial cocci showing developed and stunted growth forms (SOW4 S4); 7D SEM photograph showing Si rich (A) and Ca rich (B) pseudomorphs with 'onion ring' ghost structures (C) in an amorphous silica matrix (SOW10 shoreline SiO2 plate)............ 144 Figure VI 8. 8A SEM photograph of Ca rich clast showing transition stages from Ca rich interior (A) out towards the Si rich matrix (B) through a layered sequence of columnar and equiaxal calcite (C). (SOW10 shoreline SiO2 plate); 8B SEM photograph of a Si rich clast (B) with accreted columnar calcite (A) inferring impregnation with Si rich matrix silica (SOW10 shoreline SiO2 plate); 8C SEM photograph of Si rich fungal hyphae (A) emplaced over inter-particle voids (SOW13 S2); 8D SEM photograph of Si rich diatoms (A) about 30 µm from a fragmented death assemblage (SOW7A S2). ........................................................................................................... 148 Figure VII 1. Okavango Delta in NW Botswana showing Lake Ngami to the south-west. ........ 162 Figure VII 2. Satellite image of the Lake Ngami basin depicting the location of sampling site Ng-02, shoreline features and the faultscarp bounding the lake to the south. ................................... 166 Figure VII 3. Stratigraphic log of Ng-02 depicting the units within the sampling pit ................ 172 Figure VII 4. ESEM images of selected samples: a) centric valves of genus Aulacoseira; b) broken Surirella fragments from UP460 unit; c) calcrete nodule and quartz grains in UP440 unit; d) fragment of diatom on quartz grain from UP440 unit; e) broken diatom of genus Nitzschia from UP350 unit; f) large intact Surirella from UP120 sampled from a depth of 110 cm; g) genus Aulacoseira from UP120 sampled from 100 cm depth; h) broken fragments of genus Surirella taken from UP120 unit at 100 cm depth...................................................................................... 174 Figure VII 5. Selected elements and ratios plotted versus depth for profile Ng-02 .................... 177 Figure A1 1. Location map of the Okavango Delta in NW Botswana with rectangles showing the location of the surface water sampling. ....................................................................................... 228 Figure A1 2. Detailed map of the southern Okavango region showing the location of borehole sampling points............................................................................................................................ 230 Figure A1 3. Piper diagram for surface and groundwater samples. Surface water samples are represented by squares and groundwater samples by spheres. .................................................... 240 Figure A1 4. Binary diagrams for Okavango Delta surface and groundwater compositions. ..... 244 Figure A1 5. Binary diagrams for the Okavango Delta sediment compositions. ........................ 245 Figure V 1. Map of East African Rift System showing the Western and Eastern Branches and the Southern Complex. Boxes show location of study areas............................................................... 96 Figure V 2. Precambrian geology map of NW Botswana (Kampunzu et al., 2000). Box shows location of boreholes. Inset: location of the Okavango Delta in Botswana................................... 99

256
Figure V 3. A) showing location of Lake Tanganyika with respect to the Rungwe volcanic field and Lake Malawi: B) showing the structure and hydrology of Lake Tanganyika. Key 1-littoral platforms; 2-transverse shoals; 3-sub-basin deep zones (after Tiercelin and Mondeguer, 1991): C) geological map of the southern Lake Tanganyika basement (after Mondeguer, 1991); D) Mpulungu sub-basement showing bathymetry and location of MPU-10 and MPU-3 sites. ....... 101 Figure V 4. Plots of TiO2 (a), Al2O3/SiO2 (b), K2O/Na2O (c) and Al2O3/(CaO + Na2O) (d) versus Fe2O3 + MgO. Tectonic fields are oceanic island arc (OIA), continental island arc (CIA), active continental margin (ACM) and passive margin (PM) Green field represents the Okavango alluvial fan (AF) and the pink field represents Tanganyika lacustrine basin (LB). ................................. 105 Figure V 5. K2O/Na2O versus SiO2 discrimination diagram of Roser and Korsch (1986). Tectonic fields are oceanic island arc (OIA), active continental margin (ACM) and passive margin (PM) Green field represents the Okavango alluvial fan (AF) and pink field the Tanganyika lacustrine basin (LB).................................................................................................................................... 106 Figure V 6. Sandstone discriminant function diagram of Bhatia (1983). Green field represents the alluvial fan (AF) and the pink field the Tanganyika lacustrine basin (LB)................................. 107 Figure V 7. Discriminant function diagram for the provenance signatures of sandstone-mudstone suites using major elements (after Roser and Korsch, 1988) ...................................................... 108 Figure V 8. La-Th-Sc ternary diagram. Data for Okavango sediments from Huntsman-Mapila et al., 2005. ...................................................................................................................................... 110 Figure V 9. Chondrite normalized REE diagram showing the Okavango and Tanganyika sediments. PAAS is shown for comparison (black squares). Data for Okavango sediments from Huntsman-Mapila et al., 2005. .................................................................................................... 112 Figure VIII 1. A) Present ITCZ seasonal migration over Africa shown as dark grey band. Predominant wind directions are represented as black arrows. Figure from Grand Atlas du Continent Africain (1973): B) location of Lake Tanganyika with respect to the Rungwe volcanic field and Lake Malawi: C) the structure and hydrology of Lake Tanganyika. Key 1-littoral platforms; 2-transverse shoals; 3-sub-basin deep zones (after Tiercelin and Mondeguer, 1991): D) Mpulungu sub-basin showing bathymetry and location of MPU-10 and MPU-3 sites in addition to MPU-11 and MPU-12 (Mondeguer, 1991) and the T2 core (Livingstone, 1975)....................... 194 Figure VIII 2. MPU-3 and MPU-10 lithology: stratigraphic distribution of the main facies (after Mondeguer, 1991) ....................................................................................................................... 200 Figure VIII 3. Elemental ratios and concentrations plotted with age for both the MPU-3 and MPU-10 cores.............................................................................................................................. 204 Figure VIII 4. Selected redox- sensitive metals plotted against age for MPU-10 core. TOC data from Talbot et al. (2006) ............................................................................................................. 208

257
LISTE DES TABLEAUX Table IV 1. Petrographic characteristics of the Okavango sediments ........................................... 52 Table IV 2. Representative samples and sumary of the range of chemical compositions of the Okavango Delta sediments ............................................................................................................ 54 Table IV 3. Representative samples and summary of the range of inter-element ratios for the Okavango Delta sediments ............................................................................................................ 64 Table IV. 4.The range of elemental ratios in fine sandstones derived from felsic and maifc rocks and comparison with the range for the Okavango sediments. Potential source rocks from NW Botswana also included (CKP suite). ............................................................................................ 75 Table IV 5. Results from quantitative modelling using major and REEs ..................................... 85 Table VI 1. Data inputs for thermoluminescence analysis (see text for explanation) ................. 129 Table VI 2. Results of X-Ray diffraction analysis (vol%) on selected MSB strandline sediments...................................................................................................................................................... 136 Table VI 3. Major element composition in wt. % in relation to morpho-stratigraphic sequence from MSB strandlines (missing are Cr2O3 at 0.01 wt.% for all samples and MnO ranging from 0.01-0.09 wt.% for all samples)................................................................................................... 138 Table VI 4. Duricrust type and calcite-silica composition (wt.%) in relation to morpho-stratigraphic sequence from MSB strandlines. ............................................................................ 139 Table VI 5. Duricrust composition (wt.%) from samples SOW4 (4), SOW 13 (13) and SOW1 (1) from ESEM EDAX microprobe measurements .......................................................................... 146 Table VI 6. Summary of depositional and diagenetic characteristics of major duricrust deposits of northern Sua Pan (MSB) ............................................................................................................. 149 Table VII 1. Data inputs for TL................................................................................................... 170 Table VII 2. Results from C14 and TL dating............................................................................. 170 Table VII 3. Geochemical results for selected samples............................................................... 175 Table A1 1. Results from water quality analyses of the Okavango Delta samples ..................... 236 Table A1 2. Results of sediment sample analysis of the Okavango Delta sediments. ................ 243 Table V 1. The range of elemental ratios in shales and fine sandstones derived from felsic and mafic rocks (Pennsylvanian-Permian age, Colorado, USA) and comparison with the range for Okavango and Tanganyika sediments ......................................................................................... 111 Table VIII 1. Geochemical compositional ranges of Lake Tanganyika sediments for selected elements....................................................................................................................................... 202