LEWIS COUNTY Community Action Advisory Council · LEWIS COUNTY Community Action Advisory Council...
61
LEWIS COUNTY Community Action Advisory Council 2017 Community Assessment Approved by the LCOI Board of Directors on 3/27/17
-
Upload
nguyendiep -
Category
Documents
-
view
215 -
download
0
Transcript of LEWIS COUNTY Community Action Advisory Council · LEWIS COUNTY Community Action Advisory Council...
LEWIS COUNTY Community Action Advisory Council
2017
Community Assessment Approved by the LCOI Board of Directors on 3/27/17

CommunityNeedsAssessmentMethodology
In keeping with the Community Services Block Grant (CSBG), the core principles of ROMA (Results Oriented Management and Accountability) Cycle, and the organizational standards by which all Community Action Agencies are measured, Lewis County Opportunities, Inc. conducts periodic assessments of community needs. The previous community needs assessment was conducted, reviewed, and approved by the board of directors in 2011. This assessment is available on the agency website, agency Facebook page, and can be sent upon request.
The pages that follow contain data compiled from the community needs assessments completed between July 2016 and February 2017, consumer comment forms collected for 2016, the United Way “Alice Project” report, and the US Census Bureau American Community Survey. This compilation of data provides the framework for the agency’s strategic plan and annual Community Action work plan.
E-Mail: [email protected]
www.lewiscountyopportunities.com
8265 State Route 812 Lowville NY 13367
Phone: (315) 376-8202
Hotline: (315) 376-HELP (4357)Fax: (315) 376-8421

TableofContents
Acknowledgements ................................................................................................................................................................. 1
Committee Members .......................................................................................................................................................... 1
2017 Board of Directors ...................................................................................................................................................... 1
Agency Profile ......................................................................................................................................................................... 2
Funding ............................................................................................................................................................................... 2
Service Area ........................................................................................................................................................................ 2
Mission ................................................................................................................................................................................ 2
Vision ................................................................................................................................................................................... 2
Summary of Services ............................................................................................................................................................... 3
Service Goals ........................................................................................................................................................................... 4
Self Sufficiency ................................................................................................................................................................... 4
Transportation Services .......................................................................................................................................... 4
Volunteer Income Tax Assistance (VITA) ................................................................................................................ 4
Financial Empowerment Program .......................................................................................................................... 4
Thrift Store .............................................................................................................................................................. 5
Weatherization ....................................................................................................................................................... 5
Section 8 Housing .................................................................................................................................................... 5
Family Stability ................................................................................................................................................................... 5
Domestic Violence/Sexual Assault/Stalking/Other Victims of Crime ..................................................................... 5
Emergency Food Assistance .................................................................................................................................... 6
Child Passenger Safety ............................................................................................................................................ 6
Representative Payee Service ................................................................................................................................. 7
Shelter Plus Care ..................................................................................................................................................... 7
Homeless Apartment Initiative ............................................................................................................................... 7
Emergency Utility Assistance .................................................................................................................................. 7
Critical Needs .......................................................................................................................................................... 7
Service Demographics ............................................................................................................................................................ 8
Census Bureau Statistics ....................................................................................................................................................... 10
Population ......................................................................................................................................................................... 11
Income/Poverty ................................................................................................................................................................ 14
Food .................................................................................................................................................................................. 17
Education .......................................................................................................................................................................... 18
Housing ............................................................................................................................................................................. 19
Health/Insurance .............................................................................................................................................................. 20
Transportation .................................................................................................................................................................. 22
Safety ................................................................................................................................................................................ 23
The United Way Alice Project .............................................................................................................................................. 24
Economic Viability Dashboard ......................................................................................................................................... 24
ALICE Threshhold & Households by Race, Ethnicity, and Age – 2014 .......................................................................... 25
Housing Data – Lewis County .......................................................................................................................................... 25
Key Facts and ALICE Statistics by Municipality – 2014 ...................................................................................................... 26
Households by Income ...................................................................................................................................................... 26
ALICE in Lewis County ....................................................................................................................................................... 27
Agency Statistics ................................................................................................................................................................... 28
Consumer Survey Results .................................................................................................................................................. 29
Partner Survey Results ...................................................................................................................................................... 34
Workforce Survey Results ................................................................................................................................................. 37
Customer Satisfaction Survey Results ............................................................................................................................... 41
Key Findings .......................................................................................................................................................................... 42
Assessment Tools .................................................................................................................................................................. 46
Consumer Survey .............................................................................................................................................................. 47
Partner Survey ................................................................................................................................................................... 51
Partner’s Participating in Survey ....................................................................................................................................... 53
Workforce Survey ............................................................................................................................................................. 54
Customer Satisfaction Survey ........................................................................................................................................... 56
1
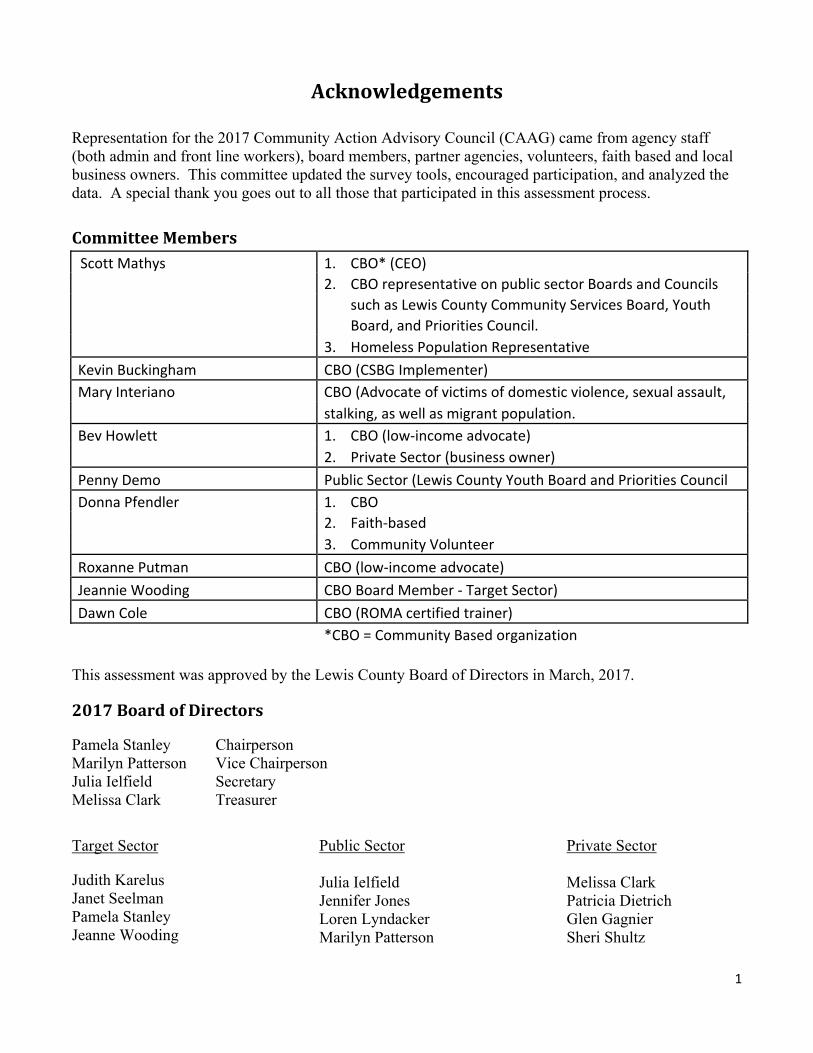
Acknowledgements Representation for the 2017 Community Action Advisory Council (CAAG) came from agency staff (both admin and front line workers), board members, partner agencies, volunteers, faith based and local business owners. This committee updated the survey tools, encouraged participation, and analyzed the data. A special thank you goes out to all those that participated in this assessment process.
CommitteeMembers Scott Mathys 1. CBO* (CEO)
2. CBO representative on public sector Boards and Councils
such as Lewis County Community Services Board, Youth
Board, and Priorities Council.
3. Homeless Population Representative
Kevin Buckingham CBO (CSBG Implementer)
Mary Interiano CBO (Advocate of victims of domestic violence, sexual assault,
stalking, as well as migrant population.
Bev Howlett 1. CBO (low‐income advocate)
2. Private Sector (business owner)
Penny Demo Public Sector (Lewis County Youth Board and Priorities Council
Donna Pfendler 1. CBO
2. Faith‐based
3. Community Volunteer
Roxanne Putman CBO (low‐income advocate)
Jeannie Wooding CBO Board Member ‐ Target Sector)
Dawn Cole CBO (ROMA certified trainer)
*CBO = Community Based organization
This assessment was approved by the Lewis County Board of Directors in March, 2017.
2017BoardofDirectors
Pamela Stanley Chairperson Marilyn Patterson Vice Chairperson Julia Ielfield Secretary Melissa Clark Treasurer
Target Sector
Judith Karelus Janet Seelman Pamela Stanley Jeanne Wooding
Public Sector Julia Ielfield Jennifer Jones Loren Lyndacker Marilyn Patterson
Private Sector Melissa Clark Patricia Dietrich Glen Gagnier Sheri Shultz
2
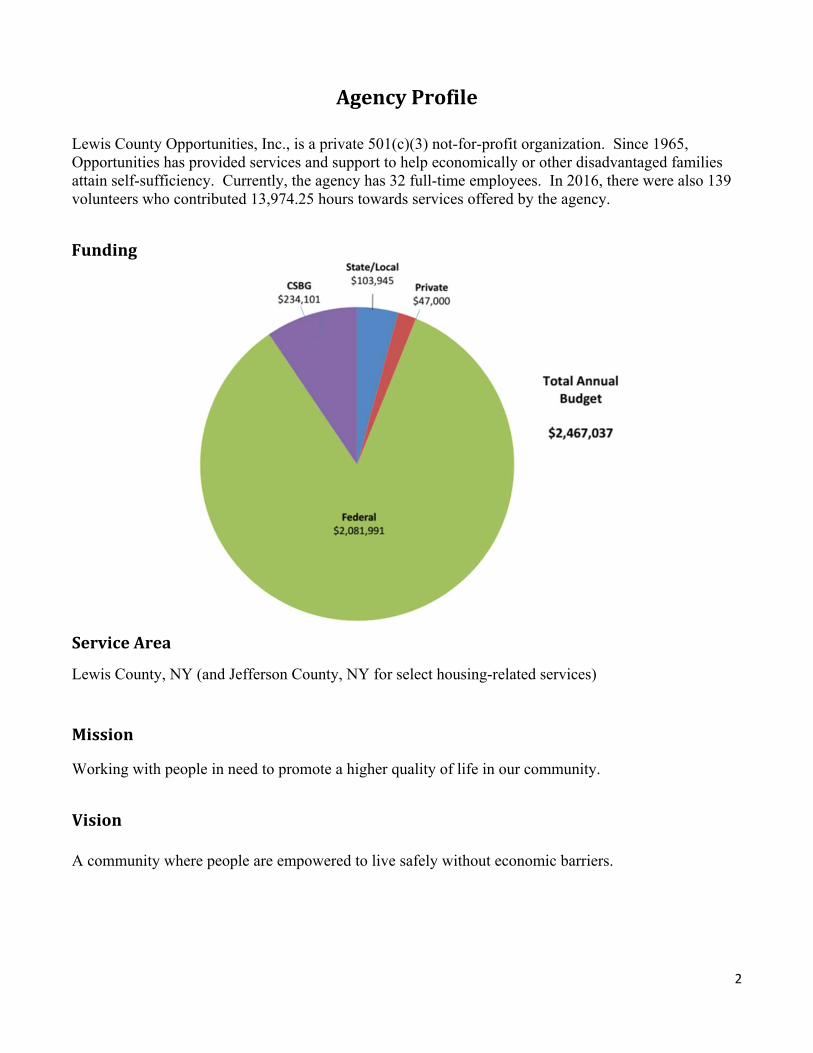
AgencyProfile Lewis County Opportunities, Inc., is a private 501(c)(3) not-for-profit organization. Since 1965, Opportunities has provided services and support to help economically or other disadvantaged families attain self-sufficiency. Currently, the agency has 32 full-time employees. In 2016, there were also 139 volunteers who contributed 13,974.25 hours towards services offered by the agency.
ServiceArea
Lewis County, NY (and Jefferson County, NY for select housing-related services)
Mission
Working with people in need to promote a higher quality of life in our community.
Vision A community where people are empowered to live safely without economic barriers.
Funding

3
SummaryofServices
4
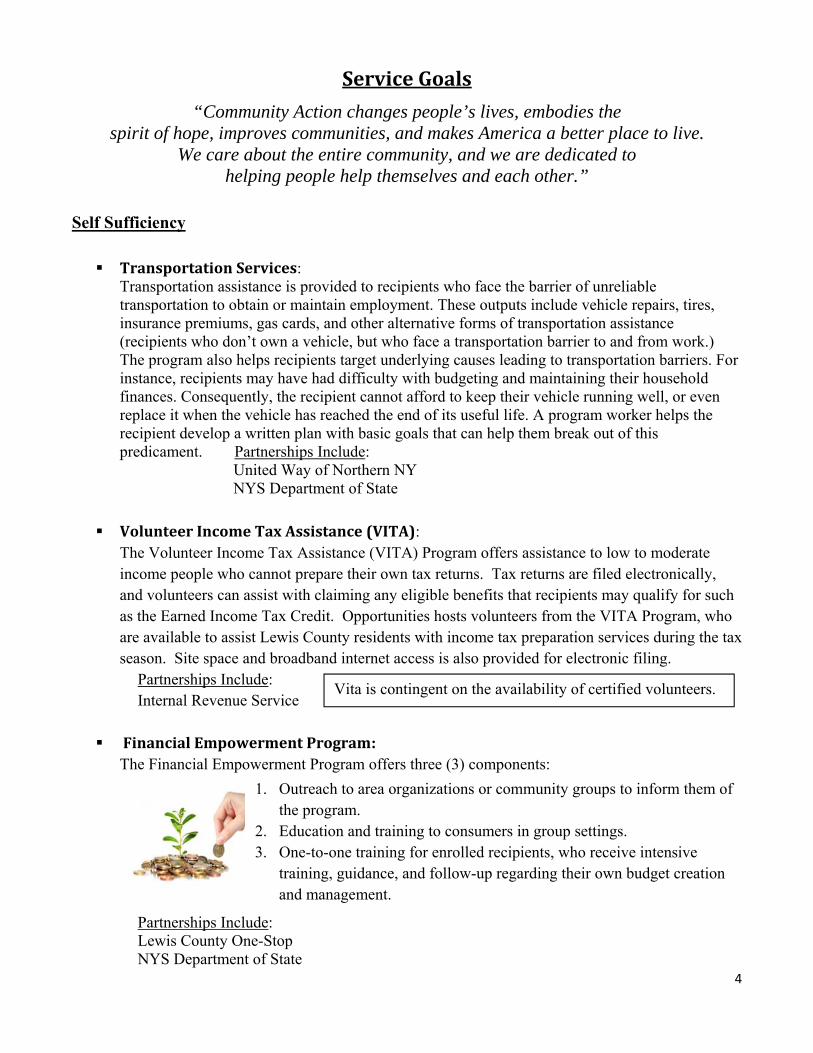
ServiceGoals
“Community Action changes people’s lives, embodies the spirit of hope, improves communities, and makes America a better place to live.
We care about the entire community, and we are dedicated to helping people help themselves and each other.”
Self Sufficiency
TransportationServices: Transportation assistance is provided to recipients who face the barrier of unreliable transportation to obtain or maintain employment. These outputs include vehicle repairs, tires, insurance premiums, gas cards, and other alternative forms of transportation assistance (recipients who don’t own a vehicle, but who face a transportation barrier to and from work.) The program also helps recipients target underlying causes leading to transportation barriers. For instance, recipients may have had difficulty with budgeting and maintaining their household finances. Consequently, the recipient cannot afford to keep their vehicle running well, or even replace it when the vehicle has reached the end of its useful life. A program worker helps the recipient develop a written plan with basic goals that can help them break out of this predicament. Partnerships Include:
United Way of Northern NY NYS Department of State
VolunteerIncomeTaxAssistance(VITA): The Volunteer Income Tax Assistance (VITA) Program offers assistance to low to moderate income people who cannot prepare their own tax returns. Tax returns are filed electronically, and volunteers can assist with claiming any eligible benefits that recipients may qualify for such as the Earned Income Tax Credit. Opportunities hosts volunteers from the VITA Program, who are available to assist Lewis County residents with income tax preparation services during the tax season. Site space and broadband internet access is also provided for electronic filing.
Partnerships Include: Internal Revenue Service
FinancialEmpowermentProgram: The Financial Empowerment Program offers three (3) components:
Partnerships Include: Lewis County One-Stop NYS Department of State
Vita is contingent on the availability of certified volunteers.
1. Outreach to area organizations or community groups to inform them of the program.
2. Education and training to consumers in group settings. 3. One-to-one training for enrolled recipients, who receive intensive
training, guidance, and follow-up regarding their own budget creation and management.
5
Community Revitalization ThriftStore:
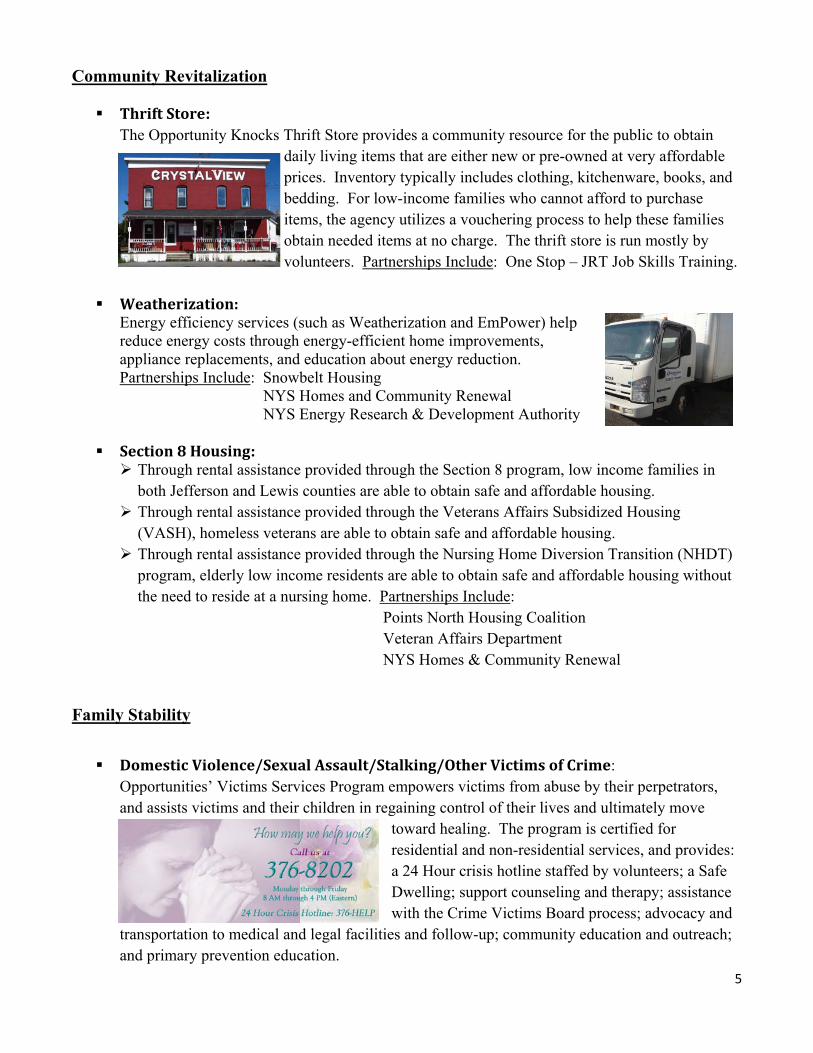
The Opportunity Knocks Thrift Store provides a community resource for the public to obtain daily living items that are either new or pre-owned at very affordable prices. Inventory typically includes clothing, kitchenware, books, and bedding. For low-income families who cannot afford to purchase items, the agency utilizes a vouchering process to help these families obtain needed items at no charge. The thrift store is run mostly by volunteers. Partnerships Include: One Stop – JRT Job Skills Training.
Weatherization:
Energy efficiency services (such as Weatherization and EmPower) help reduce energy costs through energy-efficient home improvements, appliance replacements, and education about energy reduction. Partnerships Include: Snowbelt Housing
NYS Homes and Community Renewal NYS Energy Research & Development Authority
Section8Housing: Through rental assistance provided through the Section 8 program, low income families in
both Jefferson and Lewis counties are able to obtain safe and affordable housing. Through rental assistance provided through the Veterans Affairs Subsidized Housing
(VASH), homeless veterans are able to obtain safe and affordable housing. Through rental assistance provided through the Nursing Home Diversion Transition (NHDT)
program, elderly low income residents are able to obtain safe and affordable housing without the need to reside at a nursing home. Partnerships Include:
Points North Housing Coalition Veteran Affairs Department NYS Homes & Community Renewal
Family Stability
DomesticViolence/SexualAssault/Stalking/OtherVictimsofCrime: Opportunities’ Victims Services Program empowers victims from abuse by their perpetrators, and assists victims and their children in regaining control of their lives and ultimately move
toward healing. The program is certified for residential and non-residential services, and provides: a 24 Hour crisis hotline staffed by volunteers; a Safe Dwelling; support counseling and therapy; assistance with the Crime Victims Board process; advocacy and
transportation to medical and legal facilities and follow-up; community education and outreach; and primary prevention education.

6
Partnerships Include: Beaver River Central School BOCES Copenhagen Central School Countryside Veterinary Clinic Human Trafficking Task Force Legal Aid Society of Mid NY Lewis County Department of Social Services Lewis County District Attorney’s Office NYS Coalition Against Domestic Violence NYS Department of Health NYS Division of Criminal Justice Services NYS Office of Victim Services
Child Advocacy Center (Victim’s Assistance Center) NYS Office of Family & Child Services NYS Coalition Against Sexual Assault NYS 5th Judicial District – Lewis County Lewis County General Hospital Lewis County Mental Hygiene Department Lewis County Probation Deptartment Lewis County Sheriff’s Department Lowville Village Police Department NYS Police Rubenzahl, Knudson & Associates North Country Transitional Living Services
EmergencyFoodAssistance:
Opportunities provides technical support and 501c3 fiduciary oversight for 5 pantries within Lewis County, including its own pantry located on-site in New Bremen. The 4 other pantries within the network are located in other villages throughout the county, and are operated mostly by volunteers. Emergency food is provided to families in need, and typically involves a 3 to 5 day supply in a given month.
Partnerships Include: Copenhagen Food Pantry Croghan Food Pantry Harrisville Food Pantry
Port Leyden Food Pantry Food Bank of Central NY
Northern NY Community Foundation NYS Department of State
ChildPassengerSafety: The Child Passenger Safety program ensures that low-income families who cannot afford to purchase child passenger seats have access to this resource to promote the safe travel of their children. Parents/caregivers are educated about the proper installation, fit, and maintenance of the particular seat(s) received. Partnerships Include: Governor’s Traffic Safety Committee NYS Department of State

7
RepresentativePayeeService: Opportunities is assigned by the Social Security Administration to assist individuals with financial management who receive Social Security benefits, Supplemental Security Income, and/or Social Security Disability. The intent of the program is to help individuals who are unable to manage their social security funds maintain their independent living situation by ensuring these funds are appropriately used for allowable needs.
Partnerships Include: Social Security Administration NYS Department of State
ShelterPlusCare: Through rental assistance provided through the Shelter Plus Care Program, low income families who are disabled and chronically homeless are able to obtain safe and affordable housing.
Partnerships Include: Jefferson County Department of Social Services
HomelessApartmentInitiative:
The Homeless Apartment Initiative is designed to accommodate individuals or families in Lewis County with temporary housing who are homeless; who are ineligible or on a waiting list for other housing programs within the community; and who have exhausted all natural supports within the community for temporary housing. The initiative provides up to thirty (30) days of temporary housing within the Village of Lowville, where community supports exist for a variety of daily living needs, anticipating the limited transportation options of temporary residents.
Partnerships Include: Lewis County Department of Social Services
EmergencyUtilityAssistance: Through emergency utility assistance, low-income families will obtain a support service that promotes safe and affordable housing. Partnerships Include: United Way Worldwide Emergency Food & Shelter (FEMA) National Grid (Care & Share)
CriticalNeeds: Critical Needs provides emergency support services for a variety of needs which are underwritten by community donations or self-funded by the agency. Partnerships Include: NYS Department of State
8
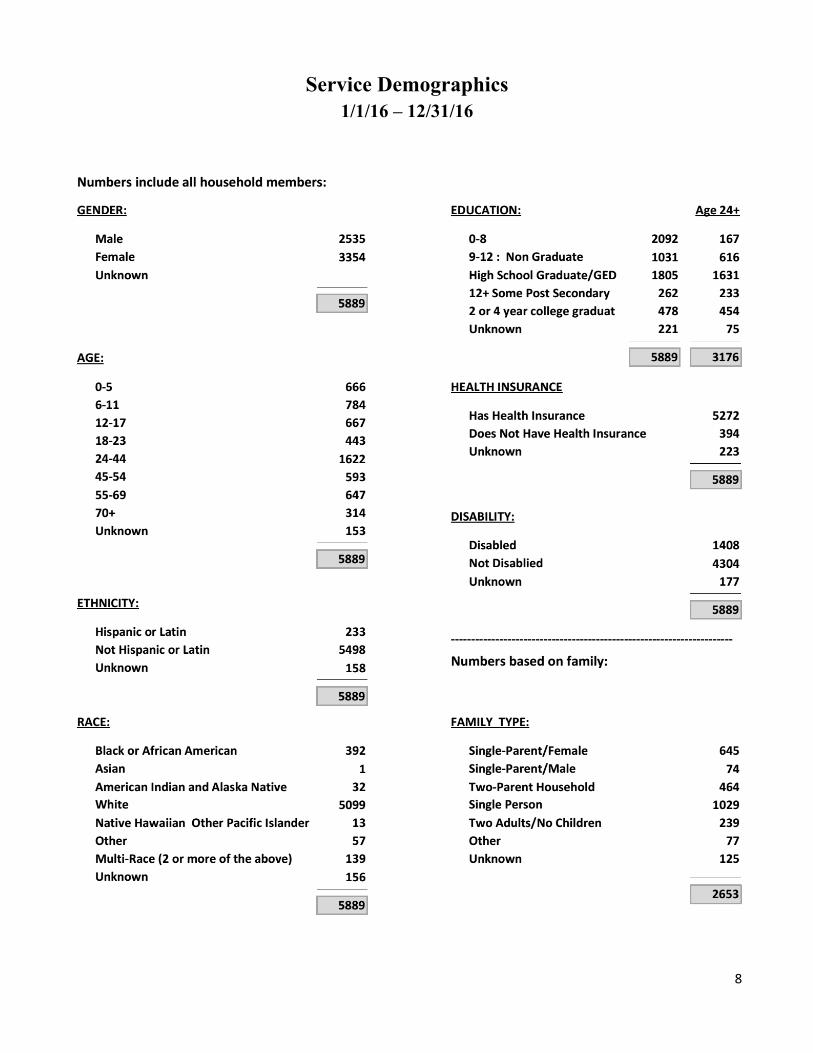
Service Demographics 1/1/16 – 12/31/16
9
10
CensusBureauStatistics
This section contains general demographic and statistical
information at the county level obtained through the US
Census Bureau, American Community Survey.
It provides a macro picture of the community.
11
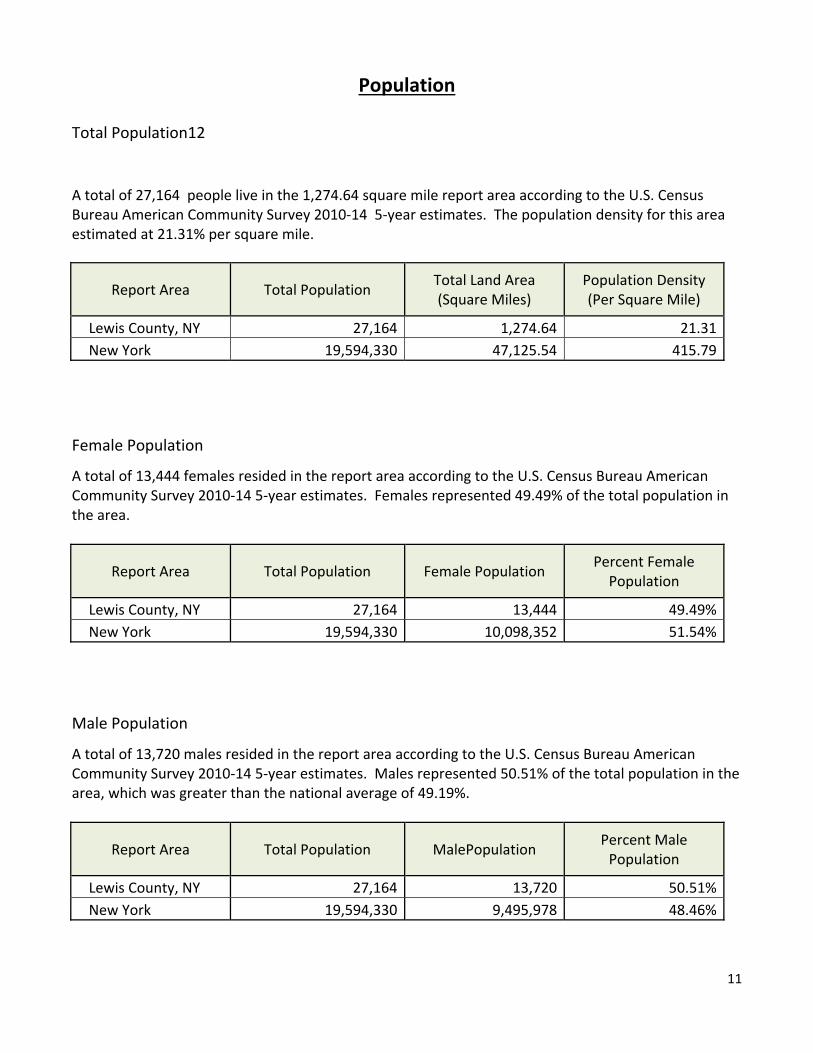
Population Total Population12
A total of 27,164 people live in the 1,274.64 square mile report area according to the U.S. Census Bureau American Community Survey 2010‐14 5‐year estimates. The population density for this area estimated at 21.31% per square mile.
Report Area Total Population Total Land Area (Square Miles)
Population Density (Per Square Mile)
Lewis County, NY 27,164 1,274.64 21.31
New York 19,594,330 47,125.54 415.79
Female Population
A total of 13,444 females resided in the report area according to the U.S. Census Bureau American Community Survey 2010‐14 5‐year estimates. Females represented 49.49% of the total population in the area.
Report Area Total Population Female Population Percent Female Population
Lewis County, NY 27,164 13,444 49.49%
New York 19,594,330 10,098,352 51.54%
Male Population
A total of 13,720 males resided in the report area according to the U.S. Census Bureau American Community Survey 2010‐14 5‐year estimates. Males represented 50.51% of the total population in the area, which was greater than the national average of 49.19%.
Report Area Total Population MalePopulation Percent Male Population
Lewis County, NY 27,164 13,720 50.51%
New York 19,594,330 9,495,978 48.46%
12
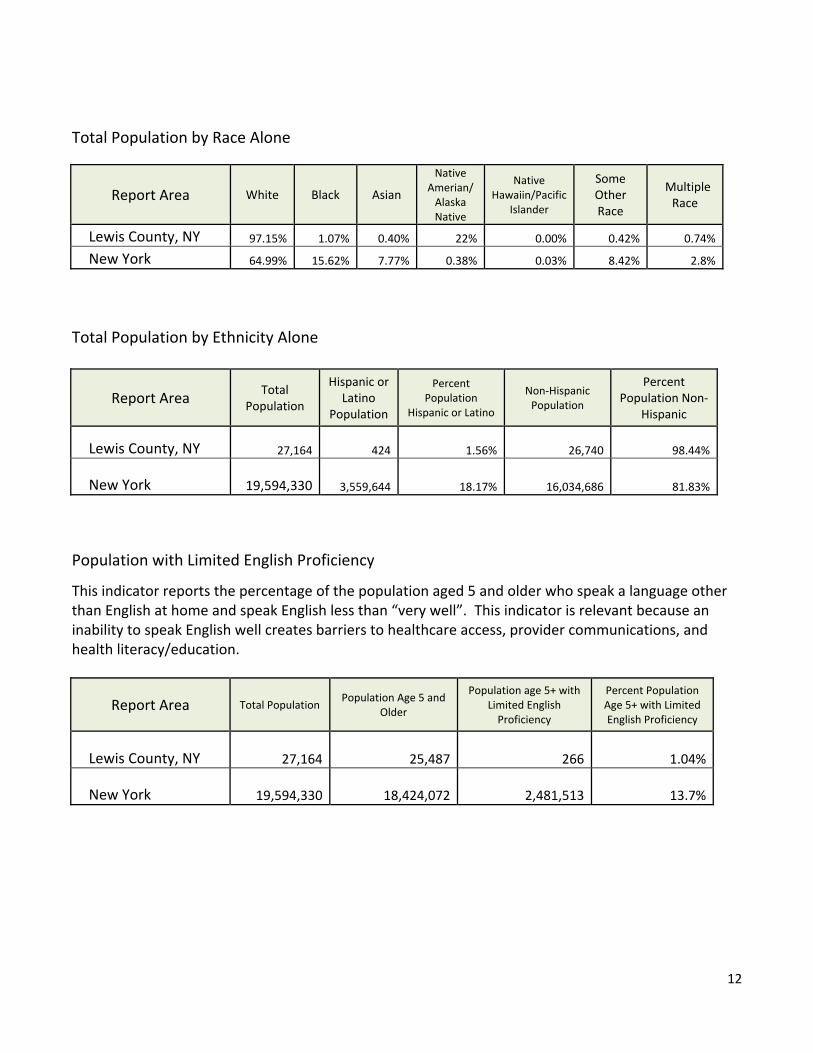
Total Population by Race Alone
Report Area White Black Asian
Native Amerian/ Alaska Native
Native Hawaiin/Pacific
Islander
Some Other Race
Multiple Race
Lewis County, NY 97.15% 1.07% 0.40% 22% 0.00% 0.42% 0.74%
New York 64.99% 15.62% 7.77% 0.38% 0.03% 8.42% 2.8%
Total Population by Ethnicity Alone
Report Area Total
Population
Hispanic or Latino
Population
Percent Population
Hispanic or Latino
Non‐Hispanic Population
Percent Population Non‐
Hispanic
Lewis County, NY
27,164
424 1.56%
26,740 98.44%
New York
19,594,330
3,559,644 18.17%
16,034,686 81.83%
Population with Limited English Proficiency
This indicator reports the percentage of the population aged 5 and older who speak a language other than English at home and speak English less than “very well”. This indicator is relevant because an inability to speak English well creates barriers to healthcare access, provider communications, and health literacy/education.
Report Area Total Population Population Age 5 and
Older
Population age 5+ with Limited English Proficiency
Percent Population Age 5+ with Limited English Proficiency
Lewis County, NY
27,164
25,487
266 1.04%
New York
19,594,330
18,424,072
2,481,513 13.7%

13
Families with Children
According to the most recent American Community Survey estimates, 31.01% of all occupied households in the report area are family households with one or more child(ren) under the age of 18. As defined by the US Census Bureau, a family household is any housing unit in which the householder is living with one or more individuals related to him or her by birth, marriage, or adoption. A non‐family household is any household occupied by the householder alone, or by the householder and one or more unrelated individuals.
Report Area Total
Households Total Family Households
Families with Children (Under age 18)
Families with Children (Under 18), Percent of Total Households
Lewis County, NY
10,726 7,583 3,326 31.01%
New York
7,255,528
4,636,017
2,251,251 31.03%
Population with Any Disability
This indicator reports the percentage of the total civilian non‐institutionalized population with a disability. This indicator is relevant because disabled individuals comprise a vulnerable population that requires targeted services and outreach by providers.
Report Area Total Population (for whom
Disability Status is Determined) Total Population with a
Disability Percent of Population
with a Disability
Lewis County, NY 26,775 3,651 13.64%
New York 19,342,656 2,120,273 10.96%
Veteran Population
This indicator reports the percentage of the population age 18 and older that served (even for a short time), but is not currently serving on active duty in the US Army, Navy, Airforce, Marine Corps, or the Coast Guard, or that served in the US Merchant Marines during WWII.
Report Area Total Population Age 18 and
Older Total Veterans
Veterans, Percent of Total Population
Lewis County, NY 20,514 2,251 10.97%
New York 15,298,282 868,764 5.68%
14
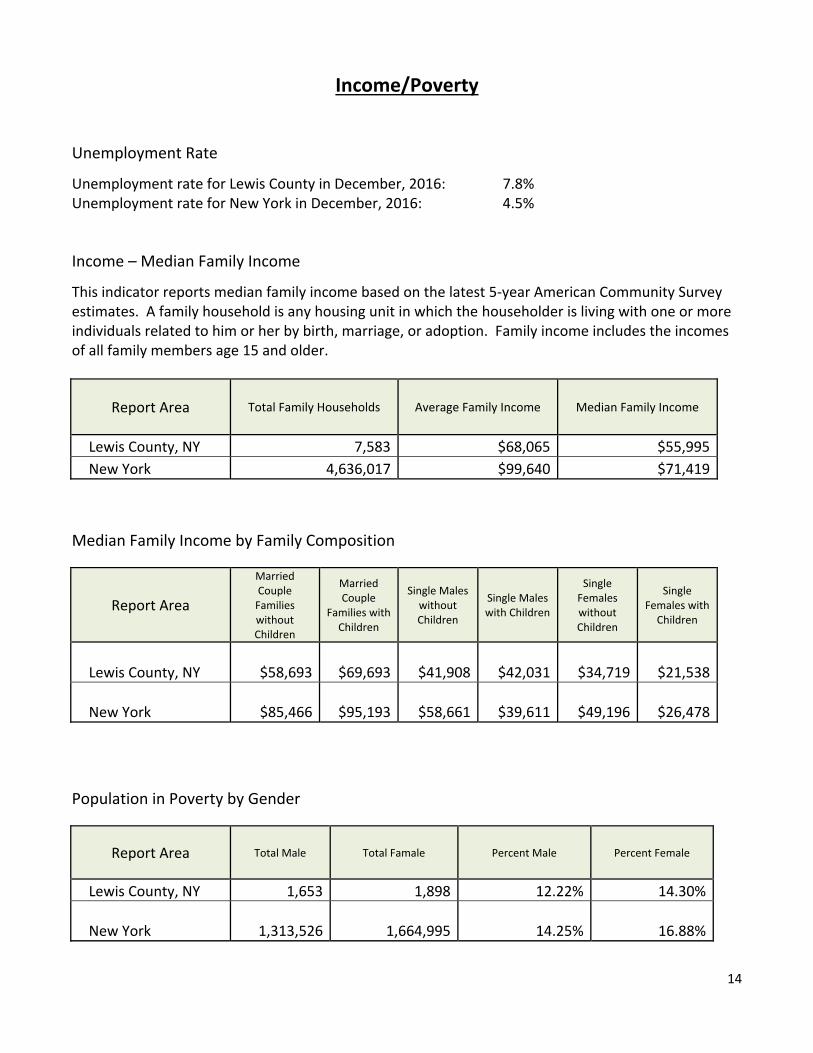
Income/Poverty Unemployment Rate
Unemployment rate for Lewis County in December, 2016: 7.8% Unemployment rate for New York in December, 2016: 4.5%
Income – Median Family Income
This indicator reports median family income based on the latest 5‐year American Community Survey estimates. A family household is any housing unit in which the householder is living with one or more individuals related to him or her by birth, marriage, or adoption. Family income includes the incomes of all family members age 15 and older.
Report Area Total Family Households Average Family Income Median Family Income
Lewis County, NY 7,583 $68,065 $55,995
New York 4,636,017 $99,640 $71,419
Median Family Income by Family Composition
Report Area
Married Couple Families without Children
Married Couple
Families with Children
Single Males without Children
Single Males with Children
Single Females without Children
Single Females with
Children
Lewis County, NY $58,693
$69,693
$41,908
$42,031
$34,719
$21,538
New York $85,466
$95,193
$58,661
$39,611
$49,196
$26,478
Population in Poverty by Gender
Report Area Total Male Total Famale Percent Male Percent Female
Lewis County, NY 1,653 1,898 12.22% 14.30%
New York
1,313,526
1,664,995 14.25% 16.88%
15
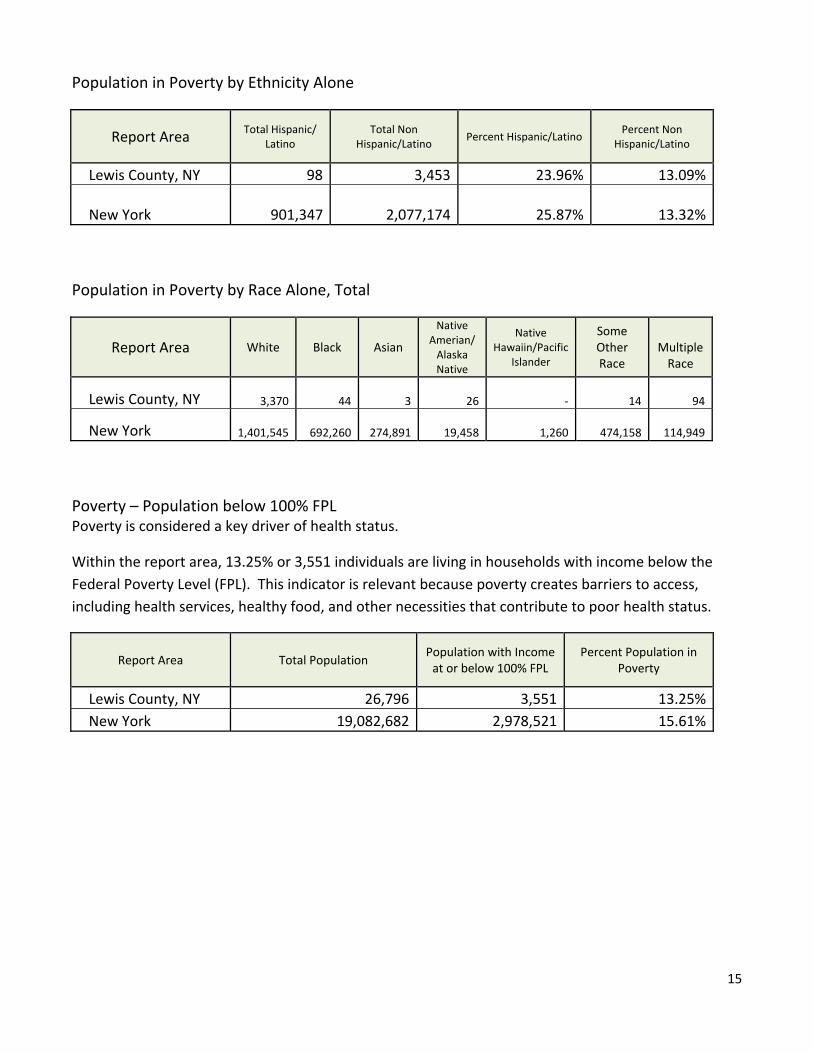
Population in Poverty by Ethnicity Alone
Report Area Total Hispanic/
Latino Total Non
Hispanic/Latino Percent Hispanic/Latino
Percent Non Hispanic/Latino
Lewis County, NY 98 3,453 23.96% 13.09%
New York 901,347
2,077,174 25.87% 13.32%
Population in Poverty by Race Alone, Total
Report Area White Black Asian
Native Amerian/ Alaska Native
Native Hawaiin/Pacific
Islander
Some Other Race
Multiple Race
Lewis County, NY
3,370
44
3
26 ‐ 14
94
New York
1,401,545
692,260
274,891
19,458 1,260
474,158
114,949
Poverty – Population below 100% FPL Poverty is considered a key driver of health status.
Within the report area, 13.25% or 3,551 individuals are living in households with income below the
Federal Poverty Level (FPL). This indicator is relevant because poverty creates barriers to access,
including health services, healthy food, and other necessities that contribute to poor health status.
Report Area Total Population Population with Income at or below 100% FPL
Percent Population in Poverty
Lewis County, NY 26,796 3,551 13.25%
New York 19,082,682 2,978,521 15.61%
16
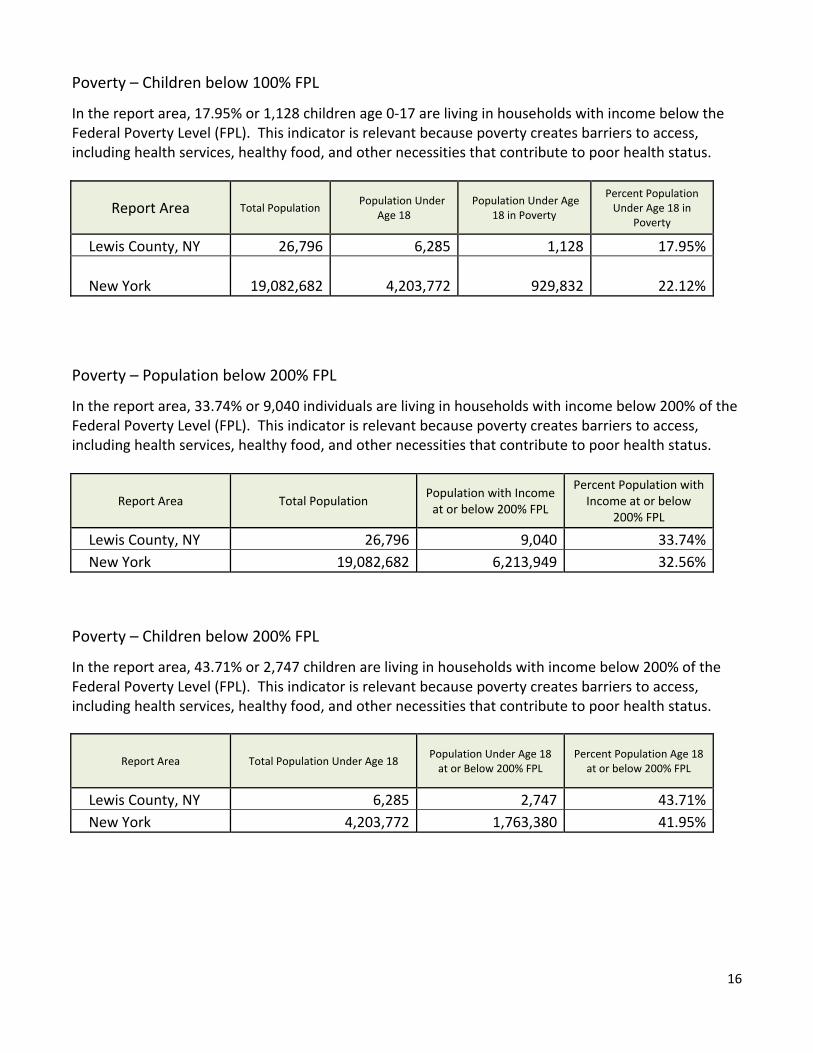
Poverty – Children below 100% FPL
In the report area, 17.95% or 1,128 children age 0‐17 are living in households with income below the Federal Poverty Level (FPL). This indicator is relevant because poverty creates barriers to access, including health services, healthy food, and other necessities that contribute to poor health status.
Report Area Total Population Population Under
Age 18 Population Under Age
18 in Poverty
Percent Population Under Age 18 in
Poverty
Lewis County, NY 26,796 6,285 1,128 17.95%
New York
19,082,682
4,203,772 929,832 22.12%
Poverty – Population below 200% FPL
In the report area, 33.74% or 9,040 individuals are living in households with income below 200% of the Federal Poverty Level (FPL). This indicator is relevant because poverty creates barriers to access, including health services, healthy food, and other necessities that contribute to poor health status.
Report Area Total Population Population with Income at or below 200% FPL
Percent Population with Income at or below
200% FPL
Lewis County, NY 26,796 9,040 33.74%
New York 19,082,682 6,213,949 32.56%
Poverty – Children below 200% FPL
In the report area, 43.71% or 2,747 children are living in households with income below 200% of the Federal Poverty Level (FPL). This indicator is relevant because poverty creates barriers to access, including health services, healthy food, and other necessities that contribute to poor health status.
Report Area Total Population Under Age 18 Population Under Age 18 at or Below 200% FPL
Percent Population Age 18 at or below 200% FPL
Lewis County, NY 6,285 2,747 43.71%
New York 4,203,772 1,763,380 41.95%
17
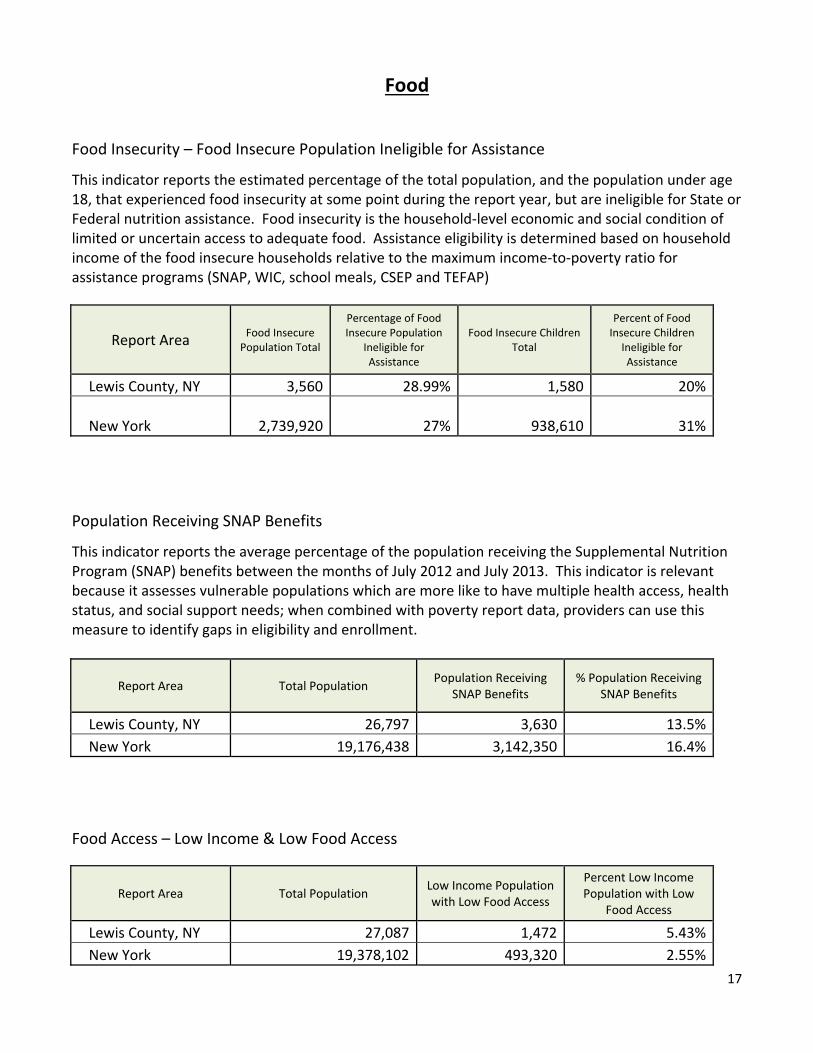
Food
Food Insecurity – Food Insecure Population Ineligible for Assistance
This indicator reports the estimated percentage of the total population, and the population under age 18, that experienced food insecurity at some point during the report year, but are ineligible for State or Federal nutrition assistance. Food insecurity is the household‐level economic and social condition of limited or uncertain access to adequate food. Assistance eligibility is determined based on household income of the food insecure households relative to the maximum income‐to‐poverty ratio for assistance programs (SNAP, WIC, school meals, CSEP and TEFAP)
Report Area Food Insecure Population Total
Percentage of Food Insecure Population
Ineligible for Assistance
Food Insecure Children Total
Percent of Food Insecure Children
Ineligible for Assistance
Lewis County, NY 3,560 28.99% 1,580 20%
New York
2,739,920 27% 938,610 31%
Population Receiving SNAP Benefits
This indicator reports the average percentage of the population receiving the Supplemental Nutrition Program (SNAP) benefits between the months of July 2012 and July 2013. This indicator is relevant because it assesses vulnerable populations which are more like to have multiple health access, health status, and social support needs; when combined with poverty report data, providers can use this measure to identify gaps in eligibility and enrollment.
Report Area Total Population Population Receiving
SNAP Benefits % Population Receiving
SNAP Benefits
Lewis County, NY 26,797 3,630 13.5%
New York 19,176,438 3,142,350 16.4%
Food Access – Low Income & Low Food Access
Report Area Total Population Low Income Population with Low Food Access
Percent Low Income Population with Low
Food Access
Lewis County, NY 27,087 1,472 5.43%
New York 19,378,102 493,320 2.55%
18
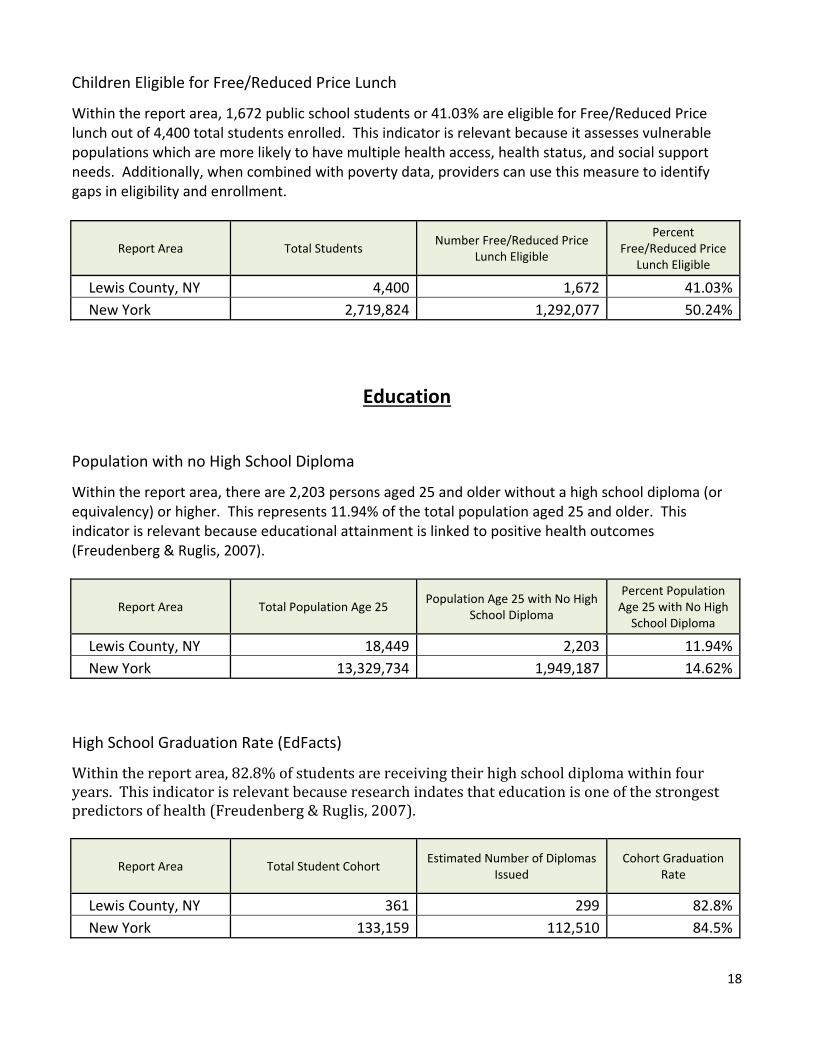
Children Eligible for Free/Reduced Price Lunch
Within the report area, 1,672 public school students or 41.03% are eligible for Free/Reduced Price lunch out of 4,400 total students enrolled. This indicator is relevant because it assesses vulnerable populations which are more likely to have multiple health access, health status, and social support needs. Additionally, when combined with poverty data, providers can use this measure to identify gaps in eligibility and enrollment.
Report Area Total Students Number Free/Reduced Price
Lunch Eligible
Percent Free/Reduced Price
Lunch Eligible
Lewis County, NY 4,400 1,672 41.03%
New York 2,719,824 1,292,077 50.24%
Education
Population with no High School Diploma
Within the report area, there are 2,203 persons aged 25 and older without a high school diploma (or equivalency) or higher. This represents 11.94% of the total population aged 25 and older. This indicator is relevant because educational attainment is linked to positive health outcomes (Freudenberg & Ruglis, 2007).
Report Area Total Population Age 25 Population Age 25 with No High
School Diploma
Percent Population Age 25 with No High
School Diploma
Lewis County, NY 18,449 2,203 11.94%
New York 13,329,734 1,949,187 14.62%
High School Graduation Rate (EdFacts)
Withinthereportarea,82.8%ofstudentsarereceivingtheirhighschooldiplomawithinfouryears.Thisindicatorisrelevantbecauseresearchindatesthateducationisoneofthestrongestpredictorsofhealth(Freudenberg&Ruglis,2007).
Report Area Total Student Cohort Estimated Number of Diplomas
Issued Cohort Graduation
Rate
Lewis County, NY 361 299 82.8%
New York 133,159 112,510 84.5%
19
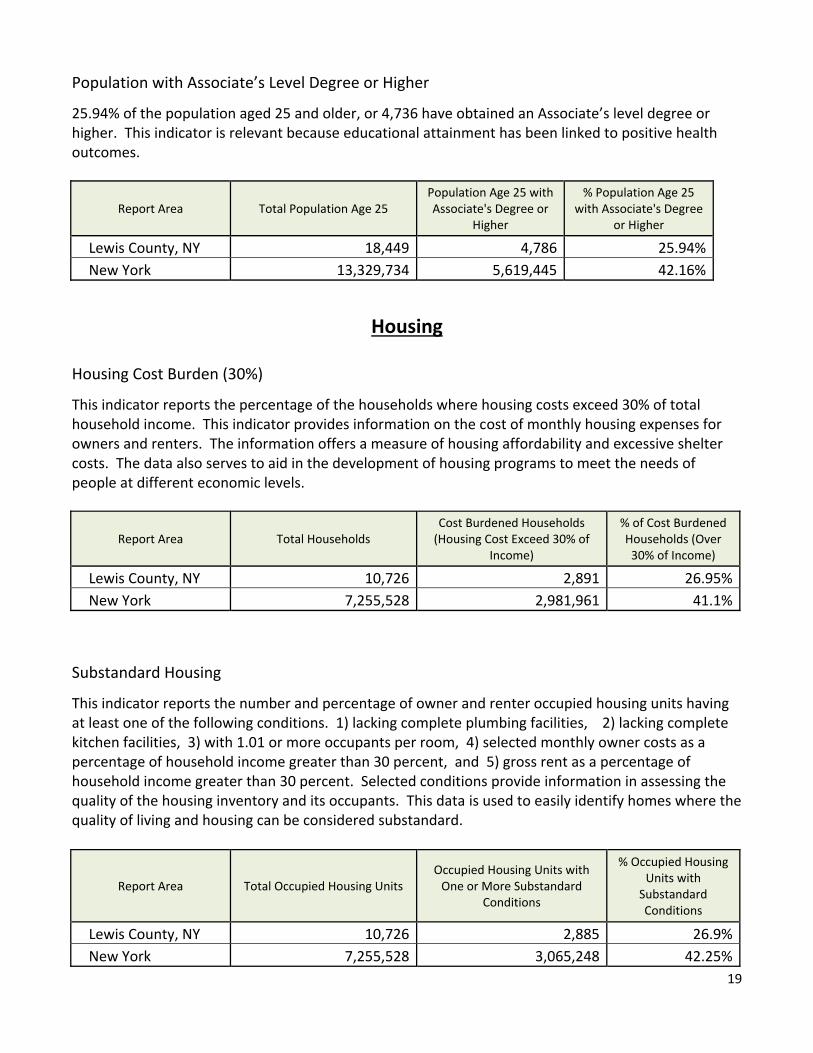
Population with Associate’s Level Degree or Higher
25.94% of the population aged 25 and older, or 4,736 have obtained an Associate’s level degree or higher. This indicator is relevant because educational attainment has been linked to positive health outcomes.
Report Area Total Population Age 25 Population Age 25 with Associate's Degree or
Higher
% Population Age 25 with Associate's Degree
or Higher
Lewis County, NY 18,449 4,786 25.94%
New York 13,329,734 5,619,445 42.16%
Housing Housing Cost Burden (30%)
This indicator reports the percentage of the households where housing costs exceed 30% of total household income. This indicator provides information on the cost of monthly housing expenses for owners and renters. The information offers a measure of housing affordability and excessive shelter costs. The data also serves to aid in the development of housing programs to meet the needs of people at different economic levels.
Report Area Total Households Cost Burdened Households (Housing Cost Exceed 30% of
Income)
% of Cost Burdened Households (Over 30% of Income)
Lewis County, NY 10,726 2,891 26.95%
New York 7,255,528 2,981,961 41.1%
Substandard Housing
This indicator reports the number and percentage of owner and renter occupied housing units having at least one of the following conditions. 1) lacking complete plumbing facilities, 2) lacking complete kitchen facilities, 3) with 1.01 or more occupants per room, 4) selected monthly owner costs as a percentage of household income greater than 30 percent, and 5) gross rent as a percentage of household income greater than 30 percent. Selected conditions provide information in assessing the quality of the housing inventory and its occupants. This data is used to easily identify homes where the quality of living and housing can be considered substandard.
Report Area Total Occupied Housing Units Occupied Housing Units with One or More Substandard
Conditions
% Occupied Housing Units with Substandard Conditions
Lewis County, NY 10,726 2,885 26.9%
New York 7,255,528 3,065,248 42.25%
20
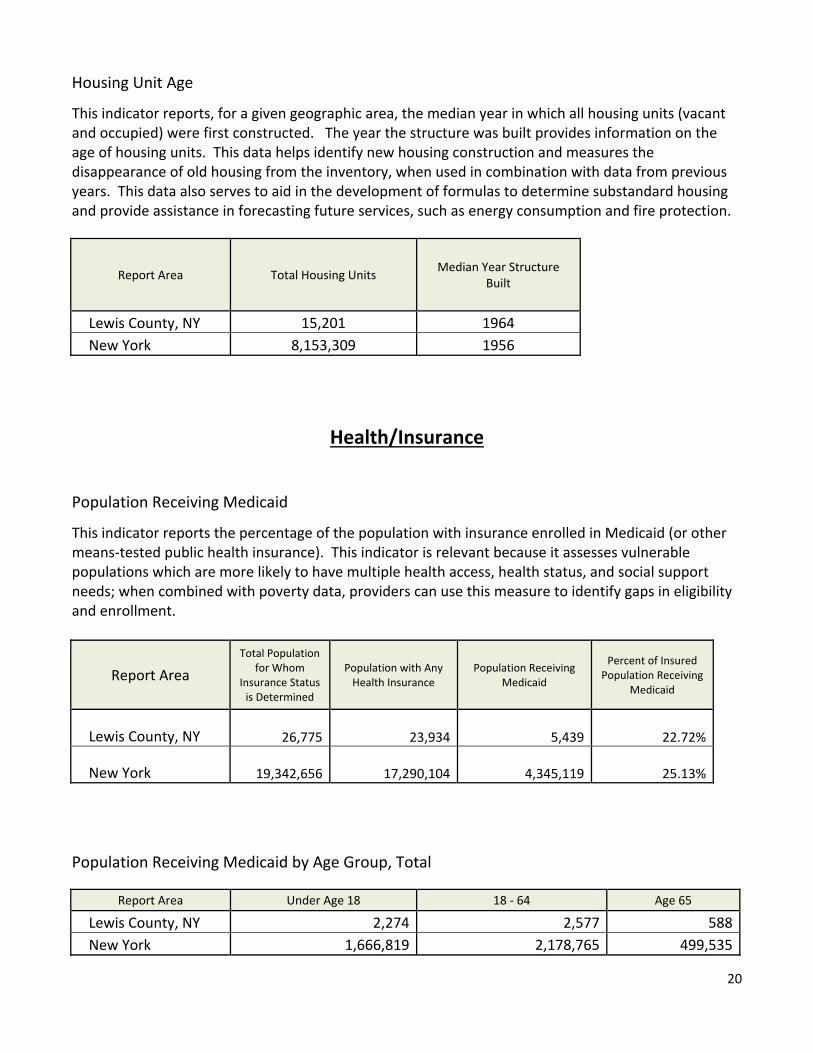
Housing Unit Age
This indicator reports, for a given geographic area, the median year in which all housing units (vacant and occupied) were first constructed. The year the structure was built provides information on the age of housing units. This data helps identify new housing construction and measures the disappearance of old housing from the inventory, when used in combination with data from previous years. This data also serves to aid in the development of formulas to determine substandard housing and provide assistance in forecasting future services, such as energy consumption and fire protection.
Report Area Total Housing Units Median Year Structure
Built
Lewis County, NY 15,201 1964
New York 8,153,309 1956
Health/Insurance
Population Receiving Medicaid
This indicator reports the percentage of the population with insurance enrolled in Medicaid (or other means‐tested public health insurance). This indicator is relevant because it assesses vulnerable populations which are more likely to have multiple health access, health status, and social support needs; when combined with poverty data, providers can use this measure to identify gaps in eligibility and enrollment.
Report Area
Total Population for Whom
Insurance Status is Determined
Population with Any Health Insurance
Population Receiving Medicaid
Percent of Insured Population Receiving
Medicaid
Lewis County, NY
26,775
23,934
5,439 22.72%
New York
19,342,656
17,290,104
4,345,119 25.13%
Population Receiving Medicaid by Age Group, Total
Report Area Under Age 18 18 ‐ 64 Age 65
Lewis County, NY 2,274 2,577 588
New York 1,666,819 2,178,765 499,535
21
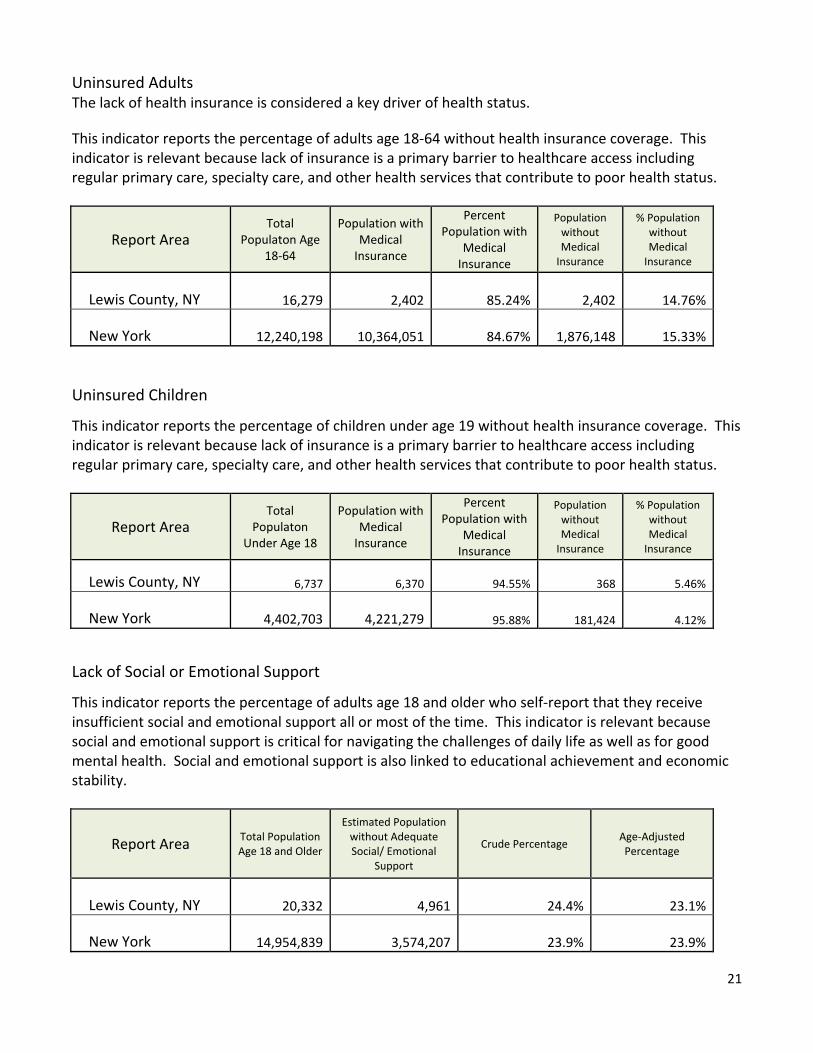
Uninsured Adults The lack of health insurance is considered a key driver of health status.
This indicator reports the percentage of adults age 18‐64 without health insurance coverage. This indicator is relevant because lack of insurance is a primary barrier to healthcare access including regular primary care, specialty care, and other health services that contribute to poor health status.
Report Area Total
Populaton Age 18‐64
Population with Medical Insurance
Percent Population with
Medical Insurance
Population without Medical Insurance
% Population without Medical Insurance
Lewis County, NY
16,279
2,402 85.24%
2,402 14.76%
New York
12,240,198
10,364,051 84.67%
1,876,148 15.33%
Uninsured Children
This indicator reports the percentage of children under age 19 without health insurance coverage. This indicator is relevant because lack of insurance is a primary barrier to healthcare access including regular primary care, specialty care, and other health services that contribute to poor health status.
Report Area Total
Populaton Under Age 18
Population with Medical Insurance
Percent Population with
Medical Insurance
Population without Medical Insurance
% Population without Medical Insurance
Lewis County, NY
6,737 6,370 94.55% 368 5.46%
New York
4,402,703
4,221,279 95.88%
181,424 4.12%
Lack of Social or Emotional Support
This indicator reports the percentage of adults age 18 and older who self‐report that they receive insufficient social and emotional support all or most of the time. This indicator is relevant because social and emotional support is critical for navigating the challenges of daily life as well as for good mental health. Social and emotional support is also linked to educational achievement and economic stability.
Report Area Total Population Age 18 and Older
Estimated Population without Adequate Social/ Emotional
Support
Crude Percentage Age‐Adjusted Percentage
Lewis County, NY
20,332
4,961 24.4% 23.1%
New York
14,954,839
3,574,207 23.9% 23.9%
22
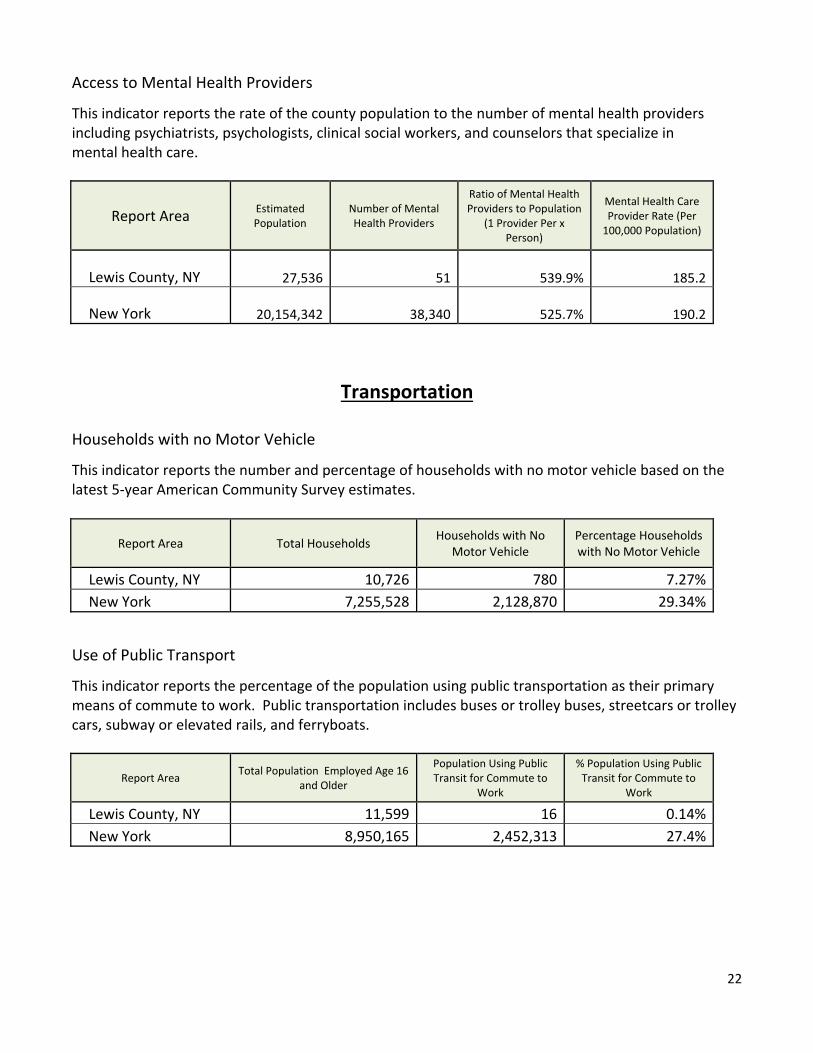
Access to Mental Health Providers
This indicator reports the rate of the county population to the number of mental health providers including psychiatrists, psychologists, clinical social workers, and counselors that specialize in mental health care.
Report Area Estimated Population
Number of Mental Health Providers
Ratio of Mental Health Providers to Population
(1 Provider Per x Person)
Mental Health Care Provider Rate (Per 100,000 Population)
Lewis County, NY
27,536
51 539.9% 185.2
New York
20,154,342
38,340 525.7% 190.2
Transportation Households with no Motor Vehicle
This indicator reports the number and percentage of households with no motor vehicle based on the latest 5‐year American Community Survey estimates.
Report Area Total Households Households with No
Motor Vehicle Percentage Households with No Motor Vehicle
Lewis County, NY 10,726 780 7.27%
New York 7,255,528 2,128,870 29.34%
Use of Public Transport
This indicator reports the percentage of the population using public transportation as their primary means of commute to work. Public transportation includes buses or trolley buses, streetcars or trolley cars, subway or elevated rails, and ferryboats.
Report Area Total Population Employed Age 16
and Older
Population Using Public Transit for Commute to
Work
% Population Using Public Transit for Commute to
Work
Lewis County, NY 11,599 16 0.14%
New York 8,950,165 2,452,313 27.4%

23
Safety Violent Crime
This indicator reports the rate of violent crime offenses reported by law enforcement per 100,000 residents. Violent crime includes homicide, rape, robbery, and aggressive assault. This indicator is relevant because it assesses community safety.
Report Area Total Population Violent Crimes Violent Crime Rate (Per 100,000 Population)
Lewis County, NY 27,171 25 93.2
New York 19,385,574 77,529 399.9
24
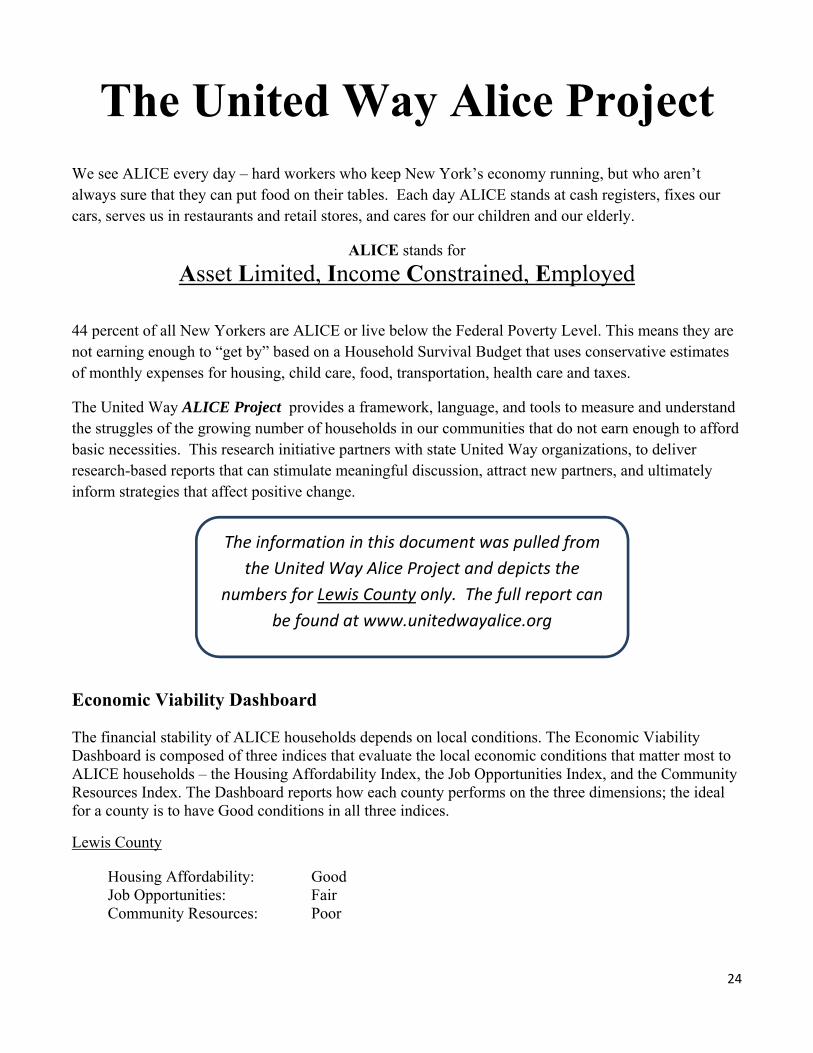
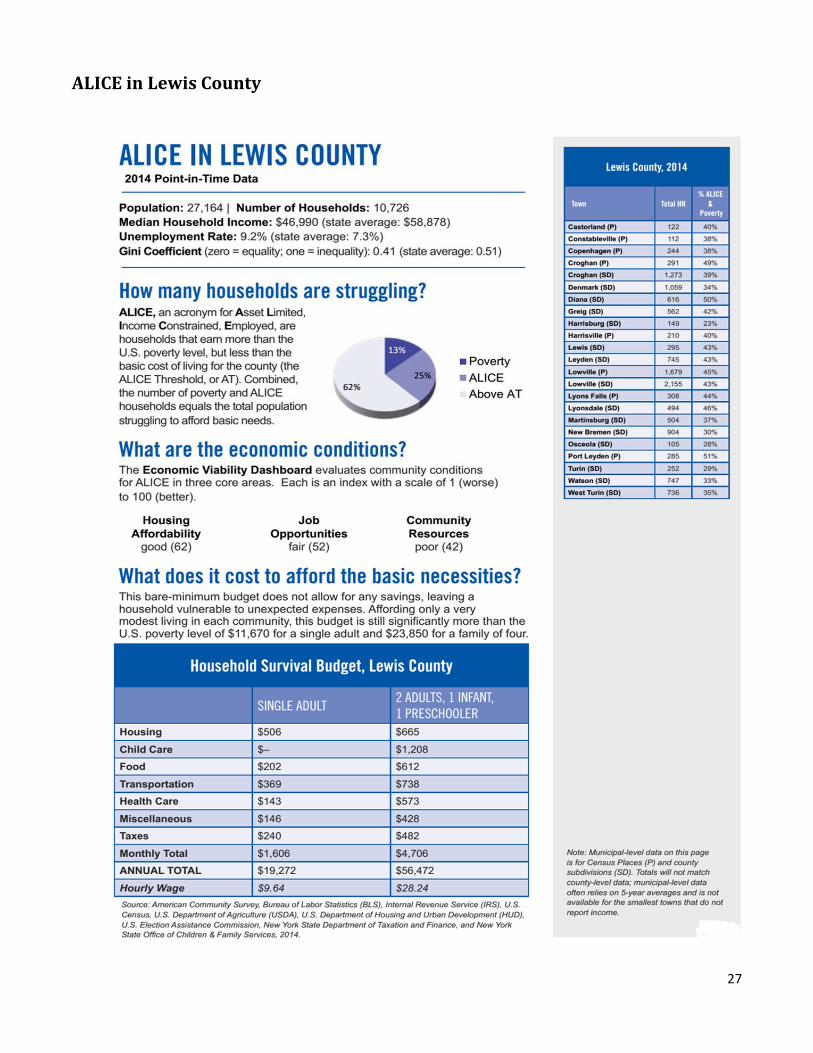
The United Way Alice Project
We see ALICE every day – hard workers who keep New York’s economy running, but who aren’t always sure that they can put food on their tables. Each day ALICE stands at cash registers, fixes our cars, serves us in restaurants and retail stores, and cares for our children and our elderly.
ALICE stands for
Asset Limited, Income Constrained, Employed
44 percent of all New Yorkers are ALICE or live below the Federal Poverty Level. This means they are not earning enough to “get by” based on a Household Survival Budget that uses conservative estimates of monthly expenses for housing, child care, food, transportation, health care and taxes.
The United Way ALICE Project provides a framework, language, and tools to measure and understand the struggles of the growing number of households in our communities that do not earn enough to afford basic necessities. This research initiative partners with state United Way organizations, to deliver research-based reports that can stimulate meaningful discussion, attract new partners, and ultimately inform strategies that affect positive change.
Economic Viability Dashboard
The financial stability of ALICE households depends on local conditions. The Economic Viability Dashboard is composed of three indices that evaluate the local economic conditions that matter most to ALICE households – the Housing Affordability Index, the Job Opportunities Index, and the Community Resources Index. The Dashboard reports how each county performs on the three dimensions; the ideal for a county is to have Good conditions in all three indices.
Lewis County
Housing Affordability: Good Job Opportunities: Fair Community Resources: Poor
The information in this document was pulled from
the United Way Alice Project and depicts the
numbers for Lewis County only. The full report can
be found at www.unitedwayalice.org
25
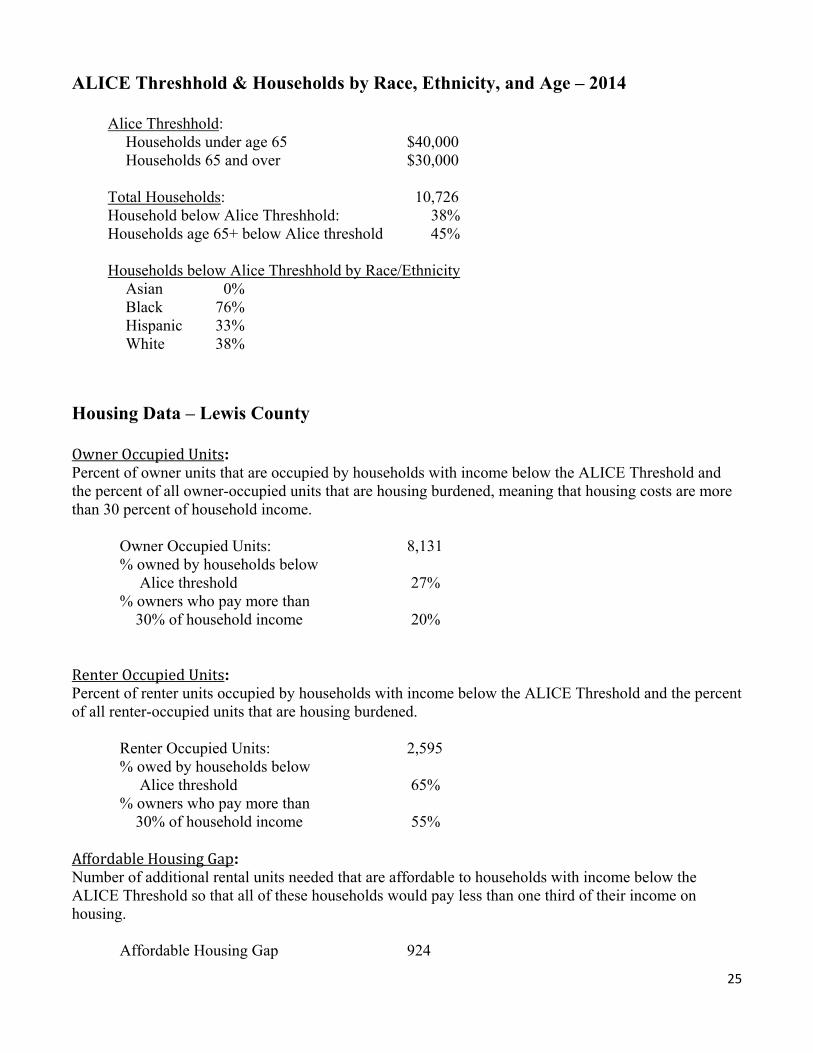
ALICE Threshhold & Households by Race, Ethnicity, and Age – 2014
Alice Threshhold: Households under age 65 $40,000 Households 65 and over $30,000
Total Households: 10,726 Household below Alice Threshhold: 38% Households age 65+ below Alice threshold 45% Households below Alice Threshhold by Race/Ethnicity
Asian 0% Black 76% Hispanic 33% White 38%
Housing Data – Lewis County
OwnerOccupiedUnits: Percent of owner units that are occupied by households with income below the ALICE Threshold and the percent of all owner-occupied units that are housing burdened, meaning that housing costs are more than 30 percent of household income.
Owner Occupied Units: 8,131 % owned by households below Alice threshold 27% % owners who pay more than 30% of household income 20%
RenterOccupiedUnits: Percent of renter units occupied by households with income below the ALICE Threshold and the percent of all renter-occupied units that are housing burdened.
Renter Occupied Units: 2,595 % owed by households below Alice threshold 65% % owners who pay more than 30% of household income 55%
AffordableHousingGap: Number of additional rental units needed that are affordable to households with income below the ALICE Threshold so that all of these households would pay less than one third of their income on housing. Affordable Housing Gap 924
26
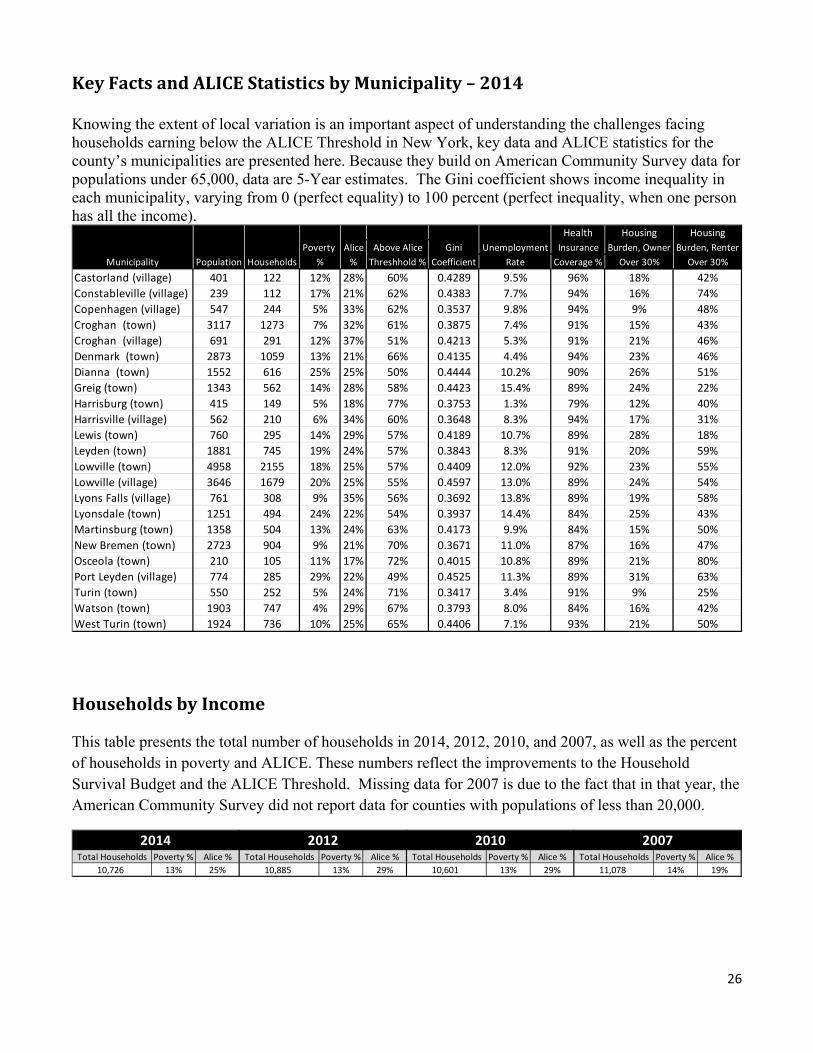
KeyFactsandALICEStatisticsbyMunicipality–2014
Knowing the extent of local variation is an important aspect of understanding the challenges facing households earning below the ALICE Threshold in New York, key data and ALICE statistics for the county’s municipalities are presented here. Because they build on American Community Survey data for populations under 65,000, data are 5-Year estimates. The Gini coefficient shows income inequality in each municipality, varying from 0 (perfect equality) to 100 percent (perfect inequality, when one person has all the income).
HouseholdsbyIncome
This table presents the total number of households in 2014, 2012, 2010, and 2007, as well as the percent of households in poverty and ALICE. These numbers reflect the improvements to the Household Survival Budget and the ALICE Threshold. Missing data for 2007 is due to the fact that in that year, the American Community Survey did not report data for counties with populations of less than 20,000.
Health Housing Housing
Poverty Alice Above Alice Gini Unemployment Insurance Burden, Owner Burden, Renter
Municipality Population Households % % Threshhold % Coefficient Rate Coverage % Over 30% Over 30%
Castorland (village) 401 122 12% 28% 60% 0.4289 9.5% 96% 18% 42%
Constableville (village) 239 112 17% 21% 62% 0.4383 7.7% 94% 16% 74%
Copenhagen (village) 547 244 5% 33% 62% 0.3537 9.8% 94% 9% 48%
Croghan (town) 3117 1273 7% 32% 61% 0.3875 7.4% 91% 15% 43%
Croghan (village) 691 291 12% 37% 51% 0.4213 5.3% 91% 21% 46%
Denmark (town) 2873 1059 13% 21% 66% 0.4135 4.4% 94% 23% 46%
Dianna (town) 1552 616 25% 25% 50% 0.4444 10.2% 90% 26% 51%
Greig (town) 1343 562 14% 28% 58% 0.4423 15.4% 89% 24% 22%
Harrisburg (town) 415 149 5% 18% 77% 0.3753 1.3% 79% 12% 40%
Harrisville (village) 562 210 6% 34% 60% 0.3648 8.3% 94% 17% 31%
Lewis (town) 760 295 14% 29% 57% 0.4189 10.7% 89% 28% 18%
Leyden (town) 1881 745 19% 24% 57% 0.3843 8.3% 91% 20% 59%
Lowville (town) 4958 2155 18% 25% 57% 0.4409 12.0% 92% 23% 55%
Lowville (village) 3646 1679 20% 25% 55% 0.4597 13.0% 89% 24% 54%
Lyons Falls (village) 761 308 9% 35% 56% 0.3692 13.8% 89% 19% 58%
Lyonsdale (town) 1251 494 24% 22% 54% 0.3937 14.4% 84% 25% 43%
Martinsburg (town) 1358 504 13% 24% 63% 0.4173 9.9% 84% 15% 50%
New Bremen (town) 2723 904 9% 21% 70% 0.3671 11.0% 87% 16% 47%
Osceola (town) 210 105 11% 17% 72% 0.4015 10.8% 89% 21% 80%
Port Leyden (village) 774 285 29% 22% 49% 0.4525 11.3% 89% 31% 63%
Turin (town) 550 252 5% 24% 71% 0.3417 3.4% 91% 9% 25%
Watson (town) 1903 747 4% 29% 67% 0.3793 8.0% 84% 16% 42%
West Turin (town) 1924 736 10% 25% 65% 0.4406 7.1% 93% 21% 50%
Total Households Poverty % Alice % Total Households Poverty % Alice % Total Households Poverty % Alice % Total Households Poverty % Alice %
10,726 13% 25% 10,885 13% 29% 10,601 13% 29% 11,078 14% 19%
2014 2012 2010 2007
27
ALICEinLewisCounty
28
AgencyStatistics

29
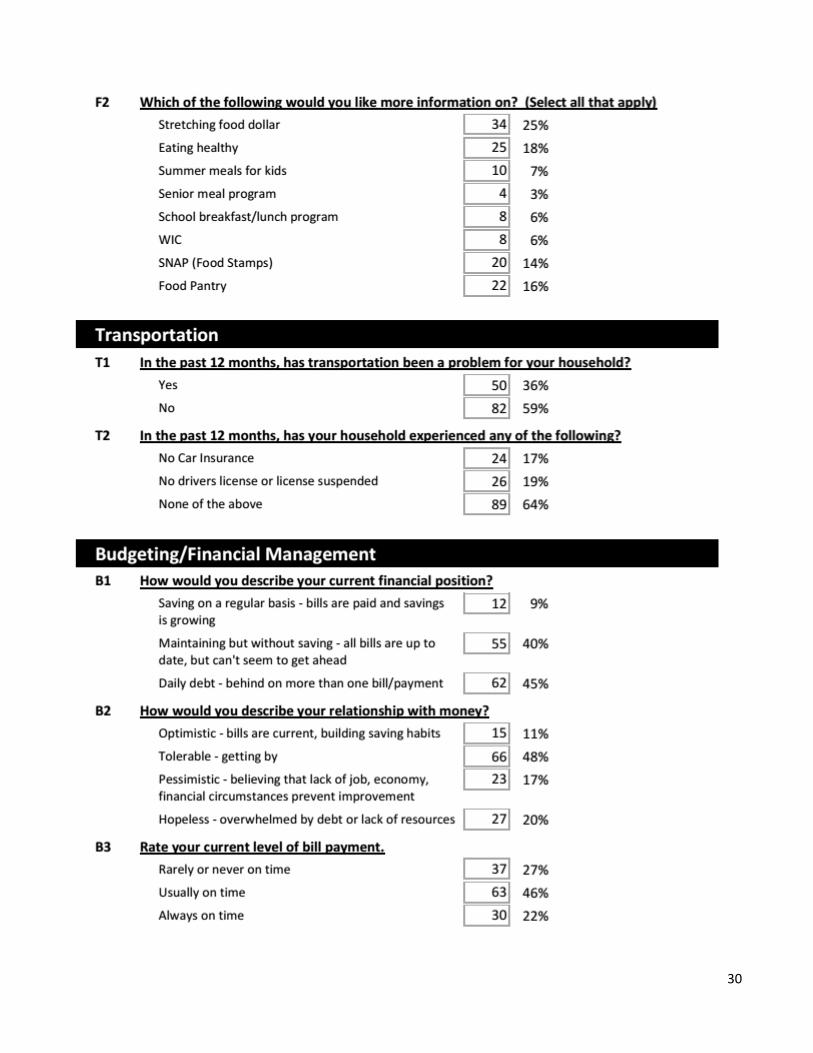
Consumer Survey Results
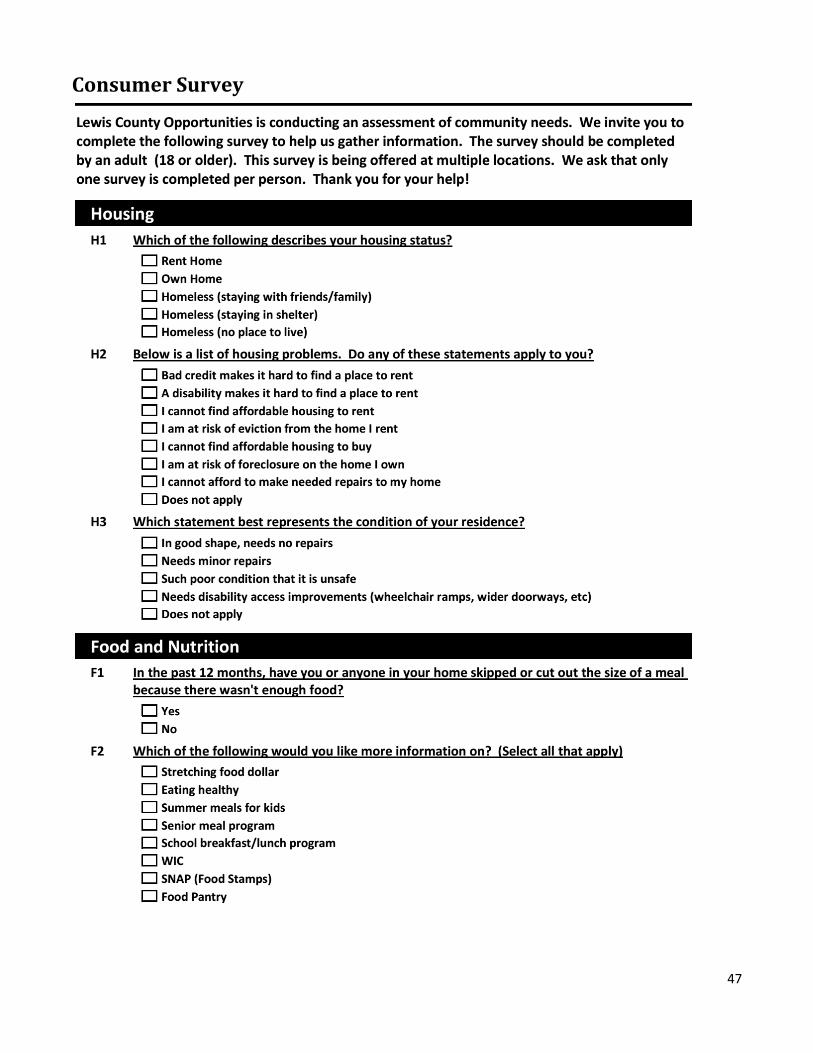
The Consumer survey was distributed twice – once in July of 2016, and again in January of 2017. This was done in order to capture responses based on two seasonal extremes. It was felt that consumer concerns would be different during the winter months than they were in the summer. Surveys were available to consumers entering our main office, our thrift store, and were published on our agency website and Facebook page. They were also distributed to DSS consumers through our DSS representative on the committee. A total of 138 consumer surveys were completed.
30
31

32
33

34
Partner Survey Results
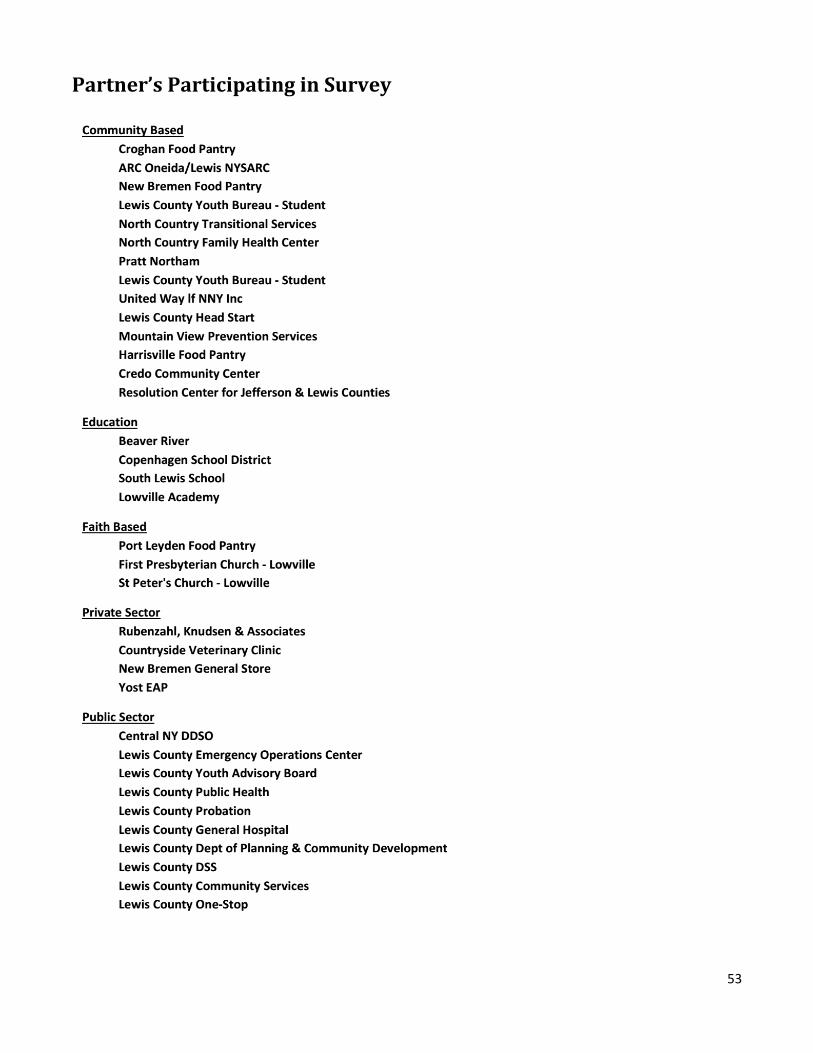
The Partner survey was also distributed twice. Once in September of 2016, and again in January of 2017. The survey was distributed through our Priorities Council as well as a direct mailing to the area Food Pantries and Schools. A total of 35 Partner surveys were completed. A complete list is included under the “Assessment Tools” section.

35
36

37
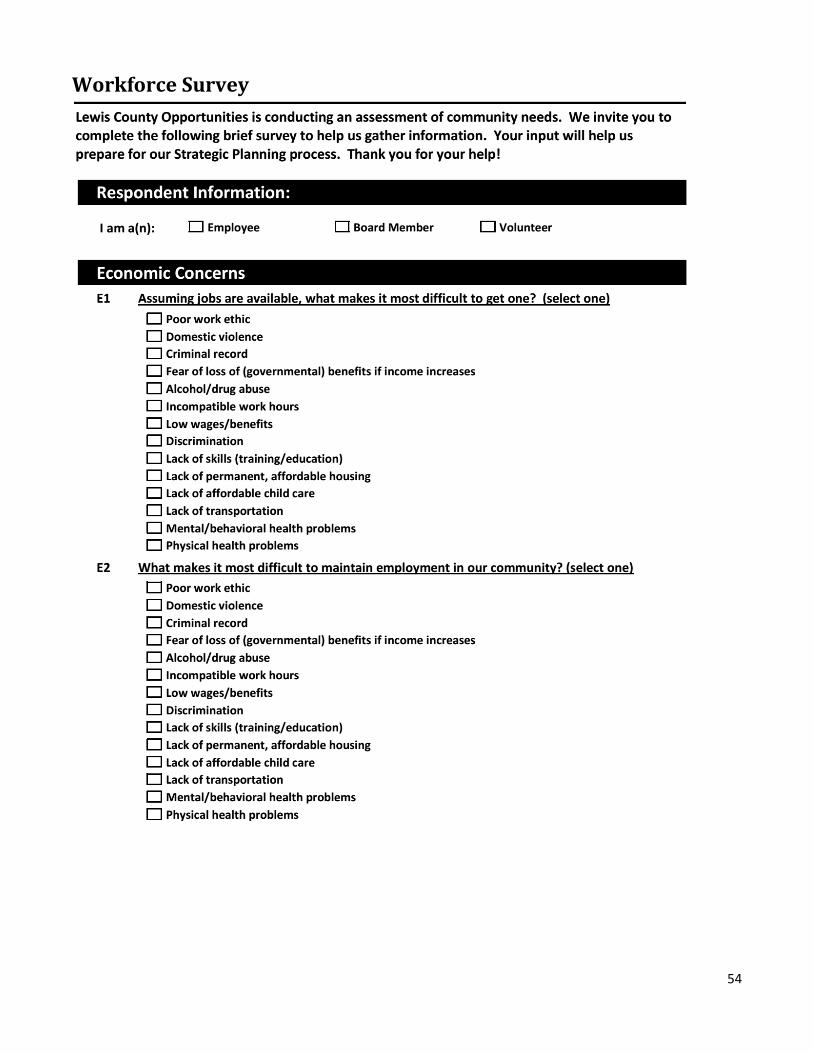
Workforce Survey Results
The Workforce survey was distributed once, in September of 2016. It was presented to 32 employees, 12 Board members, and approximately 63 volunteers. A total of 64 Workforce surveys were completed.
32 Employees 7 Board members 25 Volunteers

38
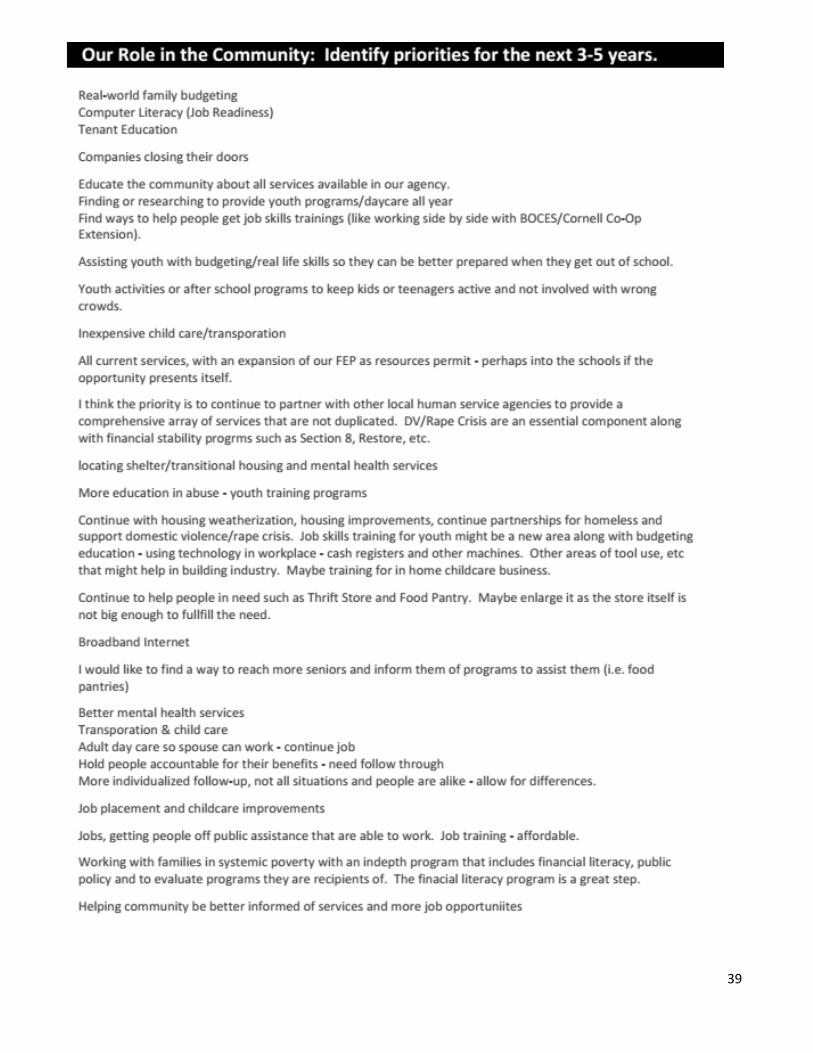
39
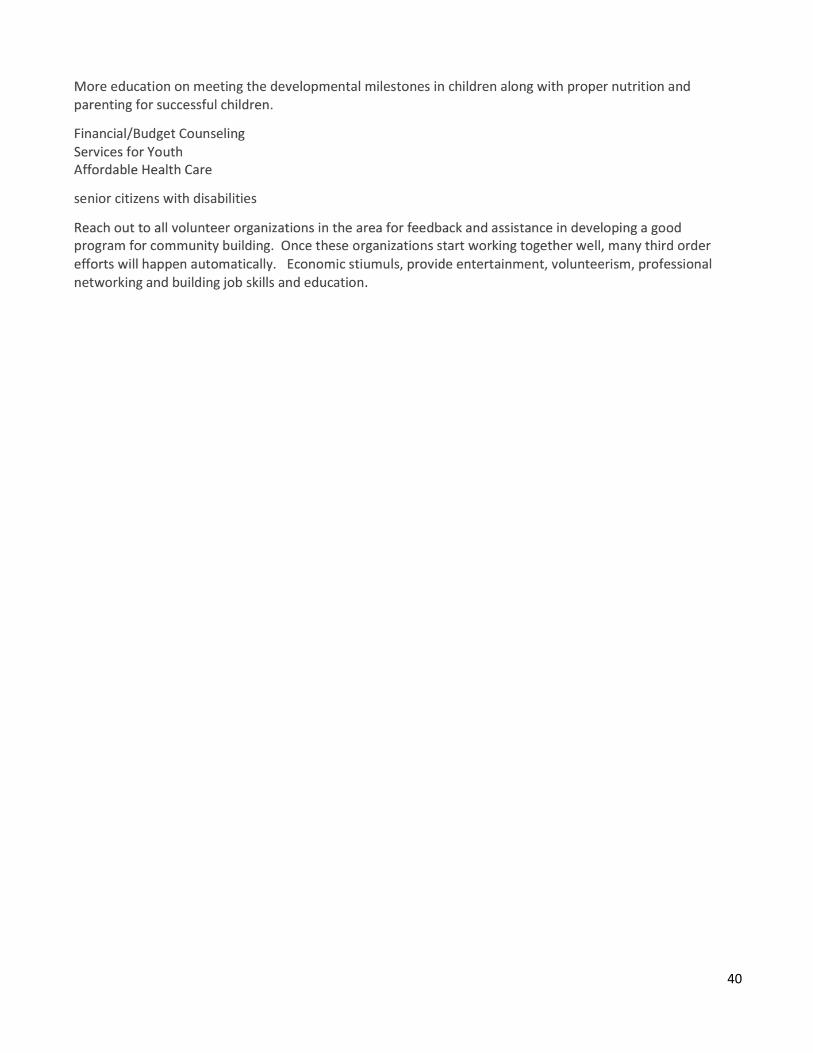
40
41
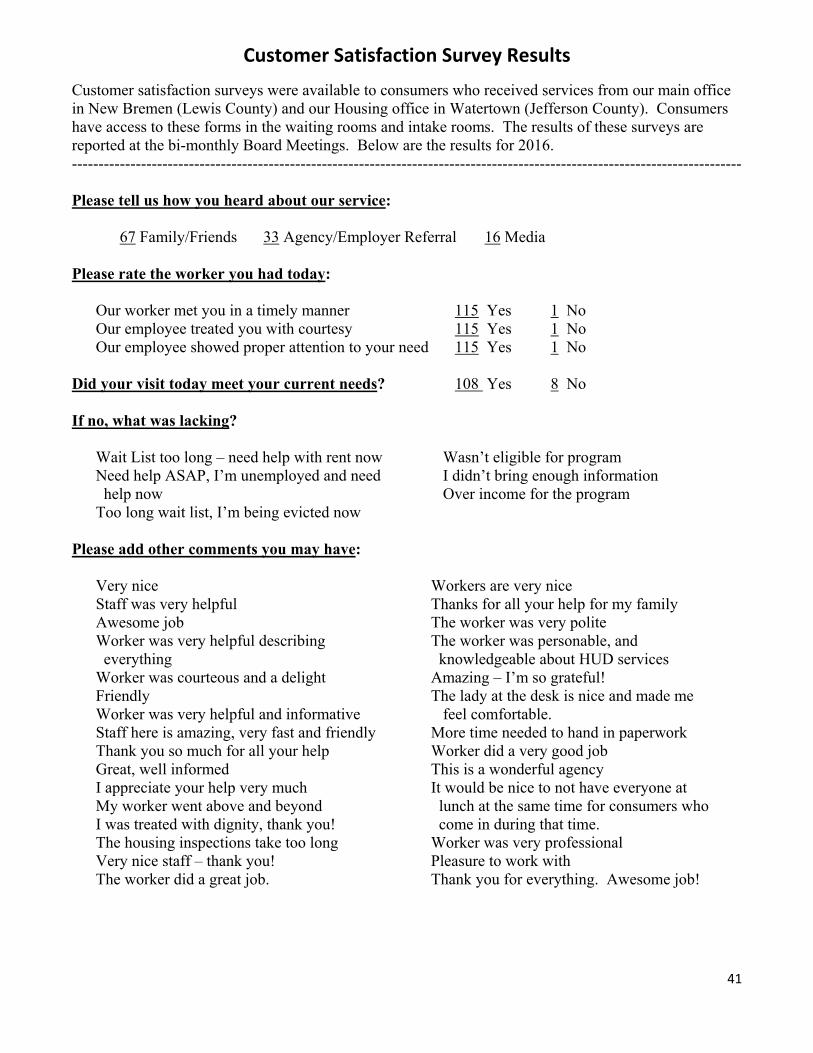
Customer Satisfaction Survey Results
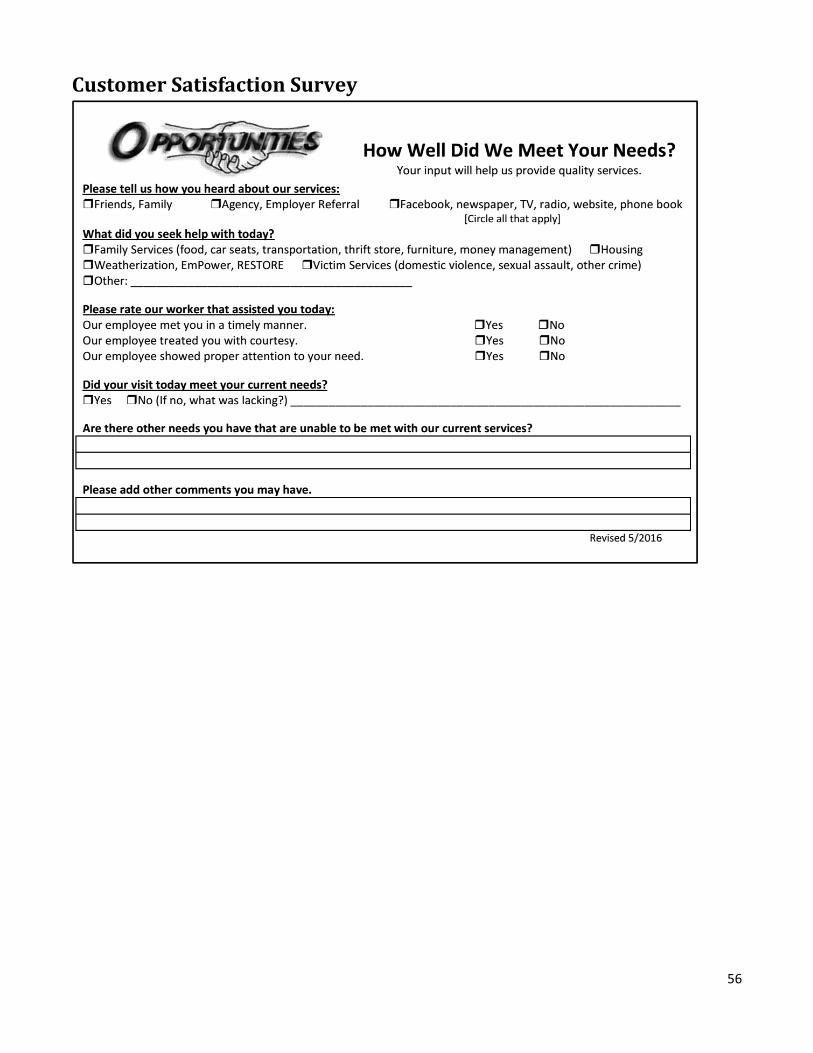
Customer satisfaction surveys were available to consumers who received services from our main office in New Bremen (Lewis County) and our Housing office in Watertown (Jefferson County). Consumers have access to these forms in the waiting rooms and intake rooms. The results of these surveys are reported at the bi-monthly Board Meetings. Below are the results for 2016. ------------------------------------------------------------------------------------------------------------------------------ Please tell us how you heard about our service:
67 Family/Friends 33 Agency/Employer Referral 16 Media Please rate the worker you had today:
Our worker met you in a timely manner 115 Yes 1 No Our employee treated you with courtesy 115 Yes 1 No Our employee showed proper attention to your need 115 Yes 1 No
Did your visit today meet your current needs? 108 Yes 8 No If no, what was lacking?
Wait List too long – need help with rent now Need help ASAP, I’m unemployed and need help now Too long wait list, I’m being evicted now
Wasn’t eligible for program I didn’t bring enough information Over income for the program
Please add other comments you may have:
Very nice Staff was very helpful Awesome job Worker was very helpful describing everything Worker was courteous and a delight Friendly Worker was very helpful and informative Staff here is amazing, very fast and friendly Thank you so much for all your help Great, well informed I appreciate your help very much My worker went above and beyond I was treated with dignity, thank you! The housing inspections take too long Very nice staff – thank you! The worker did a great job.
Workers are very nice Thanks for all your help for my family The worker was very polite The worker was personable, and knowledgeable about HUD services Amazing – I’m so grateful! The lady at the desk is nice and made me feel comfortable. More time needed to hand in paperwork Worker did a very good job This is a wonderful agency It would be nice to not have everyone at lunch at the same time for consumers who come in during that time. Worker was very professional Pleasure to work with Thank you for everything. Awesome job!

42
KeyFindings
43
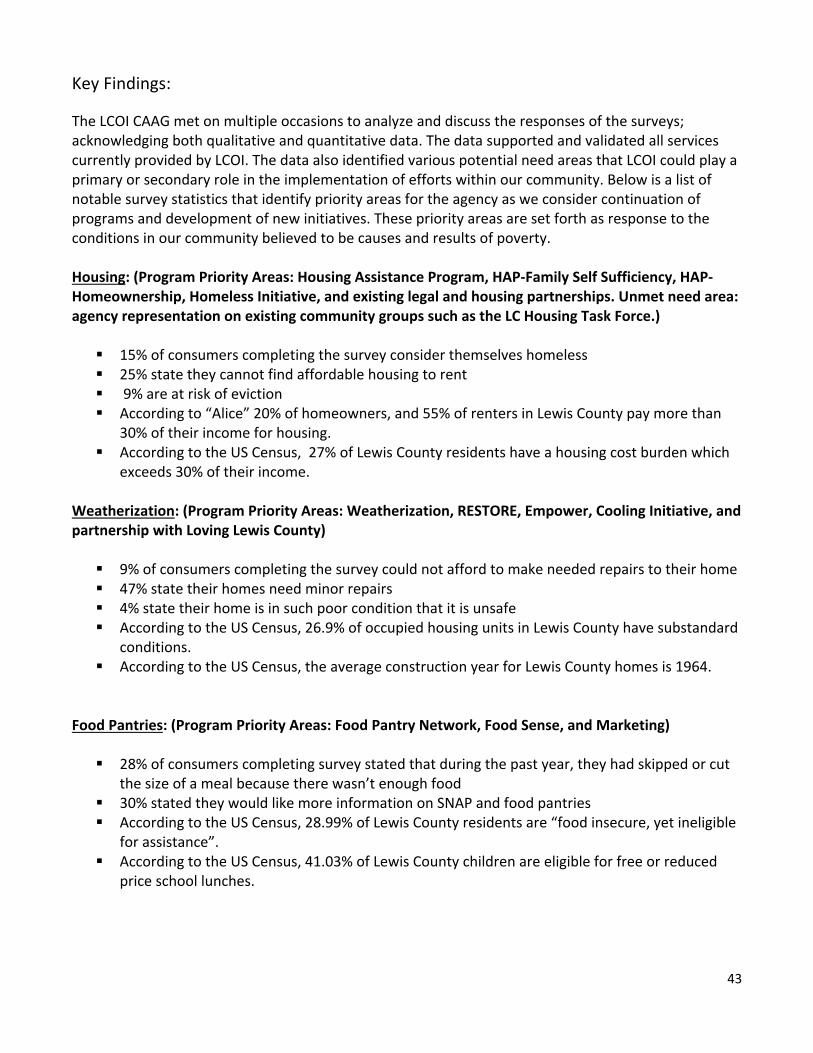
Key Findings:
The LCOI CAAG met on multiple occasions to analyze and discuss the responses of the surveys; acknowledging both qualitative and quantitative data. The data supported and validated all services currently provided by LCOI. The data also identified various potential need areas that LCOI could play a primary or secondary role in the implementation of efforts within our community. Below is a list of notable survey statistics that identify priority areas for the agency as we consider continuation of programs and development of new initiatives. These priority areas are set forth as response to the conditions in our community believed to be causes and results of poverty. Housing: (Program Priority Areas: Housing Assistance Program, HAP‐Family Self Sufficiency, HAP‐Homeownership, Homeless Initiative, and existing legal and housing partnerships. Unmet need area: agency representation on existing community groups such as the LC Housing Task Force.) 15% of consumers completing the survey consider themselves homeless 25% state they cannot find affordable housing to rent 9% are at risk of eviction According to “Alice” 20% of homeowners, and 55% of renters in Lewis County pay more than
30% of their income for housing. According to the US Census, 27% of Lewis County residents have a housing cost burden which
exceeds 30% of their income. Weatherization: (Program Priority Areas: Weatherization, RESTORE, Empower, Cooling Initiative, and partnership with Loving Lewis County) 9% of consumers completing the survey could not afford to make needed repairs to their home 47% state their homes need minor repairs 4% state their home is in such poor condition that it is unsafe According to the US Census, 26.9% of occupied housing units in Lewis County have substandard
conditions. According to the US Census, the average construction year for Lewis County homes is 1964.
Food Pantries: (Program Priority Areas: Food Pantry Network, Food Sense, and Marketing) 28% of consumers completing survey stated that during the past year, they had skipped or cut
the size of a meal because there wasn’t enough food 30% stated they would like more information on SNAP and food pantries According to the US Census, 28.99% of Lewis County residents are “food insecure, yet ineligible
for assistance”. According to the US Census, 41.03% of Lewis County children are eligible for free or reduced
price school lunches.
44
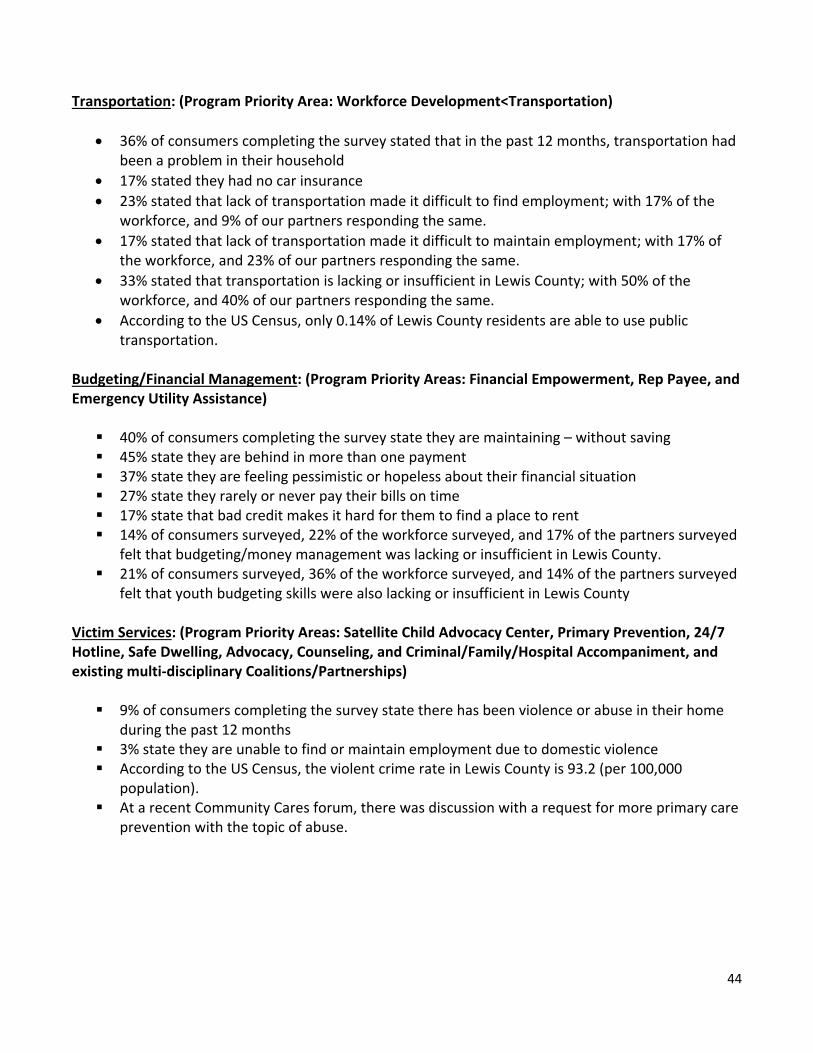
Transportation: (Program Priority Area: Workforce Development<Transportation)
36% of consumers completing the survey stated that in the past 12 months, transportation had been a problem in their household
17% stated they had no car insurance
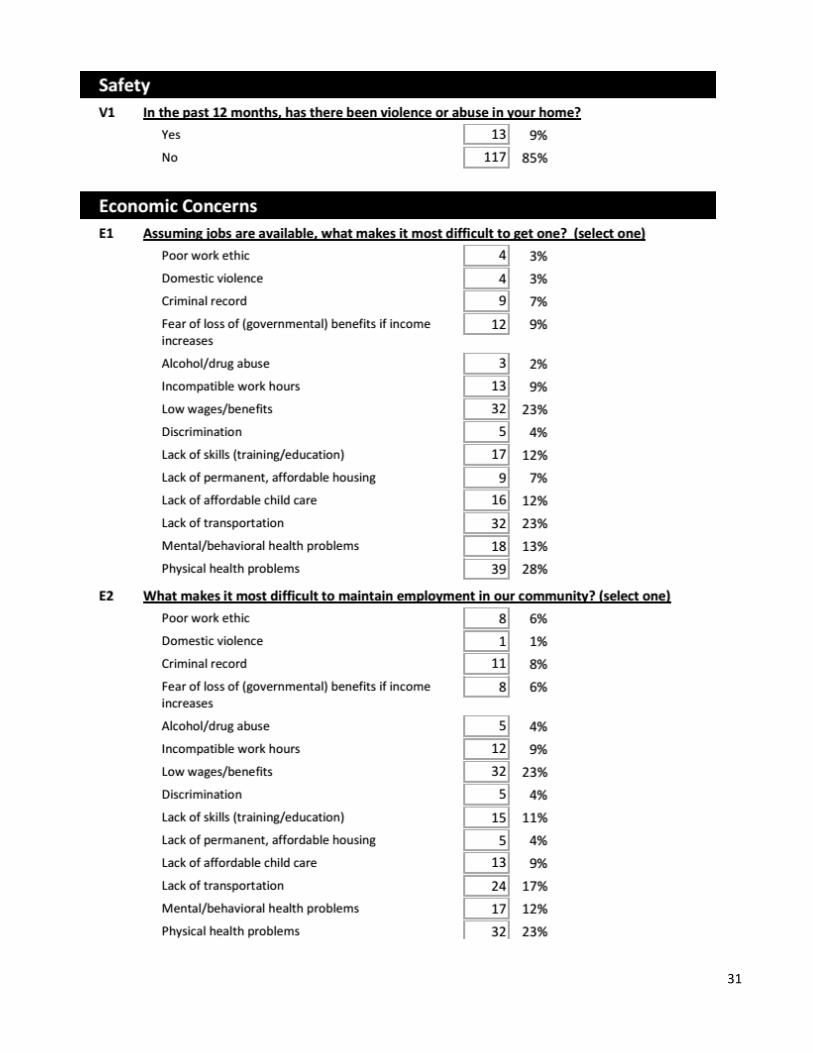
23% stated that lack of transportation made it difficult to find employment; with 17% of the workforce, and 9% of our partners responding the same.
17% stated that lack of transportation made it difficult to maintain employment; with 17% of the workforce, and 23% of our partners responding the same.
33% stated that transportation is lacking or insufficient in Lewis County; with 50% of the workforce, and 40% of our partners responding the same.
According to the US Census, only 0.14% of Lewis County residents are able to use public transportation.
Budgeting/Financial Management: (Program Priority Areas: Financial Empowerment, Rep Payee, and Emergency Utility Assistance) 40% of consumers completing the survey state they are maintaining – without saving 45% state they are behind in more than one payment 37% state they are feeling pessimistic or hopeless about their financial situation 27% state they rarely or never pay their bills on time 17% state that bad credit makes it hard for them to find a place to rent 14% of consumers surveyed, 22% of the workforce surveyed, and 17% of the partners surveyed
felt that budgeting/money management was lacking or insufficient in Lewis County. 21% of consumers surveyed, 36% of the workforce surveyed, and 14% of the partners surveyed
felt that youth budgeting skills were also lacking or insufficient in Lewis County Victim Services: (Program Priority Areas: Satellite Child Advocacy Center, Primary Prevention, 24/7 Hotline, Safe Dwelling, Advocacy, Counseling, and Criminal/Family/Hospital Accompaniment, and existing multi‐disciplinary Coalitions/Partnerships) 9% of consumers completing the survey state there has been violence or abuse in their home
during the past 12 months 3% state they are unable to find or maintain employment due to domestic violence According to the US Census, the violent crime rate in Lewis County is 93.2 (per 100,000
population). At a recent Community Cares forum, there was discussion with a request for more primary care
prevention with the topic of abuse.
45
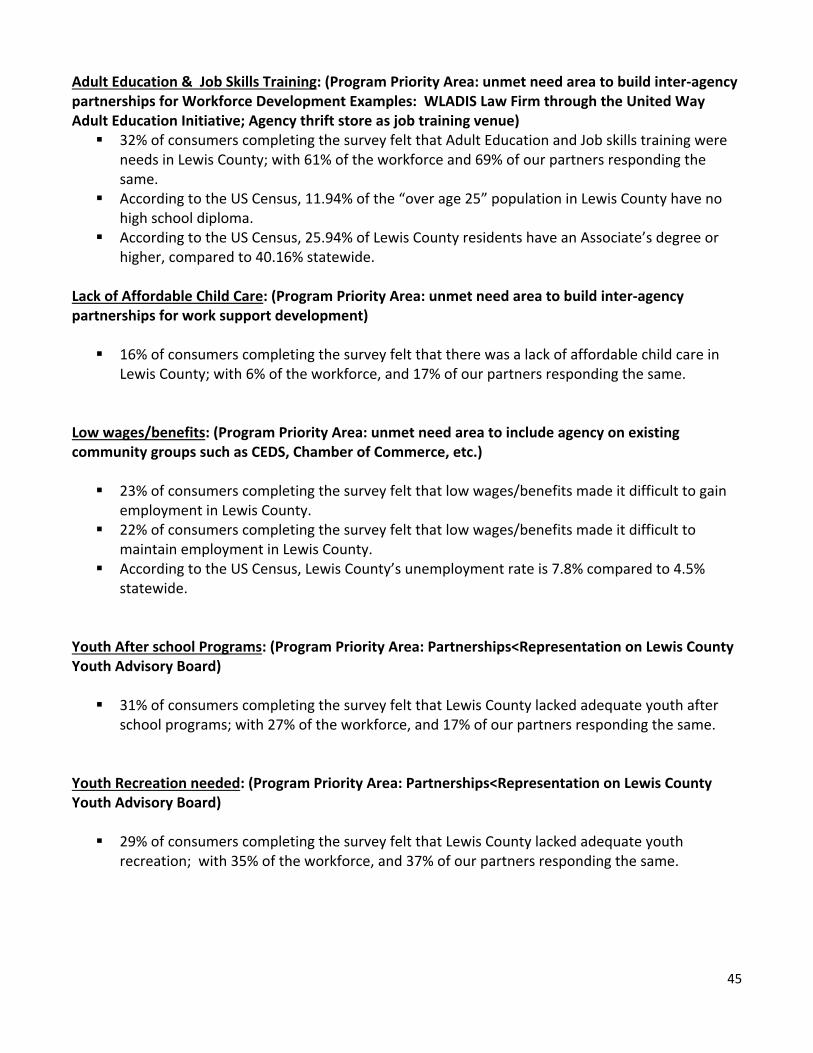
Adult Education & Job Skills Training: (Program Priority Area: unmet need area to build inter‐agency partnerships for Workforce Development Examples: WLADIS Law Firm through the United Way Adult Education Initiative; Agency thrift store as job training venue) 32% of consumers completing the survey felt that Adult Education and Job skills training were
needs in Lewis County; with 61% of the workforce and 69% of our partners responding the same.
According to the US Census, 11.94% of the “over age 25” population in Lewis County have no high school diploma.
According to the US Census, 25.94% of Lewis County residents have an Associate’s degree or higher, compared to 40.16% statewide.
Lack of Affordable Child Care: (Program Priority Area: unmet need area to build inter‐agency partnerships for work support development) 16% of consumers completing the survey felt that there was a lack of affordable child care in
Lewis County; with 6% of the workforce, and 17% of our partners responding the same. Low wages/benefits: (Program Priority Area: unmet need area to include agency on existing community groups such as CEDS, Chamber of Commerce, etc.) 23% of consumers completing the survey felt that low wages/benefits made it difficult to gain
employment in Lewis County. 22% of consumers completing the survey felt that low wages/benefits made it difficult to
maintain employment in Lewis County. According to the US Census, Lewis County’s unemployment rate is 7.8% compared to 4.5%
statewide. Youth After school Programs: (Program Priority Area: Partnerships<Representation on Lewis County Youth Advisory Board) 31% of consumers completing the survey felt that Lewis County lacked adequate youth after
school programs; with 27% of the workforce, and 17% of our partners responding the same. Youth Recreation needed: (Program Priority Area: Partnerships<Representation on Lewis County Youth Advisory Board) 29% of consumers completing the survey felt that Lewis County lacked adequate youth
recreation; with 35% of the workforce, and 37% of our partners responding the same.
46
AssessmentTools
47
ConsumerSurvey
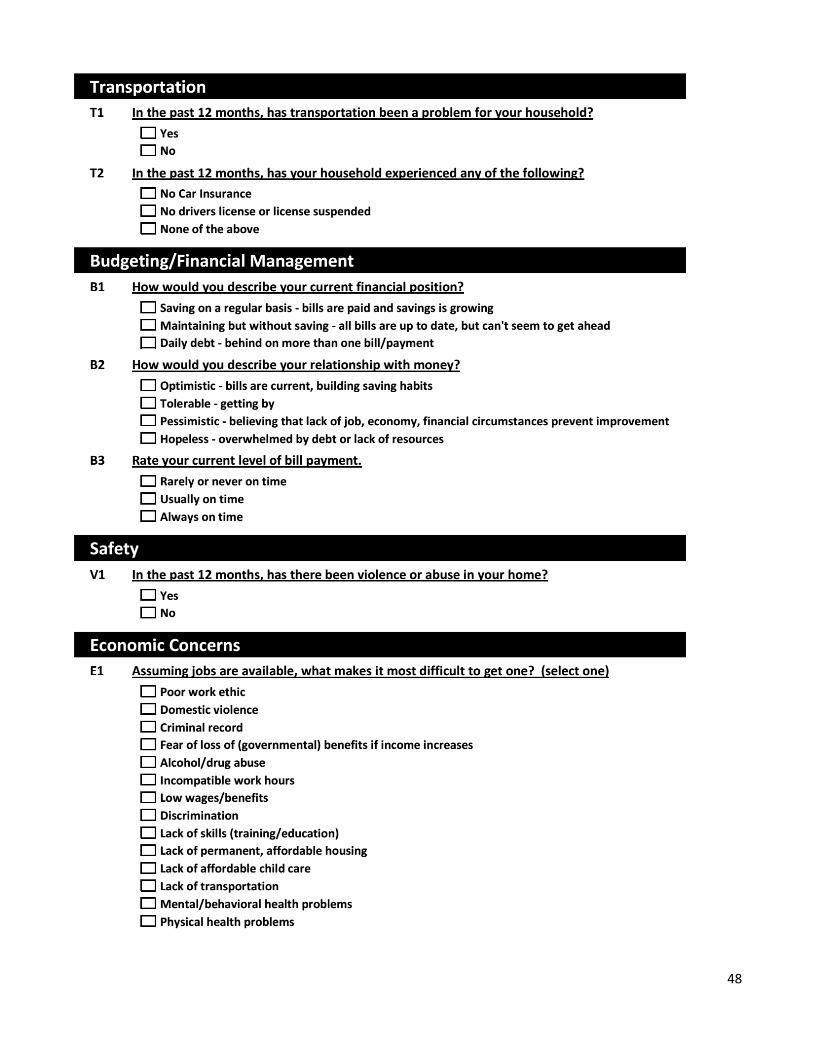
48

49
50
51
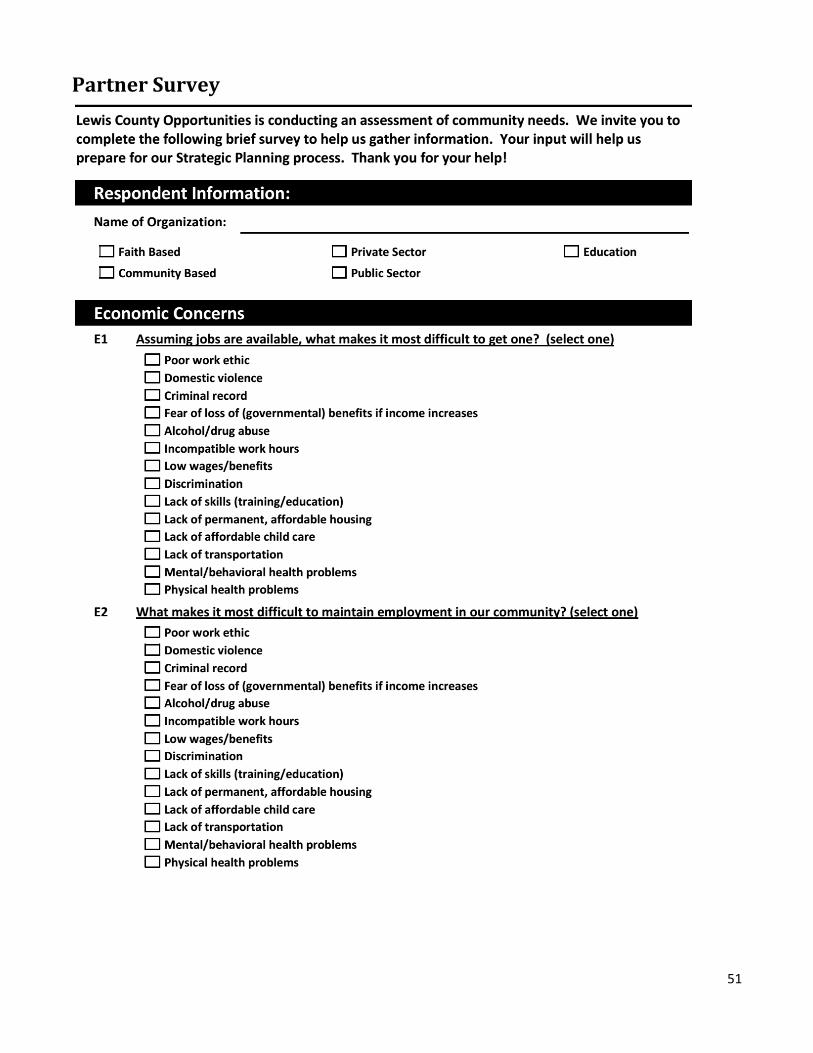
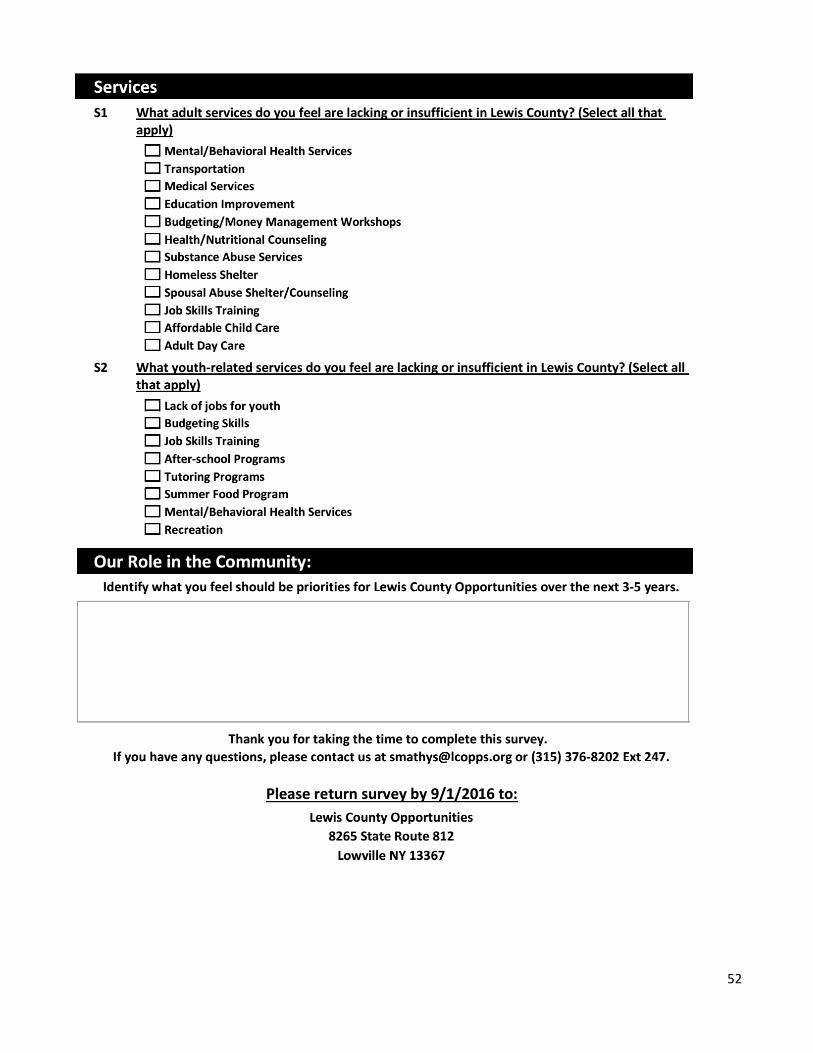
PartnerSurvey
52
53
Partner’sParticipatinginSurvey
54
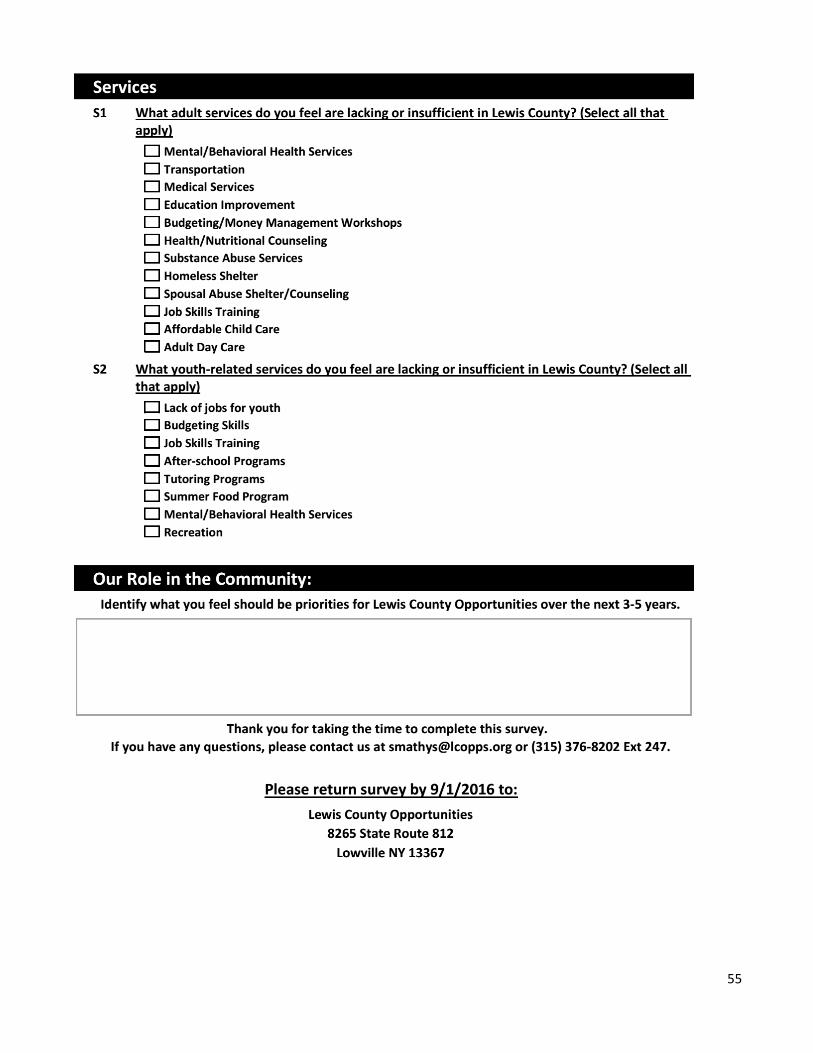
WorkforceSurvey
55
56
CustomerSatisfactionSurvey