Lewis A. Buitrago Gomez*, Stefan Z. Miska*,...
20
!" AGH DRILLING, OIL, GAS Vol. 33 No. 2 2016 * The University of Tulsa http://dx.doi.org/10.7494/drill.2016.33.2.341 Lewis A. Buitrago Gomez*, Stefan Z. Miska*, Małgorzata B. Ziaja* EXPERIMENTAL STUDY OF LAYOUTS OF PDC CUTTERS IN CORE BIT DRILLING 1. INTRODUCTION Drill bits are critical components in the drilling process. Their significant impact over the entire project economics is unquestionably recognized around the world. This key role has demanded a very detailed evaluation of the elements and parameters involv- ing the interaction between the drill bit and the rock. Currently, PDC bits represent the type of fixed-cutter bits where most efforts are being conducted. This is due to new challenging drilling scenarios where Roller-Cone bits are considered as high risk. Nota- bly, PDC cutter arrangements play a major role in bit drilling efficiency and bit stability. Core PDC bits are PDC bits with reduced cutting area. Core bits are used to recover core samples from the target rock formations. These have to produce smooth and mini- mally fractured cores that are closer to gauge diameter. As regular drilling bits, the core bits need to ensure a reasonable ROP with a minimum wear of cutters. Because of the reduced cutting structure compared to PDC bits, PDC core bits represent a first step in evaluating drilling efficiency. The study of drilling efficiency has been broadly documented in the industry and is commonly defined in terms of the mechanical-specific-energy concept or work required to remove a unit volume of rock. This energy consumption can be measured during drilling operations and, consequently, different bit performances can be compared using this concept. In the past two decades, many studies have been done to understand the interaction between a single PDC cutter and formation rocks [2, 12, 14]. As a result, various single- cutter force models have been developed that consider formation properties, cutter back rake and side rake angles, cutter chamfer size, DOC or cutting area, and pore pressure. These single-cutter force models have been extensively used to model the interaction of a PDC bit with formation rocks. Although the bit models are able to calculate some bit characteristics with acceptable accuracy, such as cutter engagement area and bit force balance conditions, the ability of bit models to predict bit drilling efficiency is usually
Transcript of Lewis A. Buitrago Gomez*, Stefan Z. Miska*,...

���
����������������� � �� �������� �� ����� �� ����
* The University of Tulsa
http://dx.doi.org/10.7494/drill.2016.33.2.341
Lewis A. Buitrago Gomez*, Stefan Z. Miska*, Małgorzata B. Ziaja*
EXPERIMENTAL STUDY OF LAYOUTS OF PDC CUTTERSIN CORE BIT DRILLING
1. INTRODUCTION
Drill bits are critical components in the drilling process. Their significant impactover the entire project economics is unquestionably recognized around the world. Thiskey role has demanded a very detailed evaluation of the elements and parameters involv-ing the interaction between the drill bit and the rock. Currently, PDC bits representthe type of fixed-cutter bits where most efforts are being conducted. This is due to newchallenging drilling scenarios where Roller-Cone bits are considered as high risk. Nota-bly, PDC cutter arrangements play a major role in bit drilling efficiency and bit stability.
Core PDC bits are PDC bits with reduced cutting area. Core bits are used to recovercore samples from the target rock formations. These have to produce smooth and mini-mally fractured cores that are closer to gauge diameter. As regular drilling bits, the corebits need to ensure a reasonable ROP with a minimum wear of cutters. Because ofthe reduced cutting structure compared to PDC bits, PDC core bits represent a first stepin evaluating drilling efficiency.
The study of drilling efficiency has been broadly documented in the industry and iscommonly defined in terms of the mechanical-specific-energy concept or work required toremove a unit volume of rock. This energy consumption can be measured during drillingoperations and, consequently, different bit performances can be compared using this concept.
In the past two decades, many studies have been done to understand the interactionbetween a single PDC cutter and formation rocks [2, 12, 14]. As a result, various single-cutter force models have been developed that consider formation properties, cutter backrake and side rake angles, cutter chamfer size, DOC or cutting area, and pore pressure.These single-cutter force models have been extensively used to model the interaction ofa PDC bit with formation rocks. Although the bit models are able to calculate some bitcharacteristics with acceptable accuracy, such as cutter engagement area and bit forcebalance conditions, the ability of bit models to predict bit drilling efficiency is usually

���
inadequate. Thus far, no conclusions have been drawn experimentally from layoutsof PDC cutters for a given formation under a given set of operational parameters. There-fore, more effort is required to understand the influence of cutter arrangements on bitdrilling efficiency. In addition, developing experiments with a full-scale test rig is oneof the most cost-effective and practical methods to evaluate bit performance.
This study was primarily focused on investigating the effect of the layout of PDCcutters on drilling performance. Therefore, the main objective of this study was to per-form an experimental study of PDC cutter arrangements to investigate their effect oncore bit drilling efficiency.
2. EXPERIMENTAL FACILITY
TUDRP successfully upgraded its full-scale drill rig between 2013 and 2015. Exten-sive research on drill bits has been developed using the TUDRP full-scale test rig [3, 7, 9](Fig. 1). This is located in a 50-ft. tower at the University of Tulsa North Campus facility.The rig is divided into three main systems: the circulating system, the pull-down androtary system (hydraulic system) and the data acquisition and measurement system.The upgrade work included the design and implementation of a new data acquisitionplatform. The main purpose was to replace the old PLC-based system with a modernand reliable PC-based data logger that meets the requirements of a laboratory full-scaledrilling simulation. As a result, the data acquisition process has been greatly improved,which allows for more accurate interpretation of experimental data.
The current circulating system can work through one of two independent units,a centrifugal pump or a mud duplex pump. The drilling mud flows through the rotaryhose, circulating head, Kelly pipe, drill collar and the bit into the high pressure cell locat-ed in the drill floor (Fig. 2). Drilling fluid and formation cuttings generated by the bitaction exit through a nipple on the side of the pressure cell to a screening assembly.The fluid enters the side of the assembly, deposits the cuttings on the outside surface ofa cylindrical sand control screen, and continues through the center of the screen and outof it. The clean mud then flows through the back pressure choke and into the mud tanks,located at the second floor of the tower. The mud is then pulled into the pumps andthe cycle is repeated.
The pressure cell can hold a 14-inch diameter core sample with a maximum lengthof 4 ft. Seal assemblies contained in the top flange of the pressure cell prevent fluid fromescaping through the cell’s interface with the drill collar. A set of bolts secures the topflange to the rest of the cell assembly. Rotary speed, rotary torque and WOB are con-trolled by a hydraulic system located on the second floor of the tower. The rotationalpower is supplied by a hydraulic system (two hydraulic pumps) through a two-speedtransmission and a rotary table for speeds up to 120 rpm and a corresponding maximumtorque of 3,000 ft-lb. The pull-down force is achieved by the action of a hydraulic pumpthat applies fluid pressure to pistons in the two pull down cylinders. This hydraulic sys-tem that powers the raising and lowering of the drill stem can produce up to 45,000 lbs. ofbit load and the drill stem has a 10-ft stroke. The drilling mechanism is supported atdifferent levels in the tower to provide space for different lengths of drilling tools.
���
Fig
. 1. T
UD
RP
full-
scal
e te
st r
ig

���
Fig. 2. TUDRP Rig. Drill floor: Rig lower level
The data acquisition system currently consists of a set of measuring and controldevices, junction boxes, wired connections, control panel and a PC-based data logger.Instruments are located around the tower, incorporated into the operating systems(circulating and hydraulic systems) and physically connected to the control room (Fig. 3)to allow monitoring or controlling of all the drilling variables (Tab. 1, Fig. 4).
Fig. 3. TUDRP Rig. Control Room: PC-based data logger and control panel

���
Table 1
Drilling variables and signal sources
Fig. 4. TUDRP Rig. LabView front panel: Data acquisition platform
No. Variable Unit Instrument Type Location
1 Pump pressure psig Pressure Transducer Drill Floor
2 gpm Coriolis Flow and Density Meter Drill Floor
3 Volumetric flow rate
% Pneumatic Flow Control Valve Drill Floor
4 Fluid density lb/gal Coriolis Flow and Density Meter Drill Floor
5 Fluid temperature deg F Resistance Temperature Detector Top of Drill string
6 Drill string vibration ips Vibration Transmitter Top of Drill string
7 Standpipe pressure psig Pressure Transducer Top of Drill string
8 rpm Magnetic Pulse Tachometer Rotary Table
9 Rotary speed
psig Pressure Transducers (Control) Hydraulic Floor
10 in Linear Position Gauge Rotary Table
11 Bit position
in Rotary or Shaft Encoder Rotary Table
12 lbf Strain Gauges Drill string
13 Weight on Bit
psig Pressure Transducer (Control) Hydraulic Floor
14 Torque on Bit ft-lbf Strain Gauges Drill string
15 Cell pressure psig Pressure Transducer Drill Floor
16 Screen pressure psig Pressure Transducer Drill Floor
17 Time sec PC Control Room
18 Rate of penetration ft/hr Calculated Control Room

���
3. TEST CORE BITS AND LAYOUTS OF PDC CUTTERS
The core PDC bits were provided by Halliburton DBS. The initial concept of aneight-blade PDC core bit, with radially movable cutters for laboratory tests, was modifiedslightly to better fit the actual application and evolved to a core bit design with a commonbody and replaceable heads (Tab. 2, Fig. 5).
The study included experiments to evaluate different layouts of PDC cutters. Re-garding the cutter arrangements, the PDC cutters are laid out in six different ways: SingleSet or Base, Behind Track Set, Opposite Track Set, Track Loc, Pair-Cutter Groups(Single Set) and Two-Cutter Groups (Single Set) (Figs 6–12). These layouts allowa constant maximum DOC per cutter of 0.25 in.
For a flat bit profile, a Single Set cutter layout is defined as having no cutters at thesame radial position after cutters are rotationally projected into the bit profile. On the otherhand, a Track Set layout is defined as having at least two cutters at the same radial positionbut on different blades. Track Loc is an extreme version of Track Set, in which there is onlyone primary blade and cutters on all others are redundant to those on the primary blade.The major difference among these three configurations is the engagement area or width ofindentation of cutters while drilling. The Single Set cutter has the smallest indentation widthwhile drilling, and the Track Loc has the largest indentation width.
Table 2
Core PDC bit characteristics
Bit Profile Flat
Body Material Steel
OD 7 in
ID 2 1/4 in
Core Size 2 in Bit Dimensions
Length 8.5 in
Type PDC
Size 5/8 in (16 mm)
Chamfer 0.01 in
Quantity 14
OD Gage 4
Cutters
ID Gage 2
Weight 70 lbs
Maximum Depth of Cut 0.25 in
Back rake Angle 20 deg
Side rake Angle 2 deg
Nozzles None
Special Feature Replaceable heads

���
Fig. 5. Core bit design
Fig. 6. Single Set or Base layout
Fig. 7. Behind Track Set layout

��
Fig. 8. Opposite Track Set layout
Fig. 9. Track Loc layout
Fig. 10. Pair-Cutter Groups, Single Set layout

��
Fig. 11. Two-Cutter Groups, Single Set layout
Fig. 12. Core heads: Layouts of cutters
Two of the proposed PDC cutter arrangements are in correspondence with thetheory published by Chen et al. [4] for improving PDC bit performance in hard andtransit formation drilling. The authors, based on experimental results, propose that

���
cutters are laid out in force-balanced groups, with each group designed to remove a ringof rock independently and efficiently.
4. ROCK SAMPLES AND ROCK CHARACTERIZATION
Originally, it was proposed to prepare concrete samples for this study. Althoughthey are not real formations in drilling operations, they may reproduce mechanical pro-perties of interest, such as the unconfined compressive strength. However, becausea good supply of cores was available, it was decided to change to Bedford (Indiana) andCarthage limestones.
The objective of measuring mechanical rock properties per sample was to correlateany considerable change in rock properties with drilling behavior. Experiments were per-formed using cylindrical rock samples with a length-to-diameter ratio of two. The speci-mens were loaded axially to failure, with no confinement (lateral support). Conceptually,the peak value of the axial stress is taken as the UCS of the sample. In view of the vari-ability of rock properties, when adequate samples were available, repeat testing was per-formed to determine average values. To adjust to experimental conditions, characteriza-tion tests were conducted on dry samples. Although the rock is submerged in water intothe pressure cell while testing in the drill rig, there is not enough time for the rock tobecome fully saturated. Dry conditions are assumed to be closer to the actual setup.
Experimental results are usually represented as stress-strain curves, and tabulatedaverage values of elastic constants and strength (Tab. 3). Again, the purpose was to eval-uate the variability in UCS measured among the samples. This variability was found to besmall for the samples tested.
Table 3
Measured Unconfined Compressive Strength
5. TEST MATRIX AND DATA COLLECTION
The definition of the experimental test matrix (Tab. 4) required taking into accountthe core bit design, the current facility capacities and analysis of the recorded data
Rock sample Average density,
lb/cf
Average Poisson’s
ratio
Average Young’s modulus,
psi
Average Unconfined Compressive
Strength, psi
Bedford (Indiana) limestone
~142 0.23 3.9 (106) 4353
Carthage limestone (Carthage marble) ~168 0.14 6.9 (106) 13570

���
in preliminary tests. From the data recorded, the focus was on those intervals wherethe rate of penetration remained constant for a certain set of drilling parameters. This isdirectly evaluated on the curve of bit displacement as function of time. For the purposeof comparing the performance among the layouts of cutters, the interest was in doingexperiments on a maximum of four different DOC, which correspond to four differentweights on bit. There is a maximum DOC of 0.25 in per cutter. Water is the drilling fluidfor the entire experimental phase.
Table 4
Summary of test matrix
Operating parameters such as N and WOB were varied and the performanceparameters ROP and TQB were measured at each time step. ROP is calculated asa function of bit displacement over time. DOC is calculated from ROP, as well as theaverage WOB and TQB values are calculated at each depth.
Adjustments on WOB and TQB measurements were required to account for thecombined effect of pump-off force, cell pressure and friction forces between the topflange and the drill string. To remove these forces from the actual measurements, thebase condition was established at zero rate of penetration. This is set right after a 2.5-inpilot hole was drilled that allows full bit engagement at the top of the samples. This con-dition was measured per sample per rotary speed and then averaged to estimate the ini-tial WOB and TQB values. This is under the assumption that pump-off force does notdepend on DOC.
6. DATA ANALYSIS
While WOB was gradually varied and the other operating parameters were keptconstant (bit rotational speed and flow rate), all the performance parameters were mea-sured at each time step. Since there is no specific control over the rate of penetration,
Bedford (Indiana) limestone Rock sample
Carthage limestone
Drilling fluid Water
Rotary speed, rpm 60 and 100
Flow rate, gpm 120
Weight on bit, lbs Up to 7000
Back pressure No

���
the data analysis was performed over intervals of time at which both WOB and ROPremained constant. Under these conditions, the TQB is proportional to bit mechanicalspecific energy. Therefore, it is also valid to use TQB to compare the drilling efficiency.Bit mechanical specific energy at each DOC is calculated from the group of measure-ments. The results show how the MSE changes with different layouts under the test ope-rating conditions. They also show how different rock samples (Bedford and Carthagelimestone) perform under the same conditions.
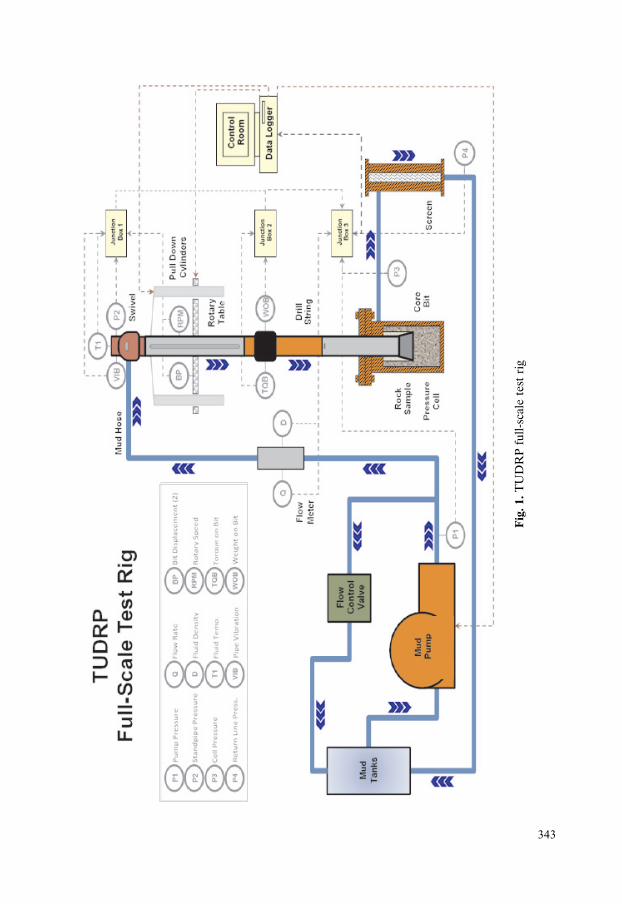
The data obtained from the set of Bedford samples included a total of 12 tests con-ducted as per the test matrix. Expressions describing linear relationships between WOBand DOC as well as between TQB and DOC (Figs 13 and 14) were found. Similarly,the data obtained from the set of Carthage samples included a total of 12 tests conductedfor Carthage marble. Expressions describing linear relationships between WOB andDOC as well as between TQB and DOC were also found (Figs 15 and 16). The maximumROP achieved was limited to the breakability of the rocks.
For the case of Bedford samples, it is noticeable that the linear relationships ob-served in the range of DOC in this study are not valid for a low interval of DOC. It hasbeen documented [1, 2] that there is a higher energy consumption at extremely shallowDOC due to minimum cutter-rock contact required to develop a desirable rate of pene-tration.
From data obtained in Bedford samples, it is important to note that the maximumDOC at which all layouts were able to perform was around 0.15 in./rev. For the case ofCarthage samples, the range of DOC was considerably smaller, up to only 0.05 in./rev.This was because of the high breakability of the rock. Linear relationships were calculat-ed from the curves of DOC vs. TQB at different conditions.
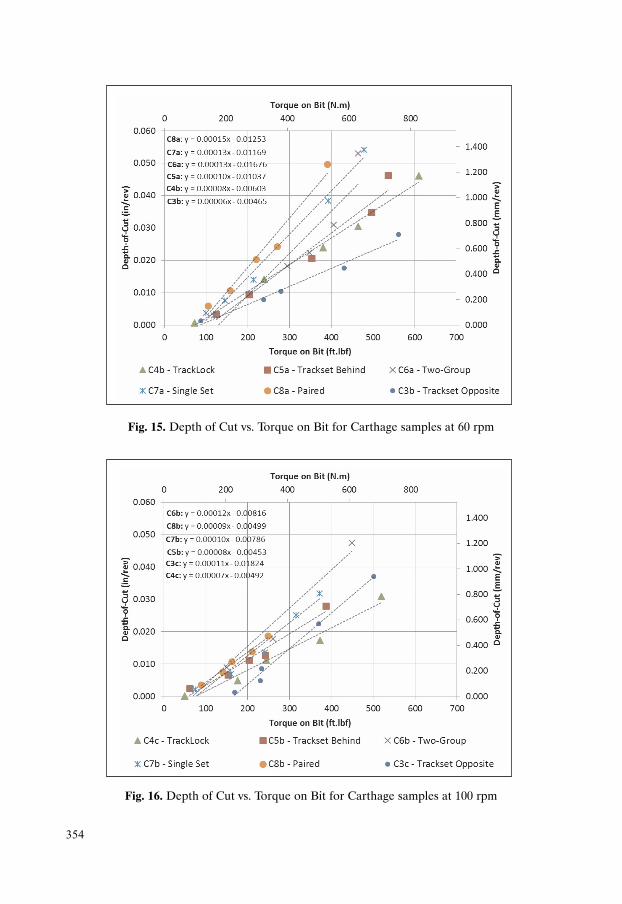
By comparing through the concept of Mechanical Specific Energy among Bedfordsamples (Figs 17 and 18), it is observed that the drilling efficiency of Track Set layout isup to 97� higher than that of other layouts for DOC from 0.05 to 0.15 in./rev. It is impor-tant to note that this performance difference is due to the cutter layouts because nothingis changed except the cutter angular locations. This performance is more remarkable athigher rotational speeds. There is one layout (Pair-cutter Groups) which equals in energyconsumption to the Opposite Track Set layout at a rotary speed of 100 rpm.
From Carthage samples (Figs 19 and 20), it is observed that the drilling efficiencyof the Pair-Cutter Groups layout is up to 112� higher than that of other layouts for DOCfrom 0.01 to 0.04 in./rev. Again, the performance difference is thought to result from thedifferences in the cutter angular locations. There is only one layout (Two-Cutter Groups)at 100 rpm that consumes less energy with respect to the Pair-Cutter Groups layout.
From the set of experiments in Bedford and Carthage limestone, there is no evi-dence to confirm whether the drilling-efficiency improvement is decreased or not withincrease in depth of cut. More laboratory and field tests should be conducted to betterunderstand the conditions under which the cutter layouts benefit the most.

���
Fig. 13. Depth of Cut vs. Torque on Bit for Bedford samples at 60 rpm
Fig. 14. Depth of Cut vs. Torque on Bit for Bedford samples at 100 rpm
���
Fig. 15. Depth of Cut vs. Torque on Bit for Carthage samples at 60 rpm
Fig. 16. Depth of Cut vs. Torque on Bit for Carthage samples at 100 rpm
���
Fig. 17. Mechanical Specific Energy for Bedford samples at 60 rpm
Fig. 18. Mechanical Specific Energy for Bedford samples at 100 rpm

���
Fig. 19. Mechanical Specific Energy for Carthage samples at 60 rpm
Fig. 20. Mechanical Specific Energy for Carthage samples at 100 rpm

���
7. DISCUSSION
Chen [4] pointed out that the extent to which drilling efficiency can be improved bya certain cutter layout may depend on the type of rock and drilling parameters. By ana-lyzing the drilling performance per cutter arrangement, it is seen that particular layoutsperform better at certain rotary speeds: Behind Track Set layout at 60 rpm, and the Pair--Cutter Groups and the Single Set layouts at 100 rpm.
Similarly, Chen [4] suggested that the extent to which drilling efficiency can beimproved by a certain cutter layout depends on the type of rock. There is also evidencein our study to state that the relative drilling performance among the different layouts ofcutters varies according to the type of rock. It is observed that the drilling performanceof the six layouts in Bedford samples is considerably different than the correspondingperformance in Carthage samples. While the Opposite Track Set performed the bestin Bedford rocks, it developed the highest energy consumption in Carthage limestone.
In addition to the analysis of drilling performance, there are some observations re-garding the coring operation. For the Bedford samples drilled, the percentage of reco-very was 100%. It was possible to retrieve full cores after every drill test involving Bed-ford limestone. The quality of the core surface is a measure of the rate of penetration.Therefore, the bottom sections of the samples were exposed to higher rates of penetra-tion and, thus, greater roughness was observed.
On the other hand, the Carthage samples were found to be highly fractured. Naturalfractures are observed on the samples and their locations match the breaking pointswhile drilling the Carthage rocks. Due to the limited rate of penetration, the core surfacewas not significantly affected by the cutting action.
Although the performance of Track Loc layout was low when compared to the othersunder the same conditions, it was found to be suitable for the purpose of coring. This isbased on the physical observation of higher stability or lower vibrations while drilling.This observation cannot be supported with data because the current setup is unable todirectly measure vibrations at the core bit.
8. CONCLUSIONS
The experiments on core PDC bits revealed that the cutter layout has a significanteffect on MSE. Under the same drilling parameters, the layout plays a key role in drillingefficiency. Experimental results show strong linear relationships between DOC, WOBand TQB at different conditions for the specific bit characteristics. Similarly, there isevidence to validate that the type of rock affects the relative drilling performance ofthe different cutter arrangements.
The experiments on Bedford samples revealed that the Track Set layout performsbetter than other layouts for depth of cut from 0.05 to 0.15 in./rev at the two rotationalspeeds in this study. This is under the assumption that variability in rock properties is not
��
decidedly affecting the performance. The experiments on Carthage samples revealedthat the Pair-Cutter Groups layout performs better than other layouts for depths of cutfrom 0.01 to 0.04 in./rev at the two rotational speeds in the study. This is under the as-sumption that slight variations in individual rock properties do not significantly affect bitperformance.
NOMENCLATURE AND CONVERSION FACTORS TO SI UNITS
Ab – Bit area, in2 (1 in2 ≈ 645.2 mm2)AOC – Area of Cut, in2 (1 in2 ≈ 645.2 mm2)DOC – Depth of Cut, in/rev (1 in./rev ≈ 25.4 mm/rev)Drill string vibration, ips (1 in./s ≈ 25.4 mm/s)E – Young’s modulus (drained), psi (1 psi ≈ 6894.8 Pa)Fluid density, lb/gal (1 lb/gal ≈ 119.8 kg/m3)Fluid temperature, deg F (deg C = [deg F – 32] × 5/9)Fn – Normal or vertical force (single cutter), lbf (1 lbf ≈ 4.45 N)Fs – Shear or horizontal force (single cutter), lbf (1 lbf ≈ 4.45 N)Fh – Normal force (full bit), lbf (1 lbf ≈ 4.45 N)ID – Inner Diameter, in (1 in. ≈ 25.4 mm)MSE – Mechanical Specific Energy, psi (1 psi ≈ 6894.8 Pa)N – Rotary Speed, rpm (1 rpm ≈ 0.105 rad/s)n – Number of cuttersOD – Outer Diameter, in (1 in. ≈ 25.4 mm)PDC – Polycrystalline Diamond Compactr – Cutter radial position, in (1 in. ≈ 25.4 mm)ROP – Rate of Penetration, ft/hr (1 ft/hr ≈ 0.085 mm/s)TQB – Torque on Bit, ft-lbf (1 ft-lbf ≈ 1.356 N-m)TUDRP – Tulsa University Drilling Research ProjectsUCS – Uniaxial Compressive Strength, psi (1 psi ≈ 6894.8 Pa)Volumetric flow rate, gpm (1 gpm ≈ 6.309·10–5 m3/s)WOB – Weight on Bit, lbf (1 lbf ≈ 4.45 N)WOC – Width of cut, in (1 in. ≈ 25.4 mm)β – Side rake angle (1 deg ≈ 0.0175 rad)ε – Intrinsic specific energyζ – Ratio of vertical to horizontal forceθ – Back rake angle (1 deg ≈ 0.0175 rad)μ – Friction coefficientν – Poisson’s ratioψ – Interface friction angle (1 deg ≈ 0.0175 rad)
��
REFERENCES
[1] Akbari B.: PDC Cutter-Rock interaction: Experiments and Modeling. PhD disserta-tion, The University of Tulsa, Tulsa, Oklahoma, December 2014.
[2] Akbari B., Miska S., Yu M. et al.: The Effects of Size, Chamfer Geometry, and BackRake Angle on Frictional Response of PDC Cutters. Presented at the 48th US RockMechanics & Geomechanics Symposium, Minneapolis, 1–4 June. ARMA 14-7458,2014.
[3] Andersen E., Azar J.: PDC-Bit Performance under Simulated Borehole Conditions.SPE Drill & Compl 8 (3), 1993, pp. 184–188. SPE 20412.
[4] Chen S., Arfele R., Anderle S. et al.: A New Theory on Cutter Layout for ImprovingPDC Bit Performance in Hard and Transit Formation Drilling. SPE Drill & Compl,28 (4), 2013, pp. 338–349, SPE-168224-PA.
[5] Detournay E., Defourny P.: A phenomenological model for the drilling action ofdrag bits. International Journal of Rock Mechanics and Mining Sciences and Geo-mechanics Abstracts, 29 (1) 1992, pp. 13–2.
[6] Garcia-Gavito D.: Experimental Study of PDC Bit Hydraulics. MS Thesis, The Uni-versity of Tulsa, Tulsa, Oklahoma, 1986.
[7] Garcia-Gavito D., Azar J.: Proper Nozzle Location, Bit Profile, and Cutter Arrange-ment Affect PDC-Bit Performance significantly. SPE Drill & Comp 9 (3), 1994,pp. 167–175, 20415-PA.
[8] Glowka D.A.: Use of Single-Cutter Data in the Analysis of PDC Bit Designs:Part 1 –Development of a PDC Cutting Force Model. Presented at the SPEAnnual Technical Conference and Exhibition, New Orleans, 5–8 October 1986,SPE-15619.
[9] Hariharan H.: Effect of PDC Bit Design and Confining Pressure on Bit Balling Ten-dencies while Drilling Shales using Water-based Muds. MS Thesis, The University ofTulsa, Tulsa, Oklahoma, 1993.
[10] Peterson J.: Diamond Drilling Model Verified in Field and Laboratory Tests. Pre-sented at the SPE-AIME 49th Annual Fall Meeting, Houston, 6–9 October 1974,SPE-5072.
[11] Rafatian N.: Modeling the Effect of Pore Pressure on Rock Strengthening and Me-chanical Specific Energy. MS Thesis, The University of Tulsa, Tulsa, Oklahoma,2008.
[12] Rafatian N., Miska S.Z., Ledgerwood L.W. et al.: Experimental study of MSE ofa single PDC cutter interacting with rock under simulated pressurized conditions.SPE Drilling & Completion, 25(01), 2010, pp. 10–18.
[13] Rajabov V.: The Effects of Back Rake and Side Rake Angles on Mechanical SpecificEnergy on Single PDC Cutters on Selected Rocks. MS Thesis, The University ofTulsa, Oklahoma, 2011.

���
[14] Rajabov V., Stefan M., Mortimer L. et al.: The Effects of Back Rake and Side RakeAngles on Mechanical Specific Teale, R. 1965. The concept of Specific Energy in RockDrilling. Int. J. Rock Mech. Mining Sci., 2, 2012, pp. 57–73.
[15] Villa O.: Wear and Performance: An experimental study of PDC Bit Cutting Mecha-nisms. MS Thesis, The University of Tulsa, Tulsa, Oklahoma, 1990.
[16] Ziaja M., Miska S.: Mathematical Model of the Diamond-Bit Drilling Process and ItsPractical Application. SPE 9 (3), 1982, pp. 911–922, 10148-PA.
[17] Ziaja M.: Mathematical Model of the Polycrystalline Diamond Bit Drilling Processand Its Practical Application. Presented at the SPE Annual Technical Conferenceand Exhibition, Las Vegas, 22–25 September 1985, 14217-MS.