Levin 1995 Weld Overlay Coatings
11
ELSEVIER Wear 181-183 (1995) 810-820 Short Communication Weld overlay coatings for erosion control B.F. Levin, J.N. DuPont, A.R. Marder Lehigh University Energy Research Center, Bethlehem, PA 18015, USA Received 18 May 1994; accepted 1 November 1994 Abstract Research was conducted to develop a criterion for selecting weld overlay coatings for erosion mitigation in circulated fluidized beds (CFBs). Initially, 11 weld overlay alloys were deposited on 1018 steel substrates using the plasma arc welding process and erosion tested at 400 “C. Erosion resistance was evaluated by determining the steady state erosion rate, and the microstructure of each coating was characterized before erosion testing. The steady state erosion rates for several weld overlay coatings (Ultimet, Inconel-625 and 316L SS) were considerably lower than the other coatings evaluated (Armacor-M, B-60, TS-2, Stellite-6, Hastelloy-22, high Cr iron and 420 SS). No correlations were found between the room temperature hardness of the weld overlay coatings and their erosion resistance at elevated temperature. Microhardness tests were performed on the eroded samples below the erosion surface in order to determine the size of the plastically deformed zone, and it was found that some coatings deformed plastically as a result of erosion while others did not. Possible erosion mechanisms for these groups of coatings were analyzed. Keywords: Solid particle erosion; Weld overlay coating; Plastic deformation; Work hardening; Hardness; Toughness 1. Introduction The erosion of materials by the impact of solid particles has received increasing attention during the past 20 years. Today, solid particle erosion (SPE) damage remains one of the most significant performance problems among US utilities, affecting roughly 80% of fossil fuel systems [l]. Wastage associated with erosion has caused an increase in power plant down time due to increased maintenance, therefore reducing plant efficiency. This problem has led to various methods to combat SPE. One method is to apply coatings to the components subjected to erosive environments. Pro- tective weld overlay coatings are particularly advan- tageous in terms of coating quality. The weld overlay coatings are essentially immune to spallation due to a strong metallurgical bond with the substrate material, and using powder mixtures a wide range of alloys can be applied in order to achieve the best performance in an erosive environment. Although there has been a large amount of research conducted to understand abrasive wear resistance of weld overlay coatings [2], few investigations have dealt with the erosion aspect of wear, making the selection of welding alloys for erosion resistance a difficult task. Therefore research was initiated in order to determine the effects of weld overlay coating composition, microstructure and me- chanical properties on erosion resistance. The results of this research will be useful for developing material selection criteria for erosion-resistant weld overlay coat- ings in circulated fluidized beds (CFBs). 2. Experimental procedure 2.1. Coating selection Eleven weld overlay coatings were selected for erosion testing. The nominal chemical composition of the se- lected coatings is shown in Table 1. All coatings were separated into three major groups: (1) cobalt-base (or cobalt-containing) alloys; (2) nickel-base alloys; (3) iron- base alloys. C!O43-1648/95/$09.50 8 1995 Elsevier Science S.A. All rights reserved SSDI 0043-1648(94)07088-l
description
Weld Overlay
Transcript of Levin 1995 Weld Overlay Coatings

ELSEVIER Wear 181-183 (1995) 810-820
Short Communication
Weld overlay coatings for erosion control
B.F. Levin, J.N. DuPont, A.R. Marder Lehigh University Energy Research Center, Bethlehem, PA 18015, USA
Received 18 May 1994; accepted 1 November 1994
Abstract
Research was conducted to develop a criterion for selecting weld overlay coatings for erosion mitigation in circulated fluidized beds (CFBs). Initially, 11 weld overlay alloys were deposited on 1018 steel substrates using the plasma arc welding process and erosion tested at 400 “C. Erosion resistance was evaluated by determining the steady state erosion rate, and the microstructure of each coating was characterized before erosion testing. The steady state erosion rates for several weld overlay coatings (Ultimet, Inconel-625 and 316L SS) were considerably lower than the other coatings evaluated (Armacor-M, B-60, TS-2, Stellite-6, Hastelloy-22, high Cr iron and 420 SS). No correlations were found between the room temperature hardness of the weld overlay coatings and their erosion resistance at elevated temperature. Microhardness tests were performed on the eroded samples below the erosion surface in order to determine the size of the plastically deformed zone, and it was found that some coatings deformed plastically as a result of erosion while others did not. Possible erosion mechanisms for these groups of coatings were analyzed.
Keywords: Solid particle erosion; Weld overlay coating; Plastic deformation; Work hardening; Hardness; Toughness
1. Introduction
The erosion of materials by the impact of solid particles has received increasing attention during the past 20 years. Today, solid particle erosion (SPE) damage remains one of the most significant performance problems among US utilities, affecting roughly 80% of fossil fuel systems [l]. Wastage associated with erosion has caused an increase in power plant down time due to increased maintenance, therefore reducing plant efficiency. This problem has led to various methods to combat SPE. One method is to apply coatings to the components subjected to erosive environments. Pro- tective weld overlay coatings are particularly advan- tageous in terms of coating quality. The weld overlay coatings are essentially immune to spallation due to a strong metallurgical bond with the substrate material, and using powder mixtures a wide range of alloys can be applied in order to achieve the best performance in an erosive environment. Although there has been a large amount of research conducted to understand abrasive wear resistance of weld overlay coatings [2], few investigations have dealt with the erosion aspect
of wear, making the selection of welding alloys for erosion resistance a difficult task. Therefore research was initiated in order to determine the effects of weld overlay coating composition, microstructure and me- chanical properties on erosion resistance. The results of this research will be useful for developing material selection criteria for erosion-resistant weld overlay coat- ings in circulated fluidized beds (CFBs).
2. Experimental procedure
2.1. Coating selection
Eleven weld overlay coatings were selected for erosion testing. The nominal chemical composition of the se- lected coatings is shown in Table 1. All coatings were separated into three major groups: (1) cobalt-base (or cobalt-containing) alloys; (2) nickel-base alloys; (3) iron- base alloys.
C!O43-1648/95/$09.50 8 1995 Elsevier Science S.A. All rights reserved SSDI 0043-1648(94)07088-l

B.F. Levin et al. / Wear 181483 (1995) 810420 811
Table 1 NominaI chemical composition (wt.%) of the selected weld overlay coatings
Cobalt base alloys (1) Steilited (62%Ck+28%Cr-4.5%W-l.l%C-l.O%Si-2.3%Fe) (2) Tristelle-TS2 (37%Fe-35%Cr-ll%Co-9%Ni-4.5%Si-2%C) (3) Uhimet (57%&-24%Cr-1.8%M+8.8%Ni-2.9%Fe-2%W-O.O58%C)
Nickel-base alloys (1) Hastelloy-22 (57.1%Ni-21%Cr-23%Mo-2.95%W-O.OO6%C-5.15%Fe) (2) Inconel-625 (61.7%Ni-21.7%Cr-G3.5%Mo-3.49%(Nb+Ta)-O.O23%C) (3) B-60 (73.8%Ni-13.4%Cr-4.2%Si-4.3%Fe-2.8%B-0.67%C)
Iron-base alloys (1) Armacor-M (59%Cr-39%-Fe-S%B-3%Si) (2) Iron aiuminide (14.3%AI-2%Cr-84.7%Fe) (3) High chromium white iron (68.7%Fe-27%Cr-0.44%Mn-0.6%Si~.27%Ni-0..ll%N-2.74%C) (4) 316L SS (69%Fe-16.5%Cr-2.1%Mo-l0.2%Ni-l.45%Mn-O.027%C) (5) 420 SS (85.73%Fe-13.07%Cr-O.425%Si-0.35%Mn-O.4%C)
2.2. Coating deposition
A fully automatic welding laboratory was used to apply the weld alloys and the plasma transferred arc welding (PTAW) process was employed for coating deposition. This process was selected on the basis of its ability to apply a wide range of overlay alloys in powder form and obtain a high degree of control over coating dilution from the substrate. All coatings were deposited on 1018 carbon steel substrate (12 in X 12 in x 0.25 in thick). This substrate material was chosen because it is widely used for boiler tube applications in CFBs. After deposition, coatings were sectioned into 0.5 in x0.5 in coupons for erosion tests. The welding parameters, such as voltage, travel speed, current and filler metal feed rate, were optimized in order to provide similar heat inputs and coating thicknesses for each alloy. Coating thicknesses, heat inputs, powder feed rates and interpass temperatures are shown in Table 2.
2.3. Erosion tests
2.3.1. Erosion tester A schematic diagram of the erosion tester used in
this study is shown in Fig. 1. The system is driven by an air compressor which can deliver up to 35 standard cubic feet per minute (s&n) of air. The air is cleaned through a series of filters to remove any entrained water. The flow meter and pressure regulator control the amount of air that flows through the system and the air is heated by two inline fluid heaters. The erodent is fed into the air stream with a screw feeder to ensure constant feed rates. The particles and hot air are accelerated and impinge on the sample at any angle between 0” and 90”. The particle velocity distribution prior to impact is directly measured with a laser Doppler velocometer (LDV).
2.3.2. Erosion test conditions The standard test conditions chosen for this study
were as follows: eroded sample planar dimensions, 0.5 in X 0.5 in; sample temperature, 400 “C; erodent particle
Table 2 Process parameters for deposition of hardfacing weld overlays alloys (plasma transferred arc process)
Hardfacing weld overlay coating
Coating thickness (mm)
Heat input (J mm-‘)
Powder feed rate (cm’ s-‘)
Interpass temperature (“C)
Stellited 3.3 1727 3.0 Tristelle TS-2 4.2 1272 3.0 Ultimet 3.4 1296 3.0 Hastelloy 22 1.8 694.98 3.5 B-60 4.0 786.85 3.5 Inconel 625 3.5 1056 3.5 Armacor 2.4 776.47 4.0 Iron aluminide 3.3 1272 3.0 High chromium iron 3.5 912 4.0 316L SS stainless steel 4.3 1131.42 3.5 420 SS stainless steel 4.6 1131.42 3.5
<60 ~60 ~60 <60 <60 ~60 <60 160 ~60 160 <60

812 B.F. L&n et al. I Wear 181483 (1995) 810-820
Particle Feeder
Acceleration Tube
II Specimen Chamber
Exhaust
Particle Collectio
-Flow Meter
Pressure
D / Regulator
Filters
Fig. 1. Schematic diagram of the erosion tester.
Time Fig. 2. Schematic diagram of the erosion kinetics.
velocity, 40 m s-’ ( f 5%); erodent particle flux, 8.56 mg mm-2s-1; impingement angle, 90” and 30”; erodent, angular alumina (Al,O,); erodent size, 300 pm; exposure time, 5, 10, 20, 50 and 100 min.
The sample temperature was chosen to be 400 “C, similar to the temperature of the fireside boiler tube surface. The erodent particle velocity is reported as an average velocity and the standard deviation was found to be approximately 5%. The alumina erodent was reused for erosion testing and was sieved using a 300 pm mesh to remove any smaller particles. The erodent shape was found not to change between the new and used alumina.
2.3.3. Steady state erosion rate determination The erosion kinetics typical of most materials are
shown schematically in Fig. 2. The weight loss of a given material as a function of time during erosion often follows a pattern consisting of a relatively small incubation period with little or no material removal. Apparently, the incubation period is indicative of the time required for sufficient work hardening to occur prior to localized fracture [3]. The material eventually experiences surface weight loss and surface hardening at the same rate, and attains a steady state erosion rate. Steady state erosion is defined by the linear portion of the weight loss vs. erosion time plot [4]. Determination
of the steady state erosion rate is very important from a practical point of view, since most of the material removal occurs during this period. Five different erosion exposure times (5, 10, 20, 50 and 100 min) were used in this study in order to obtain a satisfactory weight loss vs. erosion time plot for each weld overlay coating. For some coatings, an additional 80 min test was conducted. One sample was used per erosion time. Therefore five or six samples from each coating were used to obtain the relationship between weight loss and erosion time for each impingement angle.
To quantify the weight loss during the erosion ex- periments, the erosion coupons were ultrasonically cleaned in acetone and weighed before the erosion tests to the nearest 0.1 mg. After erosion testing, the samples were again ultrasonically cleaned in acetone and weighed to determine the weight change due to erosion. Graphs of weight loss vs. time of exposure were obtained for each weld overlay coating for each impingement angle. A linear regression analysis was performed on the data in the steady state erosion regime of the weight loss vs. erosion time plots, the slopes of which yield the steady state erosion rate. The volume erosion rates for each coating were obtained by dividing the weight loss rate by the density of the coating. It is essential to determine the volume erosion rate in order to make a comparison between materials with different densities. For example, two materials with different densities may exhibit equal weight loss due to erosion; however, high density material will have a lower volume loss than a material with low density.
2.4. Microscopy
The microstructures of all the coatings in the as- weld condition were characterized using light optical microscopy (LOM). In addition, the eroded surfaces of each coating after 100 min of exposure (longest time) were observed by scanning electron microscopy (SEM).
2.5. Hardness measurements
Hardness measurements were performed using a Vickers indenter with a test load of 30 kgf. The in- dentations were made on the top surface of the coatings. Three to five indentations were made per sample and the average was calculated. The standard deviation was found to be no more than 5% for each coating. The test procedure, specimen size and finish requirements satisfied the ASTM E 92 standard [5].
2.5.1. Estimation of the plastic zone size In order to determine the size of the deformed region
beneath the eroded surface, microhardness tests were performed on a transverse section of each weld overlay

B.F. Levin et al. / Wear 181483 (1995) 810-820 813
DISTANCE FROM THE ERODED SURFACE (MICRONS)
Fig. 3. Schematic diagram of the microhardness technique used to determine the size of the plastic zone due to particle impact.
coating after 100 min of exposure in the erosion tester at a particle impact angle of 90”. As a result of erosion, the material beneath the eroded surface may experience plastic deformation and the coating hardness may in- crease directly below the surface. The plastic zone size can be estimated by obtaining a microhardness profile from the eroded surface into the base material. A schematic diagram of this profile is shown in Fig. 3. The depth at which the hardness value becomes constant is defined as the plastic zone size. Microhardness mea- surements were performed using a Vickers indenter with test loads of 10, 25, 50, 100 and 200 gf. The microhardness tests were conducted according to the ASTM E 384 standard [6]. Three to five microhardness profiles were obtained in different locations of each coating in order to improve the statistical significance of the data. From these profiles, the size of the plastic zone for each coating was estimated.
3. Results and discussion
3.1. Microstructural characterization
The microstructure of each weld overlay coating was characterized using LOM. Inspection of the micro- structures showed that most of the coatings (Stellite- 6, Ultimet, Inconel-625, Hastelloy-22, B-60, high chro- mium iron, 316L SS and 420 SS) exhibited dendritic microstructures typical of weld materials. As an example of the dendritic microstructure, the Stellite-6 weld
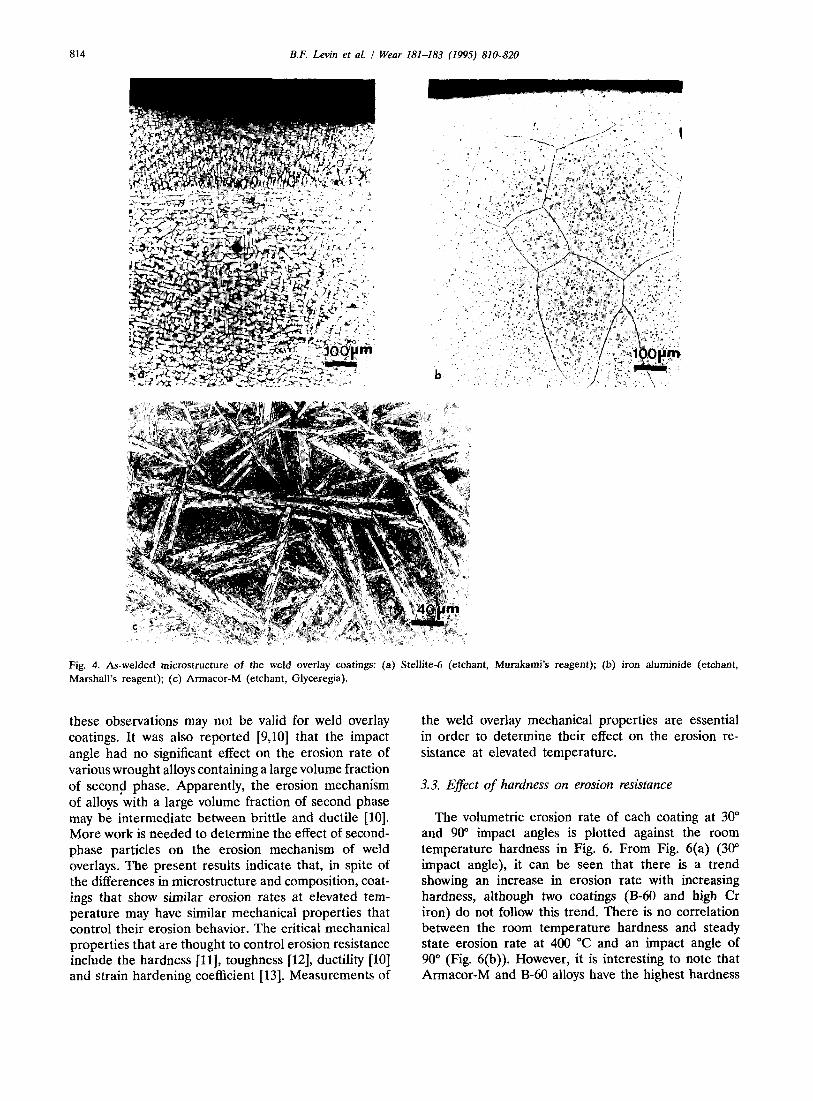
overlay coating is shown in Fig. 4(a). The microstructure consists of primary dendrites (white phase) and inter- dendritic eutectic regions. The iron aluminide coating microstructure is significantly different from all the other coatings studied and the equiaxed grain mor- phology with fine precipitates is shown in Fig. 4(b). The microstructure of the Armacor-M coating is also different from the rest of the coatings investigated and is shown in Fig. 4(c). The coating microstructure pos- sesses a primary needle-like phase of various sizes (white phase) that appears to be borides in a metal (Cr-Fe) matrix.
It should be noted that the microstructures of all the coatings are very inhomogeneous due to non-equi- librium solidification during welding. In addition, most of the coatings consist of a large volume fraction of hard second-phase particles such as carbides and/or intermetallics. It has been indicated that these second- phase particles may contribute significantly to the abra- sion resistance of weld overlay coatings [7,8]. However, their role in erosion resistance needs to be determined.
3.2. Erosion tests
As an example, typical weight loss vs. time plots for Armacor-M, 316L SS and iron aluminide coatings are shown in Fig. 5. All three coatings exhibited incubation periods of approximately 20 min before steady state was reached. It can be seen that the Armacor-M coating showed the highest steady state erosion rate (0.162 mg min-I) at 90” impact. The 316L SS and iron aluminide weld alloys showed significantly lower erosion rates (0.078 mg min- ’ and 0.073 mg mine1 respectively). The volumetric steady state erosion rates for all the coatings at 400 “C for 90” and 30” impact angles are shown in Table 3. It can be seen that, at both impact angles, some weld overlays, such as Ultimet, Inconel- 625 and 316L SS, exhibited steady state erosion rates which were significantly lower than the erosion rates for the remaining coatings. These results are surprising since the coatings have different chemical compositions and microstructures. Moreover, alloys that are com- mercially used for abrasion protection, such as Stellite- 6, B-60 and Armacor-M, showed relatively poor erosion resistance compared with Inconel-625 and 316L SS coatings that are used mostly for corrosion protection. These results indicate that factors which contribute to the abrasion and erosion behavior may be different.
It was also found that the steady state erosion rates did not vary significantly with particle impact angle for Stellited, Ultimet, Inconel-625, iron aluminide, Ar- macor-M, high Cr iron and 316L SS coatings. It is generally accepted that the erosion of ductile materials is greatest when the angle of impact is in the 20”-30” range, whereas the erosion of brittle materials is greatest at 90” [4]. However, the present results suggest that
814 B.F. Levin et al. I Wear 181-183 (1995) 810-820
Fig. 4. As-welded microstructure of the weld overlay coatings: (a) Stellite-6 (etchant, Murakami’s reagent); (b) iron aluminide (etchant, Marshall’s reagent); (c) Armacor-M (etchant, Glyceregia).
these observations may not be valid for weld overlay coatings. It was also reported [9,10] that the impact angle had no significant effect on the erosion rate of various wrought alloys containing a large volume fraction of second phase. Apparently, the erosion mechanism of alloys with a large volume fraction of second phase may be intermediate between brittle and ductile [lo]. More work is needed to determine the effect of second- phase particles on the erosion mechanism of weld overlays. The present results indicate that, in spite of the differences in microstructure and composition, coat- ings that show similar erosion rates at elevated tem- perature may have similar mechanical properties that control their erosion behavior. The critical mechanical properties that are thought to control erosion resistance include the hardness [II], toughness [12], ductility [lo] and strain hardening coefficient [13]. Measurements of
the weld overlay mechanical properties are essential in order to determine their effect on the erosion re- sistance at elevated temperature.
3.3. Effect of hardness on erosion resistance
The volumetric erosion rate of each coating at 30 and 90” impact angles is plotted against the room temperature hardness in Fig. 6. From Fig. 6(a) (30 impact angle), it can be seen that there is a trend showing an increase in erosion rate with increasing hardness, although two coatings (B-60 and high Cr iron) do not follow this trend. There is no correlation between the room temperature hardness and steady state erosion rate at 400 “C and an impact angle of 90” (Fig. 6(b)). However, it is interesting to note that Armacor-M and B-60 alloys have the highest hardness

B.F. Levin et al. I Wear 181483 (1995) 810-820 815
Table 3 Volume steady state erosion rates for tested coatings
Coating Erosion rate (mm’ min-‘) X 1000
90” impact angle 30” impact angle
Weld overlay coatings Cobalt base
Stellite-6 Ultimet TS-2
Nickel state Inconel 625 Hastelloy-22 B-60
Iron base Iron aluminide Armacor-M High chromium iron 316L SS 420 SS
11.9 8.5
10.4
9.4 11.4 13.5
10.3 9.3 22.2 20.3 11.1 11.3 10.0 9.2
9.4 14.2
12.2 9.7
12.5
9.5 9.4 9.9
cl ARMACOR-M
0 316L SS
A lRON ALUMR‘IIDE
ALUMINA ERODENT
90 DEGREES IMPACT ANGLE
TEMPERATURE-400 C
0 20 40 60 80 100 120
TIME fminl Fig. 5. Weight loss as a function of time for Armacor-M, 316L SS and iron aluminide weld overlay coatings.
and exhibit the highest erosion rates at a 90” erodent impact angle. It should be noted that the erosion rates were measured at 400 “C, whereas the hardness tests were conducted at room temperature. This correlation has practical utility since room temperature hardness tests are easy to perform and are often used by vendors and users to characterize coatings.
Previous work on weld overlay coatings has shown that an increase in coating hardness may lead to an increase in abrasion resistance 1141. However, other workers have shown that hardness does not affect the erosion resistance [15]. Some researchers [ll] have found that an increase in hardness for different types of materials may lead to an increase in the erosion resistance. The results obtained in the present inves- tigation suggest that an increase in room temperature hardness does not necessarily represent an increase in erosion resistance of the weld overlay coatings. More-
Q 19-
x 2 18- ._ E 2 17-
E F 16-
2 IS- z
= g 14-
2 13-
g 3 IZ-
e II-
IO-
0-r
a no ss
??8.60
316L ss IR)NAlumIoE
a,, I , , , , , , , , , I, I
loo I50 200 250 MO 350 400 450 5al 550 600 650 700 750 8@J I
HARDNESS WICKERS)
8 IM) I50 200 250 300 350 400 450 500 550 600 650 700 750 800 !
HARDNESS (VICKERSI
Fig. 6. Volume steady state erosion rates of weld overlay coatings as a function of room temperature hardness: (a) 30” impact angle; (b) 90” impact angle.
over, it was found that coatings having a relatively low hardness level (below 350 I-IV), such as Inconel-625, iron aluminide and 316L SS, consistently showed a higher erosion resistance, whereas some of the coatings with a higher hardness showed lower erosion resistance (Armacor-M and B-60). Therefore room temperature hardness measurements may not be a valid criterion for the selection of erosion-resistant weld overlay coat- ings at elevated temperature.

816 B.F. Levin et al. / Wear 181483 (1995) HO-820
3.3.1. Plastic zone measurements and SEA4 observations The results of the cross-section microhardness tests
are shown in Fig. 7. It can be seen that, for some coatings (Ultimet, iron aluminide, 316L SS, Hastelloy- 22, Inconel-625 and Stellite-6), the hardness significantly increases in the vicinity of the eroded surface (Figs. 7(a)-7(f)). These results indicate the formation of a plastically deformed zone due to particle impact. As a result of the particle impact, the coating is plastically
316L SS WELD OVERLAY COATING IRON ALUMINIDE WELD OVERLAY COATING
deformed, and the dislocation density increases in the vicinity of the impact, producing an increase in hardness at the coating surface. The extent of plastic deformation, and the corresponding extent of impact energy dissipated through deformation, may be determined by measuring the size of the plastically deformed zone. From Figs. 7(a)-7(f), the plastic zone size for Ultimet, iron alu- minide, 316L SS, Hastelloy-22, Inconel-625 and Stellite- 6 weld overlays can be estimated at approximately 70,
750- b - 7On- 5 = 650 -
2 m_
g - so- 2:
200 0 20 11 60 8’0 loo 110 14) 160 180 200 220
DISTASCE FROM THE ERODED SURFACE IMICRONSI
HASTELLOY-22 WELD OVERLAY COATING
3nO-
250 -
200, I , , , , , , I I I I
0 20 40 Ml a0 Ial I20 140 160 InIl 200 220
DISTASCE FROM THE ERODED SURFACE I>IICRONSI
INCONEL-62; WELD OVERLAY COATING u_-
750- *
- 2
7nn-
250 -
200 , , I , , I I I , , I b 0 10 ‘0 30 40 50 60 70 60 90 loo 110 I20 130
DISTANCE FROM THE ERODED SURFACE IMICROS!
I m , , , , , I,, , , ,
0 zn 4) 64 80 1001201401601110200220~~D2~~~03003203~13
DISTASCE FROM THE ERODED SURFACE IMICRONSI
ULTIMET WELD OVERLAY COATIXG aw,
iil,;,;t ,,,, II, 0 20 40 60 X0 1M)1201~01601802002202J02~?S03~3
DISTANCE FROM THE ERODED SURFACE (MICROSSl
STELLITE-6 WELD OVERLAY COATING I200 IISO f I loo
09
0 0
0
0 000
DISTANCE FROM TllE ERODED SURFACE (MICRONS)
Fig. 7. (continued)

B.F. Lmin et al. / Wear 181483 (1995) 810-820 817
420 SS WELD OVERLAY COATING TS-2 WELD OVERLAY COATING
DISTANCE FROM THE ERODED SURFACE (MICRONS) DISTANCE FROM THE ERODED SURFACE I>IICROSSI
ARMACOR-M WELD OVERLAY COATISG IZDJ II50 I loo i
HIGH CHROMIUM CAST IROS WELD OVERLAY COATISG lxxl-. 1150- 1100- i 1050 -
f = IO(x)-
5 YSO-
Y ‘Xnx, - --’ RW-
‘tz 6X)- $ MN,-
5SO- I = SIX) - z 450 -
MO- 350 - 3007
0
zl 0 20 Jo * “0 100 12” ,.$I, I64 ISO xl 220 XI ?M) xi0 : I,
DISTANCE FROM T~IE ERODED SURFACE IXIICROWI DISTANCE FROM THE ERODED SURFACE I~cRo~S~
B-60 WELD OVERLAY COATISG
DISTANCE FROM THE ERODED SURFACE IWCROSSI
Fig. 7. Variation of hardness as a function of distance from the eroded surface for weld overlay coatings.
70, 55, 35, 40 and 20 pm respectively. However, for Armacor-M, B-60, 420 SS, IS-2 and high chromium iron coatings (Figs. 7(g)-7(k)), no work hardening zone could be detected. These results indicate that this group of materials does not appreciably deform plastically during particle impact.
On the basis of plastic zone measurements, it can be seen that one group of coatings experienced sig-
nificant deformation, while the other group did not deform plastically. However, there are coatings in each class which exhibit similar erosion rates (Inconel-625 and 420 SS at a 90” impact angle). This result suggests that the erosion mechanism of each group is appreciably different and therefore the mechanical properties which govern the erosion resistance of each group may not be the same. The SEM examinations of the erosion

818 B.F. Loin et al. / Wear 181483 (1995) 810-820
scars after 100 min of exposure in the erosion tester at a 90” impact angle confirmed the plastic zone mea- surement data. The erosion scars of the coatings that possessed a plastic zone showed evidence of gouging and impact craters. Gouging for the Stellite-6 coating and impact craters for the Ultimet coating are shown in Figs. g(a) and 8(b) respectively (see arrows).
It is generally accepted that erosion mechanisms that involve plastic deformation cause gouging and crater formation [16]. Evidence of plastic deformation due to erosion has been observed by many researchers [17,18].
Usually, the erosion of ductile materials is accompanied by plastic deformation and, when a critical strain is exceeded in the deformation volume underneath the eroded surface, the material is detached from the surface by ductile fracture [17]. On the other hand, the erosion of brittle materials that do not deform plastically involves brittle fracture (i.e. chipping, cracking) after particle impact [12]. Scanning electron micrographs of the ero- sion scars for Armacor-M and 420 SS coatings, in which no plastic zone could be detected, are shown in Figs.
Fig. 8. Scanning electron micrographs of the eroded surface after 100 min exposure in the erosion tester at a 90” impact angle: (a) Stellite-6; (b) Ultimet.
Fig. 9. Scanning electron micrographs of the eroded surface after 100 min exposure in the erosion tester at a 90” impact angle: (a) Armacor-M; (b) 420 SS.

B.F. L,evin et al. I Wear 181-183 (1995) 810-820 819
a ARMACOR-M
90 DEGREES IMPACT ANGLE TEMPERATURE-400 C ALUMINA EFIOOENT
0 PLASTiCALLY DEFORMED
a NO PLASTlC DEFORMATION
0 B-60
STELLITE-6
HIGH Cr IRON 0
0
TS-2 0 IO
HASTELLOY-22
la
lROKAlUMlNlDE 316L SS
0 II
9 IN-625 P
ULTIMET ??s 1 I , I
0 15 30 45 60 75
PLASTIC ZONE SIZE (MICRONS)
Fig. 10. Volume steady state erosion rate of weld overlay coatings as a function of plastic zone size.
9(a) and 9(b). A large amount of surface relief is apparent from these micrographs. Also, no evidence of impact craters or gouging was observed for these coatings. Similar erosion scars were observed for all coatings that did not deform plastically due to particle impact.
The relationship between the plastic zone size and volume erosion rate for all the coatings is shown in Fig. 10. It can be seen that materials that dissipate particle impact energy through plastic deformation (plastic zone) exhibit low erosion rates. These results are in agreement with those reported by Ball [13]. However, those materials that did not deform plastically (no plastic zone) showed both low (420 SS) and high (Armacor-M) erosion rates at 90”. These results indicate that the erosion behavior of these coatings cannot be explained by plastic deformation only. Thus mechanical properties that control erosion behavior are different for ductile and brittle materials. For ductile weld ov- erlays, the ability to deform plastically and therefore dissipate impact energy plays a major role in erosion resistance. It was shown [13] that materials with a
higher strain hardening coefficient exhibited a higher erosion resistance compared with materials with a low strain hardening coefficient. However, for brittle weld overlays, the ability to resist brittle fracture (i.e. cracking) is a major factor that may control the erosion resistance. Therefore materials that exhibit both high toughness and hardness may have good erosion resis- tance. It is clear that measurements of coating me- chanical properties, such as strain hardening and tough- ness, at elevated temperature (400 “C) are necessary to determine their effect on the erosion resistance.
4. Conclusions
On the basis of the results of this investigation the following conclusions can be drawn. (1) The steady state erosion at elevated temperature
(400 “C) at 30” and 90” impact angles for the Ultimet, Inconel-625 and 316L SS coatings was found to be considerably lower than for the weld

B.F. Levin et al. / Wear 181483 (1995) 810-820 820
(2)
(3)
(4)
overlay coatings that exhibit good abrasion resis- tance (Stellite-6, Armacor-M and B-60). The Stellite-6, Ultimet, Inconel-625, iron aluminide, Armacor-M, high chromium iron and 316L SS weld overlay coatings did not show significant differences in their steady state erosion rates between 90” and 30” particle impact angles at elevated temperature (400 “C). Thus the generally accepted angular re- lationship between the erosion of ductile and brittle materials may not be valid for these materials. No correlation was found between the room tem- perature hardness of the weld overlay coatings and their erosion resistance at elevated temperature (400 “C). Therefore the selection of erosion-resistant weld overlay coatings for boiler tubes in CFBs should not be based on their room temperature hardness values. 316L SS, Inconel-625, iron aluminide, Stellited, Hastelloy-22 and Ultimet weld overlays plastically deformed due to erosion, whereas high chromium iron, 420 SS, TS-2, B-60 and Armacor-M did not. Therefore the mechanisms that control erosion behavior are different for these two groups of coatings.
Acknowledgments
This work was made possible by financial support from the US Department of Energy under Grant No. DE-FG22-92PS92542 and Air Products and Chemicals
Inc. The authors wish to thank A. Benscoter, B. Lindsley, K. Stein and B. Smith for technical support and helpful discussions.
References
VI PI
[31 [41
[51
WI
[71 PI
[91 WI PI WI 1131 P41
PI Ml
I171 1181
L. Iammarre, EPBI J., 15 (7) (1990) 31. H. Bems, A. Fisher and W. Theisen, Wear Mater., 2 (1989) 601. M. Tennichi and T. Nakagava, J. JSLE Znt. Ed., 10 (1989) 39. I.M. Hutchings, Monograph on the Erosion of Materials by Solid Particle Impact, Cavendish Laboratory, University of Cambridge, 1983. ASTM E 92 Standard, Annual Book of ASTM Standards, Vol. 03.01, Metals Tests Methods and Analytical fiocedures, ASTM, 1988. ASTM E 384 Standard, Annual Book of ASTM Stamdards, Vol. 03.01, Metals Tests Methods and Analytical Procea&s, ASTM, 1988. D. Ellis and R. Squires, Metal Construction, 15 (7) (1983) 388. M. Smll, R. Devanathan and P. Clayton, Wear, 135 (2) (1990) 355. S.S. Aptecar and T.H. Kosel, Wear Mater., 2 (1985) 671. A. Ninham, Wear Mater., 2 (1987) 813. 1. Finnie, Wear, 6 (1963) 5. I.M. Hutchings, J. Phys. D: Appt. Phys., 25 (1992) A212. A. Ball, Wear, 91 (1983) 201. H. Bems, A. Fisher and W. Theisen, Wear Mater., 2 (1987) 535. A.V. Levy and Hickey, Wear Mater., 2 (1985) 535. I.M. Hutchings, in W.F. Adler (ed.), Erosion: Prevention and Useful Applications, ASTM STP 664, ASTM, 1979, p. 59. I.M. Hutchings and A.V. Levy, Wear, 131 (1989) 105. R. Veerabhadra, S.G. Young and D.H. Bucley, Wear, 85 (1983) 223.