Leveraging ecological diversity to reduce agricultural ... · Leveraging ecological diversity to...
31
Leveraging ecological diversity to reduce agricultural footprints Matt Hegarty, Tina Blackmore, Rob McMahon, Wayne Powell
Transcript of Leveraging ecological diversity to reduce agricultural ... · Leveraging ecological diversity to...
Leveraging ecological diversity to reduce agricultural footprints Matt Hegarty, Tina Blackmore, Rob McMahon, Wayne Powell
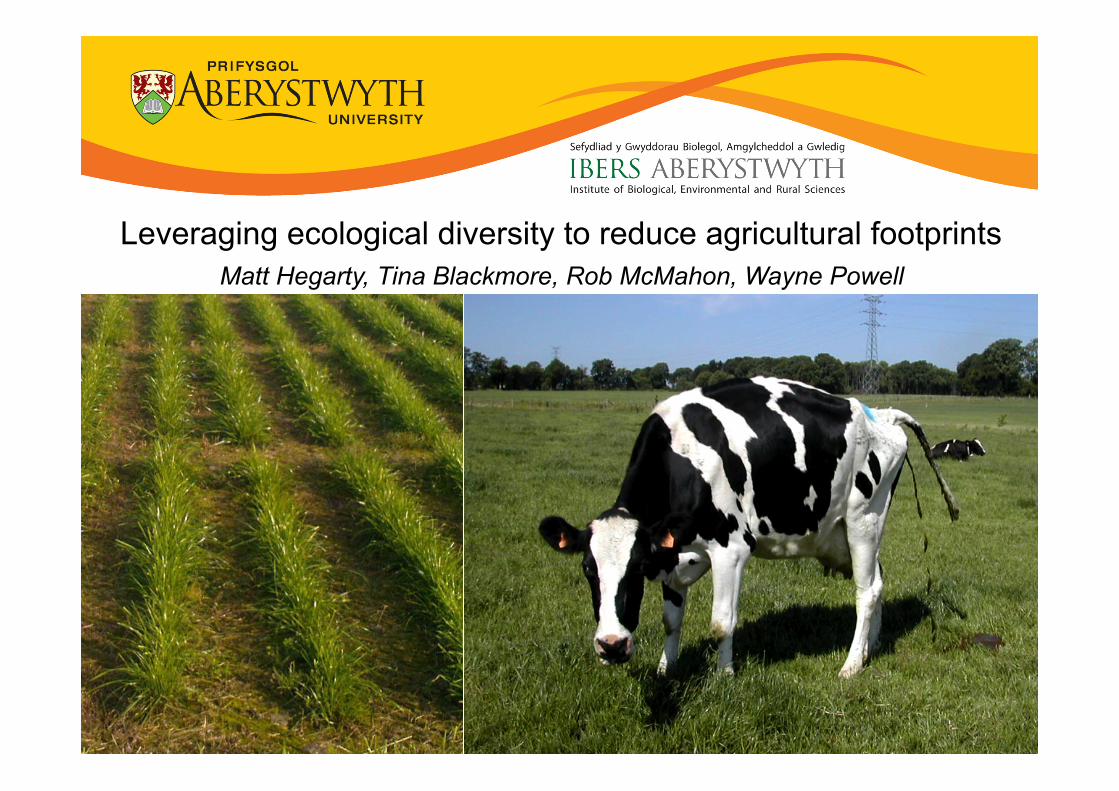
The Challenge of Sustainability “The challenge for global agriculture is to grow more
food on not much more land, using less water, fertiliser and pesticides than we have historically done.” – Sir John Beddington, 2009.
Agriculture needs to meet the demand for food whilst balancing:
– environmental impact – human health requirements – competition for land, water and energy – but also mitigate the effects of climate change

0
1
2
3
4
5
6
7
8
9
10
1950
1955
1960
1965
1970
1975
1980
1985
1990
1995
2000
2005
2010
2015
2020
2025
2030
2035
2040
2045
2050
Po
pu
lati
on
(b
illio
ns
)
OceaniaNorthern AmericaLatin AmericaEuropeAsiaAfrica
World population growth by region
0
1000
2000
3000
4000
5000
6000
7000
19
50
19
60
19
70
19
80
19
90
20
00
20
10
20
20
20
30
20
40
20
50
Po
pu
lati
on
(m
illio
ns)
Urban population
Rural population
Urbanisation
Increases in global population and urbanisation…

The food system is fai l ing on sustainability… Agriculture currently consumes
70% of total global water withdrawals from rivers and aquifers, many of which are overexploited.
Of 11.5 billion ha of vegetated land on earth, around 24% has undergone human induced soil degradation.
Agriculture directly contributes 10-12% of GHG emissions

(Williams et al. 2006)
Estimated emissions intensities for different foods
Livestock’s Long Shadow

Livestock sector has expanded rapidly as demand for meat and dairy continues to grow:
An increase of 68% by 2030 from 2000 base figure has been estimated.
Sector is the world’s largest user of land
resources: - grazing land occupying 26% of land surface - 33% of cropland dedicated to production of feed
Developed countries Developing countries
We feed livestock nearly as much grain as we feed ourselves!

Sources of feed for animal production
Forages from land not able to grow crops
Crop residues
Food and fiber processing by-products
Human - inedible materials:
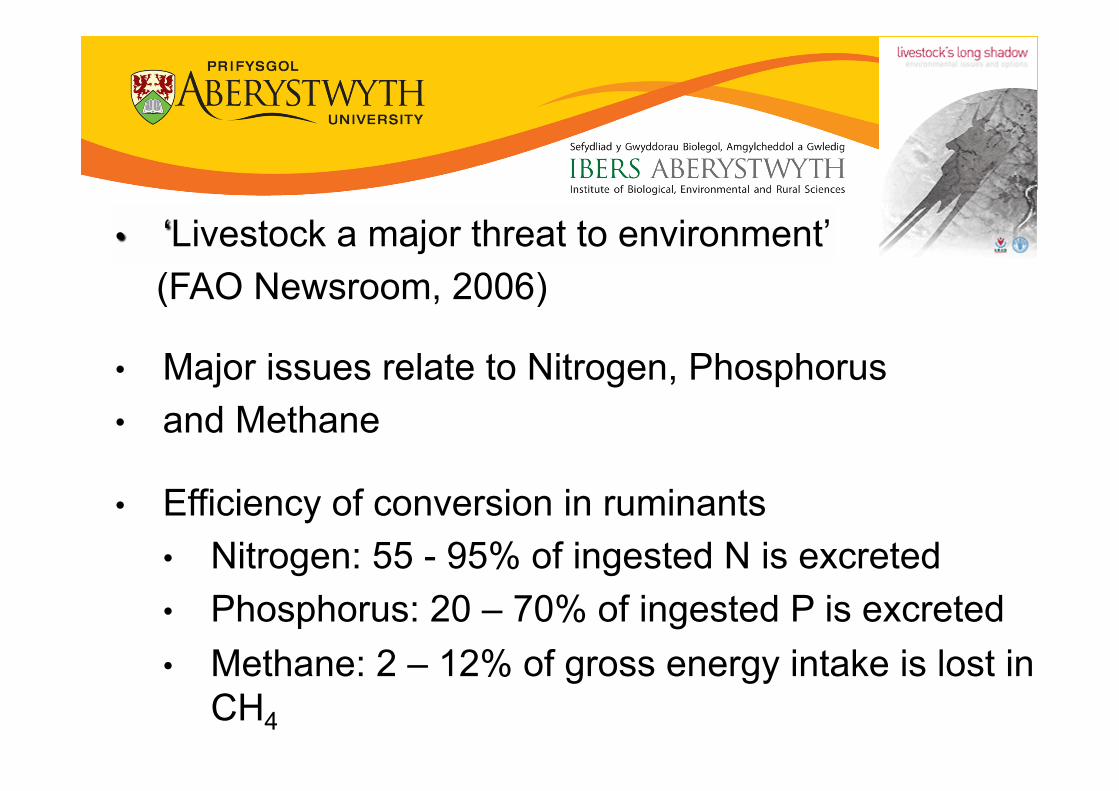
‘Livestock a major threat to environment’ (FAO Newsroom, 2006)
Major issues relate to Nitrogen, Phosphorus and Methane
Efficiency of conversion in ruminants Nitrogen: 55 - 95% of ingested N is excreted Phosphorus: 20 – 70% of ingested P is excreted Methane: 2 – 12% of gross energy intake is lost in
CH4

From our perspective, ruminant digestion is inefficient: 1) Nitrogen, phosphorus and methane lost to the environment contribute to GHG and soil/water pollution. 2) Less of the feed going into meat/milk reduces the productivity of the animal whilst keeping same economic/environmental costs of raising it.

Energy efficiency Feed energy content ∝ digestibility Therefore: ↑ digestibility → ↑ energy 5% increase in grass silage digestibility = extra 1.7L milk/day! (Keady et al 2012)
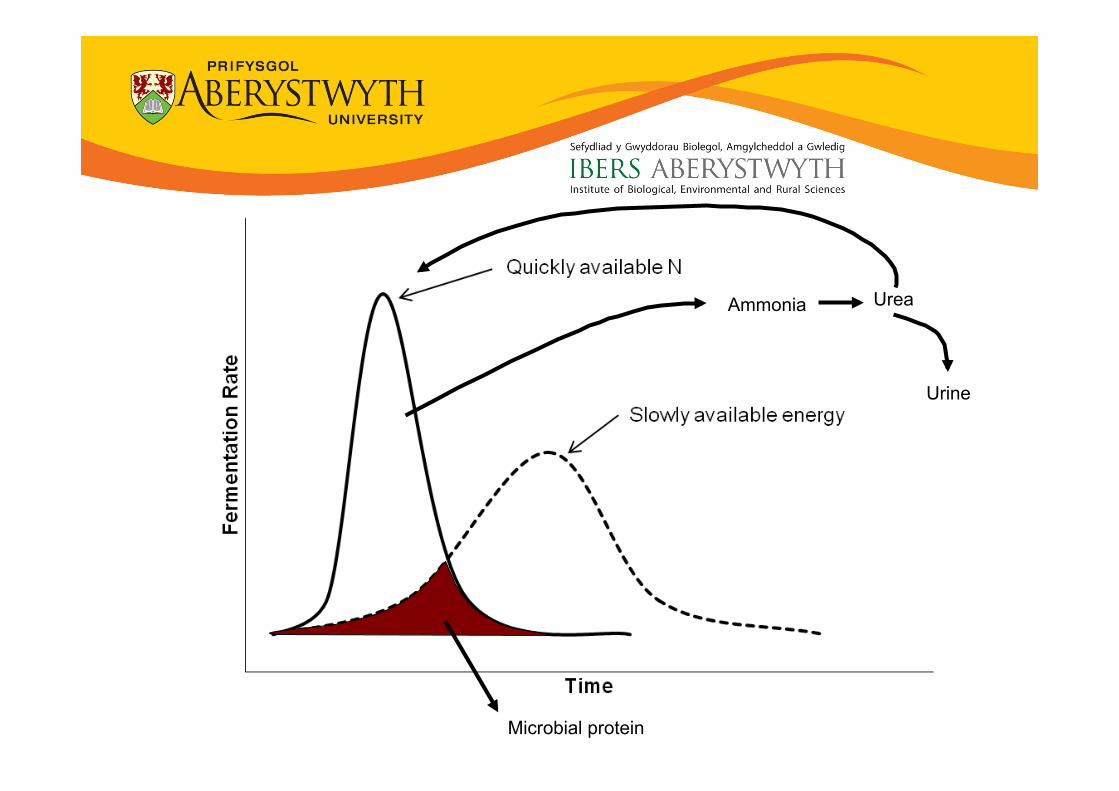
Microbial protein
Ammonia Urea
Urine


Increasing WSC reduces ruminant waste and improves productivity
Increasing the ratio of water-soluble carbohydrate to crude protein in the forage crop perennial ryegrass improves digestibility.
More freely available energy for rumen microbes = better conversion of feed to meat/milk and thus less waste. Aberystwyth have a perennial ryegrass breeding programme
based around production of high sugar grasses (HSG).

Effects of WSC on urine N output
0.000.050.100.150.200.250.300.350.40
100 150 200 250
Grass water soluble carbohydrate concentration (g/kg DM)
Urin
e N
out
/die
t N in
(g/g
)

HSG to reduce methane
-‐10
0
10
20
0
2
4
6
8
10
12
14
16
o C
CH4em
ission (l lamb-‐
1d-‐
1 )
Control HWSC Mean temp
~ 20% reduc�on of emissions per lamb

Progress in breeding for high WSC
Variety Year of DM WSC CP synthesis Yield (g kg-‐1) (g kg-‐1)
AberMagic 2000 122 270 161
AberStar 1997 117 246 171
AberDart 1991 111 232 174
S321 1960 100 210 187
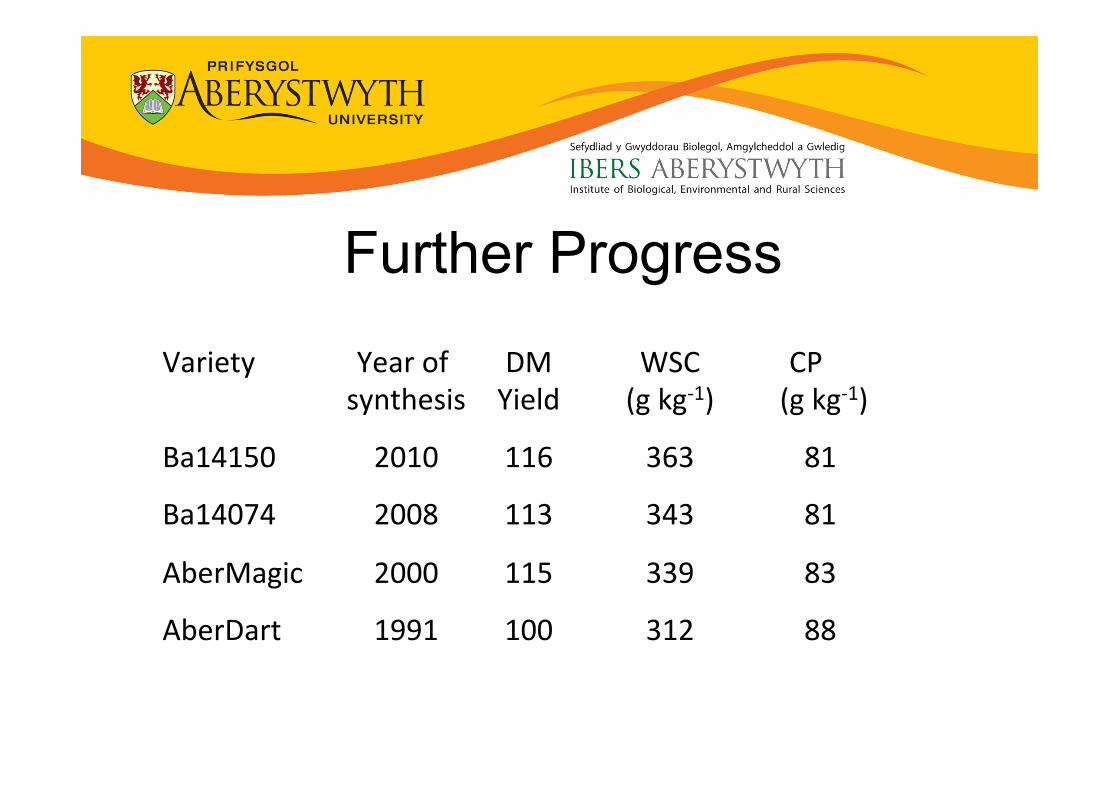
Further Progress
Variety Year of DM WSC CP synthesis Yield (g kg-‐1) (g kg-‐1)
Ba14150 2010 116 363 81
Ba14074 2008 113 343 81
AberMagic 2000 115 339 83
AberDart 1991 100 312 88

Grazed Grass (Nitrogen Input 100%)
Milk Yield (Nitrogen Output)
High WSC 29% ↑ More Milk ↑
Normal WSC 26%
Urine (Wasted Nitrogen) Normal WSC 33% ↓ Lower Emissions ↓
High WSC 25%
Faeces (Wasted Nitrogen) Normal WSC 35% High WSC 35%
Forage Protein
Available Nitrogen
High WSC Normal WSC
Waste Nitrogen
Rumen Efficiency
Photo courtesy of Jon Moorby
Typical Herbage Nitrogen Use
Typically, over 75% of consumed nitrogen is wasted as methane, ammonia, nitrous oxide, urea and nitrates
Great! So where does ecotypic diversity come in? Current breeding programme is based on recurrent selection of germplasm originally derived from just seven founders (two more added later): Three Italian ecotypes Two commercial varieties Ryegrass mosaic virus-resistant genotype
WSC is a complex trait – dozens of genes involved at best. And lots of environmental variation in WSC content but also composition. Also not our only trait of interest – winter hardiness, nutrient use efficiency, lignin content, biomass yield, disease resistance... There might be alleles out there we’ve missed!

The Lolium ecotype diversity panel Draws upon germplasm resources from the IBERS Gene Bank curated
by Ianto Thomas. Represents 92 ecotypes from over 19 countries across Europe.
To account for within-ecotype variation, 8 individuals grown per ecotype.
Ecotypes cover a broad range of longitude, latitude, soil type, altitude, management system, climate... ... also contain both forage and amenity type grasses.
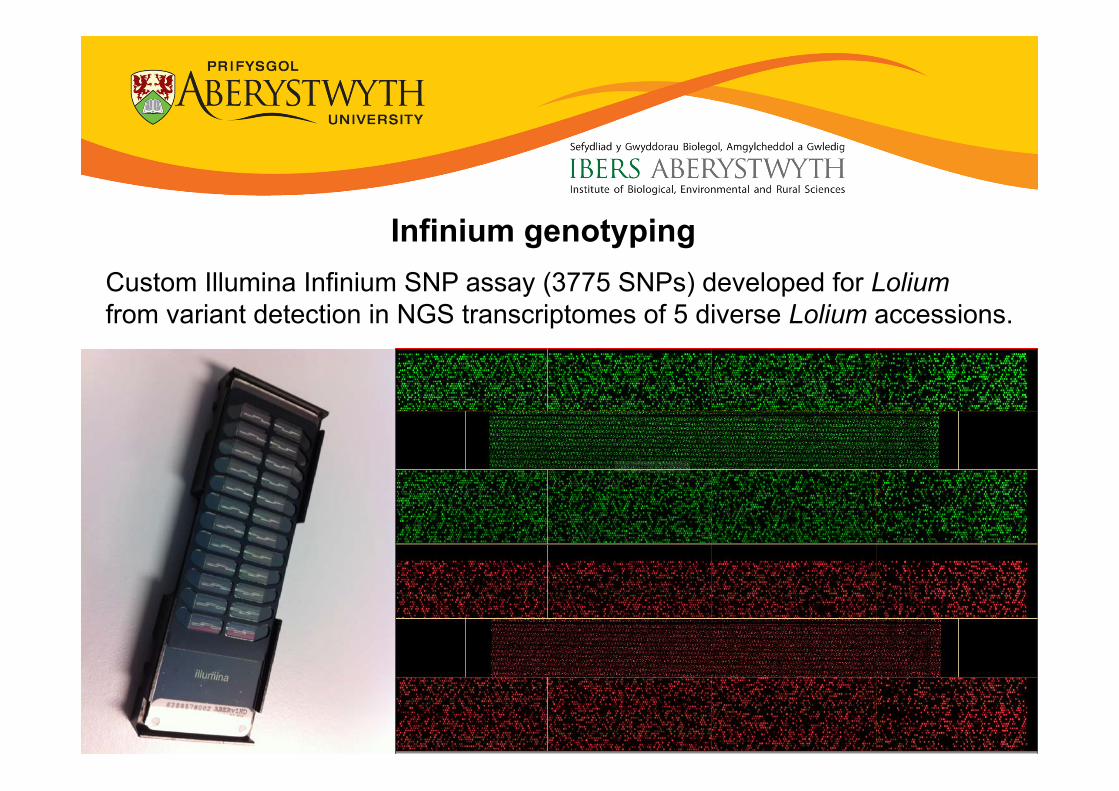
Infinium genotyping Custom Illumina Infinium SNP assay (3775 SNPs) developed for Lolium from variant detection in NGS transcriptomes of 5 diverse Lolium accessions.

Genotyped 8 individuals per ecotype, plus 8 each from 30 commercial varieties for comparison. Conducted principal coordinate analysis (PCA) of ecotype panel...
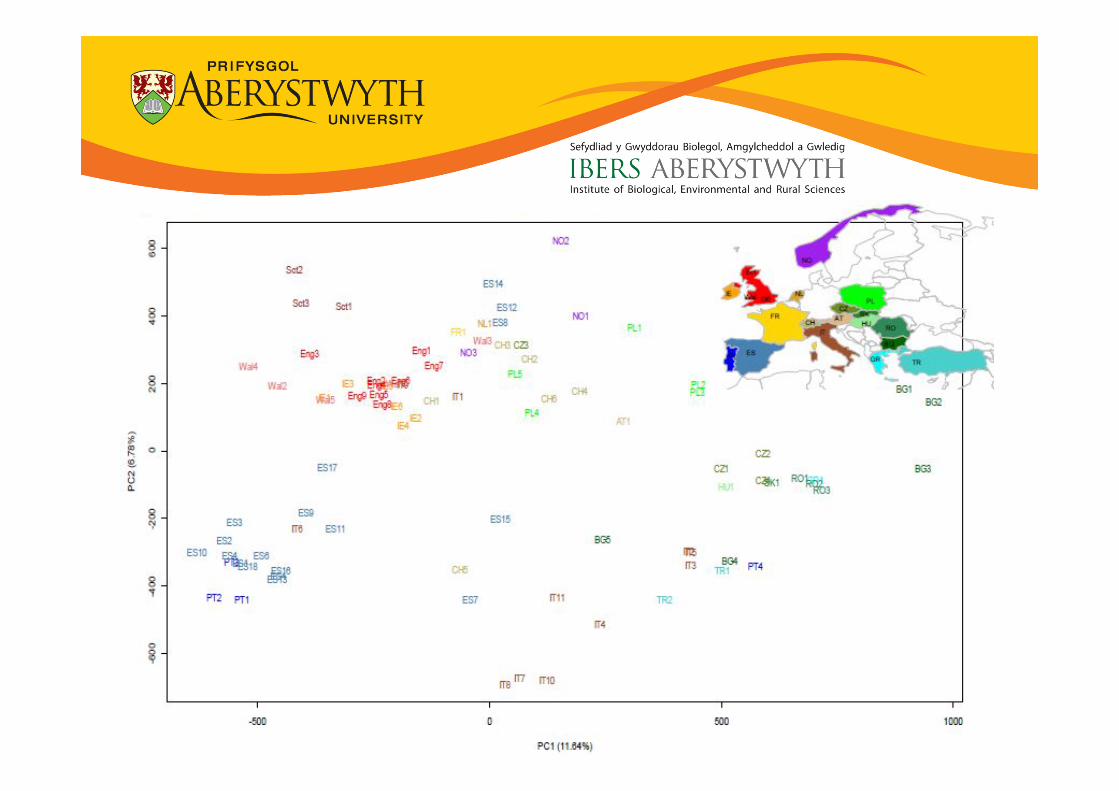

Genotyped 8 individuals per ecotype, plus 8 each from 30 commercial varieties for comparison. Conducted principal coordinate analysis (PCA) of ecotype panel based on
mean allele frequencies...
... samples within ecotypes cluster similarly when plotted individually. Broad range of clustering, two fairly strong PCs for an outbreeding species.
PC1 and 2 appear to correlate with geographical origin...


Geographic patterning should enable us to mine for alleles involved in adaptation to particular environments
– for example, excluding longitude/latitude, there is a significant effect of altitude: could find genes for cold tolerance or UV resistance.
- FIGS approach: if one set of material has the trait you want, maybe others which have evolved in a similar environment will as well?
So what would happen if we compared natural ecotypes to varieties?
Ecogeographic variation


Other ecotypes also cluster with HSG, suggesting we can access natural variation in sugar content to get at genes underpinning this trait – currently looking at individual marker Fst values to identify candidates. Also need to collect more phenotypic data on these accessions using the
IBERS Phenomics Centre and NIRS facilities to enable GWAS.
Can also attempt this for other traits and look at correlations with ecogeographic data for accessions to see if we can predict environments imposing a selective pressure on traits of interest.

High FAT Grass?! Lipids provide twice as much energy and protein per unit as WSC. May also further reduce methane emissions by aiding fermentation. Evidence from GBS of a mapping cross suggests variation for lipid content and composition exists. If could boost the right types of lipid would also benefit human health (linoleic acid) BBSRC LINK grant to screen ecotype collection for lipid makeup.

Acknowledgements
Wayne Powell – IBERS Director
Tina Blackmore – Postdoc
Also at IBERS: Ianto Thomas (Genebank), Rob McMahon (population genetics), John Harper (plant maintenance) and many thanks to Alan Lovatt and Nigel Scollan for supplying some slides/images.