The machinery underlying malaria parasite virulence is conserved ...

Research ArticleLeveraging Deep Learning Techniques for Malaria ParasiteDetection Using Mobile Application
Mehedi Masud,1 Hesham Alhumyani,1 Sultan S. Alshamrani,1 Omar Cheikhrouhou,1
Saleh Ibrahim,2,3 Ghulam Muhammad,4 M. Shamim Hossain ,5
and Mohammad Shorfuzzaman1
1College of Computers and Information Technology, Taif University, Taif 21974, Saudi Arabia2Electrical Engineering Department, Taif University, Saudi Arabia3Computer Engineering Department, Cairo University, Egypt4Department of Computer Engineering, College of Computer and Information Sciences, King Saud University,Riyadh 11543, Saudi Arabia5Department of Software Engineering, College of Computer and Information Sciences, King Saud University, King Saud University,Riyadh 11543, Saudi Arabia
Correspondence should be addressed to M. Shamim Hossain; [email protected]
Received 26 March 2020; Revised 19 May 2020; Accepted 2 June 2020; Published 8 July 2020
Academic Editor: Yin Zhang
Copyright © 2020 Mehedi Masud et al. This is an open access article distributed under the Creative Commons Attribution License,which permits unrestricted use, distribution, and reproduction in any medium, provided the original work is properly cited.
Malaria is a contagious disease that affects millions of lives every year. Traditional diagnosis of malaria in laboratory requires anexperienced person and careful inspection to discriminate healthy and infected red blood cells (RBCs). It is also very time-consuming and may produce inaccurate reports due to human errors. Cognitive computing and deep learning algorithms simulatehuman intelligence to make better human decisions in applications like sentiment analysis, speech recognition, face detection,disease detection, and prediction. Due to the advancement of cognitive computing and machine learning techniques, they are nowwidely used to detect and predict early disease symptoms in healthcare field. With the early prediction results, healthcareprofessionals can provide better decisions for patient diagnosis and treatment. Machine learning algorithms also aid the humans toprocess huge and complex medical datasets and then analyze them into clinical insights. This paper looks for leveraging deeplearning algorithms for detecting a deadly disease, malaria, for mobile healthcare solution of patients building an effective mobilesystem. The objective of this paper is to show how deep learning architecture such as convolutional neural network (CNN) whichcan be useful in real-time malaria detection effectively and accurately from input images and to reduce manual labor with a mobileapplication. To this end, we evaluate the performance of a custom CNN model using a cyclical stochastic gradient descent (SGD)optimizer with an automatic learning rate finder and obtain an accuracy of 97.30% in classifying healthy and infected cell imageswith a high degree of precision and sensitivity. This outcome of the paper will facilitate microscopy diagnosis of malaria to amobile application so that reliability of the treatment and lack of medical expertise can be solved.
1. Introduction
Cognitive computing replicates the way humans solve prob-lems while artificial intelligence and machine learning tech-niques search for creating novel ways for solving problemsthat humans can potentially do better. A substantial amountof research has been done during the last decades usingmachine learning algorithms for cost-effective solutions to
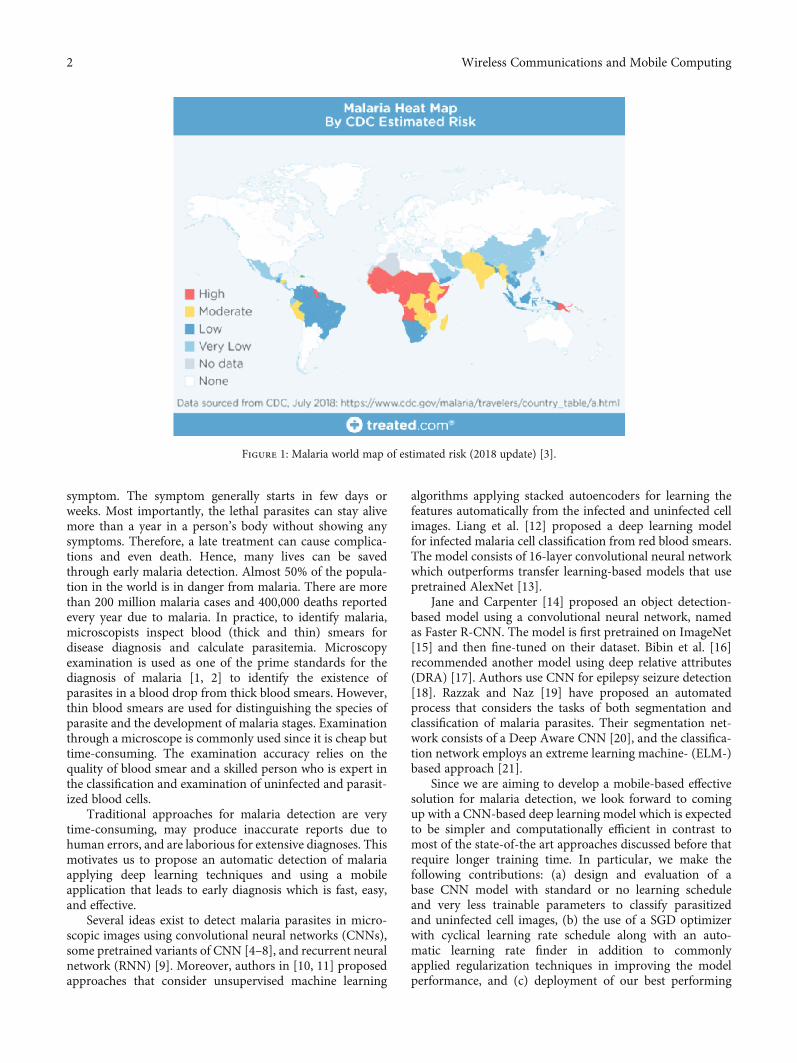
support healthcare professionals in reducing diseases.Malaria disease originated from Plasmodium parasitesthrough mosquito-borne infection. Malaria is very commonover the world mainly in tropical regions. Figure 1 showshow malaria is widely spread across the globe. When infectedfemale Anopheles mosquitoes bite a person, the parasitesenter into the blood and begin damaging red blood cells(RBC) that carry oxygen. Flu virus is the malaria’s first
HindawiWireless Communications and Mobile ComputingVolume 2020, Article ID 8895429, 15 pageshttps://doi.org/10.1155/2020/8895429
symptom. The symptom generally starts in few days orweeks. Most importantly, the lethal parasites can stay alivemore than a year in a person’s body without showing anysymptoms. Therefore, a late treatment can cause complica-tions and even death. Hence, many lives can be savedthrough early malaria detection. Almost 50% of the popula-tion in the world is in danger from malaria. There are morethan 200 million malaria cases and 400,000 deaths reportedevery year due to malaria. In practice, to identify malaria,microscopists inspect blood (thick and thin) smears fordisease diagnosis and calculate parasitemia. Microscopyexamination is used as one of the prime standards for thediagnosis of malaria [1, 2] to identify the existence ofparasites in a blood drop from thick blood smears. However,thin blood smears are used for distinguishing the species ofparasite and the development of malaria stages. Examinationthrough a microscope is commonly used since it is cheap buttime-consuming. The examination accuracy relies on thequality of blood smear and a skilled person who is expert inthe classification and examination of uninfected and parasit-ized blood cells.
Traditional approaches for malaria detection are verytime-consuming, may produce inaccurate reports due tohuman errors, and are laborious for extensive diagnoses. Thismotivates us to propose an automatic detection of malariaapplying deep learning techniques and using a mobileapplication that leads to early diagnosis which is fast, easy,and effective.
Several ideas exist to detect malaria parasites in micro-scopic images using convolutional neural networks (CNNs),some pretrained variants of CNN [4–8], and recurrent neuralnetwork (RNN) [9]. Moreover, authors in [10, 11] proposedapproaches that consider unsupervised machine learning
algorithms applying stacked autoencoders for learning thefeatures automatically from the infected and uninfected cellimages. Liang et al. [12] proposed a deep learning modelfor infected malaria cell classification from red blood smears.The model consists of 16-layer convolutional neural networkwhich outperforms transfer learning-based models that usepretrained AlexNet [13].
Jane and Carpenter [14] proposed an object detection-based model using a convolutional neural network, namedas Faster R-CNN. The model is first pretrained on ImageNet[15] and then fine-tuned on their dataset. Bibin et al. [16]recommended another model using deep relative attributes(DRA) [17]. Authors use CNN for epilepsy seizure detection[18]. Razzak and Naz [19] have proposed an automatedprocess that considers the tasks of both segmentation andclassification of malaria parasites. Their segmentation net-work consists of a Deep Aware CNN [20], and the classifica-tion network employs an extreme learning machine- (ELM-)based approach [21].
Since we are aiming to develop a mobile-based effectivesolution for malaria detection, we look forward to comingup with a CNN-based deep learning model which is expectedto be simpler and computationally efficient in contrast tomost of the state-of-the art approaches discussed before thatrequire longer training time. In particular, we make thefollowing contributions: (a) design and evaluation of abase CNN model with standard or no learning scheduleand very less trainable parameters to classify parasitizedand uninfected cell images, (b) the use of a SGD optimizerwith cyclical learning rate schedule along with an auto-matic learning rate finder in addition to commonlyapplied regularization techniques in improving the modelperformance, and (c) deployment of our best performing
Figure 1: Malaria world map of estimated risk (2018 update) [3].
2 Wireless Communications and Mobile Computing

model to a mobile application to facilitate simpler and fastermalaria detection.
The rest of the paper is organized as follows. RelatedWork reviews the state-of-the-art techniques used in malariaclassification. Materials and Methods provides detaileddescription of our model, its configuration, dataset used,and performance evaluation metrics. Results and Discussionpresents the performance results obtained for our base andimproved models and provides state-of-the-art comparison.Finally, Conclusions concludes the paper and outlines somepotential future work.
2. Related Work
There has been a significant amount of research during thelast decades using computing algorithms for cost-effectivesolutions to support interoperable healthcare [22] in reduc-ing diseases. For instance, Neto et al. [23] proposed a simula-tor for simulating events of epidemiology in real time.Kaewkamnerd et al. [24] proposed an image analysis systemconsisting of five phases for malaria detection and classifica-tion. Anggraini et al. [25] developed an application applyingimage segmentation techniques for separating blood cells’background. Furthermore, Rajaraman et al. [4] implementedfeature extractors using pretrained CNN-based deep learningmodels for uninfected and parasitized blood cell classificationto facilitate disease identification. The research used experi-mental approach to identify the optimal model layers usingthe underlying data. The CNNmodel has two fully connecteddense layers and three convolutional layers. The performanceis measured to extract features using VGG-16, AlexNet,Xception, DenseNet-121, and ResNet-50 from the uninfectedand parasitized blood cells. In contrast to [4], only CNN-based malaria classifiers are also proposed by Gopakumaret al. [26] and Liang et al. [12].
MOMALA [27] is a smartphone and microscope-basedapplication developed to detect malaria quickly at a low cost.The MOMALA app can detect the existence of malaria para-sites on a regular blood-smeared slide. A phone camera isattached to the microscope’s ocular to take the photographsof the blood smear and then analyzes it. At present, theapplication highly depends on microscopes that are heavy,bulky, and not easily transportable.
The researchers in [28] developed a mobile app that takesphotos of blood samples to detect malaria immediately.Using a cell phone app, we can analyze blood sampleswithout involving microscope technicians. The app needsto clamp a smartphone on to a microscope’s eyepiece, andthe application analyzes the images of the blood sample andcreates a red circle on malaria parasites. A lab worker laterreviews the case. Extraction of meaningful features is theheart of success for any machine learning method. Most ofthe computer-used diagnosis tools that use machine learningmodels for image analysis are based on manual-engineeredfeatures for making decision [29–31]. The process also needscomputer vision expertise in order to analyze the variabilityon the images in size, color, background, angle, and positionof interests. Deep learning techniques can be applied withconsiderable success for overcoming the challenges that pre-
vail in a hand-engineered feature extraction process [32].Models in deep learning apply a series of sequential layerswith nonlinear processing hidden units that can find outhierarchical feature relations within the raw image data.The features (low-level) that are abstracted from higher-level features assist in functions of nonlinear decision-making, learning complexity, result in end-to-end extractionof features, and classification [33]. Moreover, deep learningmodels show better performance compared to kernel-basedalgorithms such as Support Vector Machines (SVMs), inlarge volume of data and computational resources, buildingthem to be greatly scalable [34].
A somewhat related pool of work in cognitive computingdomain has presented similar contribution. Zhang et al. [35]proposed a protection mechanism for authentication andaccess control using an interactive robot while controllingprivate data access stored in cloud. In a subsequent effort[36], they introduced a novel paradigm of cognitive IoT usingtechnologies of cognitive computing. A group of researchers[37] also proposed a module, called Mech-RL, for developingan agent-based literature consultant and a new channel of ameta-path learning method. Furthermore, similar to ourbattery-operated mobile-based application for malariadetection that can easily be deployed to edge and IoTdevices, there is a handful of research [38–41] aiming atdeveloping frameworks on mobile edge to deliver variousrelated services such as secure in-home IoT therapy, contentrecommendations [42] [43], and position-based services fornetwork amenities [44].
To summarize, the related work mentioned in the litera-ture largely used different pretrained CNN variants such asAlexNet, VGG-16, ResNet-50, Xception, DenseNet-121,and customized CNN models as well for malaria detectionin blood smear images and obtained relatively better resultsthan using a custom CNN architecture. However, thedownside is that these results are obtained through featureextraction and subsequent training that required long timein some cases [4] a little over 24 hours. In addition, sizeand complexity of these models make them a bit unrealisticto be used with battery-operated mobile devices. In contrast,we built a simpler and computationally efficient CNN modelwith considerably less trainable parameters (discussed inModel Configuration section), yet producing comparable orbetter results keeping in mind our model to be deployed onbattery-operated edge and IoT devices such as a smart mobilephone. Moreover, techniques in the literature mostly use defacto SGD optimizer with various learning rate schedulesincluding the adaptive learning rates which suffer from theproblem of saddle point or local minima. In contrast, we haveused a SGD optimizer with cyclical learning rate schedulealong with an automatic optimal learning rate finder whichresults in faster model convergence with fewer experimentsand hyperparameter updates. Finally, most of the state-of-the-art models use image augmentation to increase modelgeneralizability at the expense of longer training time. Onthe other hand, our model without using data augmentationdemonstrates faster convergence and generalizability tounseen data through proper hyperparameter optimizationsuch as learning rate, regularization through batch
3Wireless Communications and Mobile Computing

normalization, and moderate dropouts in convolutional anddense layers.
Among the studied malaria detection models in the liter-ature, the models proposed in [4, 12, 16, 26] based on customCNN and its pretrained variants seem to be closest to ourmodel. Hence, we performed a state-of-the-art comparisonwith these models to demonstrate the feasibility of usingour model in a mobile-based system especially in remotedisaster survival areas.
3. Materials and Methods
3.1. Deep Learning for Malaria Detection. Deep learningtechniques are now widely used for image classification, videorecognition, and medical image analysis. A convolutionalneural network (CNN), a type of deep neural networks, ismainly considered for research in computer vision field. Thedeep architecture of CNN is its main power. The convolu-tional layer in the CNN works as an automatic feature extrac-tor that extracts hidden and important features. Extractedfeatures are passed to a fully connected neural network whichperforms classification images by maximizing the probabilityscores. A general CNN model is shown in Figure 2.
3.2. Dataset and Computational Resources. We have used apublicly available malaria dataset from NIH (National Insti-tute of Health) website originally used by a group ofresearchers, Rajaraman et al. [4], for the detection of malariaparasites in blood smear images. There are 27,558 segmentedcell images in the dataset with the same number of normal
and parasitized instances. Parasitized cell images containPlasmodium while normal cells are free of Plasmodium butcan contain other staining artifacts and impurities. The datawas collected by Chittagong Medical College Hospital inBangladesh by photographing slides of Giemsa-stained thinblood smear from 200 patients where three-fourth of themwere P. falciparum-infected. The manual annotation anddeidentification of these collected images were performed byan expert at Mahidol-Oxford Tropical Medicine ResearchUnit, Thailand, and later approved and archived by Institu-tional Review Board, National Library of Medicine.
The images in the dataset are not of equal sizes. The min-imum and maximum image resolution is 46 × 46 and 385 ×395 pixels, respectively, with 3 color channels (RGB). Weplan to resize the images to 224 × 224 which is the standardinput image size of the majority of the pretrained CNNmodels for faster model convergence. Figure 3 shows somesample images from both normal and parasitized categories.The infected cells seem to contain some red globularstructures whereas healthy cells do not seem to contain suchstructures in them. The proposed deep learning model will beused to identify these patterns in cell images to effectivelydetect malaria parasites in a patient.
Moreover, we performed data scaling which is a crucialpreprocessing task for training and evaluating deep learningmodels. Data from input images without scaling oftenhampers a steady learning process. Normalization is oneof the most common data scaling techniques which rescalesthe original data points in the images to a range between 0and 1. The values of data points in the original 8-bit RGB
Convolution layers
Low levelfeature
extraction
Reducedset offeatures
Fullyconnectednetworks
Prediction
Figure 2: A general CNN model.
(a) (b)
Figure 3: Sample images from NIH dataset: (a) uninfected and (b) parasitized.
4 Wireless Communications and Mobile Computing

color images range from 0 to 255. Therefore, using Equa-tion (1), we rescale our input image data as follows:
z =x −min xð Þ
max xð Þ −min xð Þ =x255
: ð1Þ
We split the data (as shown in Table 1) into (trainingand validation) sets randomly with the percentage of 80%and 20%, respectively. There are 22,046 images in thetraining set and 5512 images in the validation set havingan equal number of images from both classes.
The proposed CNN model is trained and evaluated usingGoogle Colab [45] which is a cloud-based Jupyter notebookenvironment available for free access. Colab provides a pre-configured system for training and evaluating deep learningapplications and offers access to high-performance graphicalprocessing units (GPUs) without any cost. Presently, it offersa single 16GB NVIDIA Tesla P100 GPU with CUDAenabled, and all the necessary packages are preinstalledwhich includes Python 3 with Keras 2.2.5 API and Tensor-Flow 1.15.0 at the backend. In addition, we have usedAndroid Studio 3.6.1 for developing the android malariadetection app for model deployment.
4. Model Configuration and Evaluation Metrics
4.1. Model Configuration. The proposed CNNmodel has fourconvolutional blocks and two fully connected dense layers.Figure 4 shows the proposed CNN model. Each convolu-tional block consists of convolution, max pooling, batchnormalization, and dropout layers. The first convolutionallayer uses 32 filters of size 7 × 7 to learn larger features, andthen, the filter size decreases by 2 and filter count is doubledin each subsequent convolutional layer except for the lastlayer. The default striding of 1 pixel is used in convolutionoperations in all layers. The model input consists ofsegmented cell images of 224 × 224 × 3-pixel resolution. Inaddition, each convolutional layer uses a valid padding toreduce the output feature map dimension in proportionateto the filter size used. We have used nonlinear activationfunction called ReLU (Rectified Linear Units) in all hiddenlayers to introduce nonlinearity into the output of eachneuron to help the model learn complex mathematical func-tions to better identify target classes. It removes the vanishinggradient problem and aids in faster model training andconvergence [46]. Max pooling layers have a 2 × 2-pixelpooling window and 2-pixel stride, added after convolutionallayers to down sample the feature map by summarizing themost activated existence of a feature. This means that thepooling operation reduces the size of the feature map with afactor of two. To tackle the overfitting problem and to ensuremore stability of the network, we have added a batch normal-
ization layer to be applied to pooled output. Normalizationis applied on the previous activation layer by subtractingthe batch mean and then dividing by standard deviationof the batch [47]. The dropout regularization (with adropout ratio of 0.15) used in each convolutional blockreduces overfitting and improves network generalizationerror by randomly dropping out nodes during modeltraining [34]. A global average pooling (GAP) layer isconsidered right after the last block of convolution as abetter replacement of flattening to reduce overfitting byminimizing the size of model parameters. The GAP layerreduces spatial dimensions of a 3-dimensional tensor havingsize h ×w × d to 1 × 1 × d tensor by simply taking theaverage of all hw pixel values of each h ×w feature map tosingle number [48]. The output from the GAP layer followedby a dropout is passed to the first (fully connected) denselayer having 1000 neurons. The first dense layer output isthen fed to a dropout and then passed to the second denselayer with two neurons and a Softmax classifier. Overall,our proposed CNN model has relatively smaller size(409K) of trainable parameters compared to most of thepretrained transfer learning models used in the literature[4] for malaria detection or solving similar computer visionproblems. This simplicity of network structure will be thefirst step while dealing with overfitting problem.
We consider a stochastic gradient descent (SGD) opti-mizer with momentum for training and optimizing the modelin order to minimize binary cross-entropic loss also known aslog-loss. We have optimized our custom model by tuning thelearning rate. Learning rate is one of the most dominatinghyperparameters in a neural network configuration. We usedan automatic optimal learning rate finder in combination withcyclical learning rate (CLR) technique first introduced bySmith [49] which allows the learning rate to oscillate cyclicallybetween a minimum and a maximum learning rate bound.The use of CLR results in faster model convergence with fewerexperiments and hyperparameter updates.
4.2. Cyclical Learning Rates. The widely used learning rateschedule technique monotonically decreases learning rateafter each epoch to allow the model to descend to a point oflow loss. However, with this technique, the model will stillbe sensitive to initial choice of learning rate and thetechnique does not guarantee that it will land to a low lossarea while decreasing the learning rate. Rather, the modelmay be confined to either saddle points or local minima. Tobetter address these problems, cyclical learning rates (CLR)enable oscillation of learning rates between upper and lowerbounds which in turn provide additional freedom inchoosing initial learning rate and get rid of saddle pointsand local minima. There are three variations of the CLRbased on how the oscillation of learning rate takes place:triangular, triangular2, and exp_range. The triangular policyworks by starting off from a base learning rate and increasingthe rate to a maximum value in half cycle and then decreasingback to the initial rate thus completing the full cycle. Thiswhole process is repeated until the model training is finished.The triangular2 also called triangular schedule with fixeddecay is similar to the previous one except that it cuts the
Table 1: Training and validation data sets.
SetCount
PercentParasitized Normal
Training 11023 11023 80%
Validation 2756 2756 20%
5Wireless Communications and Mobile Computing

upper bound of learning rate to half after every cycle. Thislowering of maximum learning rate over time results inincreased stability of model training. Finally, exp_rangepolicy also called triangular schedule with exponential decayuses an exponential decay as the name suggests to cut downthe upper bound which gives more fine-tuned control indecreasing the max learning rate over time. We have usedBrad Kenstler’s implementation of CLR using Keras for ourmodel training [50].
4.3. Automatic Learning Rate Finder. Since CLR works basedon a lower and upper bound of learning rate, Smith [49] alsoprovides an automatic learning rate finder algorithm to findoptimal learning rates. Various steps for obtaining the mini-mum and maximum values of learning rates in Figure 5. Formodel training, a very small (1e − 10) value and a very large(1e + 1) value for lower and upper bounds of learning ratesare set by the algorithm. An exponential increase of learningrate after every batch update is adopted as training pro-gresses, and at the same time, loss is also recorded. Whenthe learning rate reaches the upper bound after a specific
number of training epochs, we plot a curve showing lossand learning rate. At this point, we identify two differentvalues for learning rates. The loss starts decreasing after thefirst learning rate, and the loss starts to increase from thesecond value of learning rate. These two values refer to thelower and upper bounds of learning rate which are used inCLR technique. Figure 6 demonstrates how the loss changeswith respect to various learning rates using this automaticlearning rate finder. It is apparent from the plot that loss doesnot change until the learning rate hits approximately 1e − 6.This indicates that our model does not start learning owingto a very low initial learning rate. Loss starts to decrease soonafter the learning rate reaches approximately 1e − 5 whichimplies that the learning rate is large enough to enable themodel to start learning. From this point, the loss keepsdecreasing sharply implying that the model is learningquickly. Soon after the learning rate reaches to approximately1e − 1, the loss starts to increase again. As such, the loss hasexploded almost immediately due to the large increase inlearning rate (close to 1e + 1). Hence, we select 1e − 5 and 1e − 1 as our minimum and maximum learning rates, respec-tively, which will be used in the CLR technique for our modeltraining. Finally, our model configurations including hyper-parameters are summarized in Table 2.
4.4. Evaluation Metrics. We have used accuracy, precision,recall, F1-score, specificity, Matthews correlation coefficient(MCC), and Area Under Curve (AUC) to evaluate the perfor-mance of our models. Since in our dataset the number ofsamples from each target class is equal, we consider accuracyas our primary metric. Accuracy refers to the proportion ofcorrect predictions over all predictions made by the model.In addition, we calculated precision, recall or sensitivity,specificity, and F1-score from the confusion matrix whichcontains False Positives (FP), True Positives (TP), False
Input image224×224×3
Convolution 132 Filter (7×7)
Convolution 264 Filter (5×5)
Convolution 3128 filter (3×3)
Convolution 4128 Filter (3×3)
Activationfunction Relu
Activationfunction Relu
Activationfunction Relu
Activationfunction Relu
Activationfunction Relu
Activationfunction Relu
Max pooling2×2
Max pooling2×2
Max pooling2×2
Max pooling2×2
Batchnormalization ()
Batchnormalization ()
Batchnormalization ()
Batchnormalization ()
Dropout(0.15)
Dropout(0.15)
Dropout(0.15)
Dropout(0.15)
Dropout(0.15)
Dropout(0.15)
Global averagepooling ()
Classifier ()
Full connected 1NM (1000)
Full connected 2NM (2)
Figure 4: The custom CNN model.
Step 1: set a very small(1e–10) lower bound
and a very large (1e+1)upper bound.
Step 4: identify optimallearing rates from theplot showing loss vs
learing rate
Step 3: coninue modeltraining till the max valueof learning rate (Typically
3–5 epochs)
Step 2: start training andincrease learing rate
exponenatially after everybatch update and keep
track of loss.
Figure 5: Steps to find optimal learning rates automatically.
6 Wireless Communications and Mobile Computing

Negatives (FN), and True Negatives (TN). Furthermore,precision and recall for each target class are calculated froma classification report. Precision measures the proportion ofpatients that are identified as infected really carry malariaparasites. Recall or sensitivity measures of the proportion ofpatients that are infected are diagnosed by the model ashaving malaria parasites. Specificity is the opposite of recallwhich measures the proportion of patients that are notinfected and diagnosed by the model as not carrying anymalaria parasites. F1-score is calculated as a single metricfrom the harmonic mean of precision and recall. MCC iscomputed from all four values of confusion matrix andrepresents the correlation coefficient between the true andpredicted classes [51]. The higher the coefficient value, thebetter is the prediction. Equation (2) is used to calculateMCC for a binary classification problem. When all thepredictions of the classifier are correct (i.e., FP = FN = 0),MCC becomes 1 implying the perfect positive correlation.On the contrary, if the predictions are always incorrect (i.e.,TP = TN = 0), MCC becomes -1.
MCC = TP × TN − FP × FNffiffiffiffiffiffiffiffiffiffiffiffiffiffiffiffiffiffiffiffiffiffiffiffiffiffiffiffiffiffiffiffiffiffiffiffiffiffiffiffiffiffiffiffiffiffiffiffiffiffiffiffiffiffiffiffiffiffiffiffiffiffiffiffiffiffiffiffiffiffiffiffiffiffiffiffiffiffiffiffiffi
TP + FPð Þ TP + FNð Þ TN + FPð Þ TN + FNð Þp: ð2Þ
We have used binary cross entropy or log-loss, and thetarget is to minimize it which is equivalent to maximize theclassification accuracy. The log-loss function is expressedwith the following equation:
Loss = 1N〠N
i=1yi:log p yið Þð Þ + 1 − yið Þ:log 1 − p yið Þð Þ, ð3Þ
where y represents the target class (0 for normal cell imagesand 1 for parasitized cell images) and pðyÞ is the probabilityof prediction of the sample being parasitized for allN images.For each parasitized image (y = 1), log ðpðyÞÞ is added to theloss that is the log probability of its being parasitized. On thecontrary, log ð1 − pðyÞÞ is added to the loss implying that thelog probability of its being normal for each uninfected image(y = 0).
5. Results and Discussion
We have adopted the following approach in order to assessthe performance of the proposed CNNmodel for the classifi-cation of uninfected and parasitized cell images. We tooklearning rate as one of the key hyperparameters to tune ourcustom CNNmodel for optimum classification performance.The learning rate hyperparameter is used to control the speedof learning of a deep learning model. Using a rightlyconstructed learning rate, a model can learn to best mapinput to desired output with the available resources (i.e., thenumber of nodes in each layer and the total number of layers)with the number of epochs passing in the training data. TheSGD algorithm has long been the de facto optimizer to traindeep neural networks. Moreover, some of its extensionsbased on adaptive learning rates have been popular for quitesome time now such as Adam, RMSProp, and Adagrad.However, lately, the concept of cyclical learning rates
1.0
0.9
0.8
0.7
0.6
0.5
0.4
0.3
Loss
10–9 10–7 10–5 10–3 10–1
Learning rate (log scale)
Loss starts todecrease at learning
rate, 1e-5
Loss starts to increaseslowly at learning rate, 1e-1
Figure 6: Model loss for various learning rates to identify optimal lower and upper bounds on learning rate.
Table 2: Model configuration summary includinghyperparameters.
Parameter Value/type
Epochs 50
Batch size 32
Optimizer SGD with momentum 0.9
Learning rates Min 1e − 5, max 1e − 1Loss function Categorical cross entropy
Input shape 224 × 224
PoolingMax 2 × 2 (convolutional layers),GlobalAverage (flatten layer)
ActivationReLU (convolutional layers),Softmax (final dense layer)
Dropout rate 0.15
Trainable parameters 409,146
7Wireless Communications and Mobile Computing

(CLR), originally proposed by Smith [49], attractedresearchers’ attention in improving deep learning modelperformance. In this paper, we looked at how SGD with thiscyclical learning schedule holds up to the other optimizers.To this end, we built a baseline model with standard SGDand then gradually tried to improve the model’s performancewith CLR technique applied to SGD.
5.1. Base Model. As mentioned in the previous section, ourbase model represents the custom model as described beforewith a standard SGD optimizer. We have considered SGDwith 0.9 momentum, 1e − 1 as an initial learning rate, andstandard decay of initial_learning_rate/no_of_epochs. Wesaved the best model weights (i.e., the lowest validation loss)during training by using Keras’s ModelCheckpoint libraryand callback function. We trained the model for 50 epochs.Resulted training and validation loss are shown in Figure 7as well as accuracy over the number of epochs.
We can see that our base model does not converge welland a significant difference between the training and valida-
tion results both for loss and accuracy. In addition, a lot offluctuation is observed in the values of loss and accuracy asthe training progresses towards the end. This indicates thatour base model is not trained well and might be overfittingto training data. Consequently, the model might not general-ize well on unseen test data. This could be potentially attrib-uted to the choice of learning schedule in the base model eventhough we have used dropout and batch normalizationtechniques to avoid overfitting. We aim to overcome thesedrawbacks by using CLR schedule with the SGD optimizer.
Performance metrics of our base model is shown inTable 3. We have received a base accuracy of 96.46% withhigh precision and recall towards classifying the infected
0.98
0.96
0.94
0.92
0.90
0.88
Accu
racy
0 10 20 30 40 50Epoch
Model accuracy
0.05
0.04
0.03
0.02
0.01
Loss
0 10 20 30 40 50Epoch
Model loss
TrainVal
Figure 7: Loss (training and validation) and accuracy of the base model.
Table 3: Performance metrics for the base model.
Acc AUC Precision Recall F1-score MCC
0.9646 0.9552 0.97 0.96 0.96 0.9135
8 Wireless Communications and Mobile Computing

and normal cells which is reasonable. By investigating theconfusion matrix as shown in Figure 8, we can see that thecount for False Negatives (FN) is 150 which is pretty highfor a disease identification problem. FN indicates that themodel declares a malaria patient to be healthy whereas thepatient is parasitized. This will severely hamper the patienttreatment and may result in death. Our goal is to reduce thisnumber with the proposed improved model. A reducednumber of FN will ensure that our model is effective inidentifying parasitized cell images.
5.2. Improved Model with CLR. In our improved model, weused the same base model architecture with the exceptionthat we used cyclical learning rates schedule instead of a
standard one. As mentioned before, there are three variationsof CLR implementation based on the policy of changing theupper bound learning rate, namely, triangular, triangular2,and exp_range. We have experimented with the first twovariants to observe the model performance. Figure 9 showsthe learning rate plot and how the learning rates oscillatebetween the lower and upper bounds.
More specifically, the initial learning rate of 1e − 5increases to the maximum value of 1e − 1 in a half cycleand then decreases back to 1e − 5 in the other half cycle thuscompleting the full cycle. By using this triangular policy, wehave obtained improved model accuracy of 97.12% as shownin Table 4 (compared to 95.25% in base model) with higherprecision and recall towards classifying the infected and
2500
2000
1500
1000
500
45
150
2,746
2,571
Confusion matrix
Uninfected
Uninfected
Parasitized
Parasitized
True
labl
e
Predicted labelAccuracy = 0.9646 Misclass = 0.0354
Figure 8: Confusion matrix for the base model.
0.10
0.08
0.06
0.04
0.02
0.00
Lear
ning
rate
0 5000 10000 15000 20000 25000 30000 35000Training iterations
Cyclical learning rate (CLR)
Figure 9: Cyclical learning rate changes using “triangular” policy. Lower and upper bounds on learning rates were calculated using anautomatic learning rate finder.
9Wireless Communications and Mobile Computing
normal cells. Thus, by combining cyclical learning rates withthe automatic learning rate finder (discussed earlier), we aresuccessful in obtaining a highly accuracy model.
By looking at the training history (plotted in Figure 10),we found that the gap between training and validation lossas well as accuracy reduces significantly indicating a fasterand better model convergence. In addition, we observed a“wave” characteristic of our training and validation accura-cy/loss curve signifying the fact that the learning rateoscillates between lower and upper bounds.
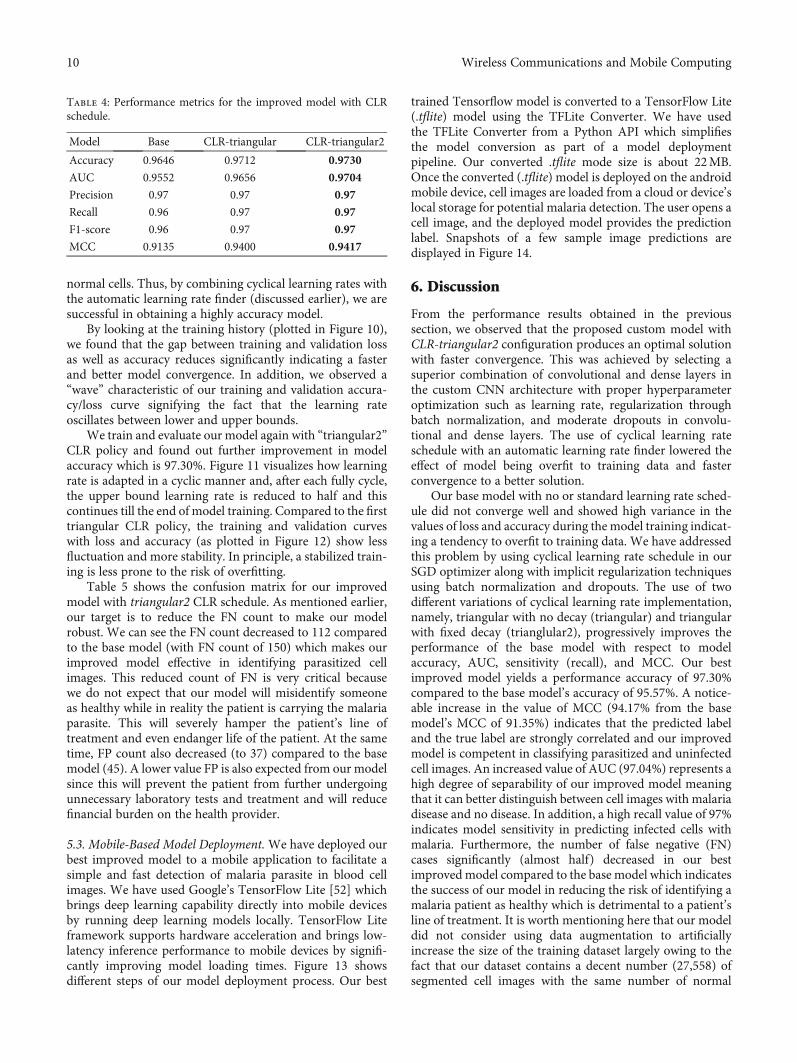
We train and evaluate our model again with “triangular2”CLR policy and found out further improvement in modelaccuracy which is 97.30%. Figure 11 visualizes how learningrate is adapted in a cyclic manner and, after each fully cycle,the upper bound learning rate is reduced to half and thiscontinues till the end of model training. Compared to the firsttriangular CLR policy, the training and validation curveswith loss and accuracy (as plotted in Figure 12) show lessfluctuation and more stability. In principle, a stabilized train-ing is less prone to the risk of overfitting.
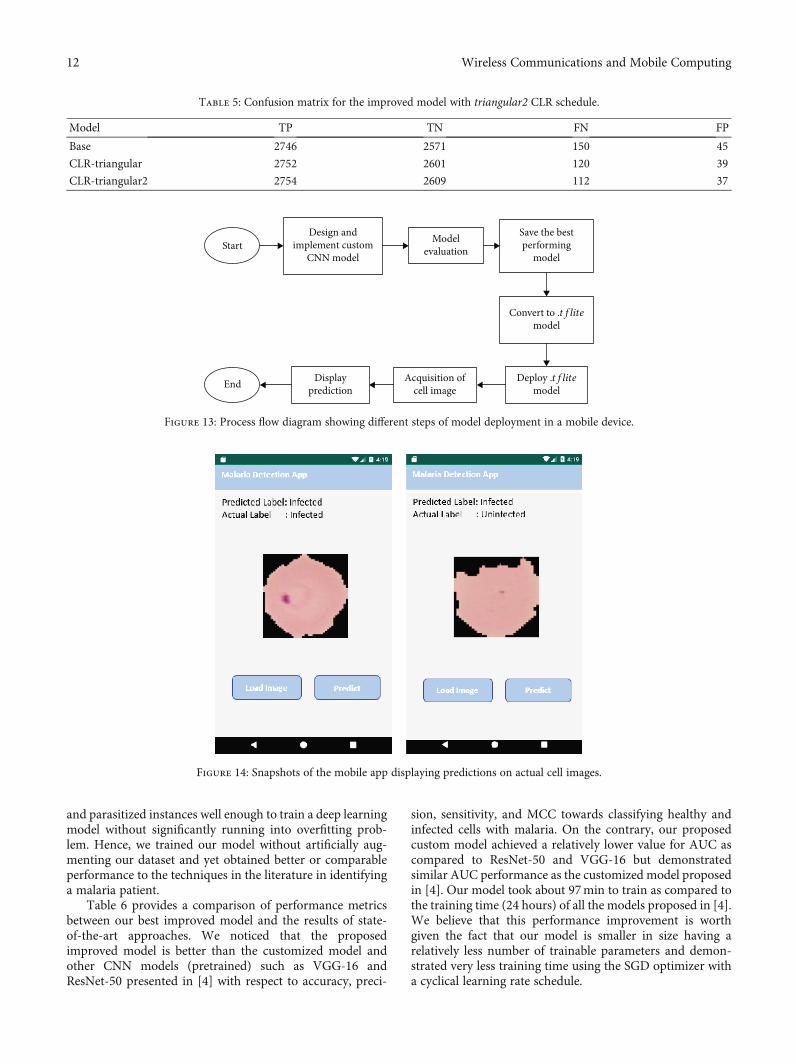
Table 5 shows the confusion matrix for our improvedmodel with triangular2 CLR schedule. As mentioned earlier,our target is to reduce the FN count to make our modelrobust. We can see the FN count decreased to 112 comparedto the base model (with FN count of 150) which makes ourimproved model effective in identifying parasitized cellimages. This reduced count of FN is very critical becausewe do not expect that our model will misidentify someoneas healthy while in reality the patient is carrying the malariaparasite. This will severely hamper the patient’s line oftreatment and even endanger life of the patient. At the sametime, FP count also decreased (to 37) compared to the basemodel (45). A lower value FP is also expected from our modelsince this will prevent the patient from further undergoingunnecessary laboratory tests and treatment and will reducefinancial burden on the health provider.
5.3. Mobile-Based Model Deployment.We have deployed ourbest improved model to a mobile application to facilitate asimple and fast detection of malaria parasite in blood cellimages. We have used Google’s TensorFlow Lite [52] whichbrings deep learning capability directly into mobile devicesby running deep learning models locally. TensorFlow Liteframework supports hardware acceleration and brings low-latency inference performance to mobile devices by signifi-cantly improving model loading times. Figure 13 showsdifferent steps of our model deployment process. Our best
trained Tensorflow model is converted to a TensorFlow Lite(.tflite) model using the TFLite Converter. We have usedthe TFLite Converter from a Python API which simplifiesthe model conversion as part of a model deploymentpipeline. Our converted .tflite mode size is about 22MB.Once the converted (.tflite) model is deployed on the androidmobile device, cell images are loaded from a cloud or device’slocal storage for potential malaria detection. The user opens acell image, and the deployed model provides the predictionlabel. Snapshots of a few sample image predictions aredisplayed in Figure 14.
6. Discussion
From the performance results obtained in the previoussection, we observed that the proposed custom model withCLR-triangular2 configuration produces an optimal solutionwith faster convergence. This was achieved by selecting asuperior combination of convolutional and dense layers inthe custom CNN architecture with proper hyperparameteroptimization such as learning rate, regularization throughbatch normalization, and moderate dropouts in convolu-tional and dense layers. The use of cyclical learning rateschedule with an automatic learning rate finder lowered theeffect of model being overfit to training data and fasterconvergence to a better solution.
Our base model with no or standard learning rate sched-ule did not converge well and showed high variance in thevalues of loss and accuracy during the model training indicat-ing a tendency to overfit to training data. We have addressedthis problem by using cyclical learning rate schedule in ourSGD optimizer along with implicit regularization techniquesusing batch normalization and dropouts. The use of twodifferent variations of cyclical learning rate implementation,namely, triangular with no decay (triangular) and triangularwith fixed decay (trianglular2), progressively improves theperformance of the base model with respect to modelaccuracy, AUC, sensitivity (recall), and MCC. Our bestimproved model yields a performance accuracy of 97.30%compared to the base model’s accuracy of 95.57%. A notice-able increase in the value of MCC (94.17% from the basemodel’s MCC of 91.35%) indicates that the predicted labeland the true label are strongly correlated and our improvedmodel is competent in classifying parasitized and uninfectedcell images. An increased value of AUC (97.04%) represents ahigh degree of separability of our improved model meaningthat it can better distinguish between cell images with malariadisease and no disease. In addition, a high recall value of 97%indicates model sensitivity in predicting infected cells withmalaria. Furthermore, the number of false negative (FN)cases significantly (almost half) decreased in our bestimproved model compared to the base model which indicatesthe success of our model in reducing the risk of identifying amalaria patient as healthy which is detrimental to a patient’sline of treatment. It is worth mentioning here that our modeldid not consider using data augmentation to artificiallyincrease the size of the training dataset largely owing to thefact that our dataset contains a decent number (27,558) ofsegmented cell images with the same number of normal
Table 4: Performance metrics for the improved model with CLRschedule.
Model Base CLR-triangular CLR-triangular2
Accuracy 0.9646 0.9712 0.9730
AUC 0.9552 0.9656 0.9704
Precision 0.97 0.97 0.97
Recall 0.96 0.97 0.97
F1-score 0.96 0.97 0.97
MCC 0.9135 0.9400 0.9417
10 Wireless Communications and Mobile Computing

0.975
0.950
0.925
0.900
0.875
0.850
0.825
0.800
Accu
racy
Model accuracy
0 10 20 30 40 50Epoch
TrainTest
0.6
0.5
0.4
0.3
0.2
0.1
Loss
Model loss
0 10 20 30 40 50Epoch
Figure 10: Training and validation loss and accuracy with triangular CLR policy.
0.10
0.08
0.06
0.04
0.02
0.00
Lear
ning
rate
0 5000 10000 15000 20000 25000 30000 35000Training iterations
Cyclical learning rate (CLR)
Figure 11: Cyclical learning rate changes using “triangular2” policy.
1.000
0.975
0.950
0.925
0.900
0.875
0.850
0.825
0.800
Acc
urac
y
Model accuracy
0 10 20 30 40 50Epoch
TrainTest
0.8
0.7
0.6
0.5
0.4
0.3
0.2
0.1
0.0
Loss
Model loss
0 10 20 30 40 50Epoch
Figure 12: Training and validation loss and accuracy with triangular2 CLR policy.
11Wireless Communications and Mobile Computing
and parasitized instances well enough to train a deep learningmodel without significantly running into overfitting prob-lem. Hence, we trained our model without artificially aug-menting our dataset and yet obtained better or comparableperformance to the techniques in the literature in identifyinga malaria patient.
Table 6 provides a comparison of performance metricsbetween our best improved model and the results of state-of-the-art approaches. We noticed that the proposedimproved model is better than the customized model andother CNN models (pretrained) such as VGG-16 andResNet-50 presented in [4] with respect to accuracy, preci-
sion, sensitivity, and MCC towards classifying healthy andinfected cells with malaria. On the contrary, our proposedcustom model achieved a relatively lower value for AUC ascompared to ResNet-50 and VGG-16 but demonstratedsimilar AUC performance as the customized model proposedin [4]. Our model took about 97min to train as compared tothe training time (24 hours) of all the models proposed in [4].We believe that this performance improvement is worthgiven the fact that our model is smaller in size having arelatively less number of trainable parameters and demon-strated very less training time using the SGD optimizer witha cyclical learning rate schedule.
Table 5: Confusion matrix for the improved model with triangular2 CLR schedule.
Model TP TN FN FP
Base 2746 2571 150 45
CLR-triangular 2752 2601 120 39
CLR-triangular2 2754 2609 112 37
StartDesign and
implement customCNN model
Modelevaluation
Save the bestperforming
model
Convert to .tflitemodel
Deploy .tflitemodel
Acquisition ofcell image
DisplaypredictionEnd
Figure 13: Process flow diagram showing different steps of model deployment in a mobile device.
Figure 14: Snapshots of the mobile app displaying predictions on actual cell images.
12 Wireless Communications and Mobile Computing

In contrast to the pretrained models presented in [4], theCNN-based classifier proposed by Gopakumar et al. [26]demonstrated slightly better results in classifying parasitizedand uninfected cells in terms of accuracy (97.70%), precision(98.5%), and recall (97.1%) but showed a very low MCC(73.1%) value which is considered a very informative consol-idated score for evaluating a binary classifier’s performancerepresenting the correlation between the predicted and trueclasses [51]. Liang et al. [12] have also proposed a techniquefor image analysis using a CNN for malaria detection. Theyhave achieved similar accuracy (97.3%) as our improvedmodel with a slight increase in precision (97.7%) and slightlydegraded sensitivity (96.9%) as compared to our improvedmodel. Finally, malaria parasite detection using a deep beliefnetwork done by Bibin et al. [16] did not demonstratepromising results as compared to other studies in the litera-ture including our improved model. Based on the precedingdiscussion, our model is greatly specific with a large MCCvalue and performs pretty better than the majority of thepretrained and custom CNN models under study.
7. Conclusions and Future Work
The paper first evaluated a custom CNN-based end-to-enddeep learning model to improve malaria detection on thin-blood smear images. We showed that the use of cyclicallearning rate schedule with an automatic learning rate finderin addition to the use of a commonly applied regularizationtechnique such as batch normalization and dropoutsproduces promising results in malaria classification. Our bestmodel achieves an accuracy of 97.30% in classifying parasit-ized and uninfected cell images with a high degree of preci-sion and sensitivity. The model also yields a high value ofMCC (94.17%) compared to all other existing models understudy indicating a strong correlation between predicted andtrue labels. We also observed that the proposed improvedmodel showed better performance compared to the custom-ized and other CNNmodels (pretrained such as VGG-16 andResNet-50) [4] with respect to accuracy, precision, sensitiv-ity, and MCC towards classifying healthy and infected cellswith malaria. We deployed our best performing model intoan android-based mobile application to facilitate simplerand faster malaria detection. Thus, we believe that the resultsobtained from this work will benefit towards developing
valuable mobile-based solutions so that reliability of thetreatment and lack of medical expertise can be solved. Asan immediate extension of this work, we will consider usingimage augmentation on the training data with the hope tofurther alleviate overfitting problem and different adaptivevariants of the SGD optimizer to observe their impact onthe performance results. In the future, we also plan to achievebetter prediction by using ensemble methods through modelstacking.
Data Availability
Data set is collected from Kaggle (https://www.kaggle.com/iarunava/cell-images-for-detecting-malaria) [53].
Conflicts of Interest
The authors declare that there is no conflict of interestregarding the publication of this paper.
Acknowledgments
This study was funded by the Deanship of ScientificResearch, Taif University, KSA (Research Project number:1-440-6146).
References
[1] K. S. Makhija, S. Maloney, and R. Norton, “The utility of serialblood film testing for the diagnosis of malaria,” Pathology,vol. 47, no. 1, pp. 68–70, 2015.
[2] WHO, Malaria Micropscopy Quality Assurance Manual,World Health Organization, 2016.
[3] “Our Malaria World Map of Estimated Risk (2018 update),”https://www.treated.com/malaria/world-map-risk.
[4] S. Rajaraman, S. K. Antani, M. Poostchi et al., “Pre-trainedconvolutional neural networks as feature extractors towardimproved malaria parasite detection in thin blood smearimages,” PeerJ, vol. 6, article e4568, 2018.
[5] C. Mehanian, M. Jaiswal, C. Delahunt, C. Thompson,M. Horning, and L. Hu, “Computer-automated malaria diag-nosis and quantization using convolutional neural networks,”in Proceedings of the IEEE International Conference on Com-puter Vision, pp. 116–125, Venice, Italy, 2017.
Table 6: Comparison of performance of proposed and the state-of-the-art approaches.
Model Accuracy AUC Precision Recall (sensitivity) F1-score MCC
Proposed model (CLR-triangular2) 0.9730 0.9704 0.97 0.97 0.970 0.9417
Rajaraman et al.Customized model [4]
0.9400 0.9790 0.951 0.931 0.941 0.880
Rajaraman et al.ResNet-50 [4]
0.9570 0.9900 0.969 0.945 0.957 0.912
Rajaraman et al.VGG-16 [4]
0.9450 0.9810 0.951 0.939 0.945 0.887
Gopakumar et al. [26] 0.9770 — 0.985 0.971 0.977 0.731
Bibin et al. [16] 0.963 — 0.959 0.976 0.967 —
Liang et al. [12] 0.973 — 0.977 0.969 0.972 —
13Wireless Communications and Mobile Computing

[6] E. Var and F. B. Tek, “Malaria parasite detection with deeptransfer learning,” in 2018 3rd International Conference onComputer Science and Engineering (UBMK), pp. 298–302,Sarajevo, Bosnia-Herzegovina, September 2018.
[7] A. Vijayalakshmi and B. Rajesh Kanna, “Deep learningapproach to detect malaria from microscopic images,” Multi-media Tools and Applications, vol. 79, 2019.
[8] Y. Souri, E. Noury, and E. Adeli, “Deep relative attributes,” inComputer Vision – ACCV 2016, pp. 118–123, Springer, 2016.
[9] M. I. Razzak, “Malarial parasite classification using recurrentneural network,” Journal of Image Processing (IJIP), vol. 9,no. 2, 2015.
[10] H. Shen, W. D. Pan, Y. Dong, andM. Alim, “Lossless compres-sion of curated erythrocyte images using deep autoencodersfor malaria infection diagnosis,” in 2016 Picture Coding Sym-posium (PCS), pp. 1–5, Nuremberg, Germany, December 2016.
[11] I. Mohanty, P. A. Pattanaik, and T. Swarnkar, “Automaticdetection of malaria parasites using unsupervised techniques,”in International Conference on ISMAC in ComputationalVision and Bio-Engineering, pp. 41–49, Springer, Cham, 2018.
[12] Z. Liang, A. Powell, I. Ersoy et al., “CNN-based image analysisfor malaria diagnosis,” in 2016 IEEE International Conferenceon Bioinformatics and Biomedicine (BIBM), pp. 493–496,Shenzhen, China, December 2016.
[13] A. Krizhevsky, I. Sutskever, and G. E. Hinton, “ImageNet clas-sification with deep convolutional neural networks,” Advancesin Neural Information Processing Systems, vol. 25, no. 2,pp. 1097–1105, 2012.
[14] H. Jane and A. Carpenter, “Applying faster R-CNN for objectdetection on malaria images,” in Proceedings of the IEEE Con-ference on Computer Vision and Pattern Recognition Work-shops, pp. 56–61, Honolulu, HI, USA, 2017.
[15] J. Deng, W. Dong, R. Socher, L.-J. Li, K. Li, and L. Fei-Fei,“ImageNet: a large-scale hierarchical image database,” in2009 IEEE Conference on Computer Vision and Pattern Recog-nition, pp. 248–255, Miami, FL, USA, June 2009.
[16] D. Bibin, M. S. Nair, and P. Punitha, “Malaria parasite detec-tion from peripheral blood smear images using deep belief net-works,” IEEE Access, vol. 5, pp. 9099–9108, 2017.
[17] X. Yang, T. Zhang, C. Xu, S. Yan, M. S. Hossain, andA. Ghoneim, “Deep relative attributes,” IEEE Transactions onMultimedia, vol. 18, no. 9, pp. 1832–1842, 2016.
[18] M. S. Hossain, S. U. Amin, M. Alsulaiman, andG. Muhammad, “Applying deep learning for epilepsy seizuredetection and brain mapping visualization,” ACM Transac-tions on Multimedia Computing, Communications, and Appli-cations, vol. 15, no. 1s, pp. 1–17, 2019.
[19] M. I. Razzak and S. Naz, “Microscopic blood smear segmenta-tion and classification using deep contour aware CNN andextreme machine learning,” in 2017 IEEE Conference on Com-puter Vision and Pattern Recognition Workshops (CVPRW),pp. 801–807, Honolulu, HI, USA, July 2017.
[20] V. Kantorov, M. Oquab, M. Cho, and I. Laptev, “Contextloc-net: context-aware deep network models for weakly supervisedlocalization,” in Computer Vision – ECCV 2016, pp. 350–365,Springer, 2016.
[21] G. B. Huang, Q. Y. Zhu, and C. K. Siew, “Extreme learningmachine: theory and applications,” Neurocomputing, vol. 70,no. 1-3, pp. 489–501, 2006.
[22] M. Masud, M. S. Hossain, and A. Alamri, “Data interoperabil-ity and multimedia content management in e-health systems,”
IEEE Transactions on Information Technology in Biomedicine,vol. 16, no. 6, pp. 1015–1023, 2012.
[23] O. B. Leal Neto, C. M. Albuquerque, J. O. Albuquerque, andC. S. Barbosa, “The schisto track: a system for gathering andmonitoring epidemiological surveys by connecting geographi-cal information systems in real time,” JMIR Mhealth Uhealth,vol. 2, no. 1, article e10, 2014.
[24] S. Kaewkamnerd, C. Uthaipibull, A. Intarapanich,M. Pannarut, S. Chaotheing, and S. Tongsima, “An automaticdevice for detection and classification of malaria parasitespecies in thick blood film,” BMC Bioinformatics, vol. 13,Supplement 17, p. S18, 2012.
[25] D. Anggraini, A. S. Nugroho, C. Pratama, I. E. Rozi, A. A.Iskandar, and R. N. Hartono, “Automated status identificationof microscopic images obtained from malaria thin bloodsmears,” in Proceedings of the 2011 International Conferenceon Electrical Engineering and Informatics, Bandung, Indonesia,July 2011.
[26] G. P. Gopakumar, M. Swetha, G. S. Siva, and G. R. K. Sai Sub-rahmanyam, “Convolutional neural network-based malariadiagnosis from focus stack of blood smear images acquiredusing custom-built slide scanner,” Journal of Biophotonics,vol. 11, no. 3, 2018.
[27] “MOMALA,” https://momala.org/malaria-diagnosis/.
[28] “This New App Helps Doctors Diagnose Malaria in Just 2Minutes,” https://www.globalcitizen.org/en/content/app-diagnose-malaria-uganda.
[29] N. E. Ross, C. J. Pritchard, D. M. Rubin, and A. G. Dusé, “Auto-mated image processingmethod for the diagnosis and classifica-tion of malaria on thin blood smears,” Medical & BiologicalEngineering & Computing, vol. 44, no. 5, pp. 427–436, 2006.
[30] D. K. Das, M. Ghosh, M. Pal, A. K. Maiti, and C. Chakraborty,“Machine learning approach for automated screening ofmalaria parasite using light microscopic images,” Micron,vol. 45, pp. 97–106, 2013.
[31] M. Poostchi, K. Silamut, R. J. Maude, S. Jaeger, and G. R.Thoma, “Image analysis and machine learning for detectingmalaria,” Translational Research, vol. 194, pp. 36–55, 2018.
[32] M. S. Hossain, M. Al-Hammadi, and G. Muhammad, “Auto-matic fruit classification using deep learning for industrialapplications,” IEEE Transactions on Industrial Informatics,vol. 15, no. 2, pp. 1027–1034, 2019.
[33] M. Usama, B. Ahmad, J. Wan, M. S. Hossain, M. F. Alhamid,and M. A. Hossain, “Deep feature learning for disease riskassessment based on convolutional neural network withintra-layer recurrent connection by using hospital big data,”IEEE Access, vol. 6, pp. 67927–67939, 2018.
[34] N. Srivastava, G. Hinton, A. Krizhevsky, I. Sutskever, andR. Salakhutdinov, “Dropout: a simple way to prevent neuralnetworks from overfitting,” Journal of Machine LearningResearch, vol. 15, pp. 1929–1958, 2014.
[35] Y. Zhang, Y. Qian, D. Wu, M. Shamim Hossain, A. Ghoneim,and M. Chen, “Emotion-aware multimedia Systems security,”IEEE Transactions on Multimedia, vol. 21, no. 3, pp. 617–624, 2019.
[36] Y. Zhang, X. Ma, J. Zhang, M. S. Hossain, G. Muhammad, andS. U. Amin, “Edge intelligence in the cognitive internet ofthings: improving sensitivity and interactivity,” IEEE Network,vol. 33, no. 3, pp. 58–64, 2019.
[37] X. Ma, R. Wang, Y. Zhang, C. Jiang, and H. Abbas, “A namedisambiguation module for intelligent robotic consultant in
14 Wireless Communications and Mobile Computing

industrial internet of things,” Mechanical Systems and SignalProcessing, vol. 136, article 106413, 2020.
[38] Y. Zhang, M. S. Hossain, A. Ghoneim, and M. Guizani,“COCME: content-oriented caching on the mobile edge forwireless communications,” IEEE Wireless Communication,vol. 26, no. 3, pp. 26–31, 2019.
[39] J. Wang, Y. Miao, P. Zhou, M. S. Hossain, and S. M. M.Rahman, “A software defined network routing in wirelessmultihop network,” Journal of Network and ComputerApplications, vol. 85, pp. 76–83, 2017.
[40] A. K. Sangaiah, D. V. Medhane, T. Han, M. S. Hossain, andG. Muhammad, “Enforcing position-based confidentialitywith machine learning paradigm through mobile edge com-puting in real-time industrial informatics,” IEEE Transactionson Industrial Informatics, vol. 15, no. 7, pp. 4189–4196, 2019.
[41] M. A. Rahman, M. M. Rashid, M. Shamim Hossain,E. Hassanain, M. F. Alhamid, and M. Guizani, “Blockchainand IoT-Based Cognitive Edge Framework for Sharing Econ-omy Services in a Smart City,” IEEE Access, vol. 7,pp. 18611–18621, 2019.
[42] M. F. Alhamid, M. Rawashdeh, H. Al Osman, M. S. Hossain,and A. El Saddik, “Towards context-sensitive collaborativemedia recommender system,” Multimedia Tools and Applica-tions, vol. 74, no. 24, pp. 11399–11428, 2015.
[43] Y. Zhang, Y. Li, R. Wang, M. S. Hossain, and H. Lu, “Multi-Aspect Aware session-based recommendation for intelligenttransportation services,” IEEE Transactions on IntelligentTransportation Systems, pp. 1–10, 2020.
[44] Y. Zhang, R. Wang, M. S. Hossain, M. F. Alhamid, andM. Guizani, “Heterogeneous information network-based con-tent caching in the internet of vehicles,” IEEE Transactions onVehicular Technology, vol. 68, no. 10, pp. 10216–10226, 2019.
[45] “Google Colab,” https://colab.research.google.com/.
[46] W. Shang, K. Sohn, D. Almeida, and H. Lee, “Understandingand improving convolutional neural networks viaconcatenated rectified linear units,” in Proc of 33rd interna-tional conference on machine learning (ICML2016), vol. 48,pp. 2217–2225, New York, USA, 2016.
[47] S. Ioffe and C. Szegedy, “Batch normalization: acceleratingdeep network training by reducing internal covariate shift,”in Proc. of the 32nd International Conference on MachineLearning, vol. 37, pp. 448–456, Euralille Lille, France, 2015.
[48] M. Lin, Q. Chen, and S. Yan, “Network in network,” in Proc. ofInternational Conference on Learning Representations (ICLR),Scottsdale, AZ, USA, 2013https://arxiv.org/abs/1312.4400.
[49] L. N. Smith, “Cyclical learning rates for training neural net-works,” in 2017 IEEE Winter Conference on Applications ofComputer Vision (WACV), pp. 464–472, Santa Rosa, CA,USA, March 2017.
[50] B. Kenstler, “Cyclical Learning Rates Implementation,”https://github.com/bckenstler/CLR.
[51] B. W. Matthews, “Comparison of the predicted and observedsecondary structure of T4 phage lysozyme,” Biochimica et Bio-physica Acta (BBA) - Protein Structure, vol. 405, no. 2, pp. 442–451, 1975.
[52] “TensorFlow Lite- Deploy machine learning models on mobileand IoT devices,” https://www.tensorflow.org/lite.
[53] “Malaria Cell Images Dataset,” https://www.kaggle.com/iarunava/cell-images-for-detecting-malaria.
15Wireless Communications and Mobile Computing