LEVERAGED LOAN MONTHLY - Reutersshare.thomsonreuters.com/.../Leveraged_Loan_Monthly_nov_2016.pdf ·...
96
LEVERAGED LOAN MONTHLY THOMSON REUTERS LPC NOVEMBER 2016 Colm (C.J.) Doherty Director of Analysis [email protected] 646-223-6821 Hugo Pereira Senior Market Analyst [email protected] 646-223-6818
Transcript of LEVERAGED LOAN MONTHLY - Reutersshare.thomsonreuters.com/.../Leveraged_Loan_Monthly_nov_2016.pdf ·...

LEVERAGED LOAN MONTHLY THOMSON REUTERS LPC
NOVEMBER 2016
Colm (C.J.) Doherty Director of Analysis [email protected] 646-223-6821
Hugo Pereira Senior Market Analyst [email protected] 646-223-6818
LEVERAGED LOAN MONTHLY
Leveraged Loan Monthly - November 2016
2
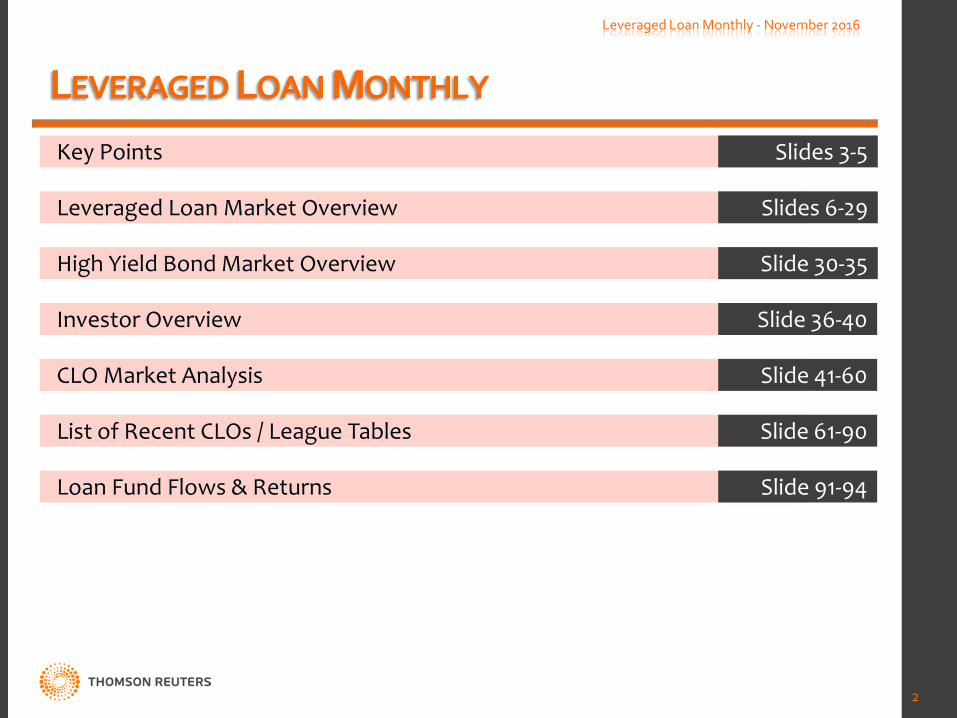
Leveraged Loan Market Overview Slides 6-29
High Yield Bond Market Overview Slide 30-35
Investor Overview Slide 36-40
CLO Market Analysis Slide 41-60
Loan Fund Flows & Returns Slide 91-94
List of Recent CLOs / League Tables Slide 61-90
Key Points Slides 3-5
KEY POINTS
Leveraged Loan Monthly - November 2016
3
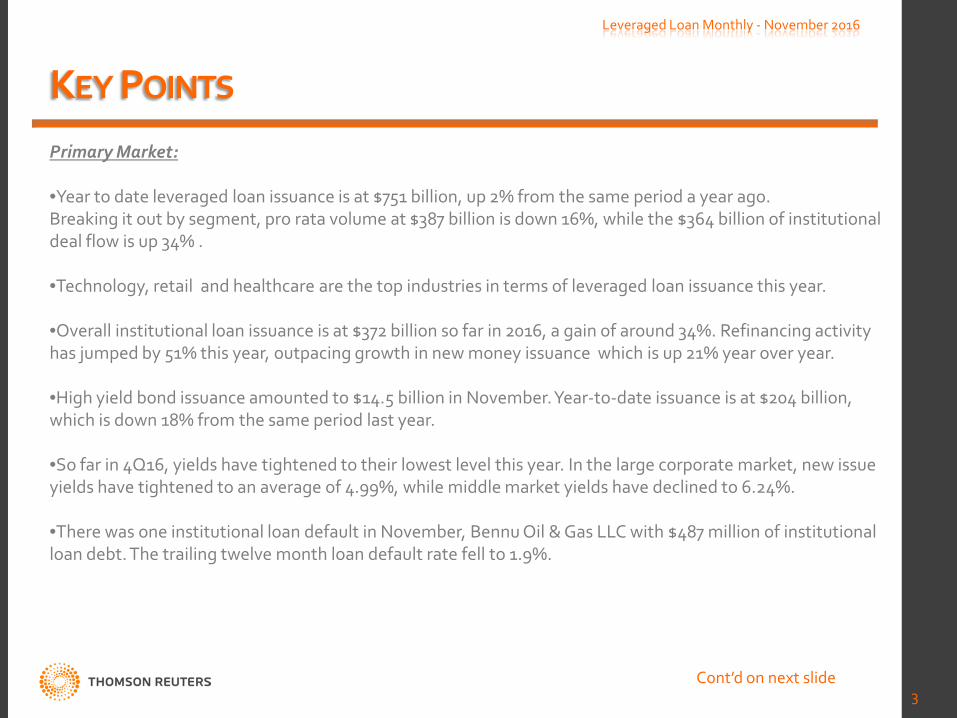
Primary Market: •Year to date leveraged loan issuance is at $751 billion, up 2% from the same period a year ago. Breaking it out by segment, pro rata volume at $387 billion is down 16%, while the $364 billion of institutional deal flow is up 34% . •Technology, retail and healthcare are the top industries in terms of leveraged loan issuance this year. •Overall institutional loan issuance is at $372 billion so far in 2016, a gain of around 34%. Refinancing activity has jumped by 51% this year, outpacing growth in new money issuance which is up 21% year over year. •High yield bond issuance amounted to $14.5 billion in November. Year-to-date issuance is at $204 billion, which is down 18% from the same period last year.
•So far in 4Q16, yields have tightened to their lowest level this year. In the large corporate market, new issue yields have tightened to an average of 4.99%, while middle market yields have declined to 6.24%.
•There was one institutional loan default in November, Bennu Oil & Gas LLC with $487 million of institutional loan debt. The trailing twelve month loan default rate fell to 1.9%.
Cont’d on next slide
KEY POINTS
Leveraged Loan Monthly - November 2016
4
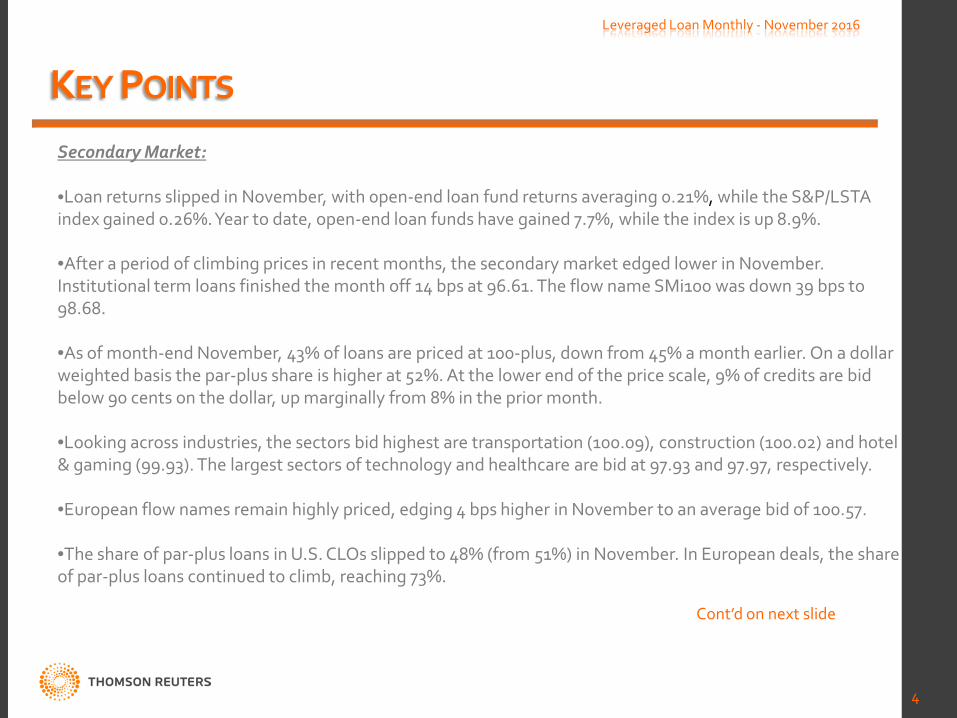
Secondary Market: •Loan returns slipped in November, with 0pen-end loan fund returns averaging 0.21%, while the S&P/LSTA index gained 0.26%. Year to date, open-end loan funds have gained 7.7%, while the index is up 8.9%. •After a period of climbing prices in recent months, the secondary market edged lower in November. Institutional term loans finished the month off 14 bps at 96.61. The flow name SMi100 was down 39 bps to 98.68. •As of month-end November, 43% of loans are priced at 100-plus, down from 45% a month earlier. On a dollar weighted basis the par-plus share is higher at 52%. At the lower end of the price scale, 9% of credits are bid below 90 cents on the dollar, up marginally from 8% in the prior month.
•Looking across industries, the sectors bid highest are transportation (100.09), construction (100.02) and hotel & gaming (99.93). The largest sectors of technology and healthcare are bid at 97.93 and 97.97, respectively. •European flow names remain highly priced, edging 4 bps higher in November to an average bid of 100.57.
•The share of par-plus loans in U.S. CLOs slipped to 48% (from 51%) in November. In European deals, the share of par-plus loans continued to climb, reaching 73%.
Cont’d on next slide
KEY POINTS
Leveraged Loan Monthly - November 2016
5
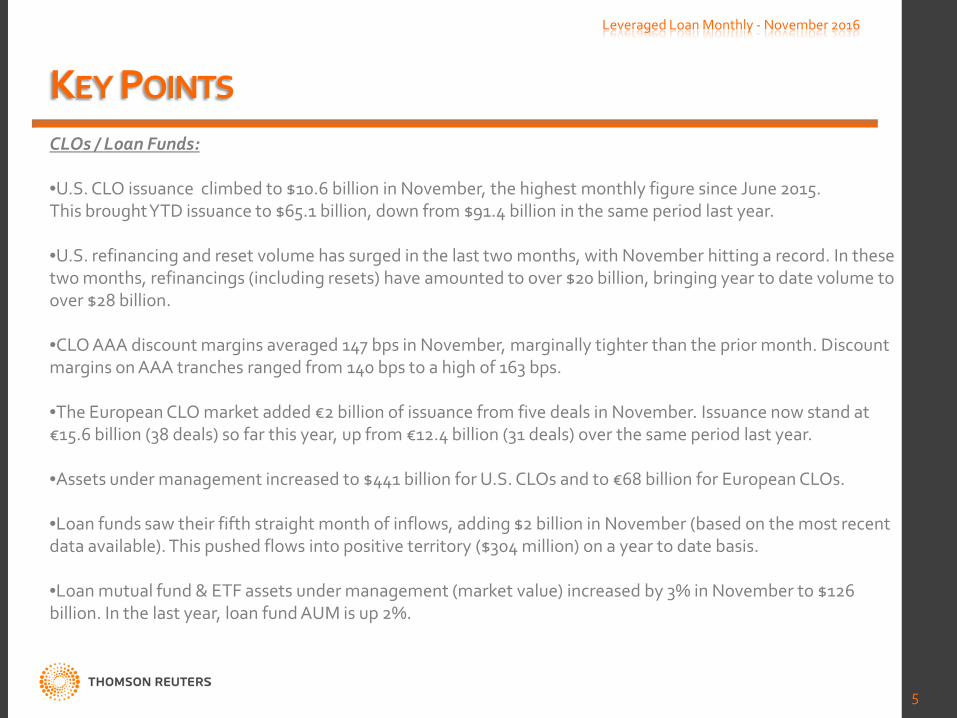
CLOs / Loan Funds: •U.S. CLO issuance climbed to $10.6 billion in November, the highest monthly figure since June 2015. This brought YTD issuance to $65.1 billion, down from $91.4 billion in the same period last year. •U.S. refinancing and reset volume has surged in the last two months, with November hitting a record. In these two months, refinancings (including resets) have amounted to over $20 billion, bringing year to date volume to over $28 billion.
•CLO AAA discount margins averaged 147 bps in November, marginally tighter than the prior month. Discount margins on AAA tranches ranged from 140 bps to a high of 163 bps. •The European CLO market added €2 billion of issuance from five deals in November. Issuance now stand at €15.6 billion (38 deals) so far this year, up from €12.4 billion (31 deals) over the same period last year. •Assets under management increased to $441 billion for U.S. CLOs and to €68 billion for European CLOs. •Loan funds saw their fifth straight month of inflows, adding $2 billion in November (based on the most recent data available). This pushed flows into positive territory ($304 million) on a year to date basis.
•Loan mutual fund & ETF assets under management (market value) increased by 3% in November to $126 billion. In the last year, loan fund AUM is up 2%.
LEVERAGED LOAN MARKET OVERVIEW
*2016 loan volumes are based on the most recently available data and is subject to updates throughout the quarter.
LEVERAGED LOAN ISSUANCE: PRO RATA VS. INSTITUTIONAL - MONTHLY
0.0
20.0
40.0
60.0
80.0
100.0
120.0
140.0
160.0
Jan-
06
Apr
-06
Jul-0
6 O
ct-0
6 Ja
n-07
A
pr-0
7 Ju
l-07
Oct
-07
Jan-
08
Apr
-08
Jul-0
8 O
ct-0
8 Ja
n-09
A
pr-0
9 Ju
l-09
Oct
-09
Jan-
10
Apr
-10
Jul-1
0 O
ct-1
0 Ja
n-11
A
pr-1
1 Ju
l-11
Oct
-11
Jan-
12
Apr
-12
Jul-1
2 O
ct-1
2 Ja
n-13
A
pr-1
3 Ju
l-13
Oct
-13
Jan-
14
Apr
-14
Jul-1
4 O
ct-1
4 Ja
n-15
A
pr-1
5 Ju
l-15
Oct
-15
Jan-
16
Apr
-16
Jul-1
6 O
ct-1
6
Leve
rage
d Lo
an Is
suan
ce ($
Bils
.)
Pro rata Institutional
Leveraged Loan Monthly - November 2016
7
U.S. LEVERAGED LOAN ISSUANCE
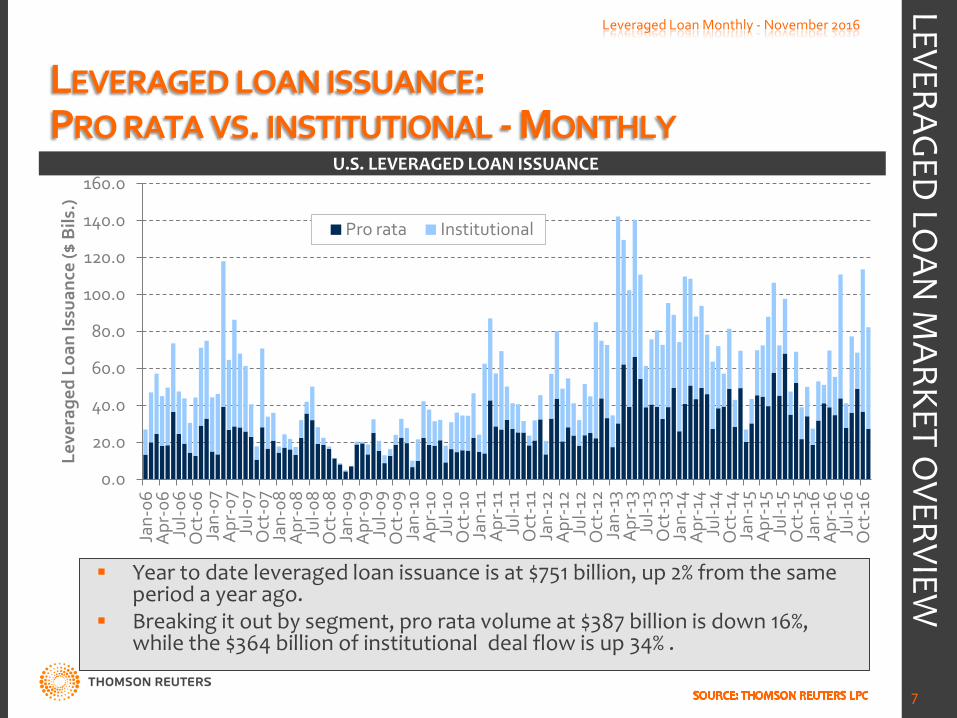
Year to date leveraged loan issuance is at $751 billion, up 2% from the same period a year ago.
Breaking it out by segment, pro rata volume at $387 billion is down 16%, while the $364 billion of institutional deal flow is up 34% .
LEVERAGED
LOAN
MARKET O
VERVIEW
YTD LEVERAGED LOAN ISSUANCE BY INDUSTRY
8
-
LEVERAGED
LOAN
MARKET O
VERVIEW
Leveraged Loan Monthly - November 2016
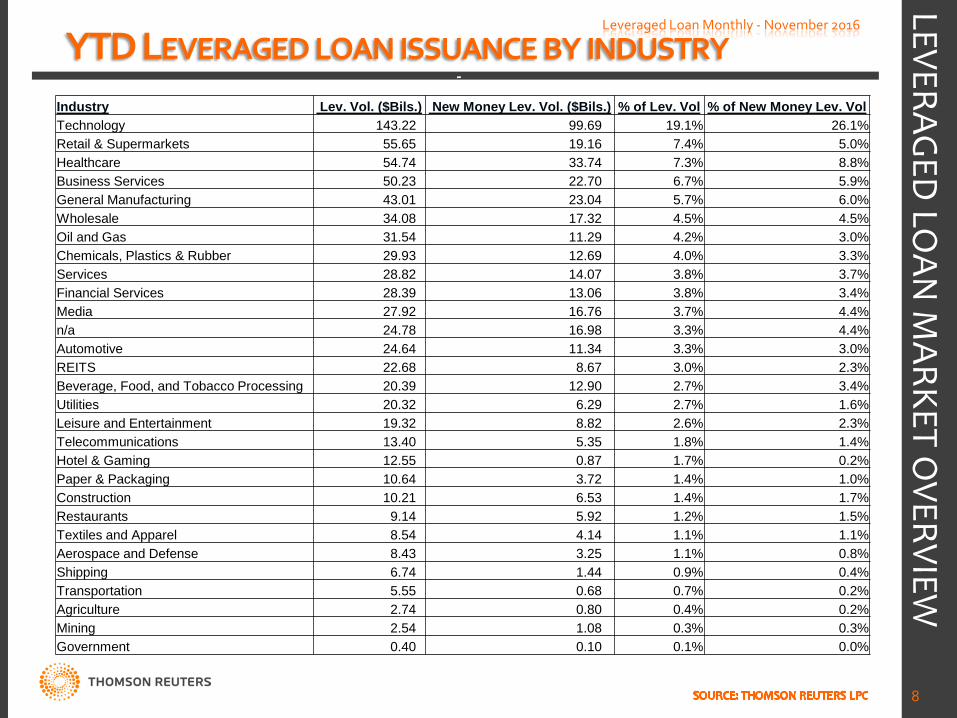
Industry Lev. Vol. ($Bils.) New Money Lev. Vol. ($Bils.) % of Lev. Vol % of New Money Lev. Vol Technology 143.22 99.69 19.1% 26.1% Retail & Supermarkets 55.65 19.16 7.4% 5.0% Healthcare 54.74 33.74 7.3% 8.8% Business Services 50.23 22.70 6.7% 5.9% General Manufacturing 43.01 23.04 5.7% 6.0% Wholesale 34.08 17.32 4.5% 4.5% Oil and Gas 31.54 11.29 4.2% 3.0% Chemicals, Plastics & Rubber 29.93 12.69 4.0% 3.3% Services 28.82 14.07 3.8% 3.7% Financial Services 28.39 13.06 3.8% 3.4% Media 27.92 16.76 3.7% 4.4% n/a 24.78 16.98 3.3% 4.4% Automotive 24.64 11.34 3.3% 3.0% REITS 22.68 8.67 3.0% 2.3% Beverage, Food, and Tobacco Processing 20.39 12.90 2.7% 3.4% Utilities 20.32 6.29 2.7% 1.6% Leisure and Entertainment 19.32 8.82 2.6% 2.3% Telecommunications 13.40 5.35 1.8% 1.4% Hotel & Gaming 12.55 0.87 1.7% 0.2% Paper & Packaging 10.64 3.72 1.4% 1.0% Construction 10.21 6.53 1.4% 1.7% Restaurants 9.14 5.92 1.2% 1.5% Textiles and Apparel 8.54 4.14 1.1% 1.1% Aerospace and Defense 8.43 3.25 1.1% 0.8% Shipping 6.74 1.44 0.9% 0.4% Transportation 5.55 0.68 0.7% 0.2% Agriculture 2.74 0.80 0.4% 0.2% Mining 2.54 1.08 0.3% 0.3% Government 0.40 0.10 0.1% 0.0%
YTD INSTITUTIONAL LOAN ISSUANCE BY INDUSTRY
9
-
LEVERAGED
LOAN
MARKET O
VERVIEW
Leveraged Loan Monthly - November 2016
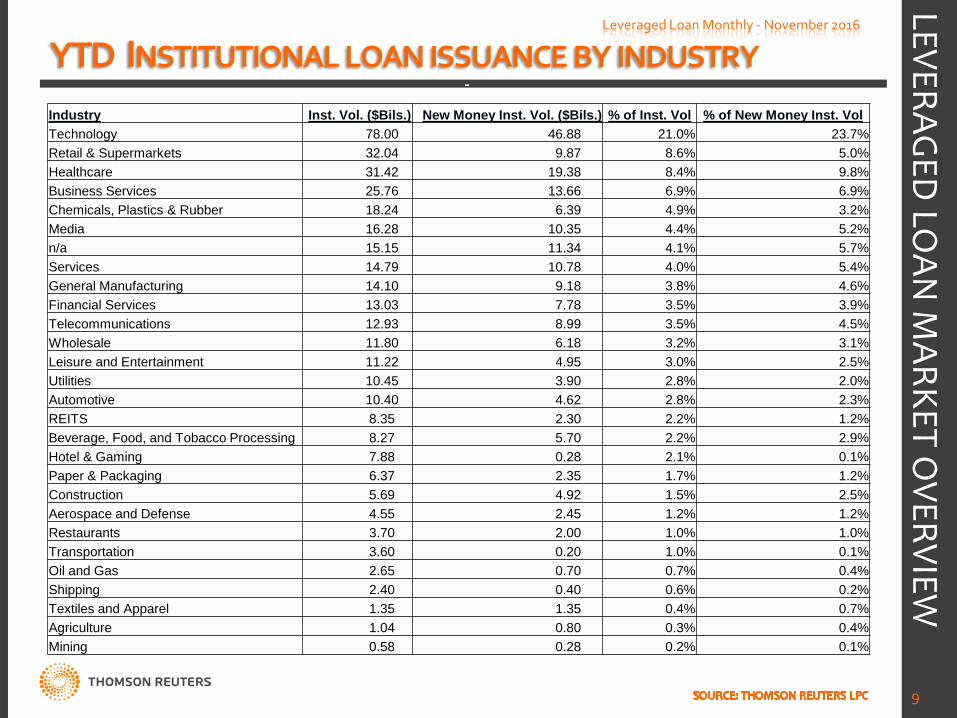
Industry Inst. Vol. ($Bils.) New Money Inst. Vol. ($Bils.) % of Inst. Vol % of New Money Inst. Vol Technology 78.00 46.88 21.0% 23.7% Retail & Supermarkets 32.04 9.87 8.6% 5.0% Healthcare 31.42 19.38 8.4% 9.8% Business Services 25.76 13.66 6.9% 6.9% Chemicals, Plastics & Rubber 18.24 6.39 4.9% 3.2% Media 16.28 10.35 4.4% 5.2% n/a 15.15 11.34 4.1% 5.7% Services 14.79 10.78 4.0% 5.4% General Manufacturing 14.10 9.18 3.8% 4.6% Financial Services 13.03 7.78 3.5% 3.9% Telecommunications 12.93 8.99 3.5% 4.5% Wholesale 11.80 6.18 3.2% 3.1% Leisure and Entertainment 11.22 4.95 3.0% 2.5% Utilities 10.45 3.90 2.8% 2.0% Automotive 10.40 4.62 2.8% 2.3% REITS 8.35 2.30 2.2% 1.2% Beverage, Food, and Tobacco Processing 8.27 5.70 2.2% 2.9% Hotel & Gaming 7.88 0.28 2.1% 0.1% Paper & Packaging 6.37 2.35 1.7% 1.2% Construction 5.69 4.92 1.5% 2.5% Aerospace and Defense 4.55 2.45 1.2% 1.2% Restaurants 3.70 2.00 1.0% 1.0% Transportation 3.60 0.20 1.0% 0.1% Oil and Gas 2.65 0.70 0.7% 0.4% Shipping 2.40 0.40 0.6% 0.2% Textiles and Apparel 1.35 1.35 0.4% 0.7% Agriculture 1.04 0.80 0.3% 0.4% Mining 0.58 0.28 0.2% 0.1%
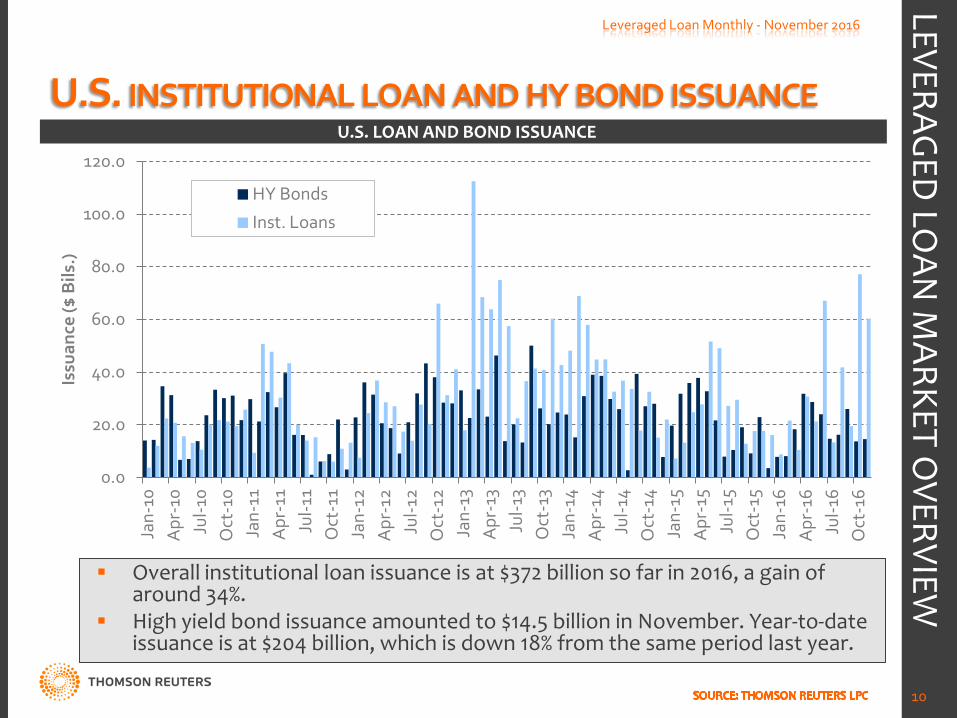
U.S. INSTITUTIONAL LOAN AND HY BOND ISSUANCE
0.0
20.0
40.0
60.0
80.0
100.0
120.0 Ja
n-10
A
pr-1
0 Ju
l-10
Oct
-10
Jan-
11
Apr
-11
Jul-1
1 O
ct-1
1 Ja
n-12
A
pr-1
2 Ju
l-12
Oct
-12
Jan-
13
Apr
-13
Jul-1
3 O
ct-1
3 Ja
n-14
A
pr-1
4 Ju
l-14
Oct
-14
Jan-
15
Apr
-15
Jul-1
5 O
ct-1
5 Ja
n-16
A
pr-1
6 Ju
l-16
Oct
-16
Issu
ance
($ B
ils.)
HY Bonds
Inst. Loans
Leveraged Loan Monthly - November 2016
10
U.S. LOAN AND BOND ISSUANCE
Overall institutional loan issuance is at $372 billion so far in 2016, a gain of around 34%.
High yield bond issuance amounted to $14.5 billion in November. Year-to-date issuance is at $204 billion, which is down 18% from the same period last year.
LEVERAGED
LOAN
MARKET O
VERVIEW
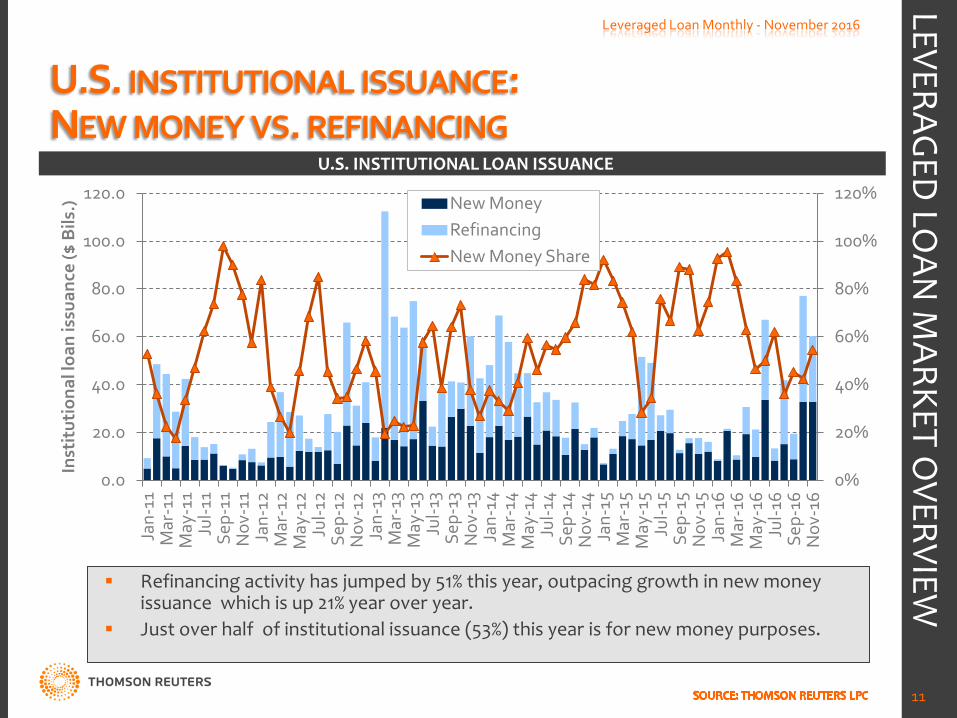
U.S. INSTITUTIONAL ISSUANCE: NEW MONEY VS. REFINANCING
0%
20%
40%
60%
80%
100%
120%
0.0
20.0
40.0
60.0
80.0
100.0
120.0
Jan-
11
Mar
-11
May
-11
Jul-1
1 Se
p-11
N
ov-1
1 Ja
n-12
M
ar-1
2 M
ay-1
2 Ju
l-12
Sep-
12
Nov
-12
Jan-
13
Mar
-13
May
-13
Jul-1
3 Se
p-13
N
ov-1
3 Ja
n-14
M
ar-1
4 M
ay-1
4 Ju
l-14
Sep-
14
Nov
-14
Jan-
15
Mar
-15
May
-15
Jul-1
5 Se
p-15
N
ov-1
5 Ja
n-16
M
ar-1
6 M
ay-1
6 Ju
l-16
Sep-
16
Nov
-16
Inst
itut
iona
l loa
n is
suan
ce ($
Bils
.) New Money
Refinancing New Money Share
Leveraged Loan Monthly - November 2016
11
U.S. INSTITUTIONAL LOAN ISSUANCE
Refinancing activity has jumped by 51% this year, outpacing growth in new money issuance which is up 21% year over year.
Just over half of institutional issuance (53%) this year is for new money purposes.
LEVERAGED
LOAN
MARKET O
VERVIEW
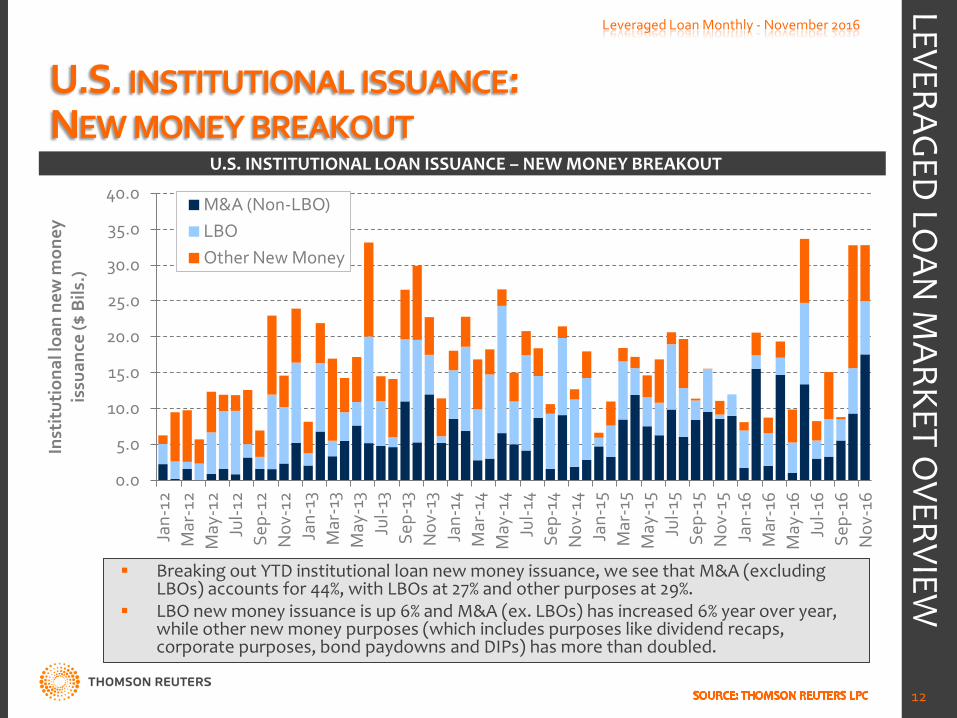
U.S. INSTITUTIONAL ISSUANCE: NEW MONEY BREAKOUT
0.0
5.0
10.0
15.0
20.0
25.0
30.0
35.0
40.0
Jan-
12
Mar
-12
May
-12
Jul-1
2 Se
p-12
N
ov-1
2 Ja
n-13
M
ar-1
3 M
ay-1
3 Ju
l-13
Sep-
13
Nov
-13
Jan-
14
Mar
-14
May
-14
Jul-1
4 Se
p-14
N
ov-1
4 Ja
n-15
M
ar-1
5 M
ay-1
5 Ju
l-15
Sep-
15
Nov
-15
Jan-
16
Mar
-16
May
-16
Jul-1
6 Se
p-16
N
ov-1
6
Inst
itut
iona
l loa
n ne
w m
oney
is
suan
ce ($
Bils
.)
M&A (Non-LBO) LBO Other New Money
Leveraged Loan Monthly - November 2016
12
U.S. INSTITUTIONAL LOAN ISSUANCE – NEW MONEY BREAKOUT
Breaking out YTD institutional loan new money issuance, we see that M&A (excluding LBOs) accounts for 44%, with LBOs at 27% and other purposes at 29%.
LBO new money issuance is up 6% and M&A (ex. LBOs) has increased 6% year over year, while other new money purposes (which includes purposes like dividend recaps, corporate purposes, bond paydowns and DIPs) has more than doubled.
LEVERAGED
LOAN
MARKET O
VERVIEW
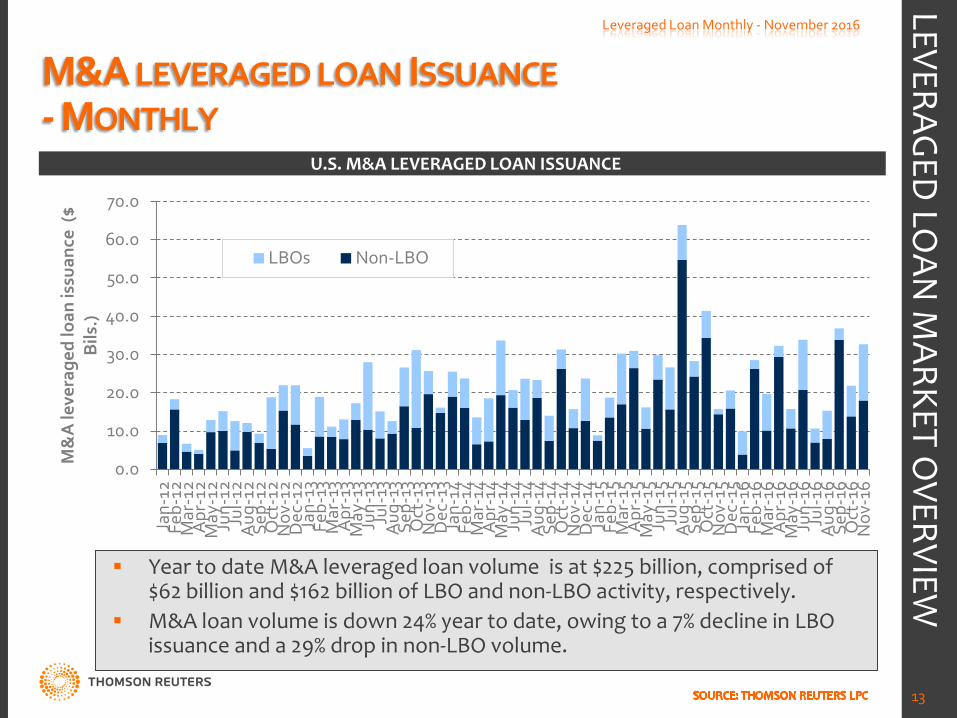
M&A LEVERAGED LOAN ISSUANCE - MONTHLY
0.0
10.0
20.0
30.0
40.0
50.0
60.0
70.0
Jan-
12
Feb-
12
Mar
-12
Apr
-12
May
-12
Jun-
12
Jul-1
2 A
ug-1
2 Se
p-12
O
ct-1
2 N
ov-1
2 D
ec-1
2 Ja
n-13
Fe
b-13
M
ar-1
3 A
pr-1
3 M
ay-1
3 Ju
n-13
Ju
l-13
Aug
-13
Sep-
13
Oct
-13
Nov
-13
Dec
-13
Jan-
14
Feb-
14
Mar
-14
Apr
-14
May
-14
Jun-
14
Jul-1
4 A
ug-1
4 Se
p-14
O
ct-1
4 N
ov-1
4 D
ec-1
4 Ja
n-15
Fe
b-15
M
ar-1
5 A
pr-1
5 M
ay-1
5 Ju
n-15
Ju
l-15
Aug
-15
Sep-
15
Oct
-15
Nov
-15
Dec
-15
Jan-
16
Feb-
16
Mar
-16
Apr
-16
May
-16
Jun-
16
Jul-1
6 A
ug-1
6 Se
p-16
O
ct-1
6 N
ov-1
6
M&
A le
vera
ged
loan
issu
ance
($
Bils
.)
LBOs Non-LBO
Leveraged Loan Monthly - November 2016
13
U.S. M&A LEVERAGED LOAN ISSUANCE
Year to date M&A leveraged loan volume is at $225 billion, comprised of $62 billion and $162 billion of LBO and non-LBO activity, respectively.
M&A loan volume is down 24% year to date, owing to a 7% decline in LBO issuance and a 29% drop in non-LBO volume.
LEVERAGED
LOAN
MARKET O
VERVIEW
SPONSORED LEVERAGED LOAN ISSUANCE: LBO VS. NON-LBO - MONTHLY
0.0 10.0 20.0 30.0 40.0 50.0 60.0 70.0 80.0 90.0
100.0
Jan-
10
Apr
-10
Jul-1
0 O
ct-1
0 Ja
n-11
A
pr-1
1 Ju
l-11
Oct
-11
Jan-
12
Apr
-12
Jul-1
2 O
ct-1
2 Ja
n-13
A
pr-1
3 Ju
l-13
Oct
-13
Jan-
14
Apr
-14
Jul-1
4 O
ct-1
4 Ja
n-15
A
pr-1
5 Ju
l-15
Oct
-15
Jan-
16
Apr
-16
Jul-1
6 O
ct-1
6 Spon
sore
d le
vera
ged
loan
issu
ance
($
Bils
)
LBO Non-LBO
Leveraged Loan Monthly - November 2016
14
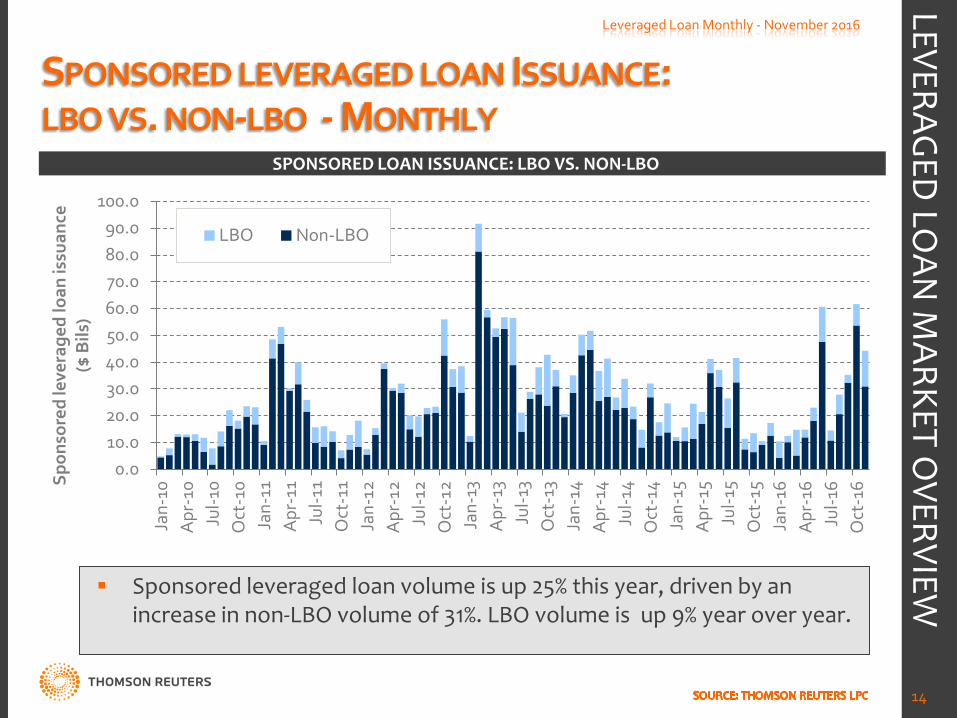
SPONSORED LOAN ISSUANCE: LBO VS. NON-LBO
Sponsored leveraged loan volume is up 25% this year, driven by an increase in non-LBO volume of 31%. LBO volume is up 9% year over year.
LEVERAGED
LOAN
MARKET O
VERVIEW
SPONSORED DIVIDEND RECAP LOAN VOLUME
0.0
5.0
10.0
15.0
20.0
25.0
1Q06
2Q
06
3Q06
4Q
06
1Q07
2Q
07
3Q07
4Q
07
1Q08
2Q
08
3Q08
4Q
08
1Q09
2Q
09
3Q09
4Q
09
1Q10
2Q
10
3Q10
4Q
10
1Q11
2Q
11
3Q11
4Q
11
1Q12
2Q
12
3Q12
4Q
12
1Q13
2Q
13
3Q13
4Q
13
1Q14
2Q
14
3Q14
4Q
14
1Q15
2Q
15
3Q15
4Q
15
1Q16
2Q
16
3Q16
4Q
16 …
Spon
sore
d di
vide
nd re
cap
is
suan
ce ($
Bils
)
Leveraged Loan Monthly - November 2016
15
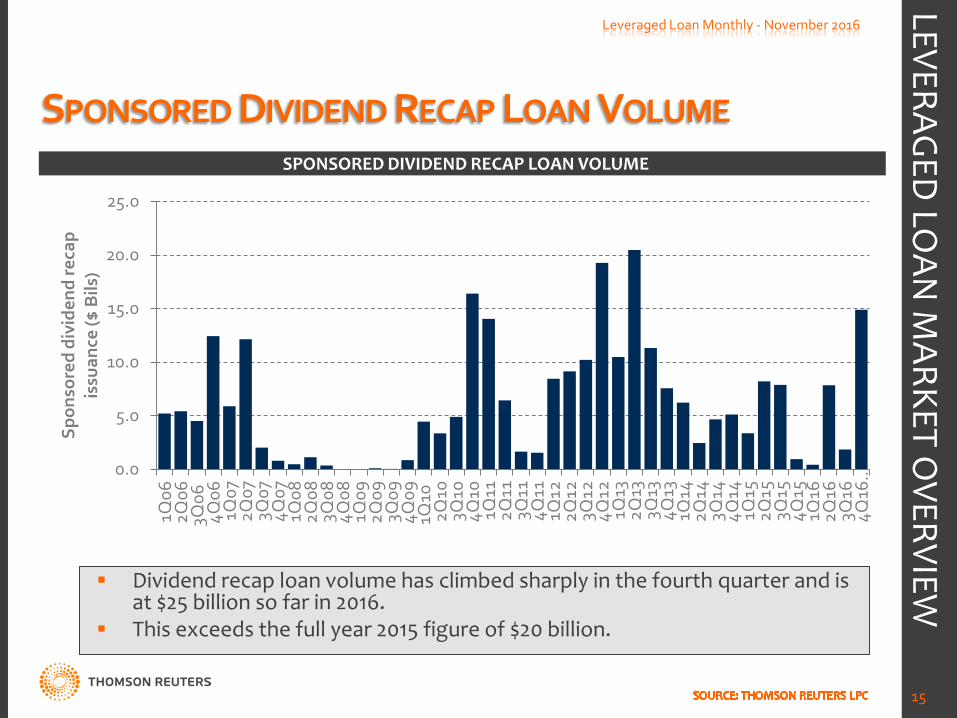
SPONSORED DIVIDEND RECAP LOAN VOLUME
Dividend recap loan volume has climbed sharply in the fourth quarter and is at $25 billion so far in 2016.
This exceeds the full year 2015 figure of $20 billion.
LEVERAGED
LOAN
MARKET O
VERVIEW
MIDDLE MARKET LOAN ISSUANCE
0.0
10.0
20.0
30.0
40.0
50.0
60.0
70.0
1Q06
2Q
06
3Q06
4Q
06
1Q07
2Q
07
3Q07
4Q
07
1Q08
2Q
08
3Q08
4Q
08
1Q09
2Q
09
3Q09
4Q
09
1Q10
2Q
10
3Q10
4Q
10
1Q11
2Q
11
3Q11
4Q
11
1Q12
2Q
12
3Q12
4Q
12
1Q13
2Q
13
3Q13
4Q
13
1Q14
2Q
14
3Q14
4Q
14
1Q15
2Q
15
3Q15
4Q
15
1Q16
2Q
16
3Q16
4Q
16
Mid
dle
mar
ket l
oan
volu
me
($B
ils.)
Trad. MM*
Large MM*
Leveraged Loan Monthly - November 2016
16
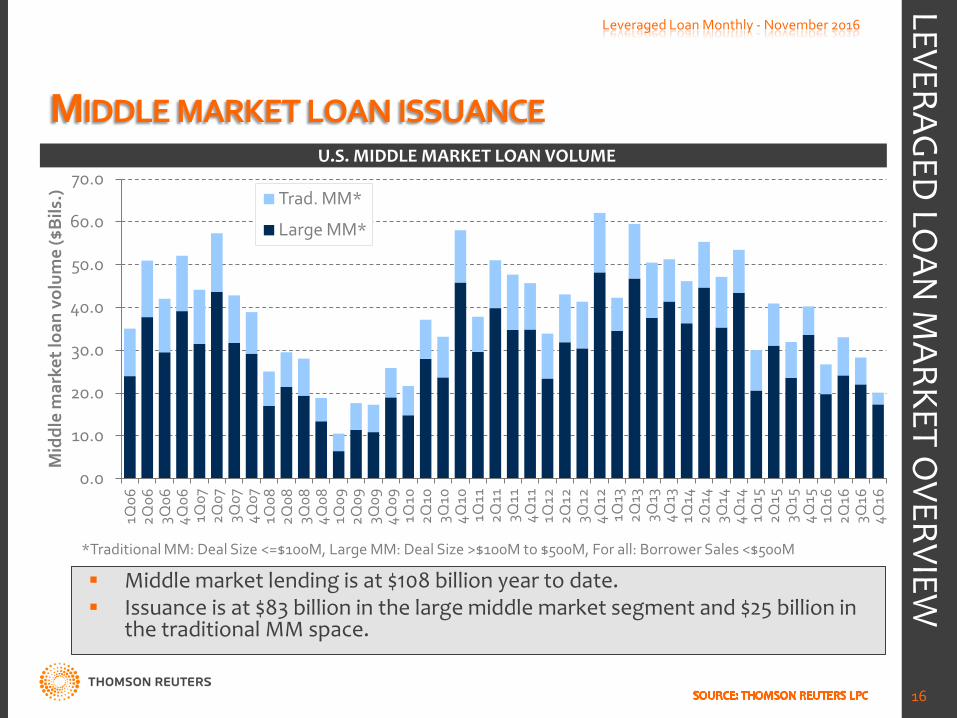
U.S. MIDDLE MARKET LOAN VOLUME
Middle market lending is at $108 billion year to date. Issuance is at $83 billion in the large middle market segment and $25 billion in
the traditional MM space.
LEVERAGED
LOAN
MARKET O
VERVIEW
*Traditional MM: Deal Size <=$100M, Large MM: Deal Size >$100M to $500M, For all: Borrower Sales <$500M
INSTITUTIONAL LOAN OUTSTANDINGS
0
100
200
300
400
500
600
700
800
900
Jan-
04
Jul-0
4
Jan-
05
Jul-0
5
Jan-
06
Jul-0
6
Jan-
07
Jul-0
7
Jan-
08
Jul-0
8
Jan-
09
Jul-0
9
Jan-
10
Jul-1
0
Jan-
11
Jul-1
1
Jan-
12
Jul-1
2
Jan-
13
Jul-1
3
Jan-
14
Jul-1
4
Jan-
15
Jul-1
5
Jan-
16
Jul-1
6
Inst
itut
iona
l loa
n ou
tsta
ndin
gs ($
B
ils.)
Leveraged Loan Monthly - November 2016
17
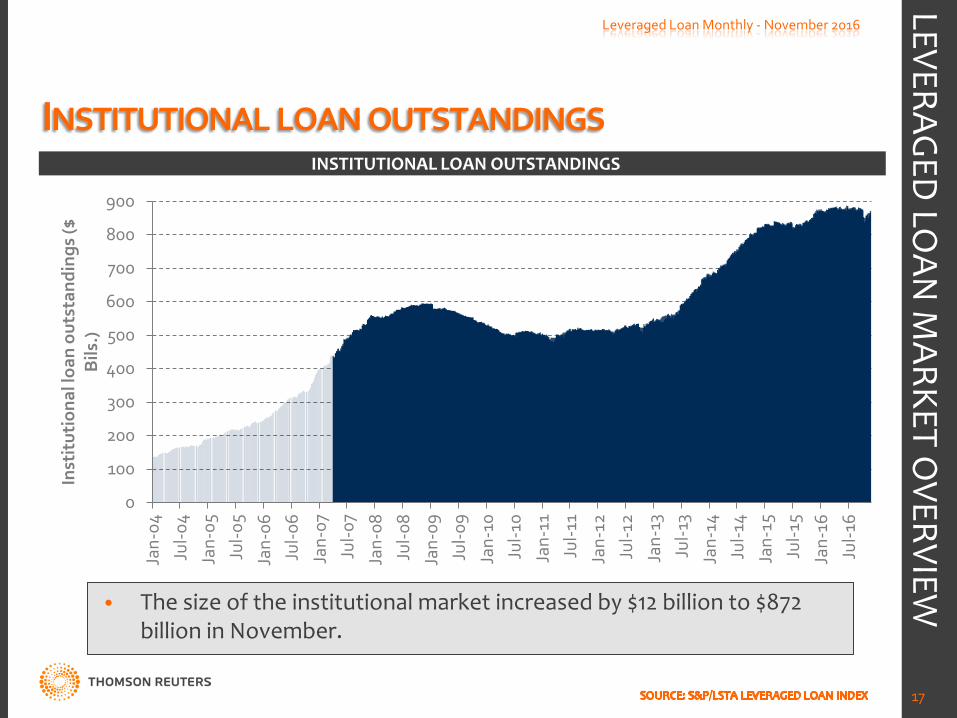
INSTITUTIONAL LOAN OUTSTANDINGS
• The size of the institutional market increased by $12 billion to $872 billion in November.
LEVERAGED
LOAN
MARKET O
VERVIEW
INDUSTRY BREAKDOWN OF INSTITUTIONAL LOAN OUTSTANDINGS
0.0%
2.0%
4.0%
6.0%
8.0%
10.0%
12.0%
14.0%
Tech
nolo
gy
Hea
lthca
re
Reta
il &
Sup
erm
arke
ts
Fina
ncia
l Ser
vice
s
Broa
dcas
ting
Chem
ical
s, P
last
ics
& R
ubbe
r
Gen
eral
Man
ufac
turin
g
Serv
ices
Busi
ness
Ser
vice
s
Oil
and
Gas
Hot
el &
Gam
ing
Tele
com
mun
icat
ions
Who
lesa
le
Leis
ure
and
Ente
rtai
nmen
t
n/a
Util
ities
Aut
omot
ive
Med
ia
Beve
rage
, Foo
d, a
nd T
obac
co …
Rest
aura
nts
Aer
ospa
ce a
nd D
efen
se
Tran
spor
tatio
n
Cons
truc
tion
Pape
r & P
acka
ging
Ship
ping
Min
ing
REIT
S
Text
iles
and
App
arel
Agr
icul
ture
Real
Est
ate
Gov
ernm
ent
Shar
e of
Inst
itut
iona
l Loa
n M
arke
t
Leveraged Loan Monthly - November 2016
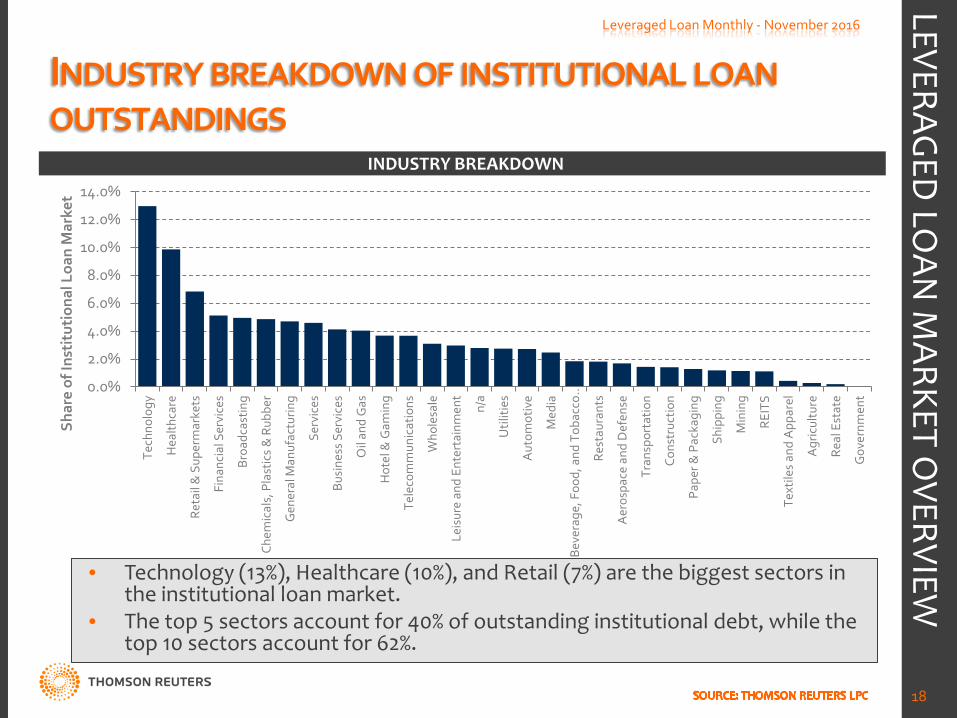
18
INDUSTRY BREAKDOWN
• Technology (13%), Healthcare (10%), and Retail (7%) are the biggest sectors in the institutional loan market.
• The top 5 sectors account for 40% of outstanding institutional debt, while the top 10 sectors account for 62%.
LEVERAGED
LOAN
MARKET O
VERVIEW
PRIMARY MARKET YIELDS
4.0%
5.0%
6.0%
7.0%
8.0%
9.0%
10.0%
11.0%
12.0%
13.0%
1Q10
Ju
l-10
Nov
-10
Mar
-11
Jul-1
1 N
ov-1
1 M
ar-1
2 Ju
l-12
Nov
-12
Mar
-13
Jul-1
3 N
ov-1
3 M
ar-1
4 Ju
l-14
Nov
-14
Mar
-15
Jul-1
5 N
ov-1
5 M
ar-1
6 Ju
l-16
Nov
-16
Ave
rage
yie
ld
Large Corporate Market
Middle Market
Monthly
Leveraged Loan Monthly - November 2016
19
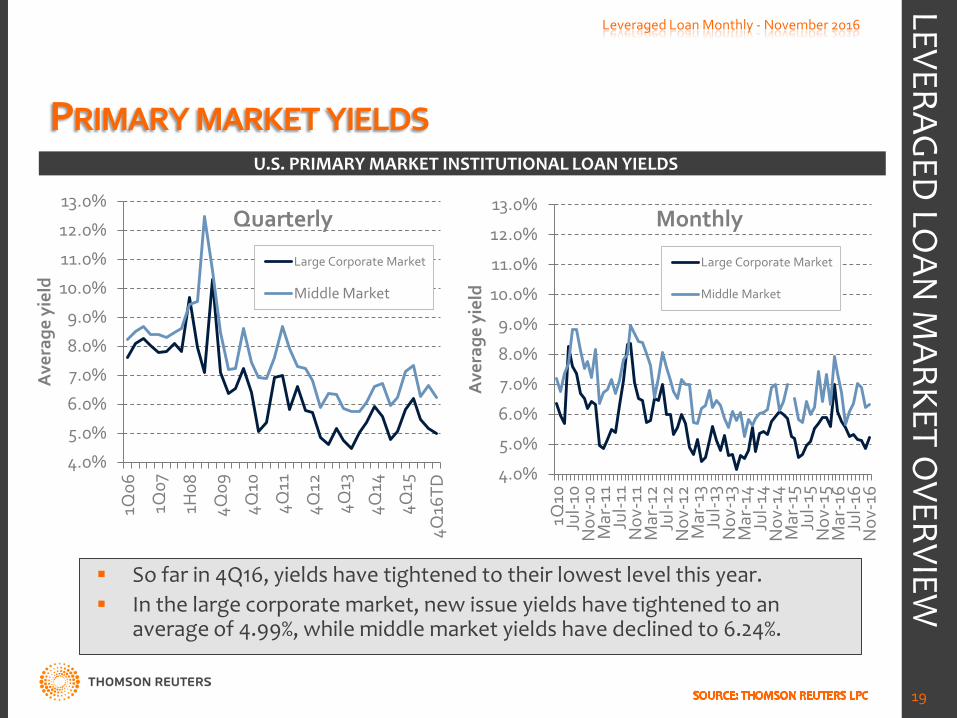
U.S. PRIMARY MARKET INSTITUTIONAL LOAN YIELDS
So far in 4Q16, yields have tightened to their lowest level this year. In the large corporate market, new issue yields have tightened to an
average of 4.99%, while middle market yields have declined to 6.24%.
LEVERAGED
LOAN
MARKET O
VERVIEW
4.0%
5.0%
6.0%
7.0%
8.0%
9.0%
10.0%
11.0%
12.0%
13.0%
1Q06
1Q07
1H08
4Q09
4Q10
4Q11
4Q12
4Q13
4Q14
4Q15
4Q16
TD
Ave
rage
yie
ld
Large Corporate Market
Middle Market
Quarterly
INSTITUTIONAL LOAN FLEX ACTIVITY
-3%
-2%
-1%
0%
1%
2%
3%
-60
-50
-40
-30
-20
-10
0
10
20
30
40
Jan-
12
Feb-
12
Mar
-12
Apr
-12
May
-12
Jun-
12
Jul-1
2 A
ug-1
2 Se
p-12
O
ct-1
2 N
ov-1
2 D
ec-1
2 Ja
n-13
Fe
b-13
M
ar-1
3 A
pr-1
3 M
ay-1
3 Ju
n-13
Ju
l-13
Aug
-13
Sep-
13
Oct
-13
Nov
-13
Dec
-13
Jan-
14
Feb-
14
Mar
-14
Apr
-14
May
-14
Jun-
14
Jul-1
4 A
ug-1
4 Se
p-14
O
ct-1
4 N
ov-1
4 D
ec-1
4 Ja
n-15
Fe
b-15
M
ar-1
5 A
pr-1
5 M
ay-1
5 Ju
n-15
Ju
l-15
Aug
-15
Sep-
15
Oct
-15
Nov
-15
Dec
-15
Jan-
16
Feb-
16
Mar
-16
Apr
-16
May
-16
Jun-
16
Jul-1
6 A
ug-1
6 Se
p-16
O
ct-1
6 N
ov-1
6
Ave
rage
flex
Num
ber o
f fle
xes
# of flexes up/down
Avg. yield adjustment up/down
Leveraged Loan Monthly - November 2016
20
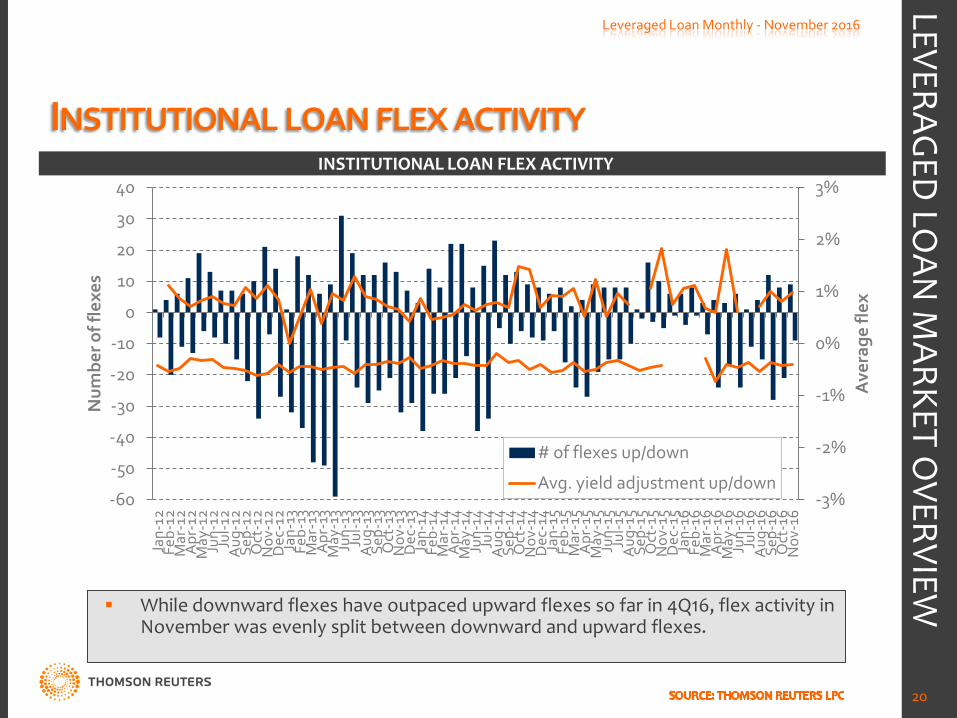
INSTITUTIONAL LOAN FLEX ACTIVITY
While downward flexes have outpaced upward flexes so far in 4Q16, flex activity in November was evenly split between downward and upward flexes.
LEVERAGED
LOAN
MARKET O
VERVIEW
INSTITUTIONAL LEVERAGED LOAN DEFAULTS
0.0%
0.5%
1.0%
1.5%
2.0%
2.5%
3.0%
3.5%
4.0%
4.5%
0.0
1.0
2.0
3.0
4.0
5.0
6.0
Jan-
15
Feb-
15
Mar
-15
Apr
-15
May
-15
Jun-
15
Jul-1
5
Aug
-15
Sep-
15
Oct
-15
Nov
-15
Dec
-15
Jan-
16
Feb-
16
Mar
-16
Apr
-16
May
-16
Jun-
16
Jul-1
6
Aug
-16
Sep-
16
Oct
-16
Nov
-16
Def
ault
rate
Par
val
ue o
f def
ault
ed in
stit
utio
nal
loan
s ($
Bils
.)
Leveraged Loan Monthly - November 2016
21
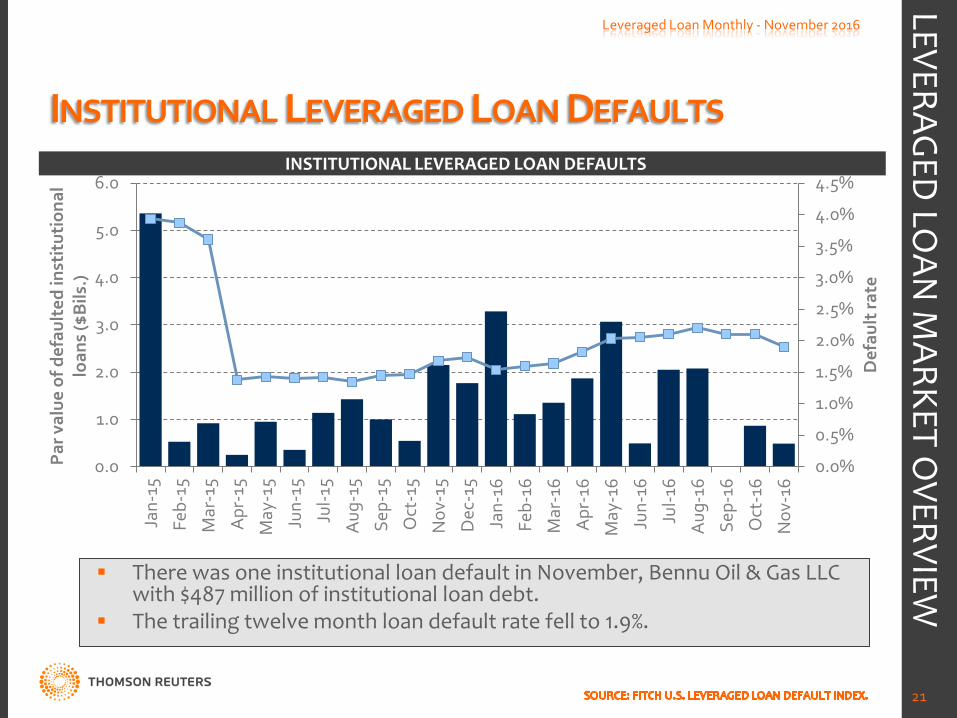
INSTITUTIONAL LEVERAGED LOAN DEFAULTS
There was one institutional loan default in November, Bennu Oil & Gas LLC with $487 million of institutional loan debt.
The trailing twelve month loan default rate fell to 1.9%.
LEVERAGED
LOAN
MARKET O
VERVIEW
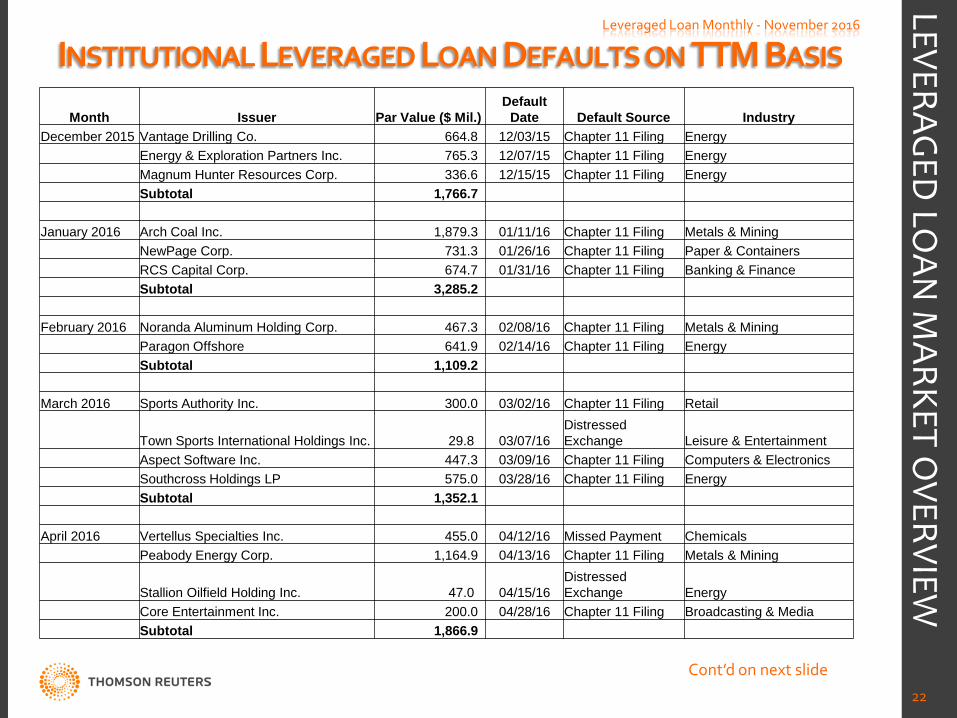
INSTITUTIONAL LEVERAGED LOAN DEFAULTS ON TTM BASIS Leveraged Loan Monthly - November 2016
22
LEVERAGED
LOAN
MARKET O
VERVIEW
Cont’d on next slide
Month Issuer Par Value ($ Mil.) Default
Date Default Source Industry December 2015 Vantage Drilling Co. 664.8 12/03/15 Chapter 11 Filing Energy Energy & Exploration Partners Inc. 765.3 12/07/15 Chapter 11 Filing Energy Magnum Hunter Resources Corp. 336.6 12/15/15 Chapter 11 Filing Energy Subtotal 1,766.7 January 2016 Arch Coal Inc. 1,879.3 01/11/16 Chapter 11 Filing Metals & Mining NewPage Corp. 731.3 01/26/16 Chapter 11 Filing Paper & Containers RCS Capital Corp. 674.7 01/31/16 Chapter 11 Filing Banking & Finance Subtotal 3,285.2 February 2016 Noranda Aluminum Holding Corp. 467.3 02/08/16 Chapter 11 Filing Metals & Mining Paragon Offshore 641.9 02/14/16 Chapter 11 Filing Energy Subtotal 1,109.2 March 2016 Sports Authority Inc. 300.0 03/02/16 Chapter 11 Filing Retail
Town Sports International Holdings Inc. 29.8 03/07/16 Distressed Exchange Leisure & Entertainment
Aspect Software Inc. 447.3 03/09/16 Chapter 11 Filing Computers & Electronics Southcross Holdings LP 575.0 03/28/16 Chapter 11 Filing Energy Subtotal 1,352.1 April 2016 Vertellus Specialties Inc. 455.0 04/12/16 Missed Payment Chemicals Peabody Energy Corp. 1,164.9 04/13/16 Chapter 11 Filing Metals & Mining
Stallion Oilfield Holding Inc. 47.0 04/15/16 Distressed Exchange Energy
Core Entertainment Inc. 200.0 04/28/16 Chapter 11 Filing Broadcasting & Media Subtotal 1,866.9
INSTITUTIONAL LEVERAGED LOAN DEFAULTS ON TTM BASIS Leveraged Loan Monthly - November 2016
23
LEVERAGED
LOAN
MARKET O
VERVIEW
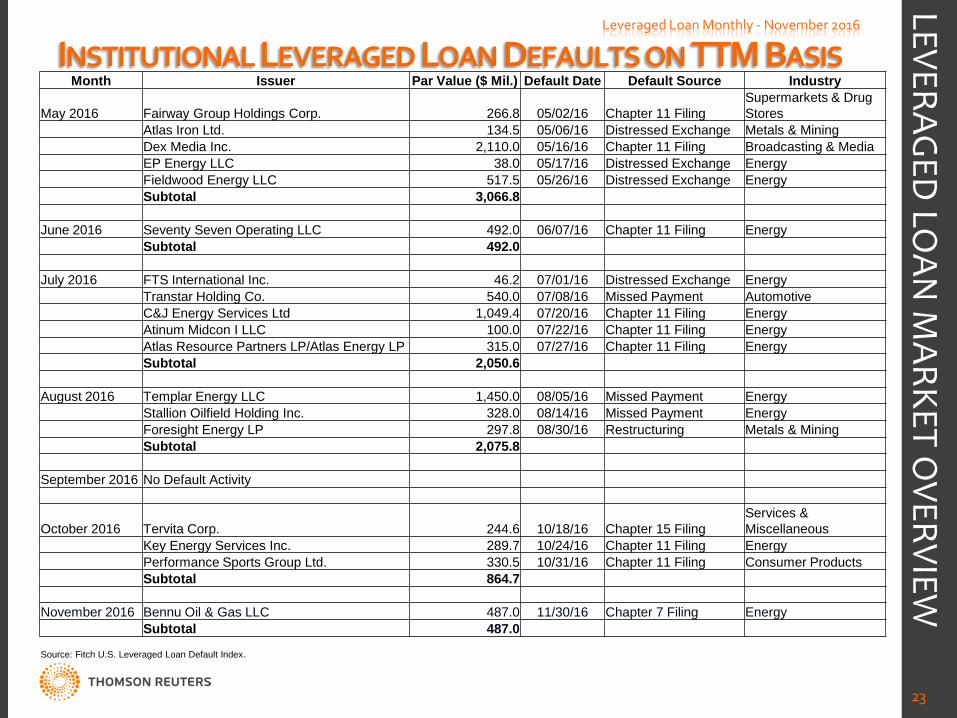
Month Issuer Par Value ($ Mil.) Default Date Default Source Industry
May 2016 Fairway Group Holdings Corp. 266.8 05/02/16 Chapter 11 Filing Supermarkets & Drug Stores
Atlas Iron Ltd. 134.5 05/06/16 Distressed Exchange Metals & Mining Dex Media Inc. 2,110.0 05/16/16 Chapter 11 Filing Broadcasting & Media EP Energy LLC 38.0 05/17/16 Distressed Exchange Energy Fieldwood Energy LLC 517.5 05/26/16 Distressed Exchange Energy Subtotal 3,066.8 June 2016 Seventy Seven Operating LLC 492.0 06/07/16 Chapter 11 Filing Energy Subtotal 492.0 July 2016 FTS International Inc. 46.2 07/01/16 Distressed Exchange Energy Transtar Holding Co. 540.0 07/08/16 Missed Payment Automotive C&J Energy Services Ltd 1,049.4 07/20/16 Chapter 11 Filing Energy Atinum Midcon I LLC 100.0 07/22/16 Chapter 11 Filing Energy Atlas Resource Partners LP/Atlas Energy LP 315.0 07/27/16 Chapter 11 Filing Energy Subtotal 2,050.6 August 2016 Templar Energy LLC 1,450.0 08/05/16 Missed Payment Energy Stallion Oilfield Holding Inc. 328.0 08/14/16 Missed Payment Energy Foresight Energy LP 297.8 08/30/16 Restructuring Metals & Mining Subtotal 2,075.8 September 2016 No Default Activity
October 2016 Tervita Corp. 244.6 10/18/16 Chapter 15 Filing Services & Miscellaneous
Key Energy Services Inc. 289.7 10/24/16 Chapter 11 Filing Energy Performance Sports Group Ltd. 330.5 10/31/16 Chapter 11 Filing Consumer Products Subtotal 864.7
November 2016 Bennu Oil & Gas LLC 487.0 11/30/16 Chapter 7 Filing Energy Subtotal 487.0
Source: Fitch U.S. Leveraged Loan Default Index.
U.S. SECONDARY MARKET BID LEVELS
90.0
92.0
94.0
96.0
98.0
100.0
102.0
Jan-
11
Mar
-11
May
-11
Jul-1
1 Se
p-11
N
ov-1
1 Ja
n-12
M
ar-1
2 M
ay-1
2 Ju
l-12
Sep-
12
Nov
-12
Jan-
13
Mar
-13
May
-13
Jul-1
3 Se
p-13
N
ov-1
3 Ja
n-14
M
ar-1
4 M
ay-1
4 Ju
l-14
Sep-
14
Nov
-14
Jan-
15
Mar
-15
May
-15
Jul-1
5 Se
p-15
N
ov-1
5 Ja
n-16
M
ar-1
6 M
ay-1
6 Ju
l-16
Sep-
16
Nov
-16
Avg
. Bid
(% o
f par
)
Multi-quote Inst. TLs All Inst. TLs SMi100
Leveraged Loan Monthly - November 2016
24
U.S. SECONDARY MARKET AVERAGE BID
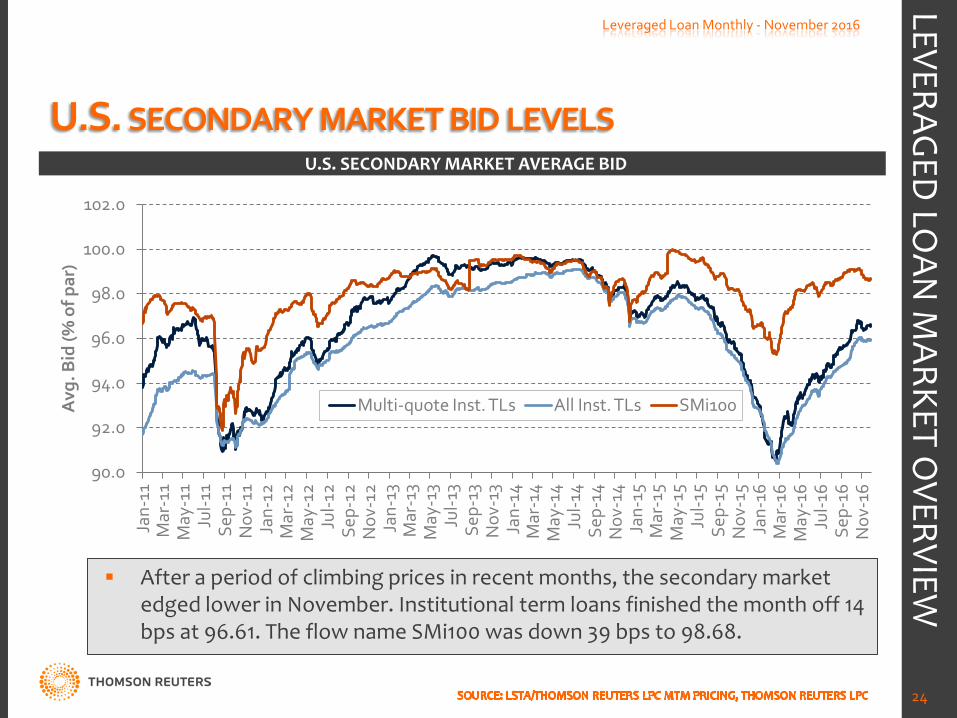
After a period of climbing prices in recent months, the secondary market edged lower in November. Institutional term loans finished the month off 14 bps at 96.61. The flow name SMi100 was down 39 bps to 98.68.
LEVERAGED
LOAN
MARKET O
VERVIEW
DISTRIBUTION OF SECONDARY MARKET BIDS
0%
10%
20%
30%
40%
50%
60%
<70 70 to <80 80 to <85 85 to <90 90 to <95 95 to <98 98 to <99 99 to <100 100 to <101
>=101
Shar
e of
loan
s / d
olla
r vol
ume
Avg. bid (% of par)
# of loans $ weighted
Leveraged Loan Monthly - November 2016
25
MULTI-QUOTE INSTITUTIONAL TERM LOAN BIDS
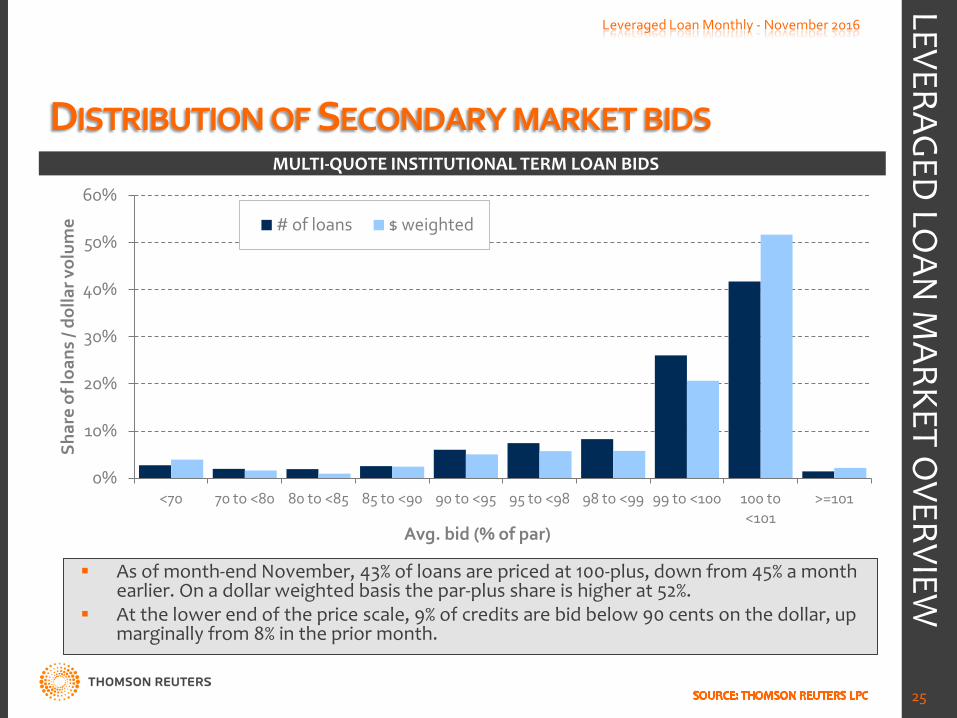
As of month-end November, 43% of loans are priced at 100-plus, down from 45% a month earlier. On a dollar weighted basis the par-plus share is higher at 52%.
At the lower end of the price scale, 9% of credits are bid below 90 cents on the dollar, up marginally from 8% in the prior month.
LEVERAGED
LOAN
MARKET O
VERVIEW
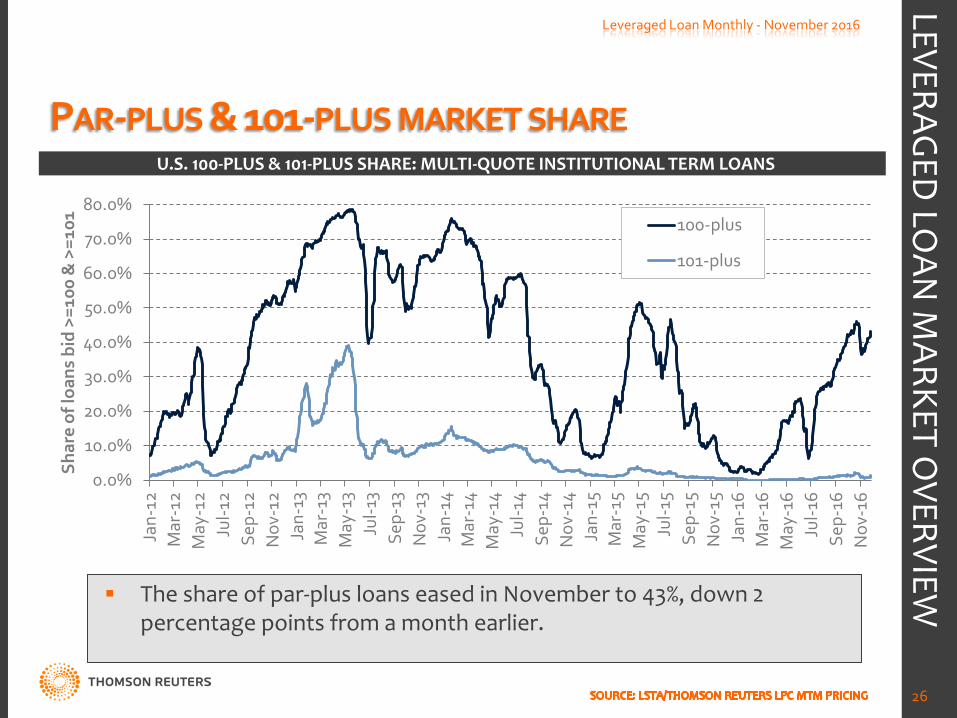
PAR-PLUS & 101-PLUS MARKET SHARE
0.0%
10.0%
20.0%
30.0%
40.0%
50.0%
60.0%
70.0%
80.0%
Jan-
12
Mar
-12
May
-12
Jul-1
2 Se
p-12
N
ov-1
2 Ja
n-13
M
ar-1
3 M
ay-1
3 Ju
l-13
Sep-
13
Nov
-13
Jan-
14
Mar
-14
May
-14
Jul-1
4 Se
p-14
N
ov-1
4 Ja
n-15
M
ar-1
5 M
ay-1
5 Ju
l-15
Sep-
15
Nov
-15
Jan-
16
Mar
-16
May
-16
Jul-1
6 Se
p-16
N
ov-1
6
Shar
e of
loan
s bi
d >=
100
& >
=101
100-plus
101-plus
Leveraged Loan Monthly - November 2016
26
U.S. 100-PLUS & 101-PLUS SHARE: MULTI-QUOTE INSTITUTIONAL TERM LOANS
The share of par-plus loans eased in November to 43%, down 2 percentage points from a month earlier.
LEVERAGED
LOAN
MARKET O
VERVIEW
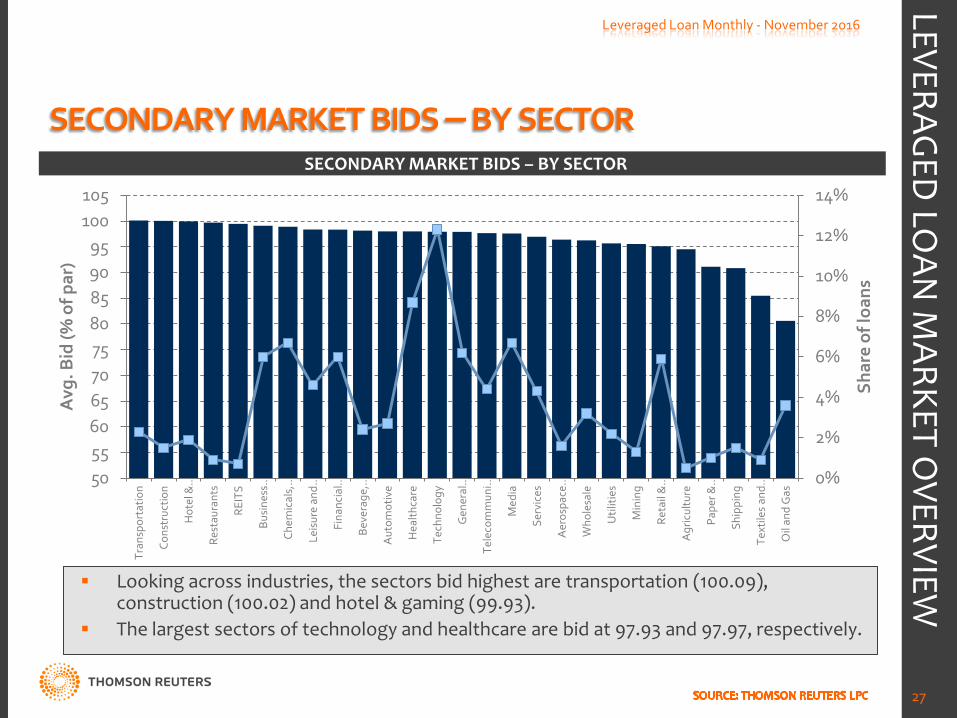
SECONDARY MARKET BIDS – BY SECTOR
0%
2%
4%
6%
8%
10%
12%
14%
50 55 60 65 70 75 80 85 90 95
100 105
Tran
spor
tatio
n
Cons
truc
tion
Hot
el &
…
Rest
aura
nts
REIT
S
Bus
ines
s …
Chem
ical
s, …
Leis
ure
and …
Fina
ncia
l …
Bev
erag
e, …
Aut
omot
ive
Hea
lthca
re
Tech
nolo
gy
Gen
eral
…
Tele
com
mun
i…
Med
ia
Serv
ices
Aer
ospa
ce …
Who
lesa
le
Util
ities
Min
ing
Reta
il &
…
Agr
icul
ture
Pape
r & …
Ship
ping
Text
iles
and …
Oil
and
Gas
Shar
e of
loan
s
Avg
. Bid
(% o
f par
)
Leveraged Loan Monthly - November 2016
27
SECONDARY MARKET BIDS – BY SECTOR
Looking across industries, the sectors bid highest are transportation (100.09), construction (100.02) and hotel & gaming (99.93).
The largest sectors of technology and healthcare are bid at 97.93 and 97.97, respectively.
LEVERAGED
LOAN
MARKET O
VERVIEW
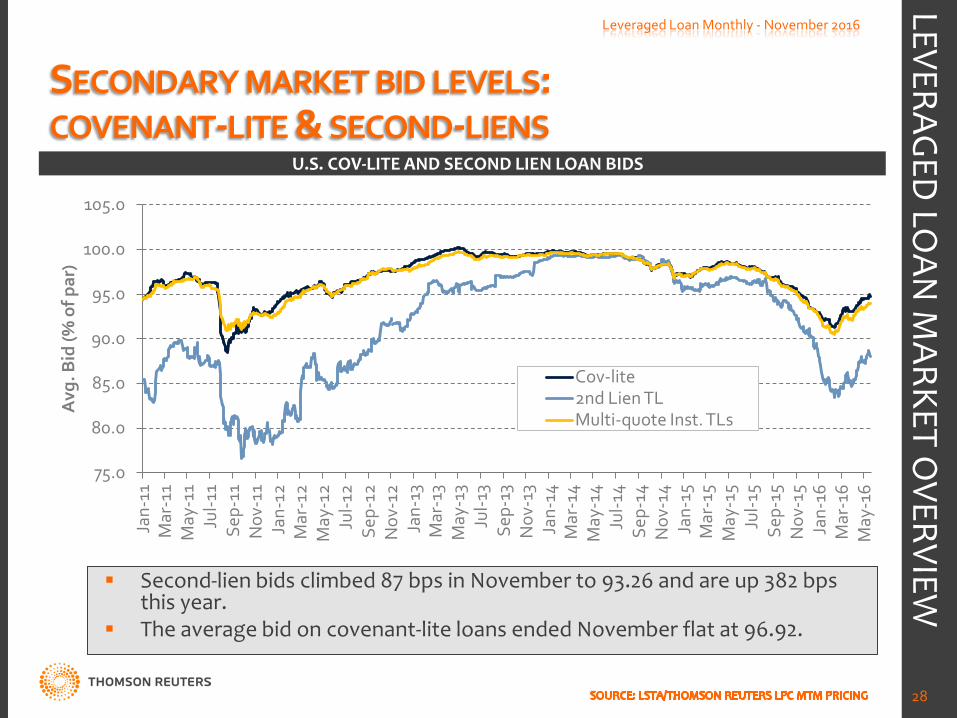
SECONDARY MARKET BID LEVELS: COVENANT-LITE & SECOND-LIENS
75.0
80.0
85.0
90.0
95.0
100.0
105.0
Jan-
11
Mar
-11
May
-11
Jul-1
1 Se
p-11
N
ov-1
1 Ja
n-12
M
ar-1
2 M
ay-1
2 Ju
l-12
Sep-
12
Nov
-12
Jan-
13
Mar
-13
May
-13
Jul-1
3 Se
p-13
N
ov-1
3 Ja
n-14
M
ar-1
4 M
ay-1
4 Ju
l-14
Sep-
14
Nov
-14
Jan-
15
Mar
-15
May
-15
Jul-1
5 Se
p-15
N
ov-1
5 Ja
n-16
M
ar-1
6 M
ay-1
6
Avg
. Bid
(% o
f par
)
Cov-lite 2nd Lien TL Multi-quote Inst. TLs
Leveraged Loan Monthly - November 2016
28
U.S. COV-LITE AND SECOND LIEN LOAN BIDS
Second-lien bids climbed 87 bps in November to 93.26 and are up 382 bps this year.
The average bid on covenant-lite loans ended November flat at 96.92.
LEVERAGED
LOAN
MARKET O
VERVIEW
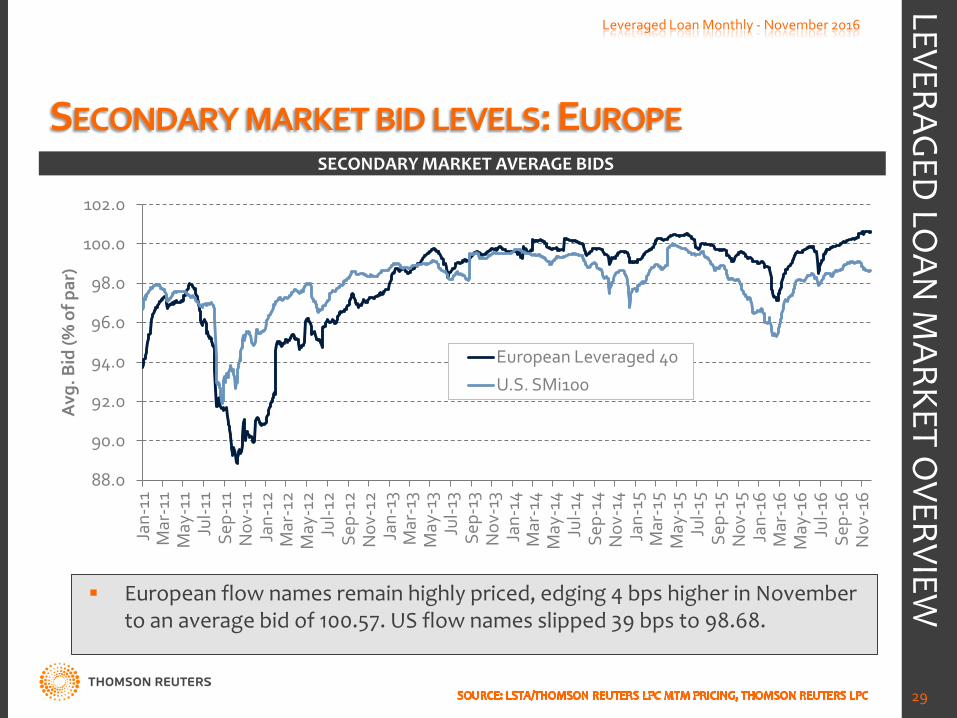
SECONDARY MARKET BID LEVELS: EUROPE
88.0
90.0
92.0
94.0
96.0
98.0
100.0
102.0
Jan-
11
Mar
-11
May
-11
Jul-1
1 Se
p-11
N
ov-1
1 Ja
n-12
M
ar-1
2 M
ay-1
2 Ju
l-12
Sep-
12
Nov
-12
Jan-
13
Mar
-13
May
-13
Jul-1
3 Se
p-13
N
ov-1
3 Ja
n-14
M
ar-1
4 M
ay-1
4 Ju
l-14
Sep-
14
Nov
-14
Jan-
15
Mar
-15
May
-15
Jul-1
5 Se
p-15
N
ov-1
5 Ja
n-16
M
ar-1
6 M
ay-1
6 Ju
l-16
Sep-
16
Nov
-16
Avg
. Bid
(% o
f par
)
European Leveraged 40
U.S. SMi100
Leveraged Loan Monthly - November 2016
29
SECONDARY MARKET AVERAGE BIDS
European flow names remain highly priced, edging 4 bps higher in November to an average bid of 100.57. US flow names slipped 39 bps to 98.68.
LEVERAGED
LOAN
MARKET O
VERVIEW

U.S. HIGH YIELD BOND MARKET OVERVIEW
HIGH YIELD BOND ISSUANCE
0
10
20
30
40
50
60
70
80
90
100
0
10
20
30
40
50
60
Jan-
10
Mar
-10
May
-10
Jul-1
0 Se
p-10
N
ov-1
0 Ja
n-11
M
ar-1
1 M
ay-1
1 Ju
l-11
Sep-
11
Nov
-11
Jan-
12
Mar
-12
May
-12
Jul-1
2 Se
p-12
N
ov-1
2 Ja
n-13
M
ar-1
3 M
ay-1
3 Ju
l-13
Sep-
13
Nov
-13
Jan-
14
Mar
-14
May
-14
Jul-1
4 Se
p-14
N
ov-1
4 Ja
n-15
M
ar-1
5 M
ay-1
5 Ju
l-15
Sep-
15
Nov
-15
Jan-
16
Mar
-16
May
-16
Jul-1
6 Se
p-16
N
ov-1
6
# o
f Iss
ues
Pro
ceed
s (U
S$ B
ils.)
Proceeds (US$ Bils.)
# of Issues
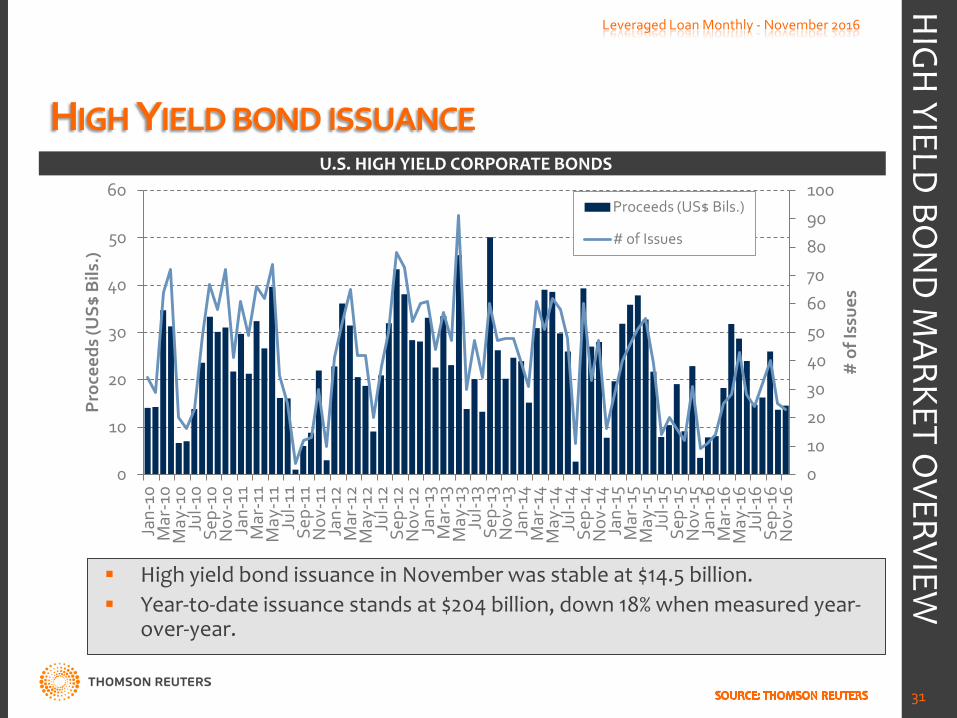
Leveraged Loan Monthly - November 2016
31
U.S. HIGH YIELD CORPORATE BONDS
High yield bond issuance in November was stable at $14.5 billion. Year-to-date issuance stands at $204 billion, down 18% when measured year-
over-year.
HIG
H YIELD
BON
D M
ARKET OVERVIEW
HIGH YIELD BONDS ISSUANCE - YTD BY INDUSTRY
0
10
20
30
40
50
60
0.0
5.0
10.0
15.0
20.0
25.0
30.0
35.0
40.0 Fi
nanc
ials
Med
ia a
nd
Ente
rtai
nmen
t
Ener
gy a
nd
Pow
er
Mat
eria
ls
Indu
stria
ls
Hea
lthca
re
Hig
h Te
chno
logy
Tele
com
mun
icat
ions
Reta
il
Cons
umer
St
aple
s
Cons
umer
Pr
oduc
ts
Real
Est
ate
# o
f Iss
ues
Pro
ceed
s (U
S$ B
ils.)
Proceeds (US$ Bils.)
# of Issues
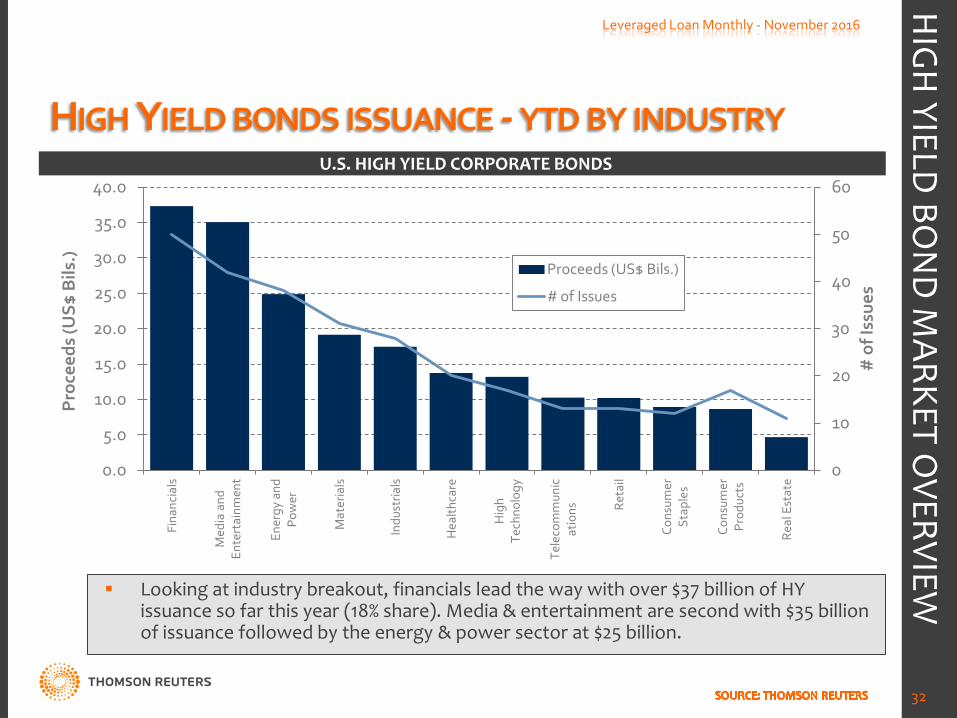
Leveraged Loan Monthly - November 2016
32
U.S. HIGH YIELD CORPORATE BONDS
Looking at industry breakout, financials lead the way with over $37 billion of HY issuance so far this year (18% share). Media & entertainment are second with $35 billion of issuance followed by the energy & power sector at $25 billion.
HIG
H YIELD
BON
D M
ARKET OVERVIEW
HIGH YIELD BONDS ISSUANCE - YTD BY SUB-INDUSTRY
5
10
15
20
25
30
0.0
5.0
10.0
15.0
20.0
25.0
Oth
er …
O
il &
Gas
Ca
ble
Cred
it …
Met
als
& …
H
ealth
care
…
Food
and
…
Pow
er
Food
& …
Co
ntai
ners
& …
Ca
sino
s &
…
Com
pute
rs &
…
Mac
hine
ry
Aut
omob
iles …
Br
oadc
astin
g Bu
ildin
g/Co
n…
Tele
com
mun
…
Mot
ion …
Pr
ofes
sion
al …
Sp
ace
and …
O
ther
…
Hos
pita
ls
Hot
els
and …
H
ealth
care
…
Adv
ertis
ing
& …
Se
mic
ondu
ct…
Ch
emic
als
Text
iles
& …
So
ftw
are
Aer
ospa
ce &
…
Cons
truc
tion …
Tr
ansp
orta
ti…
Oth
er R
etai
ling
Brok
erag
e Pi
pelin
es
Ass
et …
Ph
arm
aceu
ti…
AFI
NA
NCE
E-
com
mer
ce …
RE
ITs
Oth
er T
elec
om
Oth
er R
eal …
Re
al E
stat
e …
Wire
less
H
ome …
W
ater
and
…
Publ
ishi
ng
Insu
ranc
e In
tern
et …
H
ome …
IT
Con
sulti
ng …
A
ppar
el …
Ed
ucat
iona
l …
Oth
er …
Pa
per &
…
Toba
cco
# o
f Iss
ues
Pro
ceed
s (U
S$ B
ils.)
Proceeds (US$ Bils.)
# of Issues
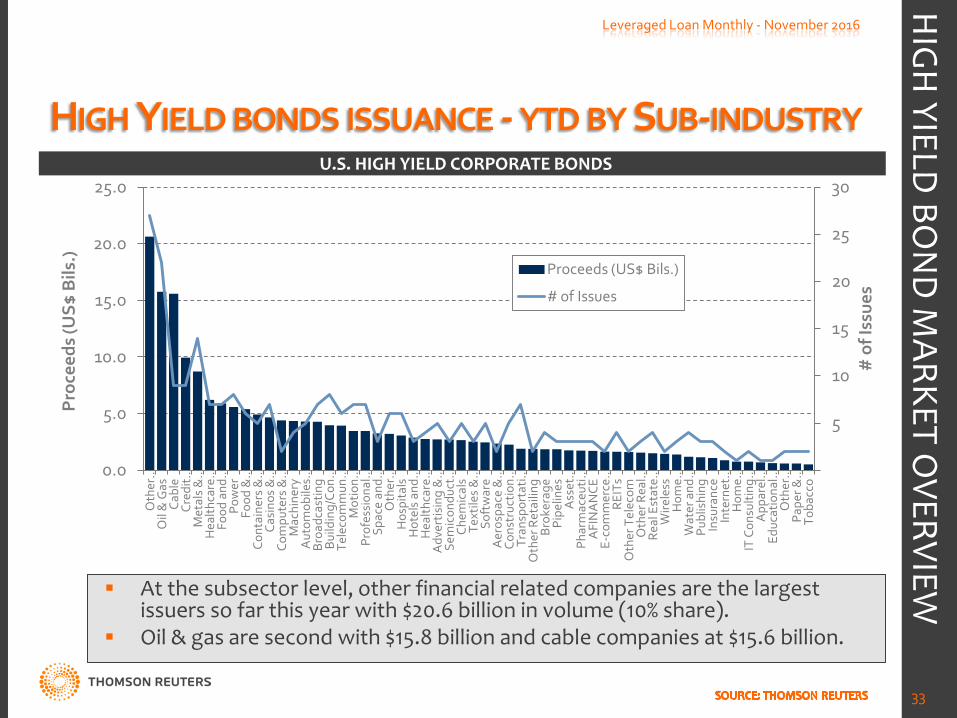
Leveraged Loan Monthly - November 2016
33
U.S. HIGH YIELD CORPORATE BONDS
At the subsector level, other financial related companies are the largest issuers so far this year with $20.6 billion in volume (10% share).
Oil & gas are second with $15.8 billion and cable companies at $15.6 billion.
HIG
H YIELD
BON
D M
ARKET OVERVIEW
HIGH YIELD BOND ISSUANCE – YTD BY RATING
10
20
30
40
50
60
70
80
0.0
10.0
20.0
30.0
40.0
50.0
60.0
BB+ BB BB- B+ B B- CCC+ CCC CCC- C NR
# o
f Iss
ues
Pro
ceed
s (U
S$ B
ils.)
Proceeds (US$ Bils.)
# of Issues
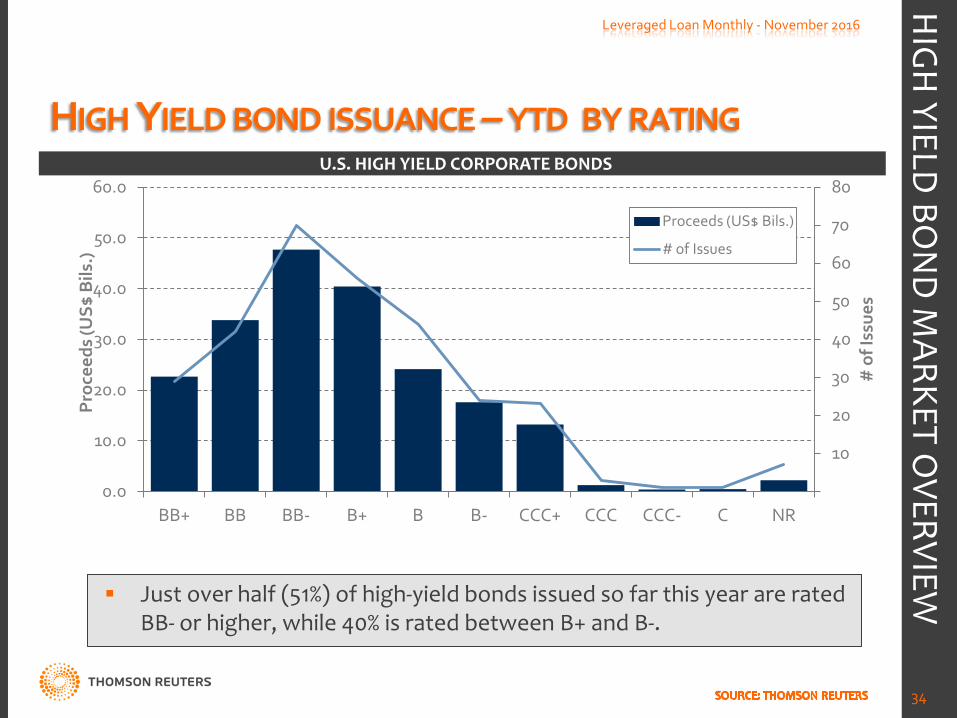
Leveraged Loan Monthly - November 2016
34
U.S. HIGH YIELD CORPORATE BONDS
Just over half (51%) of high-yield bonds issued so far this year are rated BB- or higher, while 40% is rated between B+ and B-.
HIG
H YIELD
BON
D M
ARKET OVERVIEW
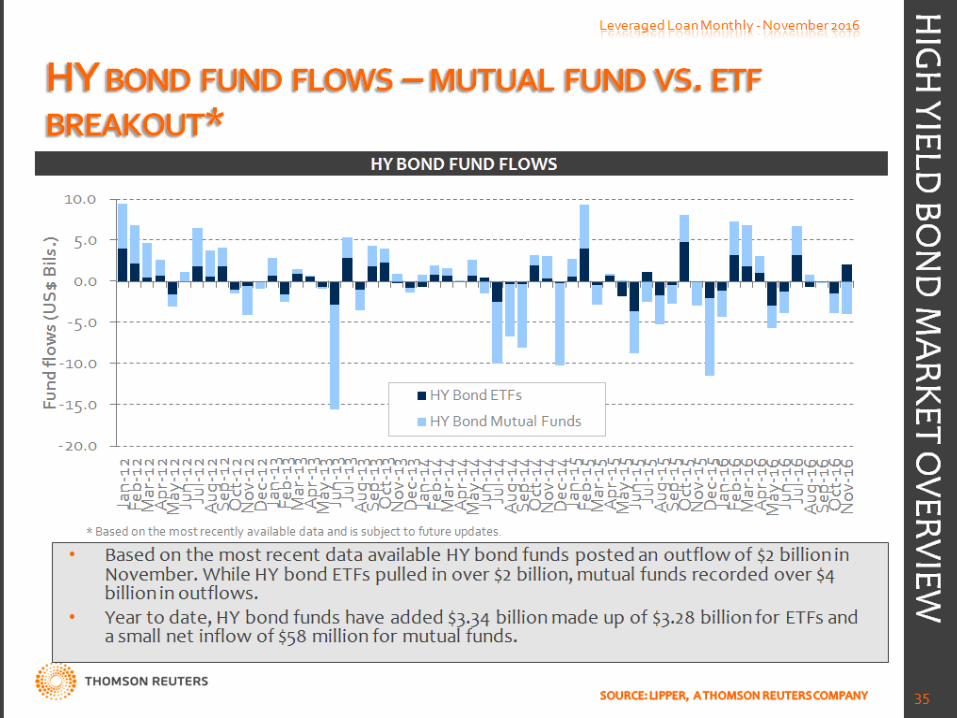
HY BOND FUND FLOWS – MUTUAL FUND VS. ETF BREAKOUT*
Leveraged Loan Monthly - November 2016
35
HY BOND FUND FLOWS
• Based on the most recent data available HY bond funds posted an outflow of $2 billion in November. While HY bond ETFs pulled in over $2 billion, mutual funds recorded over $4 billion in outflows.
• Year to date, HY bond funds have added $3.34 billion made up of $3.28 billion for ETFs and a small net inflow of $58 million for mutual funds.
HIG
H YIELD
BON
D M
ARKET OVERVIEW
* Based on the most recently available data and is subject to future updates.

INVESTOR OVERVIEW
U.S. CLO ASSETS UNDER MANAGEMENT
500 550 600 650 700 750 800 850 900 950 1,000 1,050 1,100
150 170 190 210 230 250 270 290 310 330 350 370 390 410 430 450
Jan-
13
Apr
-13
Jul-1
3
Oct
-13
Jan-
14
Apr
-14
Jul-1
4
Oct
-14
Jan-
15
Apr
-15
Jul-1
5
Oct
-15
Jan-
16
Apr
-16
Jul-1
6
Oct
-16
Num
ber o
f CLO
s in
sam
ple
CLO
Agg
rega
te P
rinc
ipal
B
alan
ce ($
Bils
.)
CLO APB Number of CLOs
Leveraged Loan Monthly - November 2016
37
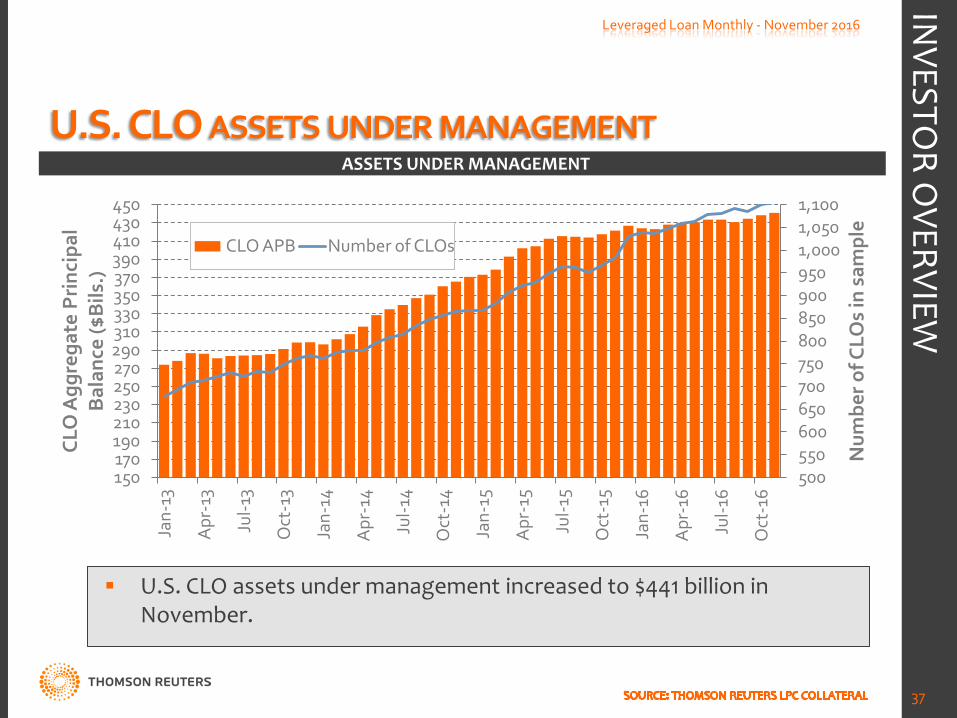
ASSETS UNDER MANAGEMENT
U.S. CLO assets under management increased to $441 billion in November.
INVESTO
R OVERVIEW
LOAN FUNDS AUM
0 20 40 60 80
100 120 140 160 180 200
Jan-
07
Jun-
07
Nov
-07
Apr
-08
Sep-
08
Feb-
09
Jul-0
9
Dec
-09
May
-10
Oct
-10
Mar
-11
Aug
-11
Jan-
12
Jun-
12
Nov
-12
Apr
-13
Sep-
13
Feb-
14
Jul-1
4
Dec
-14
May
-15
Oct
-15
Mar
-16
Aug
-16
Loan
mut
ual f
und
& E
TF A
UM
($
Bils
.)
Leveraged Loan Monthly - November 2016
38
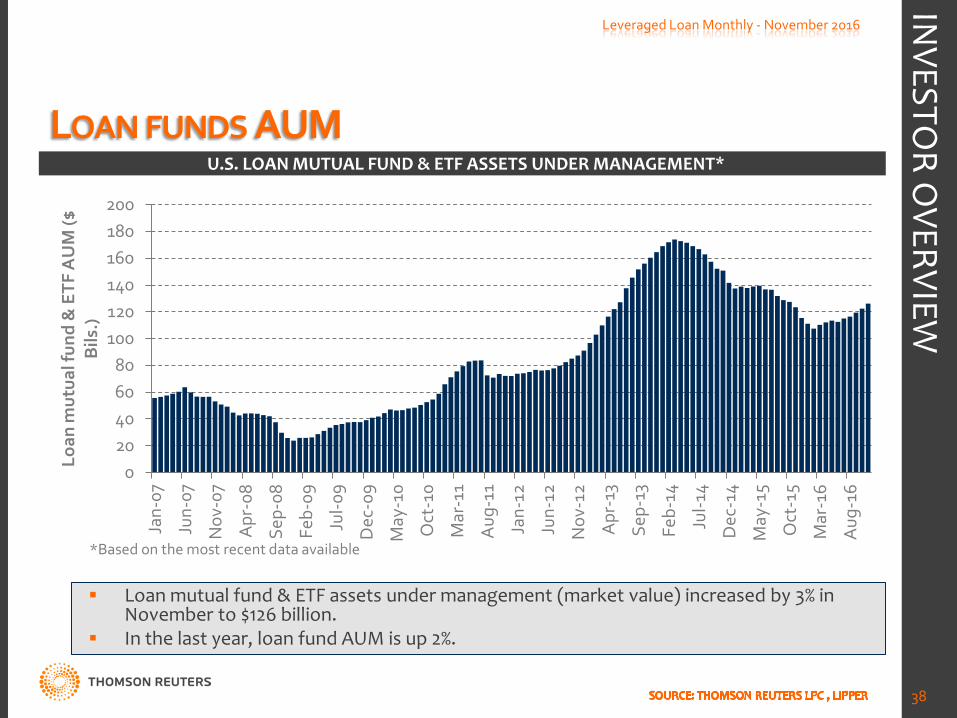
U.S. LOAN MUTUAL FUND & ETF ASSETS UNDER MANAGEMENT*
Loan mutual fund & ETF assets under management (market value) increased by 3% in November to $126 billion.
In the last year, loan fund AUM is up 2%.
INVESTO
R OVERVIEW
*Based on the most recent data available
INVESTOR SHARE OF INSTITUTIONAL LOAN OUTSTANDINGS
10%
15%
20%
25%
30%
35%
40%
45%
50%
55%
Aug
-12
Nov
-12
Feb-
13
May
-13
Aug
-13
Nov
-13
Feb-
14
May
-14
Aug
-14
Nov
-14
Feb-
15
May
-15
Aug
-15
Nov
-15
Feb-
16
May
-16
Aug
-16
Nov
-16
Inve
stor
sha
re o
f ins
titu
tion
al lo
an
outs
tand
ings
(%)
CLOs
Loan Funds (mutual funds & ETFs)
Other
Leveraged Loan Monthly - November 2016
39
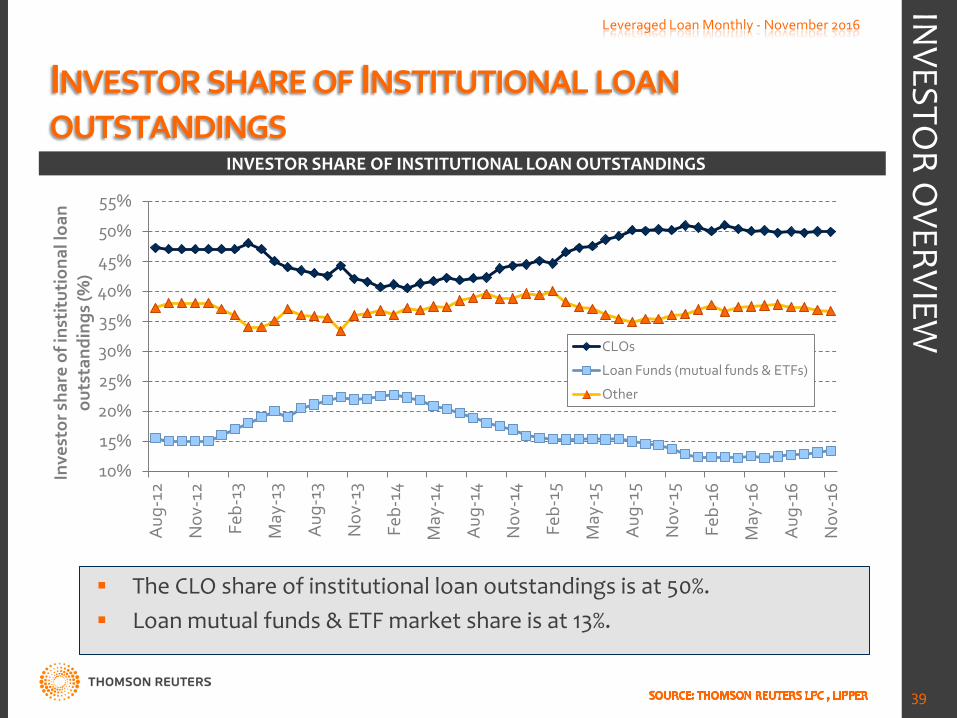
INVESTOR SHARE OF INSTITUTIONAL LOAN OUTSTANDINGS
The CLO share of institutional loan outstandings is at 50%. Loan mutual funds & ETF market share is at 13%.
INVESTO
R OVERVIEW
CLO ISSUANCE VS. LOAN FUND FLOWS -MONTHLY
-8.0 -6.0 -4.0 -2.0 0.0 2.0 4.0 6.0 8.0
10.0 12.0 14.0 16.0 18.0 20.0
Jan-
12
Mar
-12
May
-12
Jul-1
2 Se
p-12
N
ov-1
2 Ja
n-13
M
ar-1
3 M
ay-1
3 Ju
l-13
Sep-
13
Nov
-13
Jan-
14
Mar
-14
May
-14
Jul-1
4 Se
p-14
N
ov-1
4 Ja
n-15
M
ar-1
5 M
ay-1
5 Ju
l-15
Sep-
15
Nov
-15
Jan-
16
Mar
-16
May
-16
Jul-1
6 Se
p-16
N
ov-1
6
$ B
ils.
CLO Issuance Loan fund flows
Leveraged Loan Monthly - November 2016
40
MONTHLY CLO ISSUANCE VS. LOAN FUND FLOWS
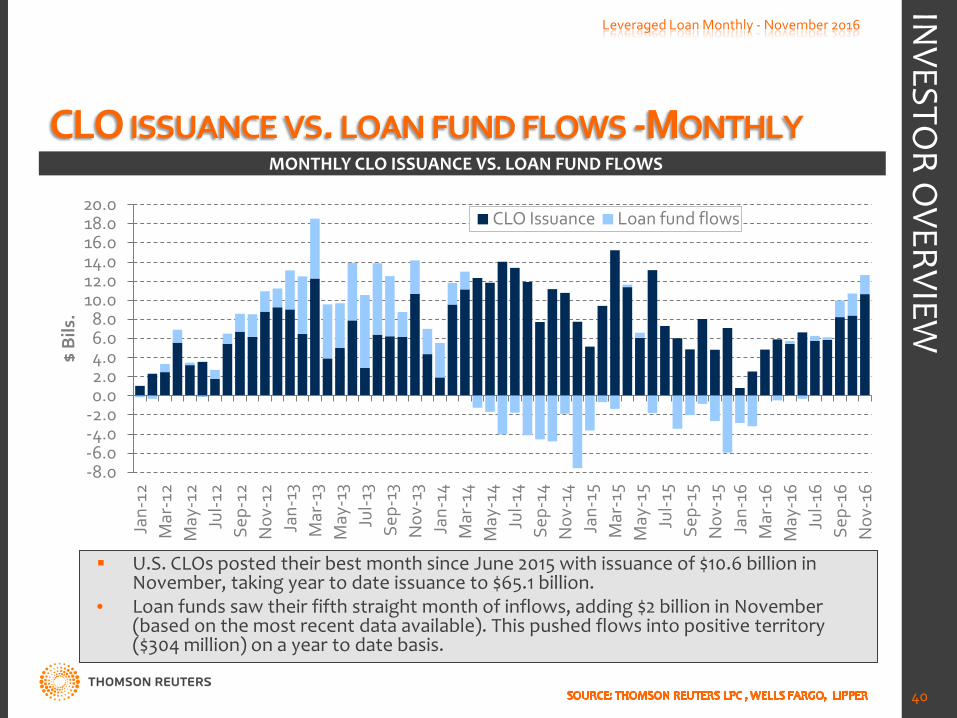
U.S. CLOs posted their best month since June 2015 with issuance of $10.6 billion in November, taking year to date issuance to $65.1 billion.
• Loan funds saw their fifth straight month of inflows, adding $2 billion in November (based on the most recent data available). This pushed flows into positive territory ($304 million) on a year to date basis.
INVESTO
R OVERVIEW
CLO MARKET ANALYSIS*
*Based on the most recently available data in Thomson Reuters LPC Collateral
U.S. CLO ISSUANCE - MONTHLY
0
5
10
15
20
25
30
0.0
2.0
4.0
6.0
8.0
10.0
12.0
14.0
16.0
Jan-
11
Mar
-11
May
-11
Jul-1
1 Se
p-11
N
ov-1
1 Ja
n-12
M
ar-1
2 M
ay-1
2 Ju
l-12
Sep-
12
Nov
-12
Jan-
13
Mar
-13
May
-13
Jul-1
3 Se
p-13
N
ov-1
3 Ja
n-14
M
ar-1
4 M
ay-1
4 Ju
l-14
Sep-
14
Nov
-14
Jan-
15
Mar
-15
May
-15
Jul-1
5 Se
p-15
N
ov-1
5 Ja
n-16
M
ar-1
6 M
ay-1
6 Ju
l-16
Sep-
16
Nov
-16
Num
ber o
f CLO
s is
sued
CLO
Issu
ance
($B
ils.)
Issuance ($Bils.)
Count
Leveraged Loan Monthly - November 2016
42
CLO ISSUANCE
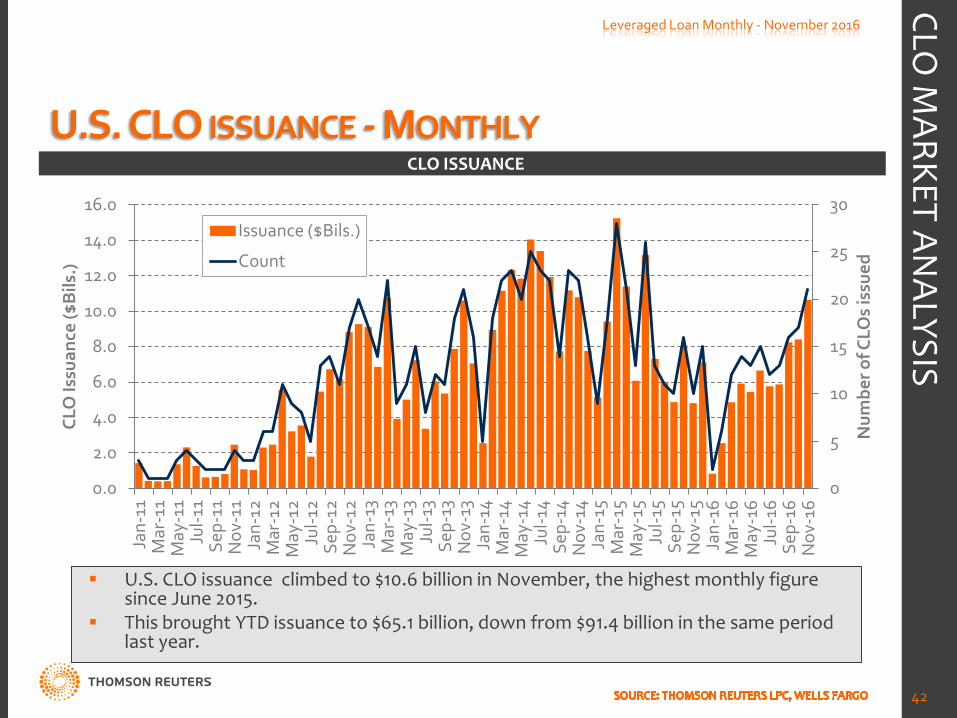
U.S. CLO issuance climbed to $10.6 billion in November, the highest monthly figure since June 2015.
This brought YTD issuance to $65.1 billion, down from $91.4 billion in the same period last year.
CLO M
ARKET ANALYSIS
U.S. CLO REFINANCINGS & RESETS
0
2
4
6
8
10
12
Jan-16 Feb-16 Mar-16 Apr-16 May-16 Jun-16 Jul-16 Aug-16 Sep-16 Oct-16 Nov-16
$ B
ils.
Leveraged Loan Monthly - November 2016
43
U.S. CLO REFINANCINGS & RESETS
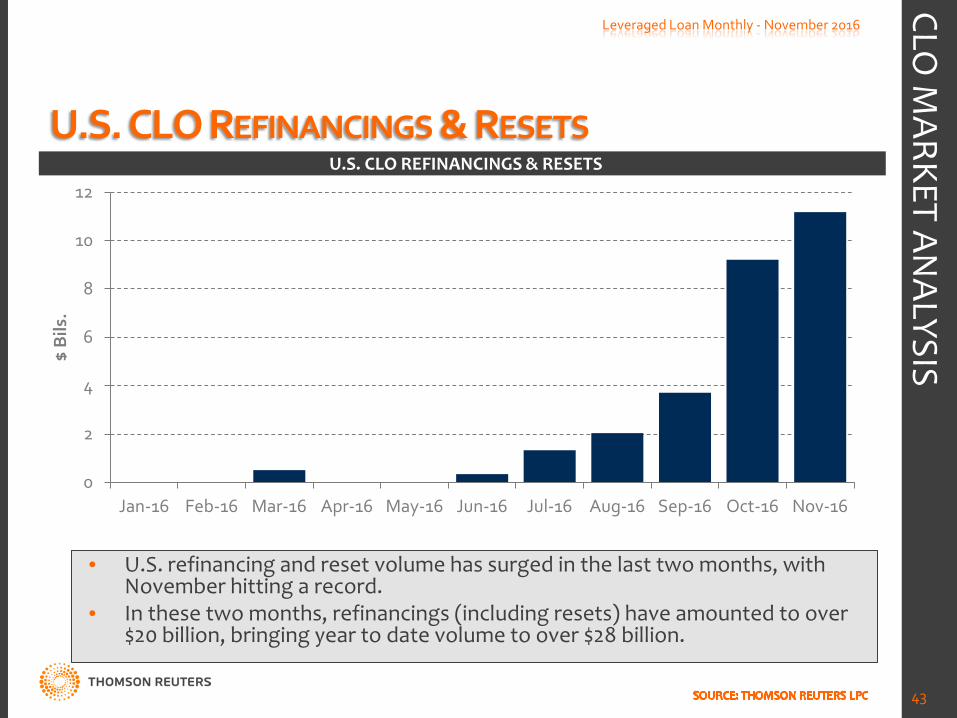
• U.S. refinancing and reset volume has surged in the last two months, with November hitting a record.
• In these two months, refinancings (including resets) have amounted to over $20 billion, bringing year to date volume to over $28 billion.
CLO M
ARKET ANALYSIS
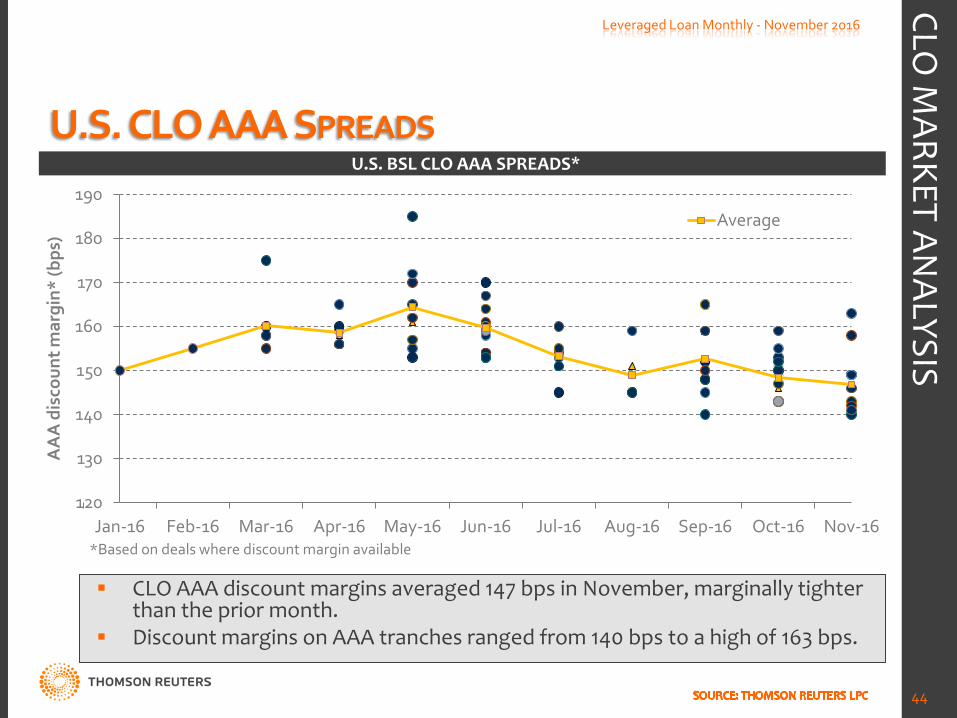
U.S. CLO AAA SPREADS
120
130
140
150
160
170
180
190
Jan-16 Feb-16 Mar-16 Apr-16 May-16 Jun-16 Jul-16 Aug-16 Sep-16 Oct-16 Nov-16
AA
A d
isco
unt m
argi
n* (b
ps)
Average
Leveraged Loan Monthly - November 2016
44
U.S. BSL CLO AAA SPREADS*
CLO AAA discount margins averaged 147 bps in November, marginally tighter than the prior month.
Discount margins on AAA tranches ranged from 140 bps to a high of 163 bps.
CLO M
ARKET ANALYSIS
*Based on deals where discount margin available
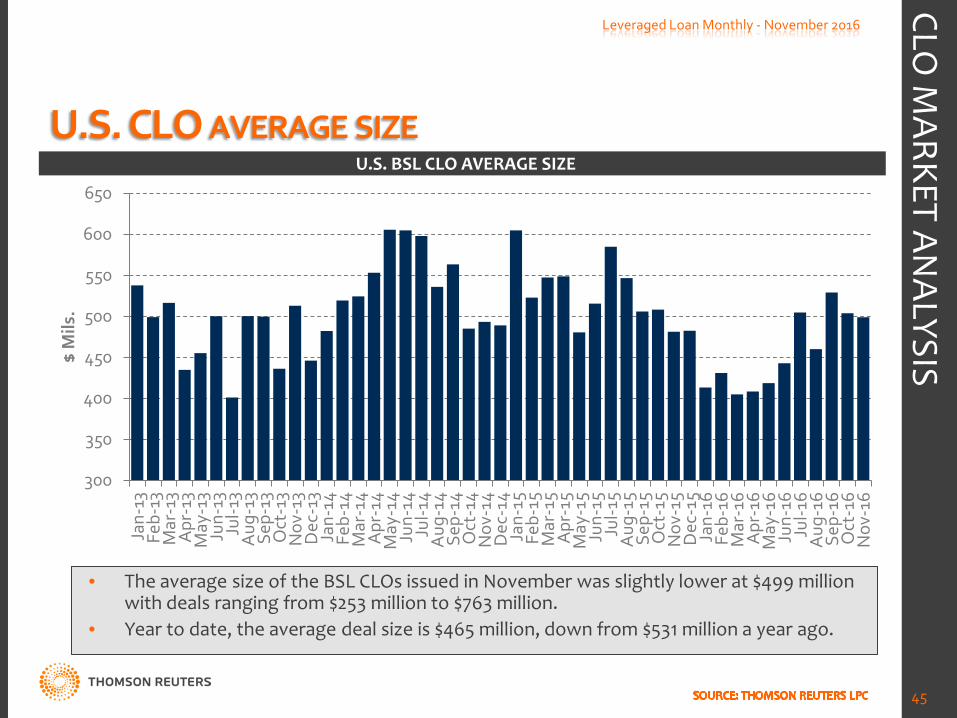
U.S. CLO AVERAGE SIZE
300
350
400
450
500
550
600
650
Jan-
13
Feb-
13
Mar
-13
Apr
-13
May
-13
Jun-
13
Jul-1
3 A
ug-1
3 Se
p-13
O
ct-1
3 N
ov-1
3 D
ec-1
3 Ja
n-14
Fe
b-14
M
ar-1
4 A
pr-1
4 M
ay-1
4 Ju
n-14
Ju
l-14
Aug
-14
Sep-
14
Oct
-14
Nov
-14
Dec
-14
Jan-
15
Feb-
15
Mar
-15
Apr
-15
May
-15
Jun-
15
Jul-1
5 A
ug-1
5 Se
p-15
O
ct-1
5 N
ov-1
5 D
ec-1
5 Ja
n-16
Fe
b-16
M
ar-1
6 A
pr-1
6 M
ay-1
6 Ju
n-16
Ju
l-16
Aug
-16
Sep-
16
Oct
-16
Nov
-16
$ M
ils.
Leveraged Loan Monthly - November 2016
45
U.S. BSL CLO AVERAGE SIZE
• The average size of the BSL CLOs issued in November was slightly lower at $499 million with deals ranging from $253 million to $763 million.
• Year to date, the average deal size is $465 million, down from $531 million a year ago.
CLO M
ARKET ANALYSIS
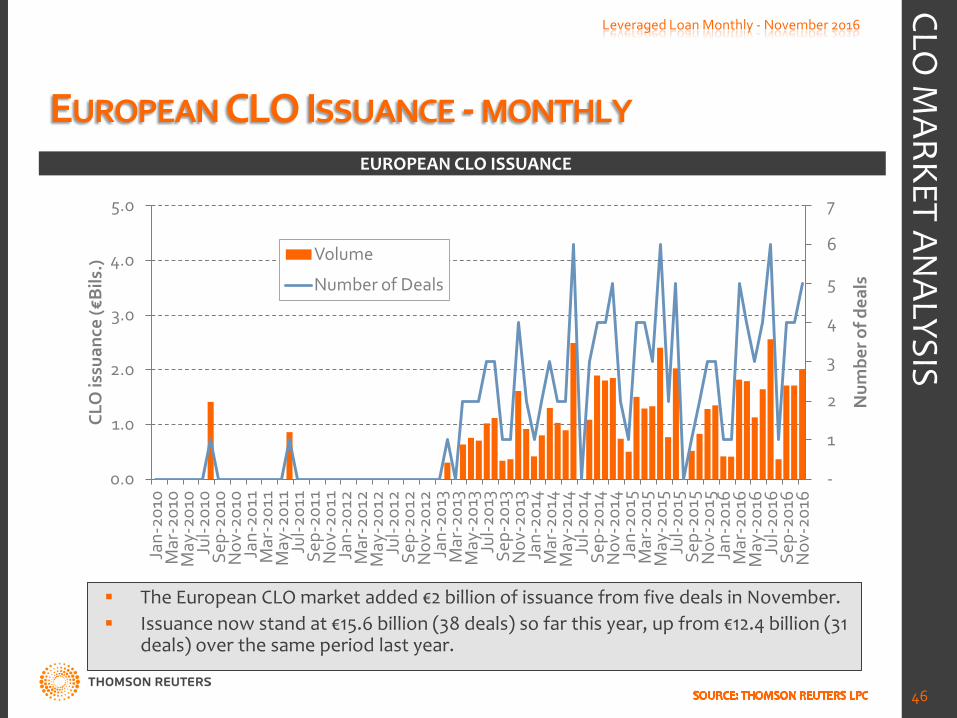
EUROPEAN CLO ISSUANCE - MONTHLY
Leveraged Loan Monthly - November 2016
46
EUROPEAN CLO ISSUANCE
The European CLO market added €2 billion of issuance from five deals in November. Issuance now stand at €15.6 billion (38 deals) so far this year, up from €12.4 billion (31
deals) over the same period last year.
CLO M
ARKET ANALYSIS
-
1
2
3
4
5
6
7
0.0
1.0
2.0
3.0
4.0
5.0
Jan-
2010
M
ar-2
010
May
-201
0 Ju
l-201
0 Se
p-20
10
Nov
-201
0 Ja
n-20
11
Mar
-201
1 M
ay-2
011
Jul-2
011
Sep-
2011
N
ov-2
011
Jan-
2012
M
ar-2
012
May
-201
2 Ju
l-201
2 Se
p-20
12
Nov
-201
2 Ja
n-20
13
Mar
-201
3 M
ay-2
013
Jul-2
013
Sep-
2013
N
ov-2
013
Jan-
2014
M
ar-2
014
May
-201
4 Ju
l-201
4 Se
p-20
14
Nov
-201
4 Ja
n-20
15
Mar
-201
5 M
ay-2
015
Jul-2
015
Sep-
2015
N
ov-2
015
Jan-
2016
M
ar-2
016
May
-201
6 Ju
l-201
6 Se
p-20
16
Nov
-201
6
Num
ber o
f dea
ls
CLO
issu
ance
(€B
ils.)
Volume
Number of Deals
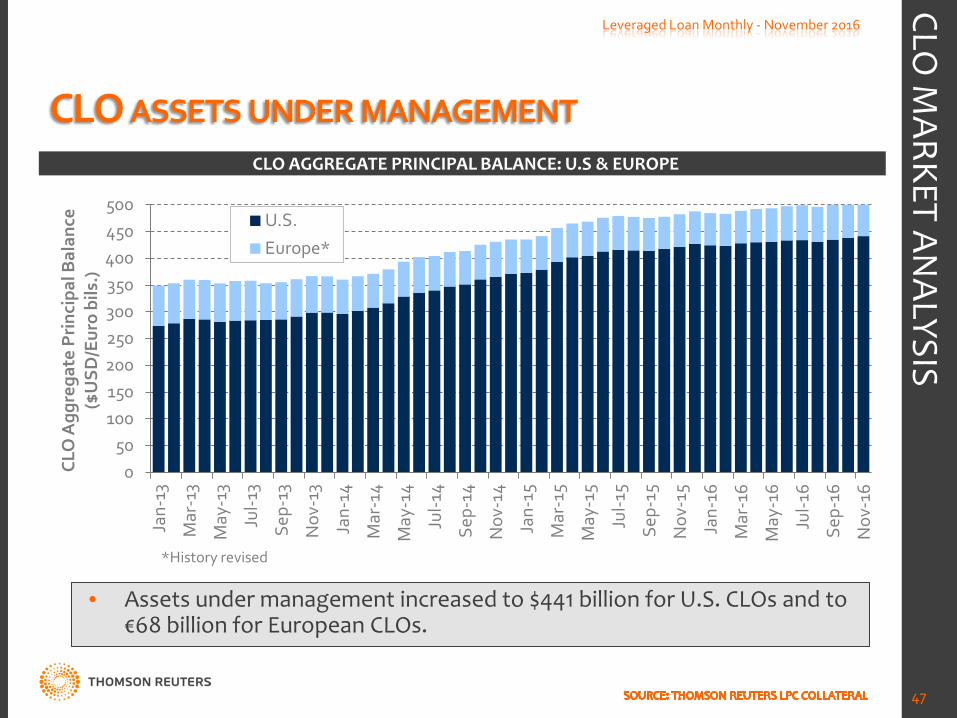
CLO ASSETS UNDER MANAGEMENT
0 50
100 150 200 250 300 350 400 450 500
Jan-
13
Mar
-13
May
-13
Jul-1
3
Sep-
13
Nov
-13
Jan-
14
Mar
-14
May
-14
Jul-1
4
Sep-
14
Nov
-14
Jan-
15
Mar
-15
May
-15
Jul-1
5
Sep-
15
Nov
-15
Jan-
16
Mar
-16
May
-16
Jul-1
6
Sep-
16
Nov
-16
CLO
Agg
rega
te P
rinc
ipal
Bal
ance
($
USD
/Eur
o bi
ls.)
U.S.
Europe*
Leveraged Loan Monthly - November 2016
47
CLO AGGREGATE PRINCIPAL BALANCE: U.S & EUROPE
• Assets under management increased to $441 billion for U.S. CLOs and to €68 billion for European CLOs.
CLO M
ARKET ANALYSIS
*History revised
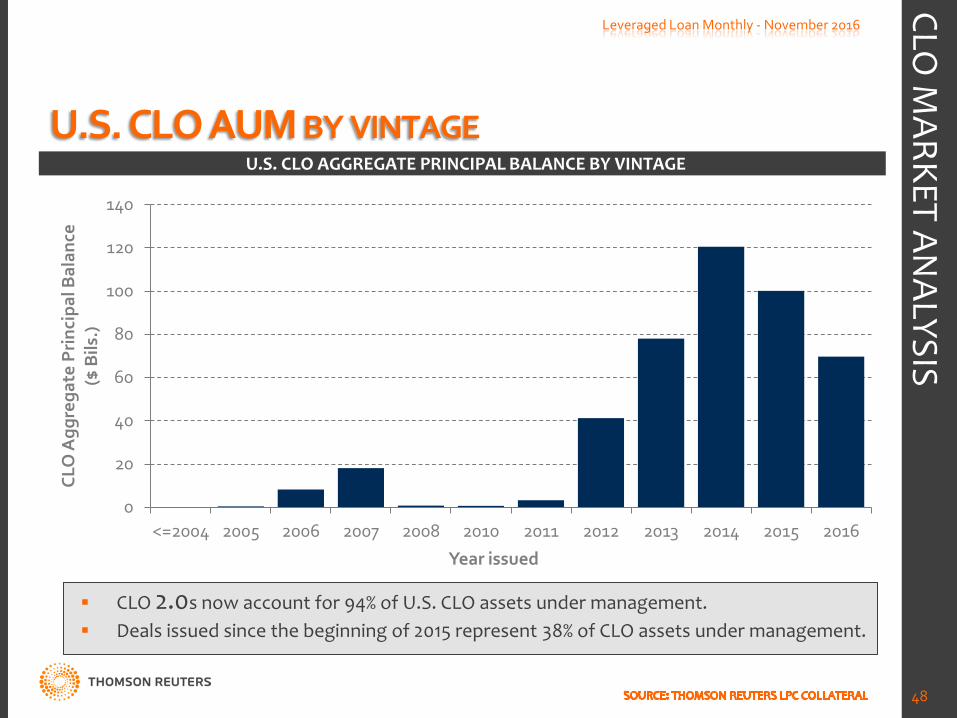
U.S. CLO AUM BY VINTAGE
0
20
40
60
80
100
120
140
<=2004 2005 2006 2007 2008 2010 2011 2012 2013 2014 2015 2016
CLO
Agg
rega
te P
rinc
ipal
Bal
ance
($
Bils
.)
48
U.S. CLO AGGREGATE PRINCIPAL BALANCE BY VINTAGE
CLO 2.0s now account for 94% of U.S. CLO assets under management. Deals issued since the beginning of 2015 represent 38% of CLO assets under management.
CLO M
ARKET ANALYSIS
Leveraged Loan Monthly - November 2016
Year issued
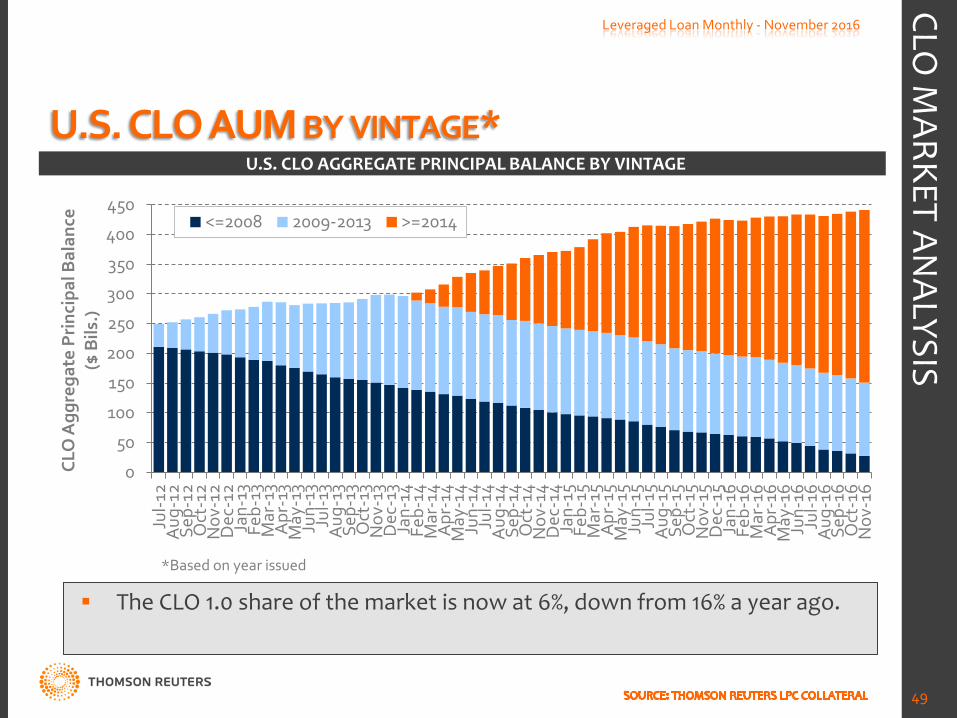
U.S. CLO AUM BY VINTAGE*
0
50
100
150
200
250
300
350
400
450
Jul-1
2 A
ug-1
2 Se
p-12
O
ct-1
2 N
ov-1
2 D
ec-1
2 Ja
n-13
Fe
b-13
M
ar-1
3 A
pr-1
3 M
ay-1
3 Ju
n-13
Ju
l-13
Aug
-13
Sep-
13
Oct
-13
Nov
-13
Dec
-13
Jan-
14
Feb-
14
Mar
-14
Apr
-14
May
-14
Jun-
14
Jul-1
4 A
ug-1
4 Se
p-14
O
ct-1
4 N
ov-1
4 D
ec-1
4 Ja
n-15
Fe
b-15
M
ar-1
5 A
pr-1
5 M
ay-1
5 Ju
n-15
Ju
l-15
Aug
-15
Sep-
15
Oct
-15
Nov
-15
Dec
-15
Jan-
16
Feb-
16
Mar
-16
Apr
-16
May
-16
Jun-
16
Jul-1
6 A
ug-1
6 Se
p-16
O
ct-1
6 N
ov-1
6
CLO
Agg
rega
te P
rinc
ipal
Bal
ance
($
Bils
.)
<=2008 2009-2013 >=2014
49
U.S. CLO AGGREGATE PRINCIPAL BALANCE BY VINTAGE
The CLO 1.0 share of the market is now at 6%, down from 16% a year ago.
CLO M
ARKET ANALYSIS
*Based on year issued
Leveraged Loan Monthly - November 2016
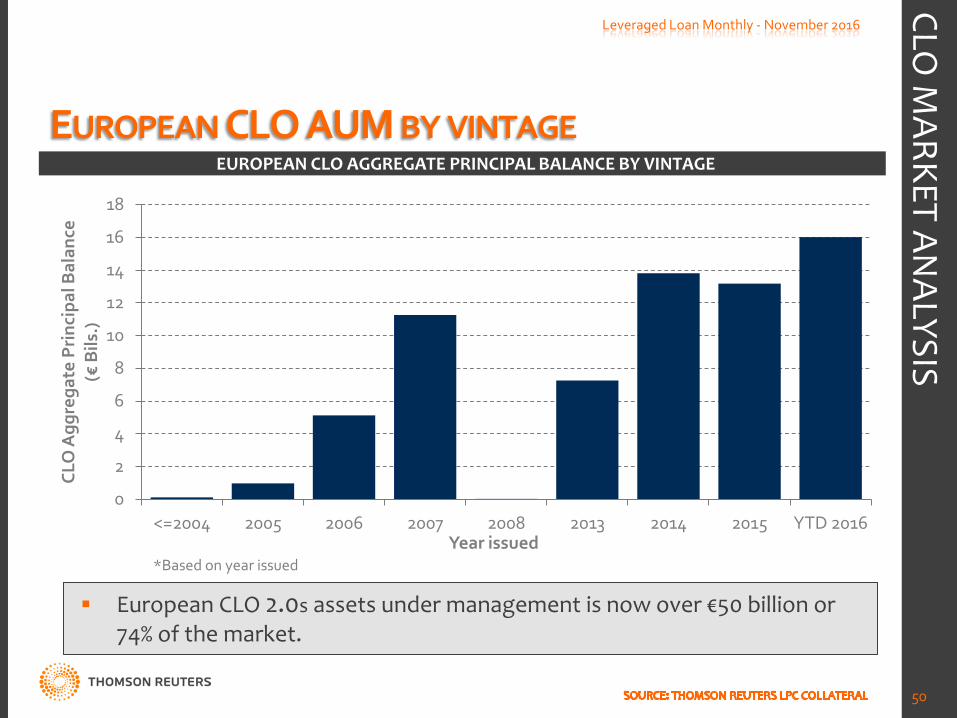
EUROPEAN CLO AUM BY VINTAGE
0
2
4
6
8
10
12
14
16
18
<=2004 2005 2006 2007 2008 2013 2014 2015 YTD 2016
CLO
Agg
rega
te P
rinc
ipal
Bal
ance
(€
Bils
.)
50
EUROPEAN CLO AGGREGATE PRINCIPAL BALANCE BY VINTAGE
European CLO 2.0s assets under management is now over €50 billion or 74% of the market.
CLO M
ARKET ANALYSIS
Leveraged Loan Monthly - November 2016
Year issued *Based on year issued
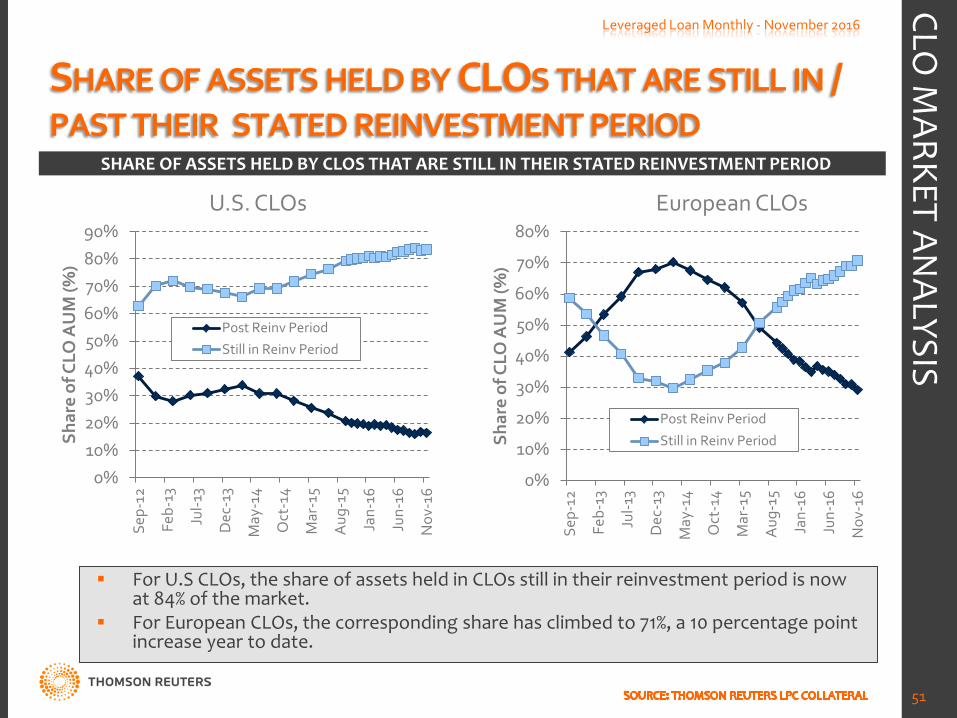
SHARE OF ASSETS HELD BY CLOS THAT ARE STILL IN / PAST THEIR STATED REINVESTMENT PERIOD
Leveraged Loan Monthly - November 2016
51
SHARE OF ASSETS HELD BY CLOS THAT ARE STILL IN THEIR STATED REINVESTMENT PERIOD
For U.S CLOs, the share of assets held in CLOs still in their reinvestment period is now at 84% of the market.
For European CLOs, the corresponding share has climbed to 71%, a 10 percentage point increase year to date.
CLO M
ARKET ANALYSIS
U.S. CLOs European CLOs
0%
10%
20%
30%
40%
50%
60%
70%
80%
Sep-
12
Feb-
13
Jul-1
3
Dec
-13
May
-14
Oct
-14
Mar
-15
Aug
-15
Jan-
16
Jun-
16
Nov
-16
Shar
e of
CLO
AU
M (%
)
Post Reinv Period
Still in Reinv Period
0% 10% 20% 30% 40% 50% 60% 70% 80% 90%
Sep-
12
Feb-
13
Jul-1
3
Dec
-13
May
-14
Oct
-14
Mar
-15
Aug
-15
Jan-
16
Jun-
16
Nov
-16
Shar
e of
CLO
AU
M (%
)
Post Reinv Period Still in Reinv Period

TOP LOAN HOLDINGS IN U.S. CLO PORTFOLIOS Leveraged Loan Monthly - November 2016
52
CLO M
ARKET ANALYSIS
-
*Excludes CLOs not yet in LPC Collateral
Rank Issuer Approx. Amount
($Bils.)* 1 Valeant Pharmaceuticals 3.19 2 Asurion Corp 2.83 3 First Data Corp 2.79 4 Dell Inc 2.62 5 Community Health 2.57 6 Transdigm 2.55 7 Albertson 2.38 8 Numericable SAS 2.15 9 Charter Communications 2.06
10 Calpine Corp 2.03 11 Avago Technologies 1.96 12 Scientific Games 1.95 13 Univision Communications 1.92 14 American Airlines 1.86 15 Ineos Group Ltd 1.63 16 Formula One Group 1.50 17 Petsmart Inc 1.44 18 WME IMG Holdings LLC 1.39 19 Royalty Pharma 1.38 20 Level 3 Communications 1.36
Rank Issuer Approx. Amount
($Bils.)*
21 Advantage Sales & Marketing 1.32
22 BMC Software 1.29 23 Travelport Inc 1.27 24 Berry Plastics Corp 1.26
25 Pharmaceutical Product Development 1.25
26 Endo Pharmaceuticals 1.24 27 Federal-Mogul Corp 1.22 28 DTZ US Borrower LLC 1.18
29 Universal Services of America LP 1.17
30 MacDermid Inc 1.17 31 Dynegy Inc 1.16 32 Energy Transfer Equity LP 1.15 33 Tribune Co 1.15 34 Infor Global Solutions 1.15 35 Fortescue Metals Group 1.15 36 Protection One 1.14 37 ACOSTA 1.13 38 Western Digital Corp 1.13 39 Sabre Holdings Corp 1.11 40 Cablevision Systems Corp 1.09
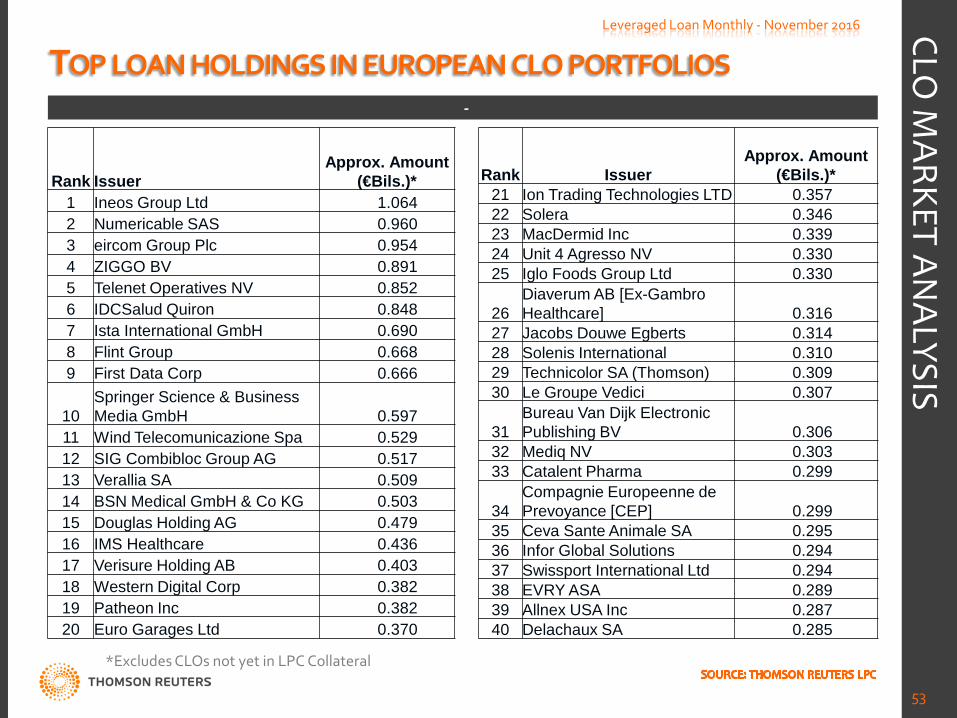
TOP LOAN HOLDINGS IN EUROPEAN CLO PORTFOLIOS Leveraged Loan Monthly - November 2016
53
CLO M
ARKET ANALYSIS
-
*Excludes CLOs not yet in LPC Collateral
Rank Issuer Approx. Amount
(€Bils.)* 1 Ineos Group Ltd 1.064 2 Numericable SAS 0.960 3 eircom Group Plc 0.954 4 ZIGGO BV 0.891 5 Telenet Operatives NV 0.852 6 IDCSalud Quiron 0.848 7 Ista International GmbH 0.690 8 Flint Group 0.668 9 First Data Corp 0.666
10 Springer Science & Business Media GmbH 0.597
11 Wind Telecomunicazione Spa 0.529 12 SIG Combibloc Group AG 0.517 13 Verallia SA 0.509 14 BSN Medical GmbH & Co KG 0.503 15 Douglas Holding AG 0.479 16 IMS Healthcare 0.436 17 Verisure Holding AB 0.403 18 Western Digital Corp 0.382 19 Patheon Inc 0.382 20 Euro Garages Ltd 0.370
Rank Issuer Approx. Amount
(€Bils.)* 21 Ion Trading Technologies LTD 0.357 22 Solera 0.346 23 MacDermid Inc 0.339 24 Unit 4 Agresso NV 0.330 25 Iglo Foods Group Ltd 0.330
26 Diaverum AB [Ex-Gambro Healthcare] 0.316
27 Jacobs Douwe Egberts 0.314 28 Solenis International 0.310 29 Technicolor SA (Thomson) 0.309 30 Le Groupe Vedici 0.307
31 Bureau Van Dijk Electronic Publishing BV 0.306
32 Mediq NV 0.303 33 Catalent Pharma 0.299
34 Compagnie Europeenne de Prevoyance [CEP] 0.299
35 Ceva Sante Animale SA 0.295 36 Infor Global Solutions 0.294 37 Swissport International Ltd 0.294 38 EVRY ASA 0.289 39 Allnex USA Inc 0.287 40 Delachaux SA 0.285
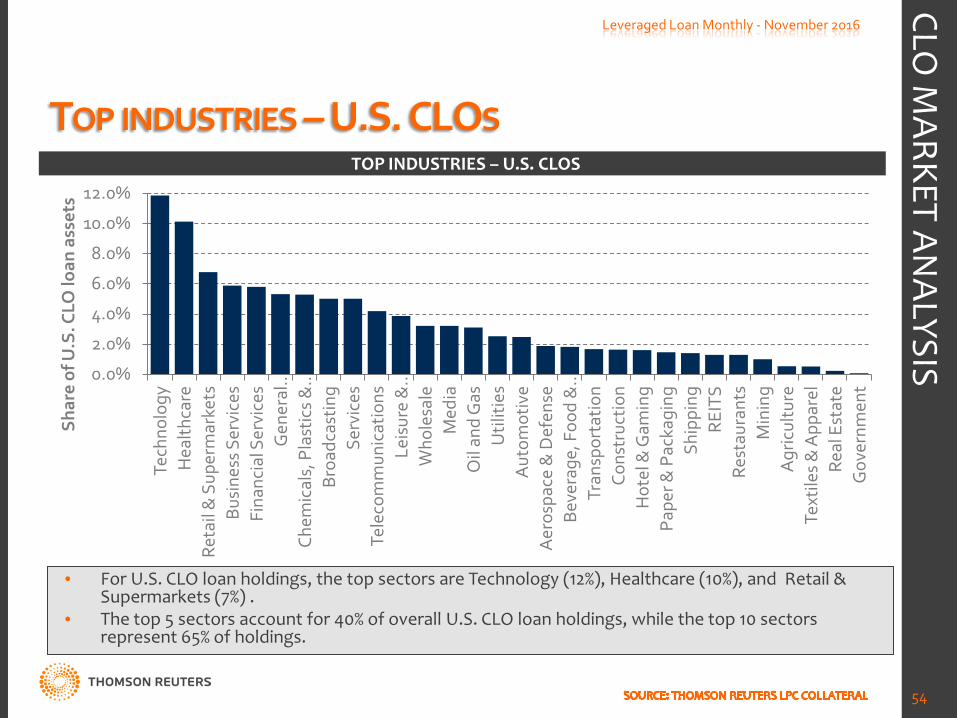
TOP INDUSTRIES – U.S. CLOS
0.0%
2.0%
4.0%
6.0%
8.0%
10.0%
12.0%
Tech
nolo
gy
Hea
lthca
re
Reta
il &
Sup
erm
arke
ts
Busi
ness
Ser
vice
s Fi
nanc
ial S
ervi
ces
Gen
eral
…
Chem
ical
s, P
last
ics
& …
Br
oadc
astin
g Se
rvic
es
Tele
com
mun
icat
ions
Le
isur
e &
…
Who
lesa
le
Med
ia
Oil
and
Gas
U
tiliti
es
Aut
omot
ive
Aer
ospa
ce &
Def
ense
Be
vera
ge, F
ood
& …
Tr
ansp
orta
tion
Cons
truc
tion
Hot
el &
Gam
ing
Pape
r & P
acka
ging
Sh
ippi
ng
REIT
S Re
stau
rant
s M
inin
g A
gric
ultu
re
Text
iles &
App
arel
Re
al E
stat
e G
over
nmen
t
Shar
e of
U.S
. CLO
loan
ass
ets
Leveraged Loan Monthly - November 2016
54
TOP INDUSTRIES – U.S. CLOS
• For U.S. CLO loan holdings, the top sectors are Technology (12%), Healthcare (10%), and Retail & Supermarkets (7%) .
• The top 5 sectors account for 40% of overall U.S. CLO loan holdings, while the top 10 sectors represent 65% of holdings.
CLO M
ARKET ANALYSIS
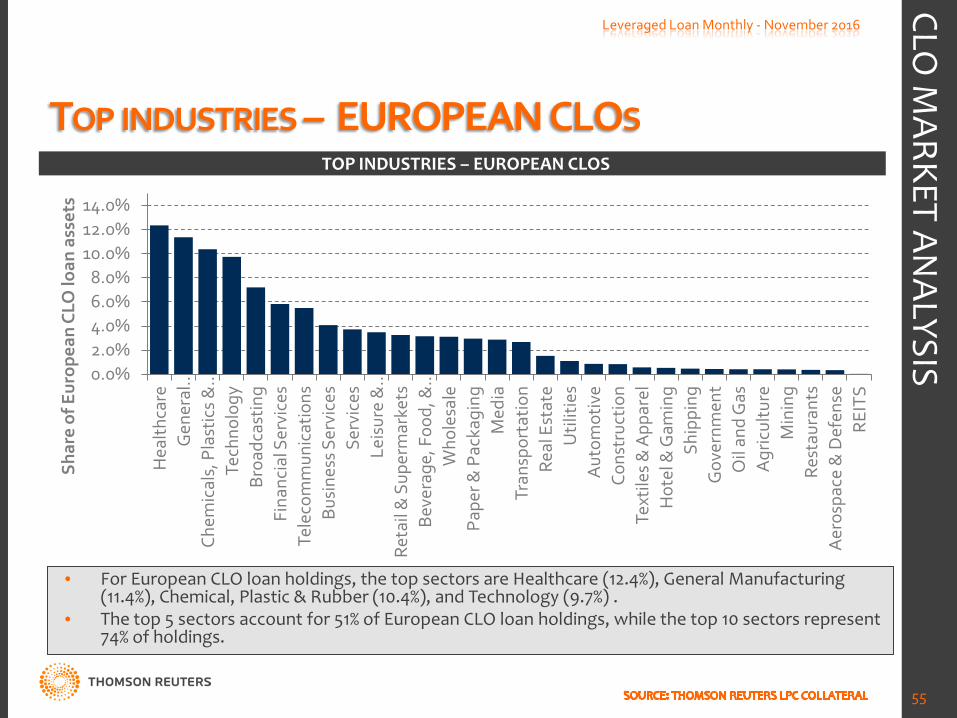
TOP INDUSTRIES – EUROPEAN CLOS
0.0% 2.0% 4.0% 6.0% 8.0%
10.0% 12.0% 14.0%
Hea
lthca
re
Gen
eral
…
Chem
ical
s, P
last
ics
& …
Te
chno
logy
Br
oadc
astin
g Fi
nanc
ial S
ervi
ces
Tele
com
mun
icat
ions
Bu
sine
ss S
ervi
ces
Serv
ices
Le
isur
e &
…
Reta
il &
Sup
erm
arke
ts
Beve
rage
, Foo
d, &
…
Who
lesa
le
Pape
r & P
acka
ging
M
edia
Tr
ansp
orta
tion
Real
Est
ate
Util
ities
A
utom
otiv
e Co
nstr
uctio
n Te
xtile
s & A
ppar
el
Hot
el &
Gam
ing
Ship
ping
G
over
nmen
t O
il an
d G
as
Agr
icul
ture
M
inin
g Re
stau
rant
s A
eros
pace
& D
efen
se
REIT
S
Shar
e of
Eur
opea
n CL
O lo
an a
sset
s
Leveraged Loan Monthly - November 2016
55
TOP INDUSTRIES – EUROPEAN CLOS
• For European CLO loan holdings, the top sectors are Healthcare (12.4%), General Manufacturing (11.4%), Chemical, Plastic & Rubber (10.4%), and Technology (9.7%) .
• The top 5 sectors account for 51% of European CLO loan holdings, while the top 10 sectors represent 74% of holdings.
CLO M
ARKET ANALYSIS
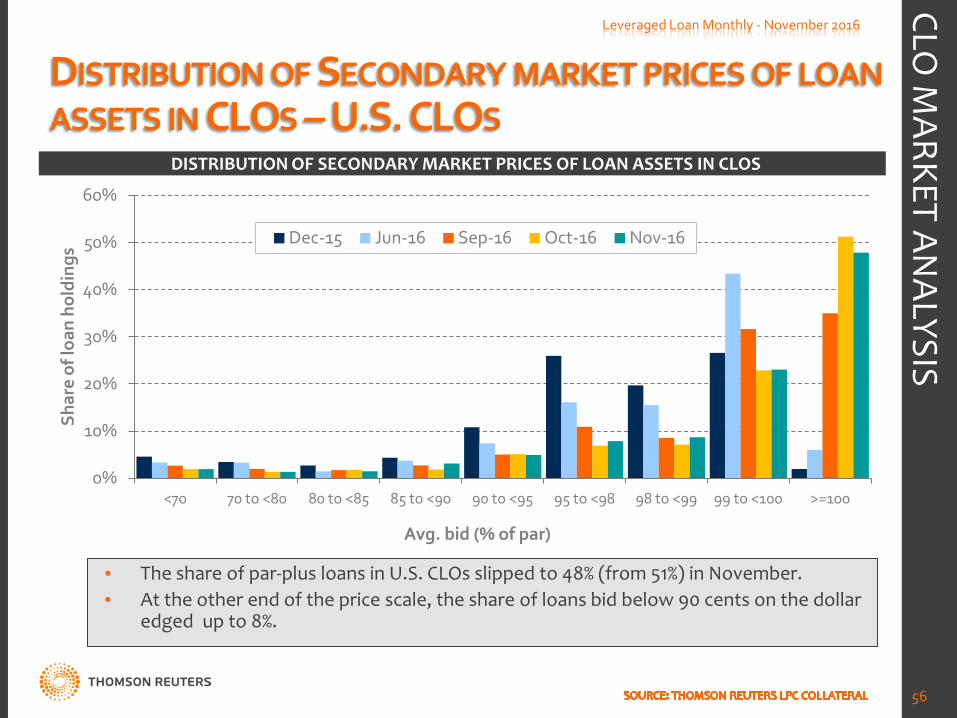
DISTRIBUTION OF SECONDARY MARKET PRICES OF LOAN ASSETS IN CLOS – U.S. CLOS
0%
10%
20%
30%
40%
50%
60%
<70 70 to <80 80 to <85 85 to <90 90 to <95 95 to <98 98 to <99 99 to <100 >=100
Shar
e of
loan
hol
ding
s
Avg. bid (% of par)
Dec-15 Jun-16 Sep-16 Oct-16 Nov-16
Leveraged Loan Monthly - November 2016
56
DISTRIBUTION OF SECONDARY MARKET PRICES OF LOAN ASSETS IN CLOS
• The share of par-plus loans in U.S. CLOs slipped to 48% (from 51%) in November. • At the other end of the price scale, the share of loans bid below 90 cents on the dollar
edged up to 8%.
CLO M
ARKET ANALYSIS
DISTRIBUTION OF SECONDARY MARKET PRICES OF LOAN ASSETS IN CLOS – EUROPEAN CLOS
0%
10%
20%
30%
40%
50%
60%
70%
80%
<70 70 to <80 80 to <85 85 to <90 90 to <95 95 to <98 98 to <99 99 to <100 >=100
Shar
e of
loan
hol
ding
s
Avg. bid (% of par)
Dec-15 Jun-16 Sep-16 Oct-16 Nov-16
Leveraged Loan Monthly - November 2016
57
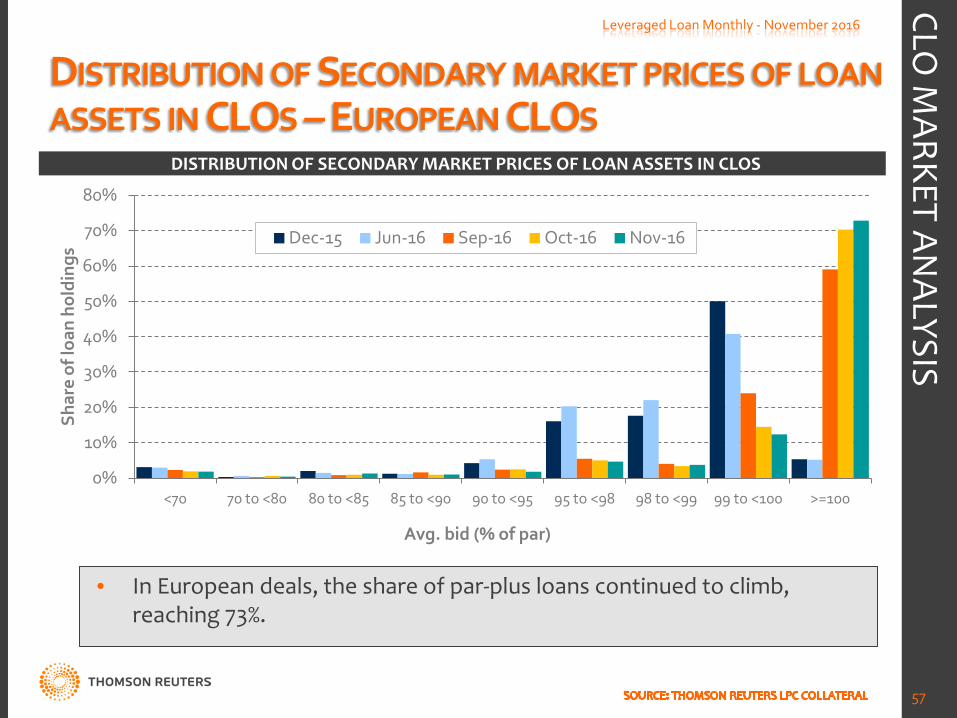
DISTRIBUTION OF SECONDARY MARKET PRICES OF LOAN ASSETS IN CLOS
• In European deals, the share of par-plus loans continued to climb, reaching 73%.
CLO M
ARKET ANALYSIS
AVERAGE BID OF U.S. CLO PORTFOLIOS (UNDERLYING ASSETS)
86.0
88.0
90.0
92.0
94.0
96.0
98.0
100.0
102.0
Jan-
13
Mar
-13
May
-13
Jul-1
3
Sep-
13
Nov
-13
Jan-
14
Mar
-14
May
-14
Jul-1
4
Sep-
14
Nov
-14
Jan-
15
Mar
-15
May
-15
Jul-1
5
Sep-
15
Nov
-15
Jan-
16
Mar
-16
May
-16
Jul-1
6
Sep-
16
Bid
(% o
f par
)
US Avg. Bid
US Median Bid
Leveraged Loan Monthly - November 2016
58
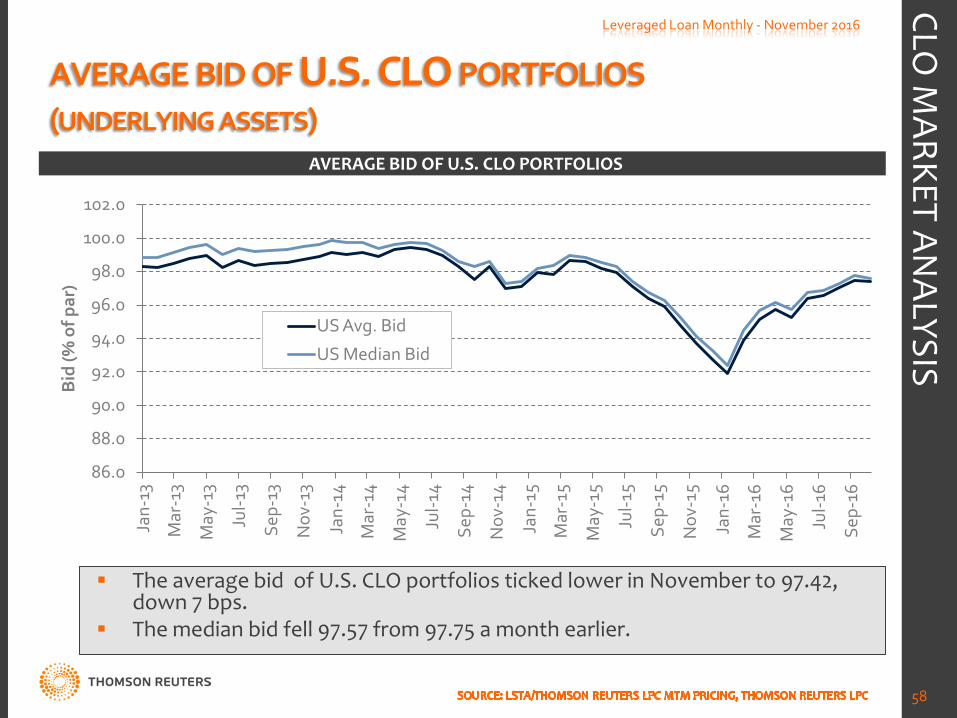
AVERAGE BID OF U.S. CLO PORTFOLIOS
The average bid of U.S. CLO portfolios ticked lower in November to 97.42, down 7 bps.
The median bid fell 97.57 from 97.75 a month earlier.
CLO M
ARKET ANALYSIS
AVERAGE BID OF EUROPEAN CLO PORTFOLIOS (UNDERLYING ASSETS)
86.0
88.0
90.0
92.0
94.0
96.0
98.0
100.0
Jan-
13
Mar
-13
May
-13
Jul-1
3
Sep-
13
Nov
-13
Jan-
14
Mar
-14
May
-14
Jul-1
4
Sep-
14
Nov
-14
Jan-
15
Mar
-15
May
-15
Jul-1
5
Sep-
15
Nov
-15
Jan-
16
Mar
-16
May
-16
Jul-1
6
Sep-
16
Bid
(% o
f par
)
EUR Avg. Bid
EUR Median Bid
Leveraged Loan Monthly - November 2016
59
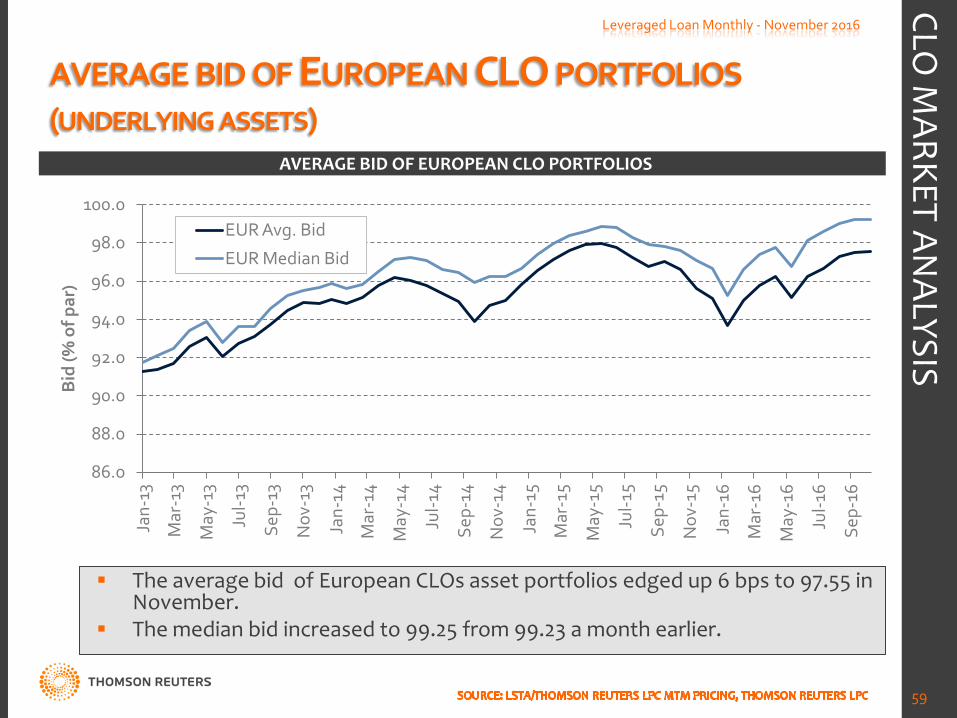
AVERAGE BID OF EUROPEAN CLO PORTFOLIOS
The average bid of European CLOs asset portfolios edged up 6 bps to 97.55 in November.
The median bid increased to 99.25 from 99.23 a month earlier.
CLO M
ARKET ANALYSIS
WEIGHTED AVERAGE BID OF CLO PORTFOLIOS: U.S. VS. EUROPE
0%
5%
10%
15%
20%
25%
30%
35%
40%
<80
80 to
<85
85 to
<86
86 to
<87
87 to
<88
88 to
<89
89 to
<90
90 to
<91
91 to
<92
92 to
<93
93 to
<94
94 to
<95
95 to
<96
96 to
<97
97 to
<98
98 to
<99
99 to
<10
0
>=10
0
Shar
e of
CLO
s
CLO weighted avg. bid
U.S.
Europe
Leveraged Loan Monthly - November 2016
60
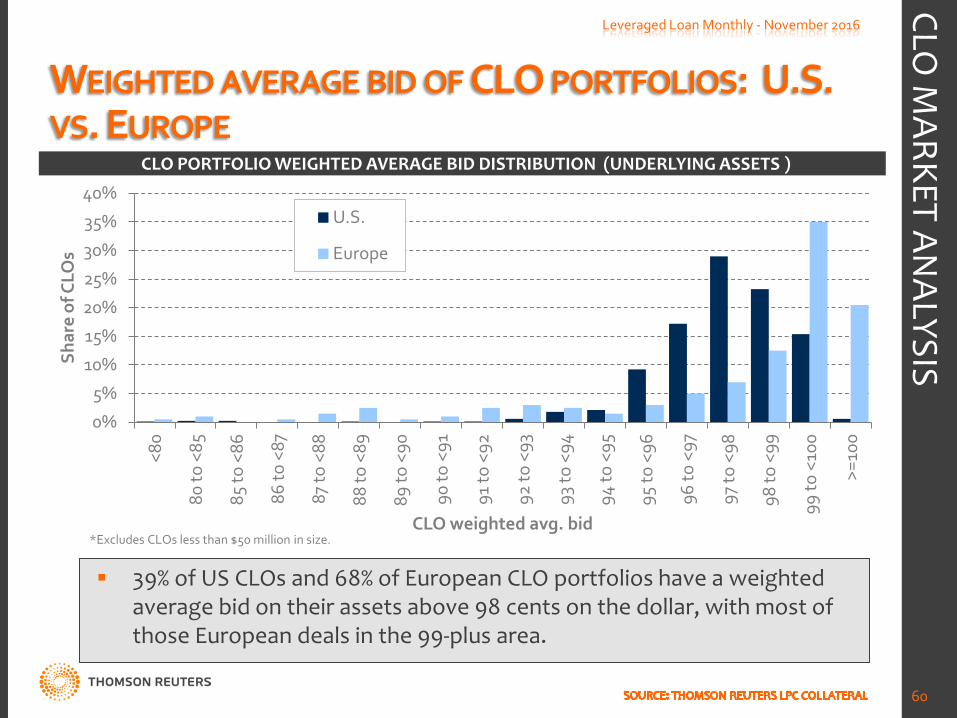
CLO PORTFOLIO WEIGHTED AVERAGE BID DISTRIBUTION (UNDERLYING ASSETS )
39% of US CLOs and 68% of European CLO portfolios have a weighted average bid on their assets above 98 cents on the dollar, with most of those European deals in the 99-plus area.
CLO M
ARKET ANALYSIS
*Excludes CLOs less than $50 million in size.
LIST OF RECENT CLOS / LEAGUE TABLES
YTD 2016 U.S. CLOS Leveraged Loan Monthly - November 2016
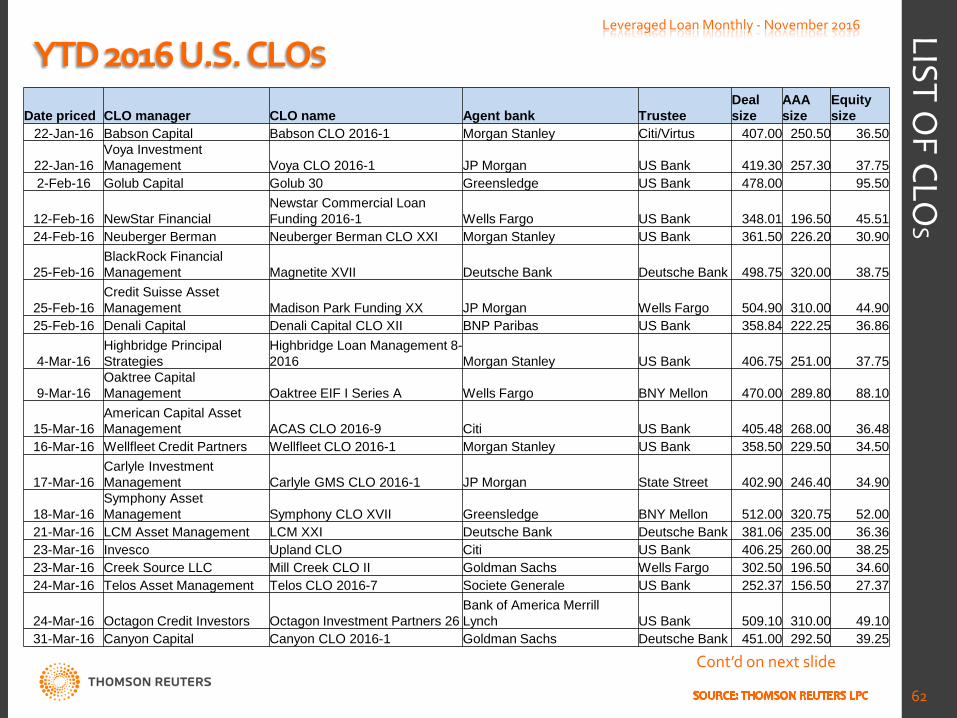
62
LIST OF CLO
S
Cont’d on next slide
Date priced CLO manager CLO name Agent bank Trustee Deal size
AAA size
Equity size
22-Jan-16 Babson Capital Babson CLO 2016-1 Morgan Stanley Citi/Virtus 407.00 250.50 36.50
22-Jan-16 Voya Investment Management Voya CLO 2016-1 JP Morgan US Bank 419.30 257.30 37.75
2-Feb-16 Golub Capital Golub 30 Greensledge US Bank 478.00 95.50
12-Feb-16 NewStar Financial Newstar Commercial Loan Funding 2016-1 Wells Fargo US Bank 348.01 196.50 45.51
24-Feb-16 Neuberger Berman Neuberger Berman CLO XXI Morgan Stanley US Bank 361.50 226.20 30.90
25-Feb-16 BlackRock Financial Management Magnetite XVII Deutsche Bank Deutsche Bank 498.75 320.00 38.75
25-Feb-16 Credit Suisse Asset Management Madison Park Funding XX JP Morgan Wells Fargo 504.90 310.00 44.90
25-Feb-16 Denali Capital Denali Capital CLO XII BNP Paribas US Bank 358.84 222.25 36.86
4-Mar-16 Highbridge Principal Strategies
Highbridge Loan Management 8-2016 Morgan Stanley US Bank 406.75 251.00 37.75
9-Mar-16 Oaktree Capital Management Oaktree EIF I Series A Wells Fargo BNY Mellon 470.00 289.80 88.10
15-Mar-16 American Capital Asset Management ACAS CLO 2016-9 Citi US Bank 405.48 268.00 36.48
16-Mar-16 Wellfleet Credit Partners Wellfleet CLO 2016-1 Morgan Stanley US Bank 358.50 229.50 34.50
17-Mar-16 Carlyle Investment Management Carlyle GMS CLO 2016-1 JP Morgan State Street 402.90 246.40 34.90
18-Mar-16 Symphony Asset Management Symphony CLO XVII Greensledge BNY Mellon 512.00 320.75 52.00
21-Mar-16 LCM Asset Management LCM XXI Deutsche Bank Deutsche Bank 381.06 235.00 36.36 23-Mar-16 Invesco Upland CLO Citi US Bank 406.25 260.00 38.25 23-Mar-16 Creek Source LLC Mill Creek CLO II Goldman Sachs Wells Fargo 302.50 196.50 34.60 24-Mar-16 Telos Asset Management Telos CLO 2016-7 Societe Generale US Bank 252.37 156.50 27.37
24-Mar-16 Octagon Credit Investors Octagon Investment Partners 26 Bank of America Merrill Lynch US Bank 509.10 310.00 49.10
31-Mar-16 Canyon Capital Canyon CLO 2016-1 Goldman Sachs Deutsche Bank 451.00 292.50 39.25
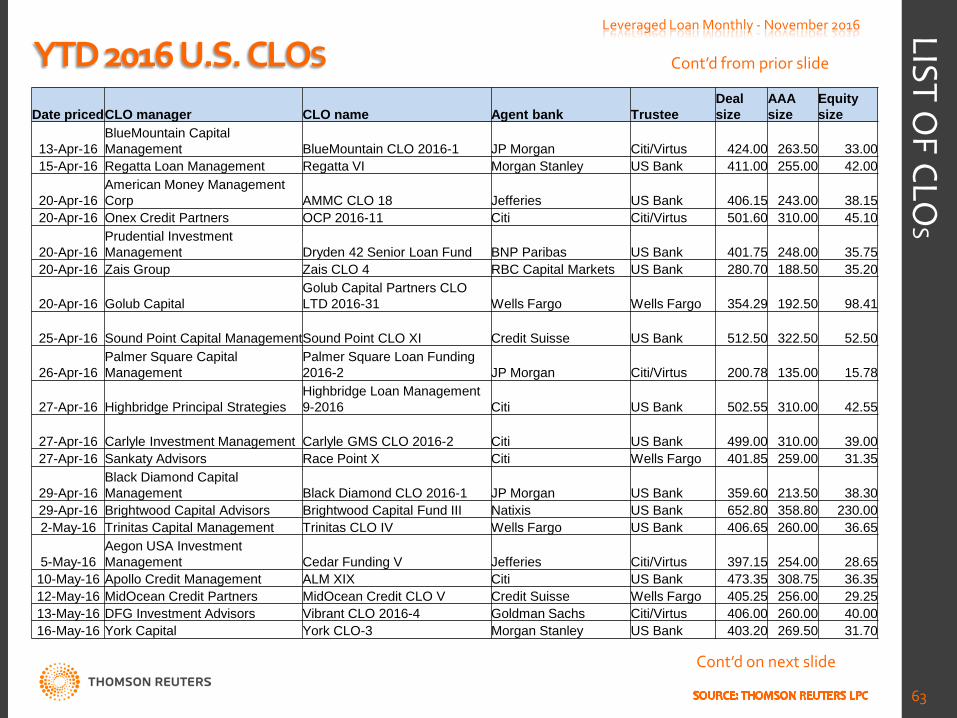
YTD 2016 U.S. CLOS Leveraged Loan Monthly - November 2016
63
LIST OF CLO
S Cont’d from prior slide
Date priced CLO manager CLO name Agent bank Trustee Deal size
AAA size
Equity size
13-Apr-16 BlueMountain Capital Management BlueMountain CLO 2016-1 JP Morgan Citi/Virtus 424.00 263.50 33.00
15-Apr-16 Regatta Loan Management Regatta VI Morgan Stanley US Bank 411.00 255.00 42.00
20-Apr-16 American Money Management Corp AMMC CLO 18 Jefferies US Bank 406.15 243.00 38.15
20-Apr-16 Onex Credit Partners OCP 2016-11 Citi Citi/Virtus 501.60 310.00 45.10
20-Apr-16 Prudential Investment Management Dryden 42 Senior Loan Fund BNP Paribas US Bank 401.75 248.00 35.75
20-Apr-16 Zais Group Zais CLO 4 RBC Capital Markets US Bank 280.70 188.50 35.20
20-Apr-16 Golub Capital Golub Capital Partners CLO LTD 2016-31 Wells Fargo Wells Fargo 354.29 192.50 98.41
25-Apr-16 Sound Point Capital Management Sound Point CLO XI Credit Suisse US Bank 512.50 322.50 52.50
26-Apr-16 Palmer Square Capital Management
Palmer Square Loan Funding 2016-2 JP Morgan Citi/Virtus 200.78 135.00 15.78
27-Apr-16 Highbridge Principal Strategies Highbridge Loan Management 9-2016 Citi US Bank 502.55 310.00 42.55
27-Apr-16 Carlyle Investment Management Carlyle GMS CLO 2016-2 Citi US Bank 499.00 310.00 39.00 27-Apr-16 Sankaty Advisors Race Point X Citi Wells Fargo 401.85 259.00 31.35
29-Apr-16 Black Diamond Capital Management Black Diamond CLO 2016-1 JP Morgan US Bank 359.60 213.50 38.30
29-Apr-16 Brightwood Capital Advisors Brightwood Capital Fund III Natixis US Bank 652.80 358.80 230.00 2-May-16 Trinitas Capital Management Trinitas CLO IV Wells Fargo US Bank 406.65 260.00 36.65
5-May-16 Aegon USA Investment Management Cedar Funding V Jefferies Citi/Virtus 397.15 254.00 28.65
10-May-16 Apollo Credit Management ALM XIX Citi US Bank 473.35 308.75 36.35 12-May-16 MidOcean Credit Partners MidOcean Credit CLO V Credit Suisse Wells Fargo 405.25 256.00 29.25 13-May-16 DFG Investment Advisors Vibrant CLO 2016-4 Goldman Sachs Citi/Virtus 406.00 260.00 40.00 16-May-16 York Capital York CLO-3 Morgan Stanley US Bank 403.20 269.50 31.70
Cont’d on next slide
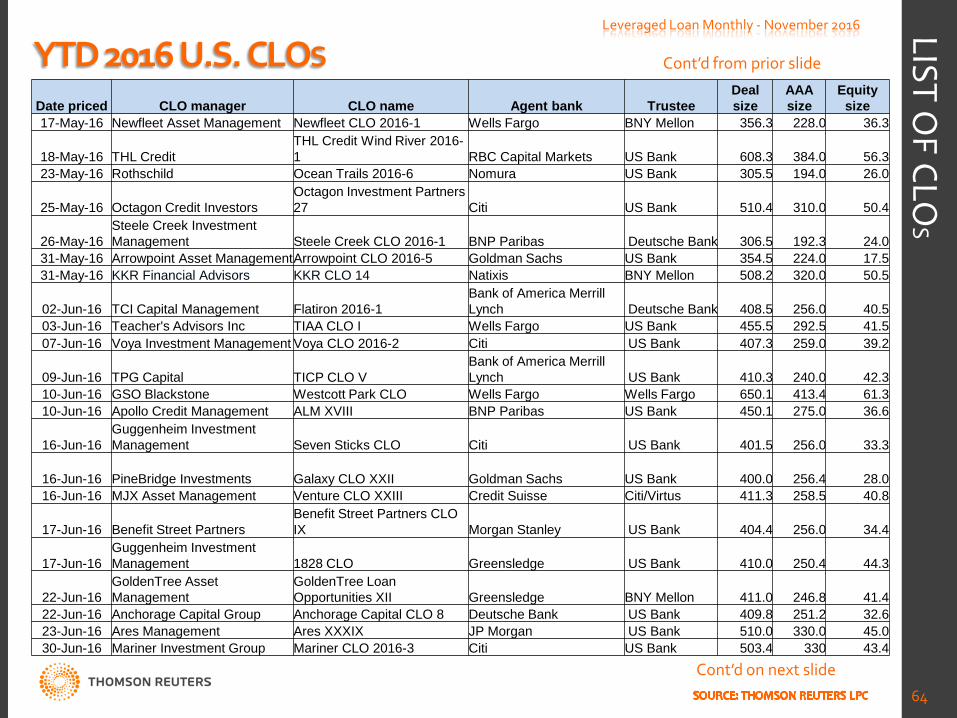
YTD 2016 U.S. CLOS Leveraged Loan Monthly - November 2016
64
LIST OF CLO
S Cont’d from prior slide
Date priced CLO manager CLO name Agent bank Trustee Deal size
AAA size
Equity size
17-May-16 Newfleet Asset Management Newfleet CLO 2016-1 Wells Fargo BNY Mellon 356.3 228.0 36.3
18-May-16 THL Credit THL Credit Wind River 2016-1 RBC Capital Markets US Bank 608.3 384.0 56.3
23-May-16 Rothschild Ocean Trails 2016-6 Nomura US Bank 305.5 194.0 26.0
25-May-16 Octagon Credit Investors Octagon Investment Partners 27 Citi US Bank 510.4 310.0 50.4
26-May-16 Steele Creek Investment Management Steele Creek CLO 2016-1 BNP Paribas Deutsche Bank 306.5 192.3 24.0
31-May-16 Arrowpoint Asset Management Arrowpoint CLO 2016-5 Goldman Sachs US Bank 354.5 224.0 17.5 31-May-16 KKR Financial Advisors KKR CLO 14 Natixis BNY Mellon 508.2 320.0 50.5
02-Jun-16 TCI Capital Management Flatiron 2016-1 Bank of America Merrill Lynch Deutsche Bank 408.5 256.0 40.5
03-Jun-16 Teacher's Advisors Inc TIAA CLO I Wells Fargo US Bank 455.5 292.5 41.5 07-Jun-16 Voya Investment Management Voya CLO 2016-2 Citi US Bank 407.3 259.0 39.2
09-Jun-16 TPG Capital TICP CLO V Bank of America Merrill Lynch US Bank 410.3 240.0 42.3
10-Jun-16 GSO Blackstone Westcott Park CLO Wells Fargo Wells Fargo 650.1 413.4 61.3 10-Jun-16 Apollo Credit Management ALM XVIII BNP Paribas US Bank 450.1 275.0 36.6
16-Jun-16 Guggenheim Investment Management Seven Sticks CLO Citi US Bank 401.5 256.0 33.3
16-Jun-16 PineBridge Investments Galaxy CLO XXII Goldman Sachs US Bank 400.0 256.4 28.0 16-Jun-16 MJX Asset Management Venture CLO XXIII Credit Suisse Citi/Virtus 411.3 258.5 40.8
17-Jun-16 Benefit Street Partners Benefit Street Partners CLO IX Morgan Stanley US Bank 404.4 256.0 34.4
17-Jun-16 Guggenheim Investment Management 1828 CLO Greensledge US Bank 410.0 250.4 44.3
22-Jun-16 GoldenTree Asset Management
GoldenTree Loan Opportunities XII Greensledge BNY Mellon 411.0 246.8 41.4
22-Jun-16 Anchorage Capital Group Anchorage Capital CLO 8 Deutsche Bank US Bank 409.8 251.2 32.6 23-Jun-16 Ares Management Ares XXXIX JP Morgan US Bank 510.0 330.0 45.0 30-Jun-16 Mariner Investment Group Mariner CLO 2016-3 Citi US Bank 503.4 330 43.4
Cont’d on next slide
YTD 2016 U.S. CLOS Leveraged Loan Monthly - November 2016
65
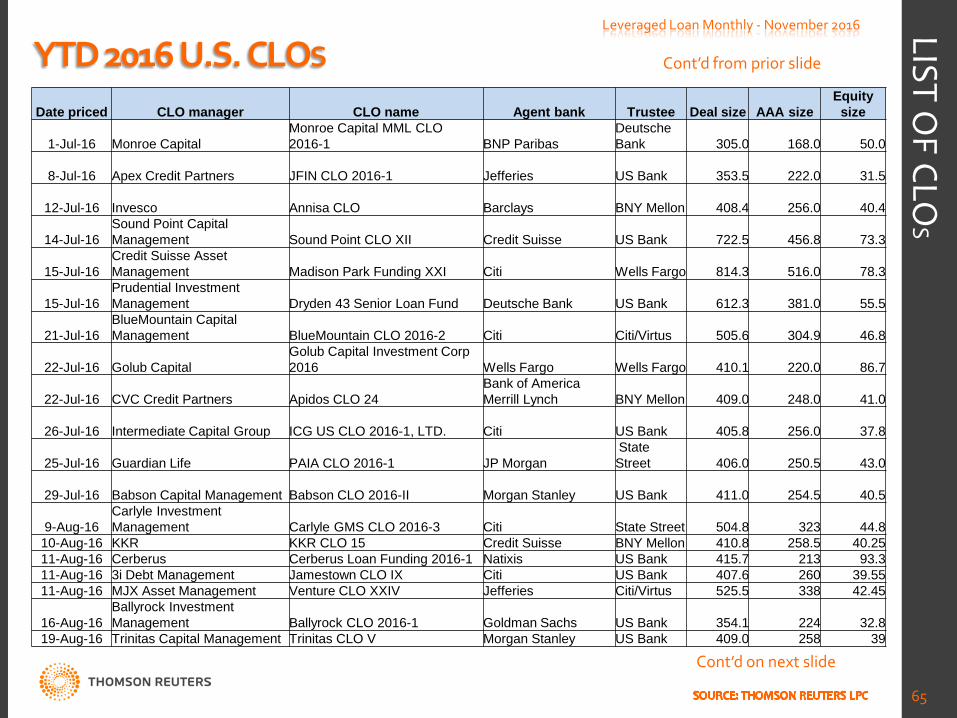
LIST OF CLO
S Cont’d from prior slide
Date priced CLO manager CLO name Agent bank Trustee Deal size AAA size Equity
size
1-Jul-16 Monroe Capital Monroe Capital MML CLO 2016-1 BNP Paribas
Deutsche Bank
305.0
168.0 50.0
8-Jul-16 Apex Credit Partners JFIN CLO 2016-1 Jefferies US Bank
353.5
222.0 31.5
12-Jul-16 Invesco Annisa CLO Barclays BNY Mellon
408.4
256.0 40.4
14-Jul-16 Sound Point Capital Management Sound Point CLO XII Credit Suisse US Bank
722.5
456.8 73.3
15-Jul-16 Credit Suisse Asset Management Madison Park Funding XXI Citi Wells Fargo
814.3
516.0 78.3
15-Jul-16 Prudential Investment Management Dryden 43 Senior Loan Fund Deutsche Bank US Bank
612.3
381.0 55.5
21-Jul-16 BlueMountain Capital Management BlueMountain CLO 2016-2 Citi Citi/Virtus
505.6
304.9 46.8
22-Jul-16 Golub Capital Golub Capital Investment Corp 2016 Wells Fargo Wells Fargo
410.1
220.0 86.7
22-Jul-16 CVC Credit Partners Apidos CLO 24 Bank of America Merrill Lynch BNY Mellon
409.0
248.0 41.0
26-Jul-16 Intermediate Capital Group ICG US CLO 2016-1, LTD. Citi US Bank
405.8
256.0 37.8
25-Jul-16 Guardian Life PAIA CLO 2016-1 JP Morgan State Street
406.0
250.5 43.0
29-Jul-16 Babson Capital Management Babson CLO 2016-II Morgan Stanley US Bank
411.0
254.5 40.5
9-Aug-16 Carlyle Investment Management Carlyle GMS CLO 2016-3 Citi State Street 504.8 323 44.8
10-Aug-16 KKR KKR CLO 15 Credit Suisse BNY Mellon 410.8 258.5 40.25 11-Aug-16 Cerberus Cerberus Loan Funding 2016-1 Natixis US Bank 415.7 213 93.3 11-Aug-16 3i Debt Management Jamestown CLO IX Citi US Bank 407.6 260 39.55 11-Aug-16 MJX Asset Management Venture CLO XXIV Jefferies Citi/Virtus 525.5 338 42.45
16-Aug-16 Ballyrock Investment Management Ballyrock CLO 2016-1 Goldman Sachs US Bank 354.1 224 32.8
19-Aug-16 Trinitas Capital Management Trinitas CLO V Morgan Stanley US Bank 409.0 258 39
Cont’d on next slide
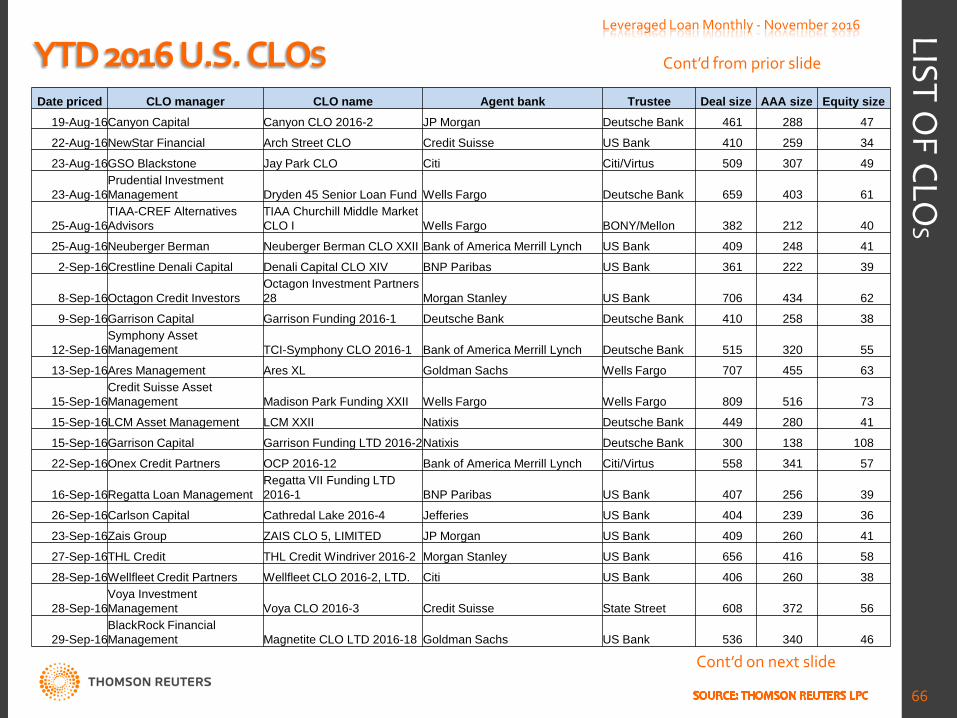
YTD 2016 U.S. CLOS Leveraged Loan Monthly - November 2016
66
LIST OF CLO
S Cont’d from prior slide
Date priced CLO manager CLO name Agent bank Trustee Deal size AAA size Equity size 19-Aug-16 Canyon Capital Canyon CLO 2016-2 JP Morgan Deutsche Bank 461 288 47
22-Aug-16 NewStar Financial Arch Street CLO Credit Suisse US Bank 410 259 34
23-Aug-16 GSO Blackstone Jay Park CLO Citi Citi/Virtus 509 307 49
23-Aug-16 Prudential Investment Management Dryden 45 Senior Loan Fund Wells Fargo Deutsche Bank 659 403 61
25-Aug-16 TIAA-CREF Alternatives Advisors
TIAA Churchill Middle Market CLO I Wells Fargo BONY/Mellon 382 212 40
25-Aug-16 Neuberger Berman Neuberger Berman CLO XXII Bank of America Merrill Lynch US Bank 409 248 41
2-Sep-16 Crestline Denali Capital Denali Capital CLO XIV BNP Paribas US Bank 361 222 39
8-Sep-16 Octagon Credit Investors Octagon Investment Partners 28 Morgan Stanley US Bank 706 434 62
9-Sep-16 Garrison Capital Garrison Funding 2016-1 Deutsche Bank Deutsche Bank 410 258 38
12-Sep-16 Symphony Asset Management TCI-Symphony CLO 2016-1 Bank of America Merrill Lynch Deutsche Bank 515 320 55
13-Sep-16 Ares Management Ares XL Goldman Sachs Wells Fargo 707 455 63
15-Sep-16 Credit Suisse Asset Management Madison Park Funding XXII Wells Fargo Wells Fargo 809 516 73
15-Sep-16 LCM Asset Management LCM XXII Natixis Deutsche Bank 449 280 41
15-Sep-16 Garrison Capital Garrison Funding LTD 2016-2 Natixis Deutsche Bank 300 138 108
22-Sep-16 Onex Credit Partners OCP 2016-12 Bank of America Merrill Lynch Citi/Virtus 558 341 57
16-Sep-16 Regatta Loan Management Regatta VII Funding LTD 2016-1 BNP Paribas US Bank 407 256 39
26-Sep-16 Carlson Capital Cathredal Lake 2016-4 Jefferies US Bank 404 239 36
23-Sep-16 Zais Group ZAIS CLO 5, LIMITED JP Morgan US Bank 409 260 41
27-Sep-16 THL Credit THL Credit Windriver 2016-2 Morgan Stanley US Bank 656 416 58
28-Sep-16 Wellfleet Credit Partners Wellfleet CLO 2016-2, LTD. Citi US Bank 406 260 38
28-Sep-16 Voya Investment Management Voya CLO 2016-3 Credit Suisse State Street 608 372 56
29-Sep-16 BlackRock Financial Management Magnetite CLO LTD 2016-18 Goldman Sachs US Bank 536 340 46
Cont’d on next slide
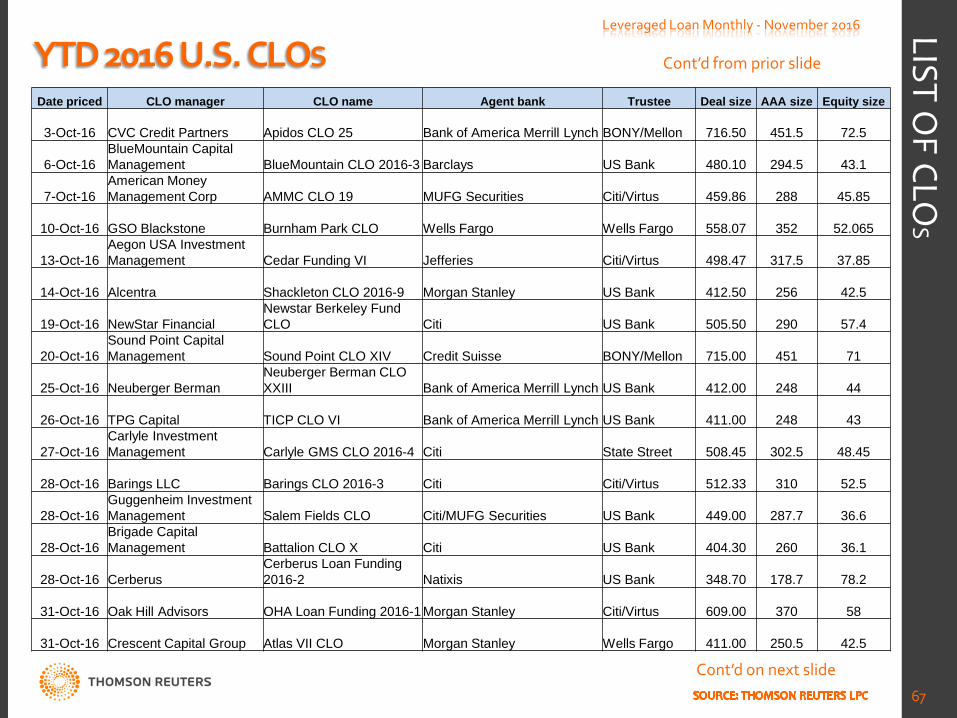
YTD 2016 U.S. CLOS Leveraged Loan Monthly - November 2016
67
LIST OF CLO
S Cont’d from prior slide
Date priced CLO manager CLO name Agent bank Trustee Deal size AAA size Equity size
3-Oct-16 CVC Credit Partners Apidos CLO 25 Bank of America Merrill Lynch BONY/Mellon
716.50 451.5 72.5
6-Oct-16 BlueMountain Capital Management BlueMountain CLO 2016-3 Barclays US Bank
480.10 294.5 43.1
7-Oct-16 American Money Management Corp AMMC CLO 19 MUFG Securities Citi/Virtus
459.86 288 45.85
10-Oct-16 GSO Blackstone Burnham Park CLO Wells Fargo Wells Fargo
558.07 352 52.065
13-Oct-16 Aegon USA Investment Management Cedar Funding VI Jefferies Citi/Virtus
498.47 317.5 37.85
14-Oct-16 Alcentra Shackleton CLO 2016-9 Morgan Stanley US Bank
412.50 256 42.5
19-Oct-16 NewStar Financial Newstar Berkeley Fund CLO Citi US Bank
505.50 290 57.4
20-Oct-16 Sound Point Capital Management Sound Point CLO XIV Credit Suisse BONY/Mellon
715.00 451 71
25-Oct-16 Neuberger Berman Neuberger Berman CLO XXIII Bank of America Merrill Lynch US Bank
412.00 248 44
26-Oct-16 TPG Capital TICP CLO VI Bank of America Merrill Lynch US Bank
411.00 248 43
27-Oct-16 Carlyle Investment Management Carlyle GMS CLO 2016-4 Citi State Street
508.45 302.5 48.45
28-Oct-16 Barings LLC Barings CLO 2016-3 Citi Citi/Virtus
512.33 310 52.5
28-Oct-16 Guggenheim Investment Management Salem Fields CLO Citi/MUFG Securities US Bank
449.00 287.7 36.6
28-Oct-16 Brigade Capital Management Battalion CLO X Citi US Bank
404.30 260 36.1
28-Oct-16 Cerberus Cerberus Loan Funding 2016-2 Natixis US Bank
348.70 178.7 78.2
31-Oct-16 Oak Hill Advisors OHA Loan Funding 2016-1 Morgan Stanley Citi/Virtus
609.00 370 58
31-Oct-16 Crescent Capital Group Atlas VII CLO Morgan Stanley Wells Fargo
411.00 250.5 42.5
Cont’d on next slide
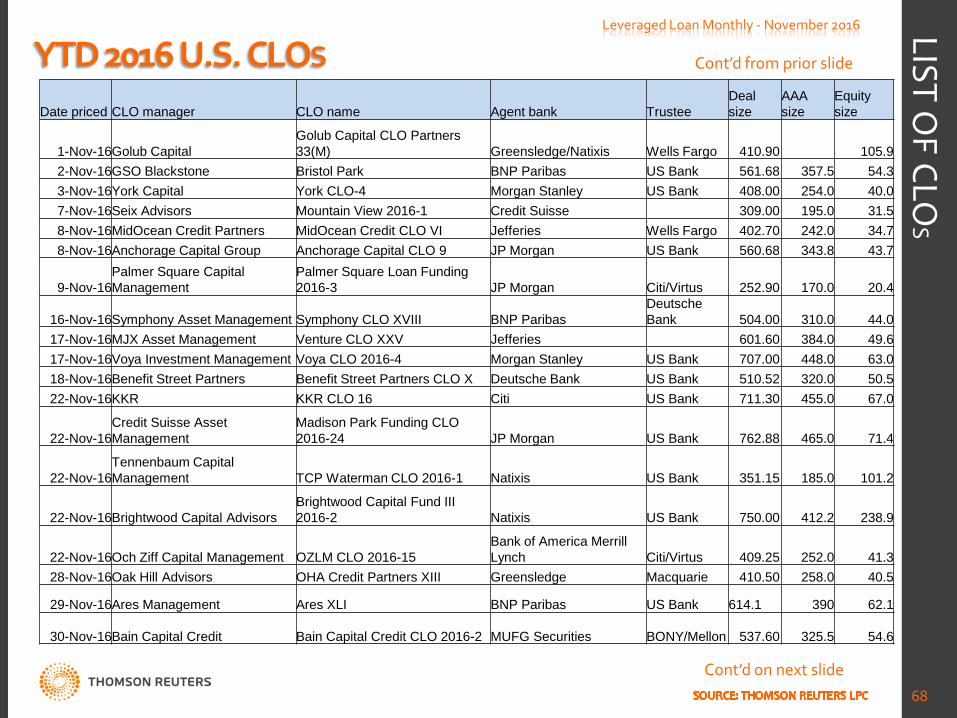
YTD 2016 U.S. CLOS Leveraged Loan Monthly - November 2016
68
LIST OF CLO
S Cont’d from prior slide
Date priced CLO manager CLO name Agent bank Trustee Deal size
AAA size
Equity size
1-Nov-16 Golub Capital Golub Capital CLO Partners 33(M) Greensledge/Natixis Wells Fargo 410.90 105.9
2-Nov-16 GSO Blackstone Bristol Park BNP Paribas US Bank 561.68 357.5 54.3 3-Nov-16 York Capital York CLO-4 Morgan Stanley US Bank 408.00 254.0 40.0 7-Nov-16 Seix Advisors Mountain View 2016-1 Credit Suisse 309.00 195.0 31.5 8-Nov-16 MidOcean Credit Partners MidOcean Credit CLO VI Jefferies Wells Fargo 402.70 242.0 34.7 8-Nov-16 Anchorage Capital Group Anchorage Capital CLO 9 JP Morgan US Bank 560.68 343.8 43.7
9-Nov-16 Palmer Square Capital Management
Palmer Square Loan Funding 2016-3 JP Morgan Citi/Virtus 252.90 170.0 20.4
16-Nov-16 Symphony Asset Management Symphony CLO XVIII BNP Paribas Deutsche Bank 504.00 310.0 44.0
17-Nov-16 MJX Asset Management Venture CLO XXV Jefferies 601.60 384.0 49.6 17-Nov-16 Voya Investment Management Voya CLO 2016-4 Morgan Stanley US Bank 707.00 448.0 63.0 18-Nov-16 Benefit Street Partners Benefit Street Partners CLO X Deutsche Bank US Bank 510.52 320.0 50.5 22-Nov-16 KKR KKR CLO 16 Citi US Bank 711.30 455.0 67.0
22-Nov-16 Credit Suisse Asset Management
Madison Park Funding CLO 2016-24 JP Morgan US Bank 762.88 465.0 71.4
22-Nov-16 Tennenbaum Capital Management TCP Waterman CLO 2016-1 Natixis US Bank 351.15 185.0 101.2
22-Nov-16 Brightwood Capital Advisors Brightwood Capital Fund III 2016-2 Natixis US Bank 750.00 412.2 238.9
22-Nov-16 Och Ziff Capital Management OZLM CLO 2016-15 Bank of America Merrill Lynch Citi/Virtus 409.25 252.0 41.3
28-Nov-16 Oak Hill Advisors OHA Credit Partners XIII Greensledge Macquarie 410.50 258.0 40.5
29-Nov-16 Ares Management Ares XLI BNP Paribas US Bank 614.1 390 62.1
30-Nov-16 Bain Capital Credit Bain Capital Credit CLO 2016-2 MUFG Securities BONY/Mellon 537.60 325.5 54.6
Cont’d on next slide
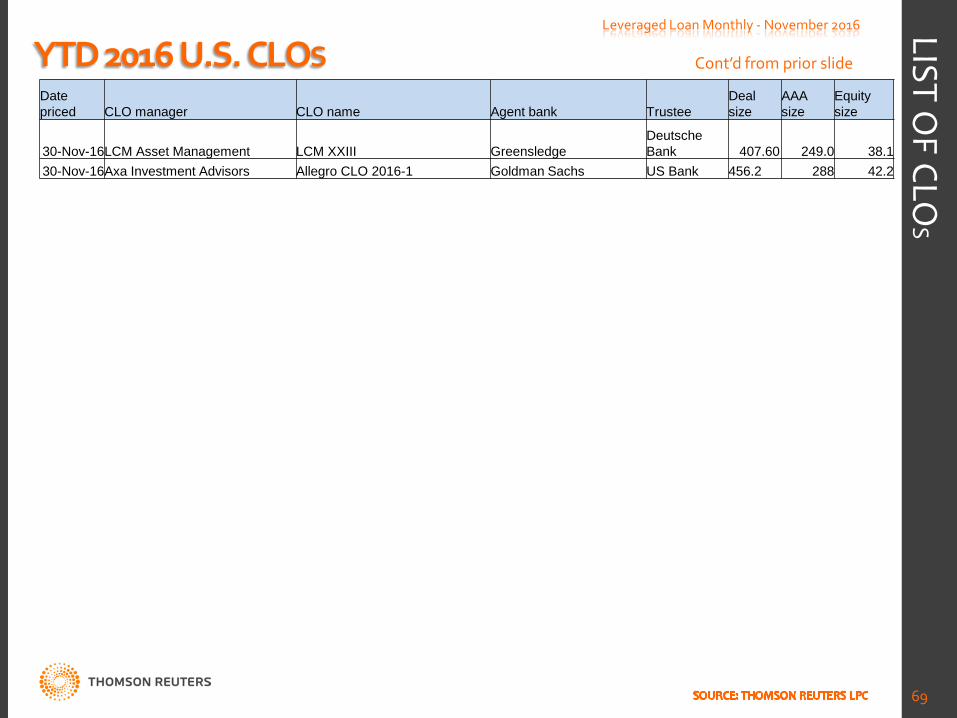
YTD 2016 U.S. CLOS Leveraged Loan Monthly - November 2016
69
LIST OF CLO
S Cont’d from prior slide
Date priced CLO manager CLO name Agent bank Trustee
Deal size
AAA size
Equity size
30-Nov-16 LCM Asset Management LCM XXIII Greensledge Deutsche Bank 407.60 249.0 38.1
30-Nov-16 Axa Investment Advisors Allegro CLO 2016-1 Goldman Sachs US Bank 456.2 288 42.2
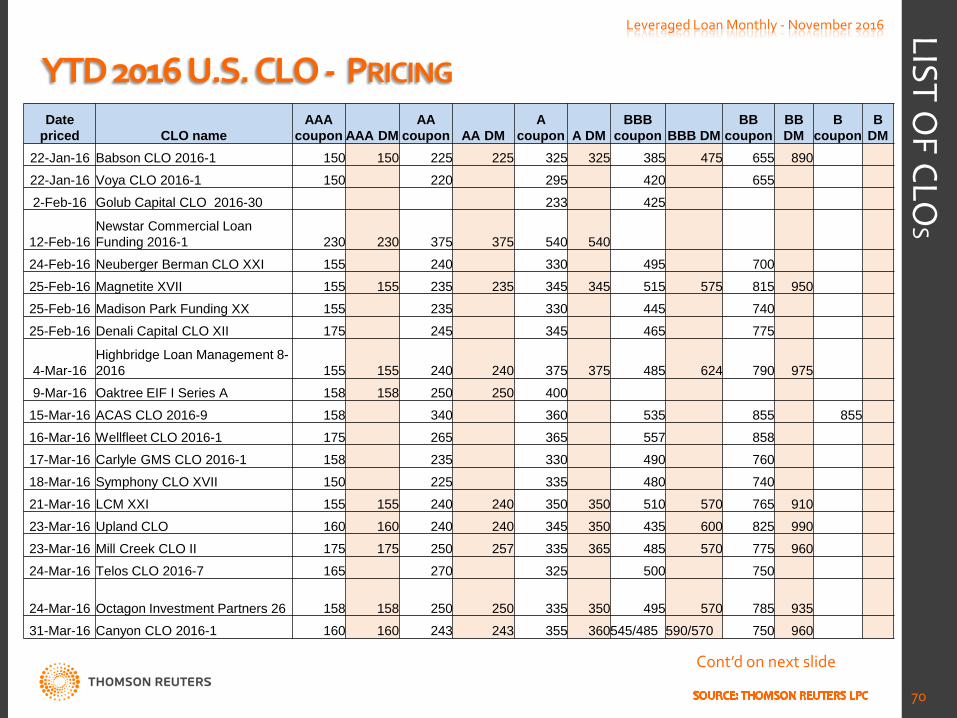
YTD 2016 U.S. CLO - PRICING Leveraged Loan Monthly - November 2016
70
LIST OF CLO
S
Date priced CLO name
AAA coupon AAA DM
AA coupon AA DM
A coupon A DM
BBB coupon BBB DM
BB coupon
BB DM
B coupon
B DM
22-Jan-16 Babson CLO 2016-1 150 150 225 225 325 325 385 475 655 890
22-Jan-16 Voya CLO 2016-1 150 220 295 420 655
2-Feb-16 Golub Capital CLO 2016-30 233 425
12-Feb-16 Newstar Commercial Loan Funding 2016-1 230 230 375 375 540 540
24-Feb-16 Neuberger Berman CLO XXI 155 240 330 495 700
25-Feb-16 Magnetite XVII 155 155 235 235 345 345 515 575 815 950
25-Feb-16 Madison Park Funding XX 155 235 330 445 740
25-Feb-16 Denali Capital CLO XII 175 245 345 465 775
4-Mar-16 Highbridge Loan Management 8-2016 155 155 240 240 375 375 485 624 790 975
9-Mar-16 Oaktree EIF I Series A 158 158 250 250 400
15-Mar-16 ACAS CLO 2016-9 158 340 360 535 855 855
16-Mar-16 Wellfleet CLO 2016-1 175 265 365 557 858
17-Mar-16 Carlyle GMS CLO 2016-1 158 235 330 490 760
18-Mar-16 Symphony CLO XVII 150 225 335 480 740
21-Mar-16 LCM XXI 155 155 240 240 350 350 510 570 765 910
23-Mar-16 Upland CLO 160 160 240 240 345 350 435 600 825 990
23-Mar-16 Mill Creek CLO II 175 175 250 257 335 365 485 570 775 960
24-Mar-16 Telos CLO 2016-7 165 270 325 500 750
24-Mar-16 Octagon Investment Partners 26 158 158 250 250 335 350 495 570 785 935
31-Mar-16 Canyon CLO 2016-1 160 160 243 243 355 360 545/485 590/570 750 960
Cont’d on next slide
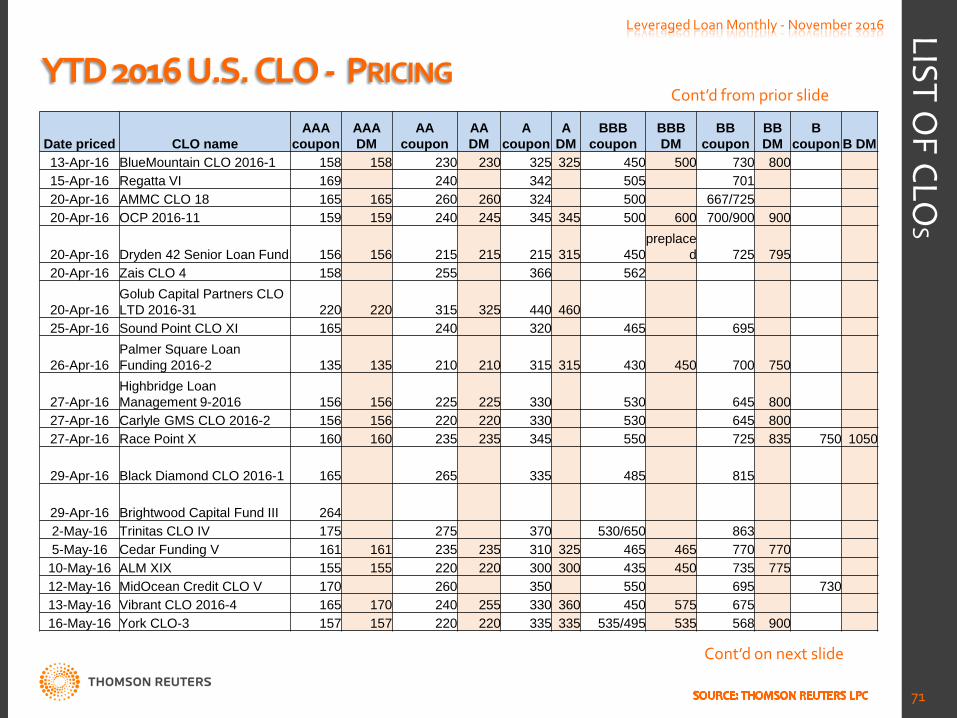
YTD 2016 U.S. CLO - PRICING Leveraged Loan Monthly - November 2016
71
LIST OF CLO
S
Cont’d from prior slide
Date priced CLO name AAA
coupon AAA DM
AA coupon
AA DM
A coupon
A DM
BBB coupon
BBB DM
BB coupon
BB DM
B coupon B DM
13-Apr-16 BlueMountain CLO 2016-1 158 158 230 230 325 325 450 500 730 800 15-Apr-16 Regatta VI 169 240 342 505 701 20-Apr-16 AMMC CLO 18 165 165 260 260 324 500 667/725 20-Apr-16 OCP 2016-11 159 159 240 245 345 345 500 600 700/900 900
20-Apr-16 Dryden 42 Senior Loan Fund 156 156 215 215 215 315 450 preplace
d 725 795 20-Apr-16 Zais CLO 4 158 255 366 562
20-Apr-16 Golub Capital Partners CLO LTD 2016-31 220 220 315 325 440 460
25-Apr-16 Sound Point CLO XI 165 240 320 465 695
26-Apr-16 Palmer Square Loan Funding 2016-2 135 135 210 210 315 315 430 450 700 750
27-Apr-16 Highbridge Loan Management 9-2016 156 156 225 225 330 530 645 800
27-Apr-16 Carlyle GMS CLO 2016-2 156 156 220 220 330 530 645 800 27-Apr-16 Race Point X 160 160 235 235 345 550 725 835 750 1050
29-Apr-16 Black Diamond CLO 2016-1 165 265 335 485 815
29-Apr-16 Brightwood Capital Fund III 264 2-May-16 Trinitas CLO IV 175 275 370 530/650 863 5-May-16 Cedar Funding V 161 161 235 235 310 325 465 465 770 770 10-May-16 ALM XIX 155 155 220 220 300 300 435 450 735 775 12-May-16 MidOcean Credit CLO V 170 260 350 550 695 730 13-May-16 Vibrant CLO 2016-4 165 170 240 255 330 360 450 575 675 16-May-16 York CLO-3 157 157 220 220 335 335 535/495 535 568 900
Cont’d on next slide
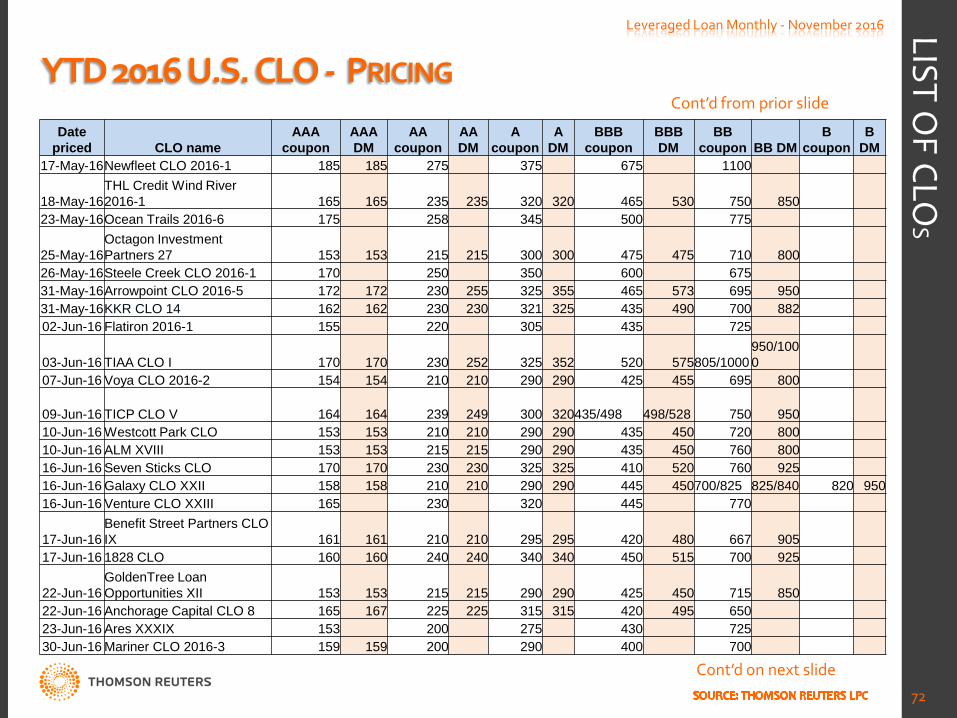
YTD 2016 U.S. CLO - PRICING Leveraged Loan Monthly - November 2016
72
LIST OF CLO
S
Cont’d from prior slide
Date priced CLO name
AAA coupon
AAA DM
AA coupon
AA DM
A coupon
A DM
BBB coupon
BBB DM
BB coupon BB DM
B coupon
B DM
17-May-16 Newfleet CLO 2016-1 185 185 275 375 675 1100
18-May-16 THL Credit Wind River 2016-1 165 165 235 235 320 320 465 530 750 850
23-May-16 Ocean Trails 2016-6 175 258 345 500 775
25-May-16 Octagon Investment Partners 27 153 153 215 215 300 300 475 475 710 800
26-May-16 Steele Creek CLO 2016-1 170 250 350 600 675 31-May-16 Arrowpoint CLO 2016-5 172 172 230 255 325 355 465 573 695 950 31-May-16 KKR CLO 14 162 162 230 230 321 325 435 490 700 882 02-Jun-16 Flatiron 2016-1 155 220 305 435 725
03-Jun-16 TIAA CLO I 170 170 230 252 325 352 520 575 805/1000 950/1000
07-Jun-16 Voya CLO 2016-2 154 154 210 210 290 290 425 455 695 800
09-Jun-16 TICP CLO V 164 164 239 249 300 320 435/498 498/528 750 950 10-Jun-16 Westcott Park CLO 153 153 210 210 290 290 435 450 720 800 10-Jun-16 ALM XVIII 153 153 215 215 290 290 435 450 760 800 16-Jun-16 Seven Sticks CLO 170 170 230 230 325 325 410 520 760 925 16-Jun-16 Galaxy CLO XXII 158 158 210 210 290 290 445 450 700/825 825/840 820 950 16-Jun-16 Venture CLO XXIII 165 230 320 445 770
17-Jun-16 Benefit Street Partners CLO IX 161 161 210 210 295 295 420 480 667 905
17-Jun-16 1828 CLO 160 160 240 240 340 340 450 515 700 925
22-Jun-16 GoldenTree Loan Opportunities XII 153 153 215 215 290 290 425 450 715 850
22-Jun-16 Anchorage Capital CLO 8 165 167 225 225 315 315 420 495 650 23-Jun-16 Ares XXXIX 153 200 275 430 725 30-Jun-16 Mariner CLO 2016-3 159 159 200 290 400 700
Cont’d on next slide
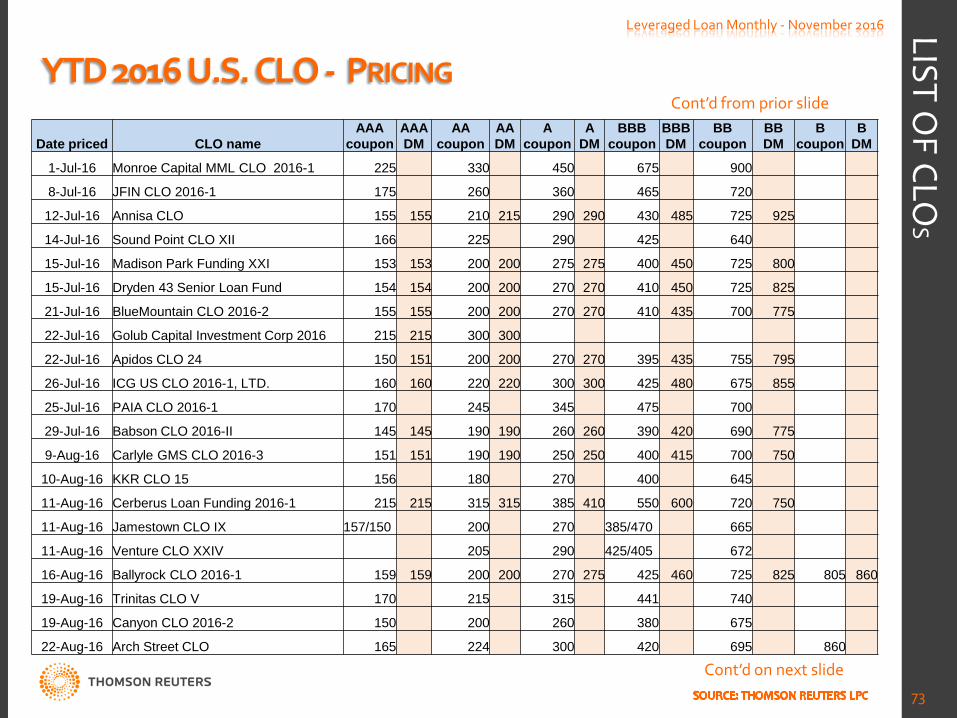
YTD 2016 U.S. CLO - PRICING Leveraged Loan Monthly - November 2016
73
LIST OF CLO
S
Cont’d from prior slide
Date priced CLO name AAA
coupon AAA DM
AA coupon
AA DM
A coupon
A DM
BBB coupon
BBB DM
BB coupon
BB DM
B coupon
B DM
1-Jul-16 Monroe Capital MML CLO 2016-1 225 330 450 675 900
8-Jul-16 JFIN CLO 2016-1 175 260 360 465 720
12-Jul-16 Annisa CLO 155 155 210 215 290 290 430 485 725 925
14-Jul-16 Sound Point CLO XII 166 225 290 425 640
15-Jul-16 Madison Park Funding XXI 153 153 200 200 275 275 400 450 725 800
15-Jul-16 Dryden 43 Senior Loan Fund 154 154 200 200 270 270 410 450 725 825
21-Jul-16 BlueMountain CLO 2016-2 155 155 200 200 270 270 410 435 700 775
22-Jul-16 Golub Capital Investment Corp 2016 215 215 300 300
22-Jul-16 Apidos CLO 24 150 151 200 200 270 270 395 435 755 795
26-Jul-16 ICG US CLO 2016-1, LTD. 160 160 220 220 300 300 425 480 675 855
25-Jul-16 PAIA CLO 2016-1 170 245 345 475 700
29-Jul-16 Babson CLO 2016-II 145 145 190 190 260 260 390 420 690 775
9-Aug-16 Carlyle GMS CLO 2016-3 151 151 190 190 250 250 400 415 700 750
10-Aug-16 KKR CLO 15 156 180 270 400 645
11-Aug-16 Cerberus Loan Funding 2016-1 215 215 315 315 385 410 550 600 720 750
11-Aug-16 Jamestown CLO IX 157/150 200 270 385/470 665
11-Aug-16 Venture CLO XXIV 205 290 425/405 672
16-Aug-16 Ballyrock CLO 2016-1 159 159 200 200 270 275 425 460 725 825 805 860
19-Aug-16 Trinitas CLO V 170 215 315 441 740
19-Aug-16 Canyon CLO 2016-2 150 200 260 380 675
22-Aug-16 Arch Street CLO 165 224 300 420 695 860
Cont’d on next slide
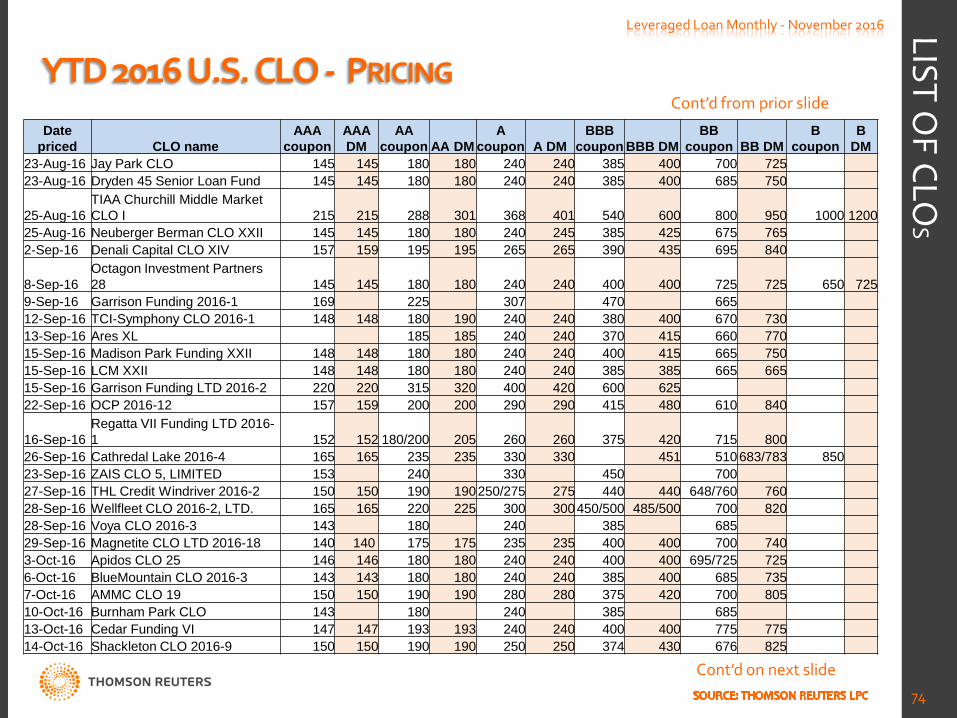
YTD 2016 U.S. CLO - PRICING Leveraged Loan Monthly - November 2016
74
LIST OF CLO
S
Cont’d from prior slide
Date priced CLO name
AAA coupon
AAA DM
AA coupon AA DM
A coupon A DM
BBB coupon BBB DM
BB coupon BB DM
B coupon
B DM
23-Aug-16 Jay Park CLO 145 145 180 180 240 240 385 400 700 725 23-Aug-16 Dryden 45 Senior Loan Fund 145 145 180 180 240 240 385 400 685 750
25-Aug-16 TIAA Churchill Middle Market CLO I 215 215 288 301 368 401 540 600 800 950 1000 1200
25-Aug-16 Neuberger Berman CLO XXII 145 145 180 180 240 245 385 425 675 765 2-Sep-16 Denali Capital CLO XIV 157 159 195 195 265 265 390 435 695 840
8-Sep-16 Octagon Investment Partners 28 145 145 180 180 240 240 400 400 725 725 650 725
9-Sep-16 Garrison Funding 2016-1 169 225 307 470 665 12-Sep-16 TCI-Symphony CLO 2016-1 148 148 180 190 240 240 380 400 670 730 13-Sep-16 Ares XL 185 185 240 240 370 415 660 770 15-Sep-16 Madison Park Funding XXII 148 148 180 180 240 240 400 415 665 750 15-Sep-16 LCM XXII 148 148 180 180 240 240 385 385 665 665 15-Sep-16 Garrison Funding LTD 2016-2 220 220 315 320 400 420 600 625 22-Sep-16 OCP 2016-12 157 159 200 200 290 290 415 480 610 840
16-Sep-16 Regatta VII Funding LTD 2016-1 152 152 180/200 205 260 260 375 420 715 800
26-Sep-16 Cathredal Lake 2016-4 165 165 235 235 330 330 451 510 683/783 850 23-Sep-16 ZAIS CLO 5, LIMITED 153 240 330 450 700 27-Sep-16 THL Credit Windriver 2016-2 150 150 190 190 250/275 275 440 440 648/760 760 28-Sep-16 Wellfleet CLO 2016-2, LTD. 165 165 220 225 300 300 450/500 485/500 700 820 28-Sep-16 Voya CLO 2016-3 143 180 240 385 685 29-Sep-16 Magnetite CLO LTD 2016-18 140 140 175 175 235 235 400 400 700 740 3-Oct-16 Apidos CLO 25 146 146 180 180 240 240 400 400 695/725 725 6-Oct-16 BlueMountain CLO 2016-3 143 143 180 180 240 240 385 400 685 735 7-Oct-16 AMMC CLO 19 150 150 190 190 280 280 375 420 700 805 10-Oct-16 Burnham Park CLO 143 180 240 385 685 13-Oct-16 Cedar Funding VI 147 147 193 193 240 240 400 400 775 775 14-Oct-16 Shackleton CLO 2016-9 150 150 190 190 250 250 374 430 676 825
Cont’d on next slide
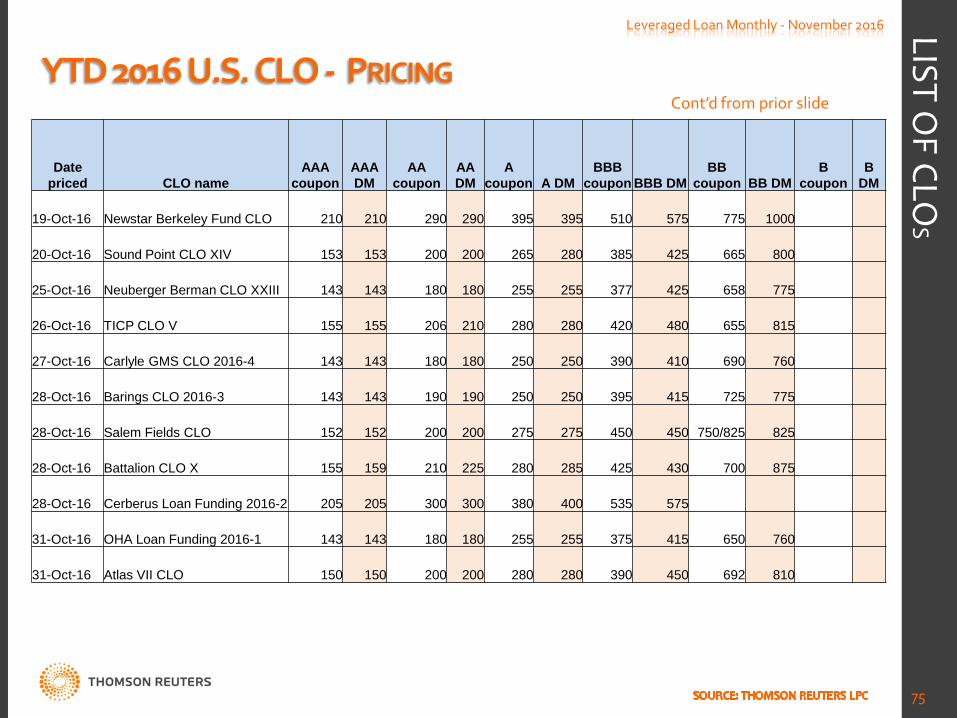
YTD 2016 U.S. CLO - PRICING Leveraged Loan Monthly - November 2016
75
LIST OF CLO
S
Cont’d from prior slide
Date priced CLO name
AAA coupon
AAA DM
AA coupon
AA DM
A coupon A DM
BBB coupon BBB DM
BB coupon BB DM
B coupon
B DM
19-Oct-16 Newstar Berkeley Fund CLO 210 210 290 290 395 395 510 575 775 1000
20-Oct-16 Sound Point CLO XIV 153 153 200 200 265 280 385 425 665 800
25-Oct-16 Neuberger Berman CLO XXIII 143 143 180 180 255 255 377 425 658 775
26-Oct-16 TICP CLO V 155 155 206 210 280 280 420 480 655 815
27-Oct-16 Carlyle GMS CLO 2016-4 143 143 180 180 250 250 390 410 690 760
28-Oct-16 Barings CLO 2016-3 143 143 190 190 250 250 395 415 725 775
28-Oct-16 Salem Fields CLO 152 152 200 200 275 275 450 450 750/825 825
28-Oct-16 Battalion CLO X 155 159 210 225 280 285 425 430 700 875
28-Oct-16 Cerberus Loan Funding 2016-2 205 205 300 300 380 400 535 575
31-Oct-16 OHA Loan Funding 2016-1 143 143 180 180 255 255 375 415 650 760
31-Oct-16 Atlas VII CLO 150 150 200 200 280 280 390 450 692 810
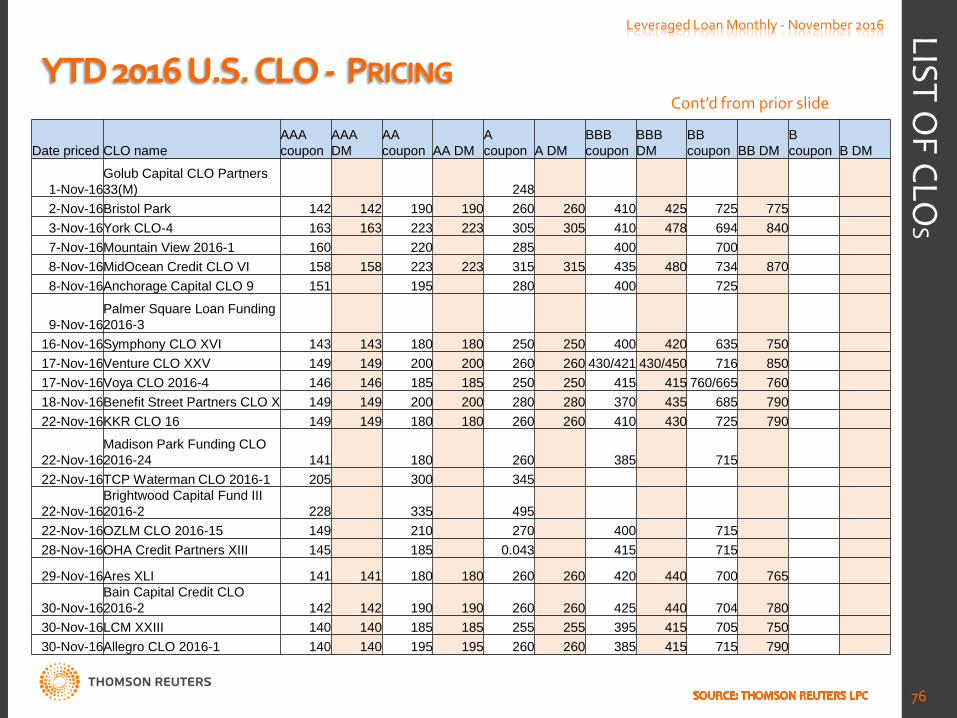
YTD 2016 U.S. CLO - PRICING Leveraged Loan Monthly - November 2016
76
LIST OF CLO
S
Cont’d from prior slide
Date priced CLO name AAA coupon
AAA DM
AA coupon AA DM
A coupon A DM
BBB coupon
BBB DM
BB coupon BB DM
B coupon B DM
1-Nov-16 Golub Capital CLO Partners 33(M) 248
2-Nov-16 Bristol Park 142 142 190 190 260 260 410 425 725 775 3-Nov-16 York CLO-4 163 163 223 223 305 305 410 478 694 840 7-Nov-16 Mountain View 2016-1 160 220 285 400 700 8-Nov-16 MidOcean Credit CLO VI 158 158 223 223 315 315 435 480 734 870 8-Nov-16 Anchorage Capital CLO 9 151 195 280 400 725
9-Nov-16 Palmer Square Loan Funding 2016-3
16-Nov-16 Symphony CLO XVI 143 143 180 180 250 250 400 420 635 750 17-Nov-16 Venture CLO XXV 149 149 200 200 260 260 430/421 430/450 716 850 17-Nov-16 Voya CLO 2016-4 146 146 185 185 250 250 415 415 760/665 760 18-Nov-16 Benefit Street Partners CLO X 149 149 200 200 280 280 370 435 685 790 22-Nov-16 KKR CLO 16 149 149 180 180 260 260 410 430 725 790
22-Nov-16 Madison Park Funding CLO 2016-24 141 180 260 385 715
22-Nov-16 TCP Waterman CLO 2016-1 205 300 345
22-Nov-16 Brightwood Capital Fund III 2016-2 228 335 495
22-Nov-16 OZLM CLO 2016-15 149 210 270 400 715 28-Nov-16 OHA Credit Partners XIII 145 185 0.043 415 715
29-Nov-16 Ares XLI 141 141 180 180 260 260 420 440 700 765
30-Nov-16 Bain Capital Credit CLO 2016-2 142 142 190 190 260 260 425 440 704 780
30-Nov-16 LCM XXIII 140 140 185 185 255 255 395 415 705 750 30-Nov-16 Allegro CLO 2016-1 140 140 195 195 260 260 385 415 715 790
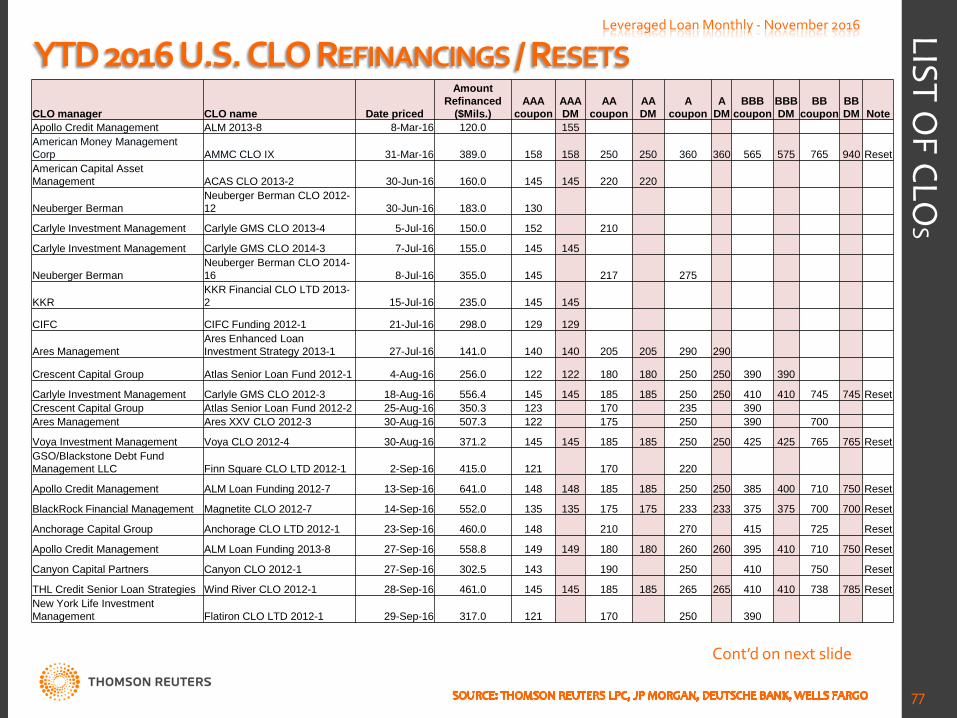
YTD 2016 U.S. CLO REFINANCINGS / RESETS Leveraged Loan Monthly - November 2016
77
LIST OF CLO
S
CLO manager CLO name Date priced
Amount Refinanced
($Mils.) AAA
coupon AAA DM
AA coupon
AA DM
A coupon
A DM
BBB coupon
BBB DM
BB coupon
BB DM Note
Apollo Credit Management ALM 2013-8 8-Mar-16 120.0 155 American Money Management Corp AMMC CLO IX 31-Mar-16 389.0 158 158 250 250 360 360 565 575 765 940 Reset American Capital Asset Management ACAS CLO 2013-2 30-Jun-16 160.0 145 145 220 220
Neuberger Berman Neuberger Berman CLO 2012-12 30-Jun-16 183.0 130
Carlyle Investment Management Carlyle GMS CLO 2013-4 5-Jul-16 150.0 152 210
Carlyle Investment Management Carlyle GMS CLO 2014-3 7-Jul-16 155.0 145 145
Neuberger Berman Neuberger Berman CLO 2014-16 8-Jul-16 355.0 145 217 275
KKR KKR Financial CLO LTD 2013-2 15-Jul-16 235.0 145 145
CIFC CIFC Funding 2012-1 21-Jul-16 298.0 129 129
Ares Management Ares Enhanced Loan Investment Strategy 2013-1 27-Jul-16 141.0 140 140 205 205 290 290
Crescent Capital Group Atlas Senior Loan Fund 2012-1 4-Aug-16 256.0 122 122 180 180 250 250 390 390
Carlyle Investment Management Carlyle GMS CLO 2012-3 18-Aug-16 556.4 145 145 185 185 250 250 410 410 745 745 Reset Crescent Capital Group Atlas Senior Loan Fund 2012-2 25-Aug-16 350.3 123 170 235 390 Ares Management Ares XXV CLO 2012-3 30-Aug-16 507.3 122 175 250 390 700
Voya Investment Management Voya CLO 2012-4 30-Aug-16 371.2 145 145 185 185 250 250 425 425 765 765 Reset GSO/Blackstone Debt Fund Management LLC Finn Square CLO LTD 2012-1 2-Sep-16 415.0 121 170 220
Apollo Credit Management ALM Loan Funding 2012-7 13-Sep-16 641.0 148 148 185 185 250 250 385 400 710 750 Reset
BlackRock Financial Management Magnetite CLO 2012-7 14-Sep-16 552.0 135 135 175 175 233 233 375 375 700 700 Reset
Anchorage Capital Group Anchorage CLO LTD 2012-1 23-Sep-16 460.0 148 210 270 415 725 Reset
Apollo Credit Management ALM Loan Funding 2013-8 27-Sep-16 558.8 149 149 180 180 260 260 395 410 710 750 Reset
Canyon Capital Partners Canyon CLO 2012-1 27-Sep-16 302.5 143 190 250 410 750 Reset
THL Credit Senior Loan Strategies Wind River CLO 2012-1 28-Sep-16 461.0 145 145 185 185 265 265 410 410 738 785 Reset New York Life Investment Management Flatiron CLO LTD 2012-1 29-Sep-16 317.0 121 170 250 390
Cont’d on next slide
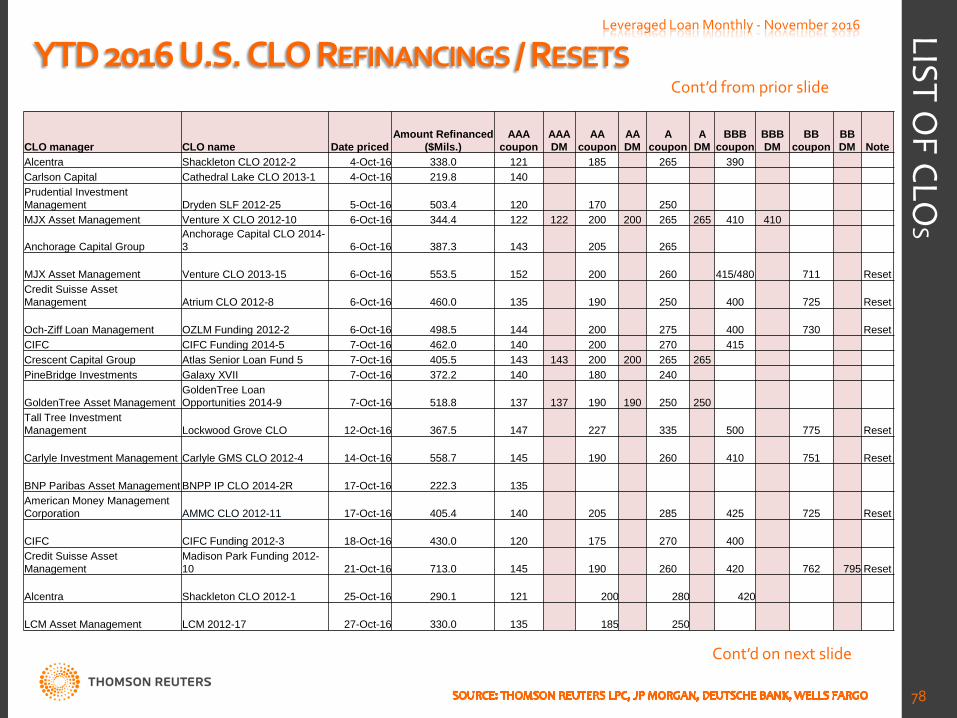
YTD 2016 U.S. CLO REFINANCINGS / RESETS Leveraged Loan Monthly - November 2016
78
LIST OF CLO
S
CLO manager CLO name Date priced Amount Refinanced
($Mils.) AAA
coupon AAA DM
AA coupon
AA DM
A coupon
A DM
BBB coupon
BBB DM
BB coupon
BB DM Note
Alcentra Shackleton CLO 2012-2 4-Oct-16 338.0 121 185 265 390 Carlson Capital Cathedral Lake CLO 2013-1 4-Oct-16 219.8 140 Prudential Investment Management Dryden SLF 2012-25 5-Oct-16 503.4 120 170 250 MJX Asset Management Venture X CLO 2012-10 6-Oct-16 344.4 122 122 200 200 265 265 410 410
Anchorage Capital Group Anchorage Capital CLO 2014-3 6-Oct-16 387.3 143 205 265
MJX Asset Management Venture CLO 2013-15 6-Oct-16 553.5 152 200 260 415/480 711 Reset Credit Suisse Asset Management Atrium CLO 2012-8 6-Oct-16 460.0 135 190 250 400 725 Reset
Och-Ziff Loan Management OZLM Funding 2012-2 6-Oct-16 498.5 144 200 275 400 730 Reset CIFC CIFC Funding 2014-5 7-Oct-16 462.0 140 200 270 415 Crescent Capital Group Atlas Senior Loan Fund 5 7-Oct-16 405.5 143 143 200 200 265 265 PineBridge Investments Galaxy XVII 7-Oct-16 372.2 140 180 240
GoldenTree Asset Management GoldenTree Loan Opportunities 2014-9 7-Oct-16 518.8 137 137 190 190 250 250
Tall Tree Investment Management Lockwood Grove CLO 12-Oct-16 367.5 147 227 335 500 775 Reset
Carlyle Investment Management Carlyle GMS CLO 2012-4 14-Oct-16 558.7 145 190 260 410 751 Reset
BNP Paribas Asset Management BNPP IP CLO 2014-2R 17-Oct-16 222.3 135 American Money Management Corporation AMMC CLO 2012-11 17-Oct-16 405.4 140 205 285 425 725 Reset
CIFC CIFC Funding 2012-3 18-Oct-16 430.0 120 175 270 400 Credit Suisse Asset Management
Madison Park Funding 2012-10 21-Oct-16 713.0 145 190 260 420 762 795 Reset
Alcentra Shackleton CLO 2012-1 25-Oct-16 290.1 121 200 280 420
LCM Asset Management LCM 2012-17 27-Oct-16 330.0 135 185 250
Cont’d from prior slide
Cont’d on next slide
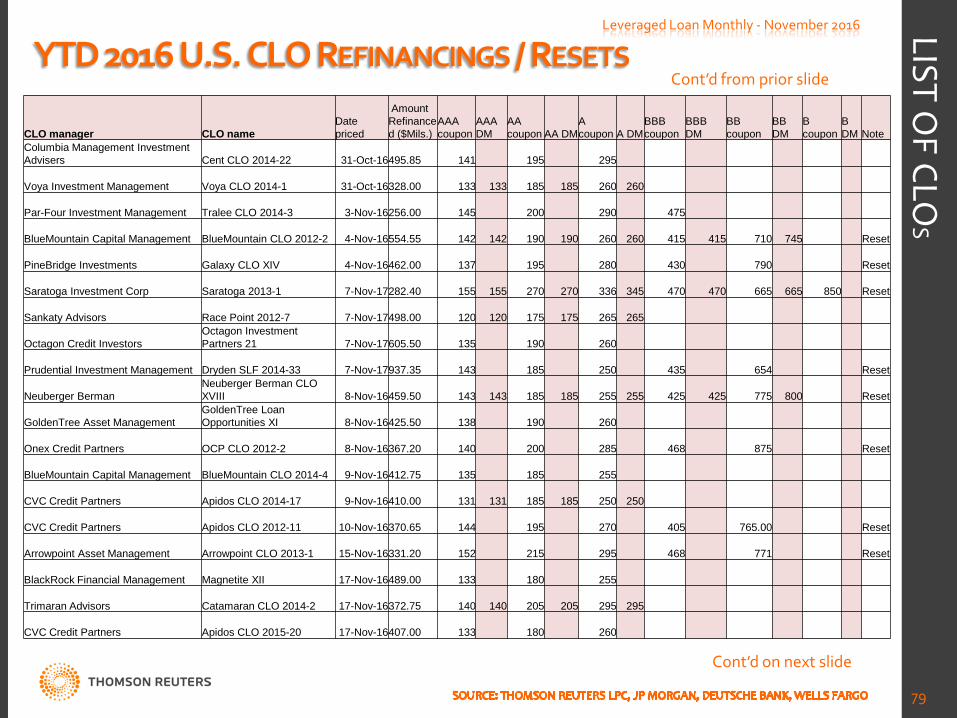
YTD 2016 U.S. CLO REFINANCINGS / RESETS Leveraged Loan Monthly - November 2016
79
LIST OF CLO
S
Cont’d from prior slide
CLO manager CLO name Date priced
Amount Refinanced ($Mils.)
AAA coupon
AAA DM
AA coupon AA DM
A coupon A DM
BBB coupon
BBB DM
BB coupon
BB DM
B coupon
B DM Note
Columbia Management Investment Advisers Cent CLO 2014-22 31-Oct-16
495.85 141 195 295
Voya Investment Management Voya CLO 2014-1 31-Oct-16 328.00 133 133 185 185 260 260
Par-Four Investment Management Tralee CLO 2014-3 3-Nov-16 256.00 145 200 290 475
BlueMountain Capital Management BlueMountain CLO 2012-2 4-Nov-16 554.55 142 142 190 190 260 260 415 415 710 745 Reset
PineBridge Investments Galaxy CLO XIV 4-Nov-16 462.00 137 195 280 430 790 Reset
Saratoga Investment Corp Saratoga 2013-1 7-Nov-17 282.40 155 155 270 270 336 345 470 470 665 665 850 Reset
Sankaty Advisors Race Point 2012-7 7-Nov-17 498.00 120 120 175 175 265 265
Octagon Credit Investors Octagon Investment Partners 21 7-Nov-17
605.50 135 190 260
Prudential Investment Management Dryden SLF 2014-33 7-Nov-17 937.35 143 185 250 435 654 Reset
Neuberger Berman Neuberger Berman CLO XVIII 8-Nov-16
459.50 143 143 185 185 255 255 425 425 775 800 Reset
GoldenTree Asset Management GoldenTree Loan Opportunities XI 8-Nov-16
425.50 138 190 260
Onex Credit Partners OCP CLO 2012-2 8-Nov-16 367.20 140 200 285 468 875 Reset
BlueMountain Capital Management BlueMountain CLO 2014-4 9-Nov-16 412.75 135 185 255
CVC Credit Partners Apidos CLO 2014-17 9-Nov-16 410.00 131 131 185 185 250 250
CVC Credit Partners Apidos CLO 2012-11 10-Nov-16 370.65 144 195 270 405 765.00 Reset
Arrowpoint Asset Management Arrowpoint CLO 2013-1 15-Nov-16 331.20 152 215 295 468 771 Reset
BlackRock Financial Management Magnetite XII 17-Nov-16 489.00 133 180 255
Trimaran Advisors Catamaran CLO 2014-2 17-Nov-16 372.75 140 140 205 205 295 295
CVC Credit Partners Apidos CLO 2015-20 17-Nov-16 407.00 133 180 260
Cont’d on next slide
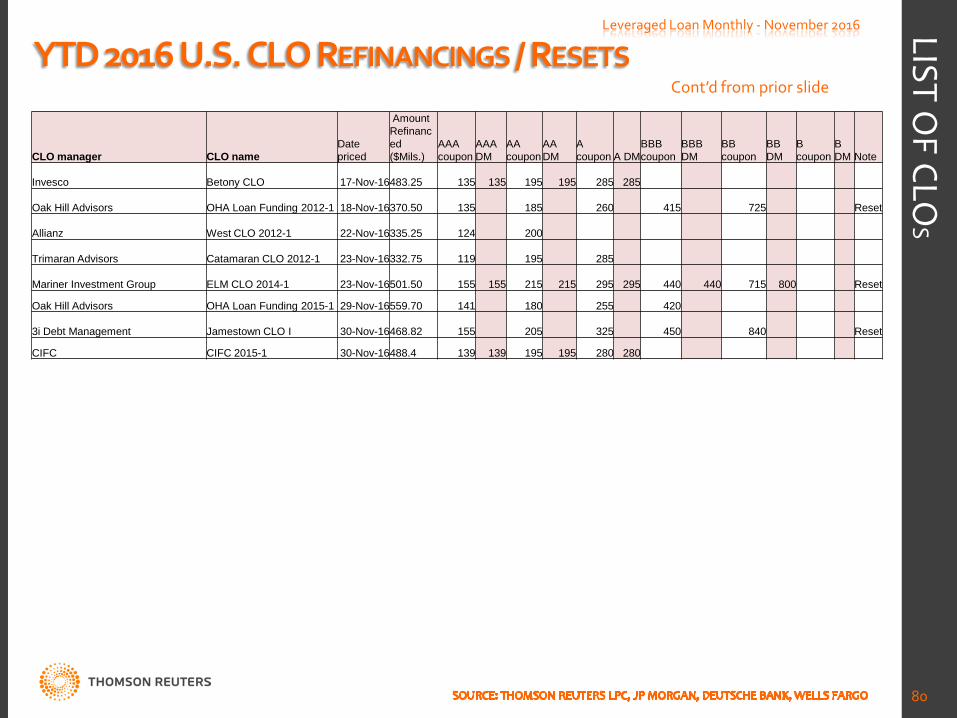
YTD 2016 U.S. CLO REFINANCINGS / RESETS Leveraged Loan Monthly - November 2016
80
LIST OF CLO
S
Cont’d from prior slide
CLO manager CLO name Date priced
Amount Refinanced ($Mils.)
AAA coupon
AAA DM
AA coupon
AA DM
A coupon A DM
BBB coupon
BBB DM
BB coupon
BB DM
B coupon
B DM Note
Invesco Betony CLO 17-Nov-16 483.25 135 135 195 195 285 285
Oak Hill Advisors OHA Loan Funding 2012-1 18-Nov-16 370.50 135 185 260 415 725 Reset
Allianz West CLO 2012-1 22-Nov-16 335.25 124 200
Trimaran Advisors Catamaran CLO 2012-1 23-Nov-16 332.75 119 195 285
Mariner Investment Group ELM CLO 2014-1 23-Nov-16 501.50 155 155 215 215 295 295 440 440 715 800 Reset
Oak Hill Advisors OHA Loan Funding 2015-1 29-Nov-16 559.70 141 180 255 420
3i Debt Management Jamestown CLO I 30-Nov-16 468.82 155 205 325 450 840 Reset
CIFC CIFC 2015-1 30-Nov-16 488.4 139 139 195 195 280 280
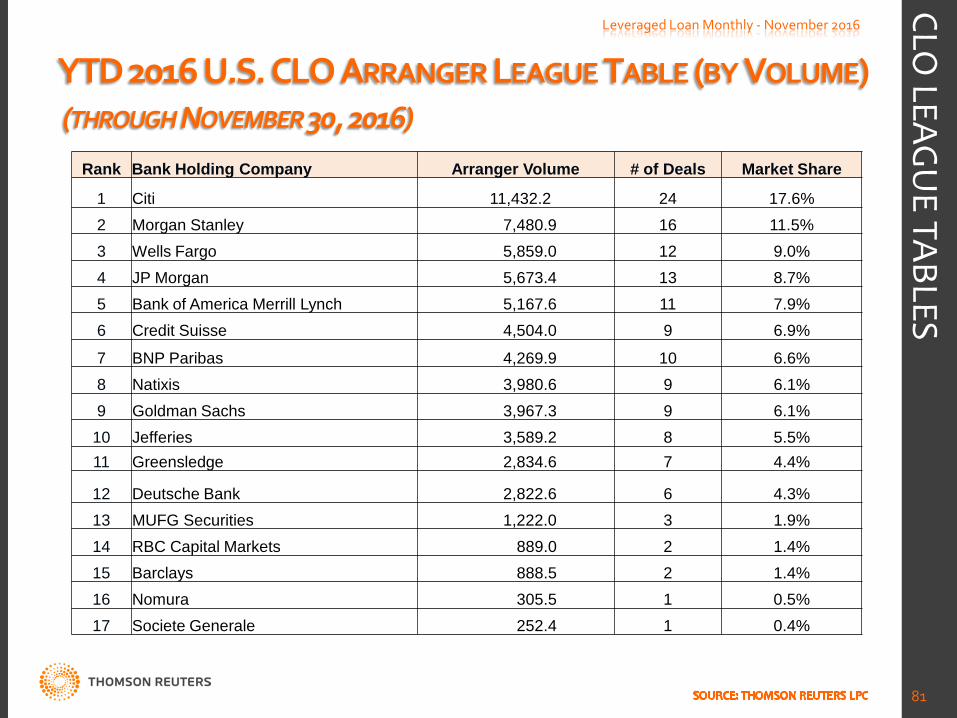
YTD 2016 U.S. CLO ARRANGER LEAGUE TABLE (BY VOLUME) (THROUGH NOVEMBER 30, 2016)
Leveraged Loan Monthly - November 2016
81
CLO LEAG
UE TABLES
Rank Bank Holding Company Arranger Volume # of Deals Market Share
1 Citi 11,432.2 24 17.6% 2 Morgan Stanley 7,480.9 16 11.5% 3 Wells Fargo 5,859.0 12 9.0% 4 JP Morgan 5,673.4 13 8.7% 5 Bank of America Merrill Lynch 5,167.6 11 7.9% 6 Credit Suisse 4,504.0 9 6.9%
7 BNP Paribas 4,269.9 10 6.6% 8 Natixis 3,980.6 9 6.1% 9 Goldman Sachs 3,967.3 9 6.1%
10 Jefferies 3,589.2 8 5.5% 11 Greensledge 2,834.6 7 4.4%
12 Deutsche Bank 2,822.6 6 4.3% 13 MUFG Securities 1,222.0 3 1.9% 14 RBC Capital Markets 889.0 2 1.4% 15 Barclays 888.5 2 1.4% 16 Nomura 305.5 1 0.5% 17 Societe Generale 252.4 1 0.4%

YTD 2016 U.S. CLO MANAGER LEAGUE TABLE (BY VOLUME)
(THROUGH NOVEMBER 30, 2016)
Leveraged Loan Monthly - November 2016
82
CLO LEAG
UE TABLES
Cont’d on next slide
Rank CLO Manager CLO Volume # of Deals Market Share 1 Credit Suisse Asset Management 2,890.9 4 4.44% 2 GSO Blackstone 2,278.8 4 3.50% 3 Voya Investment Management 2,142.0 4 3.29% 4 Sound Point Capital Management 1,950.0 3 2.99% 5 Carlyle Investment Management 1,915.5 4 2.94% 6 Ares Management 1,831.1 3 2.81% 7 Octagon Credit Investors 1,725.0 3 2.65% 8 Prudential Investment Management 1,673.0 3 2.57% 9 Golub Capital 1,652.9 4 2.54%
10 KKR 1,630.3 3 2.50% 11 MJX Asset Management 1,538.6 3 2.36% 12 Symphony Asset Management 1,531.0 3 2.35% 13 BlueMountain Capital Management 1,410.1 3 2.16% 14 Brightwood Capital Advisors 1,403.0 2 2.15% 15 Barings LLC 1,330.3 3 2.04% 16 THL Credit 1,264.0 2 1.94% 17 NewStar Financial 1,263.5 3 1.94% 18 Guggenheim Investment Management 1,260.0 3 1.93% 19 LCM Asset Management 1,237.6 3 1.90% 20 Neuberger Berman 1,182.5 3 1.82% 21 CVC Credit Partners 1,125.5 2 1.73% 22 Onex Credit Partners 1,059.0 2 1.63% 23 BlackRock Financial Management 1,034.0 2 1.59% 24 Oak Hill Advisors 1,019.5 2 1.57% 25 Anchorage Capital Group 970.7 2 1.49% 26 Apollo Credit Management 923.0 2 1.42% 27 Benefit Street Partners 914.5 2 1.40% 28 Canyon Capital 912.0 2 1.40% 29 Highbridge Principal Strategies 909.0 2 1.40% 30 Aegon USA Investment Management 895.5 2 1.37%
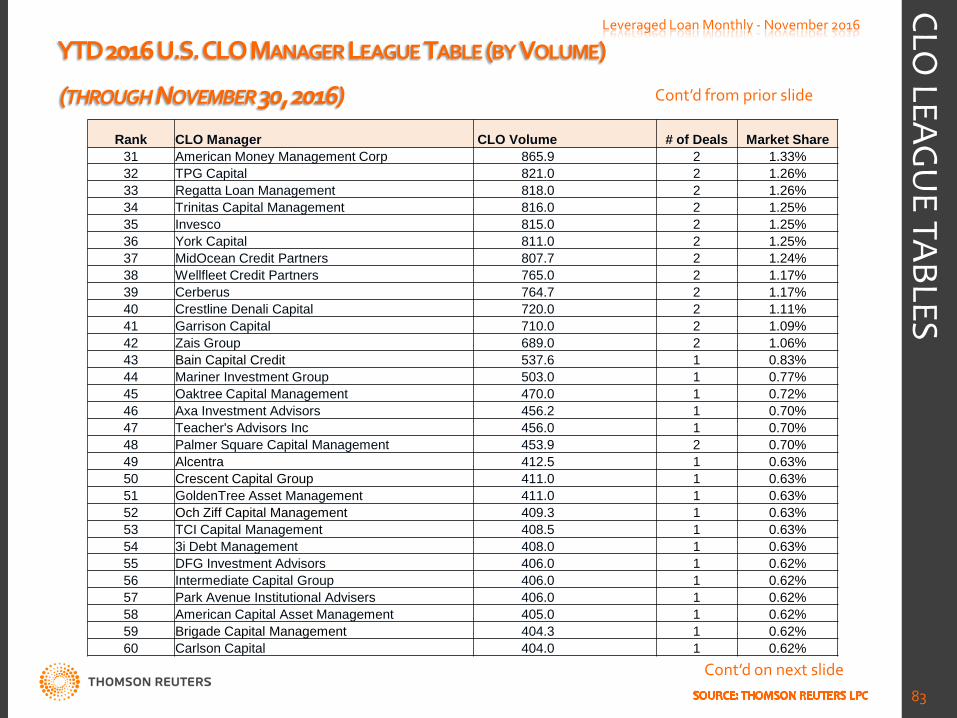
YTD 2016 U.S. CLO MANAGER LEAGUE TABLE (BY VOLUME)
(THROUGH NOVEMBER 30, 2016)
Leveraged Loan Monthly - November 2016
83
CLO LEAG
UE TABLES
Cont’d from prior slide
Cont’d on next slide
Rank CLO Manager CLO Volume # of Deals Market Share 31 American Money Management Corp 865.9 2 1.33% 32 TPG Capital 821.0 2 1.26% 33 Regatta Loan Management 818.0 2 1.26% 34 Trinitas Capital Management 816.0 2 1.25% 35 Invesco 815.0 2 1.25% 36 York Capital 811.0 2 1.25% 37 MidOcean Credit Partners 807.7 2 1.24% 38 Wellfleet Credit Partners 765.0 2 1.17% 39 Cerberus 764.7 2 1.17% 40 Crestline Denali Capital 720.0 2 1.11% 41 Garrison Capital 710.0 2 1.09% 42 Zais Group 689.0 2 1.06% 43 Bain Capital Credit 537.6 1 0.83% 44 Mariner Investment Group 503.0 1 0.77% 45 Oaktree Capital Management 470.0 1 0.72% 46 Axa Investment Advisors 456.2 1 0.70% 47 Teacher's Advisors Inc 456.0 1 0.70% 48 Palmer Square Capital Management 453.9 2 0.70% 49 Alcentra 412.5 1 0.63% 50 Crescent Capital Group 411.0 1 0.63% 51 GoldenTree Asset Management 411.0 1 0.63% 52 Och Ziff Capital Management 409.3 1 0.63% 53 TCI Capital Management 408.5 1 0.63% 54 3i Debt Management 408.0 1 0.63% 55 DFG Investment Advisors 406.0 1 0.62% 56 Intermediate Capital Group 406.0 1 0.62% 57 Park Avenue Institutional Advisers 406.0 1 0.62% 58 American Capital Asset Management 405.0 1 0.62% 59 Brigade Capital Management 404.3 1 0.62% 60 Carlson Capital 404.0 1 0.62%
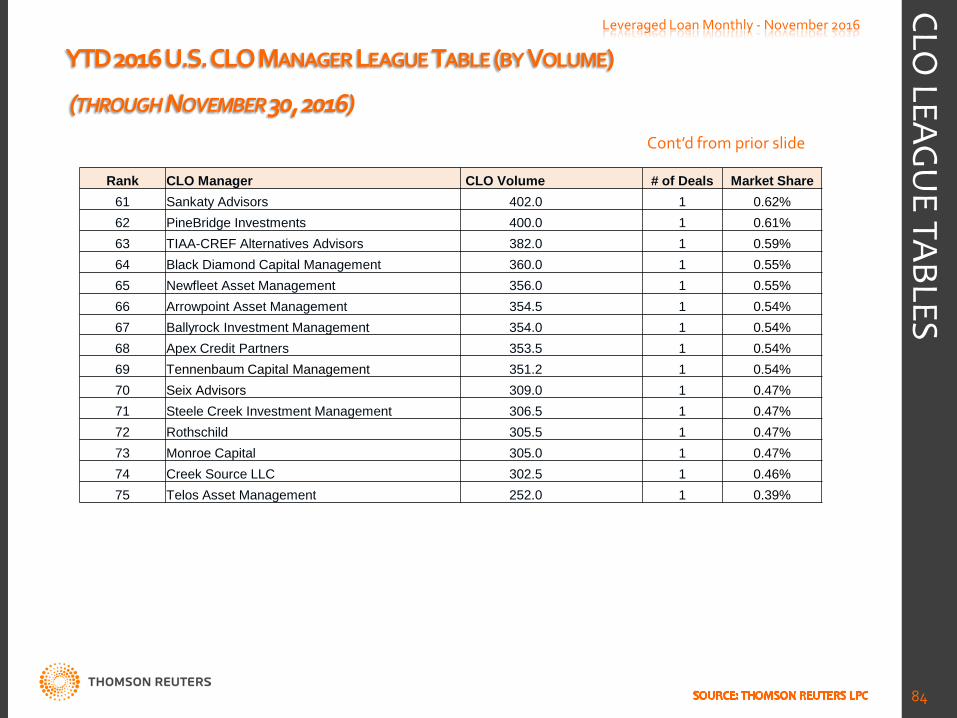
YTD 2016 U.S. CLO MANAGER LEAGUE TABLE (BY VOLUME)
(THROUGH NOVEMBER 30, 2016)
Leveraged Loan Monthly - November 2016
84
CLO LEAG
UE TABLES
Cont’d from prior slide
Rank CLO Manager CLO Volume # of Deals Market Share 61 Sankaty Advisors 402.0 1 0.62% 62 PineBridge Investments 400.0 1 0.61% 63 TIAA-CREF Alternatives Advisors 382.0 1 0.59% 64 Black Diamond Capital Management 360.0 1 0.55% 65 Newfleet Asset Management 356.0 1 0.55% 66 Arrowpoint Asset Management 354.5 1 0.54% 67 Ballyrock Investment Management 354.0 1 0.54% 68 Apex Credit Partners 353.5 1 0.54% 69 Tennenbaum Capital Management 351.2 1 0.54% 70 Seix Advisors 309.0 1 0.47% 71 Steele Creek Investment Management 306.5 1 0.47% 72 Rothschild 305.5 1 0.47% 73 Monroe Capital 305.0 1 0.47% 74 Creek Source LLC 302.5 1 0.46% 75 Telos Asset Management 252.0 1 0.39%
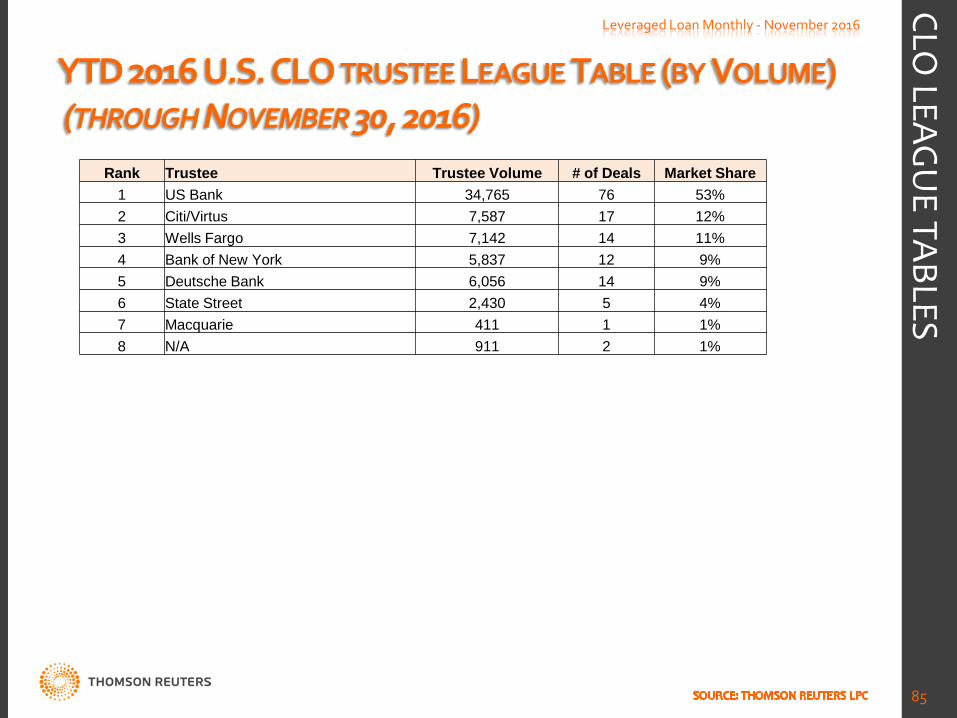
YTD 2016 U.S. CLO TRUSTEE LEAGUE TABLE (BY VOLUME) (THROUGH NOVEMBER 30, 2016)
Leveraged Loan Monthly - November 2016
85
CLO LEAG
UE TABLES
Rank Trustee Trustee Volume # of Deals Market Share 1 US Bank 34,765 76 53% 2 Citi/Virtus 7,587 17 12% 3 Wells Fargo 7,142 14 11% 4 Bank of New York 5,837 12 9% 5 Deutsche Bank 6,056 14 9% 6 State Street 2,430 5 4% 7 Macquarie 411 1 1% 8 N/A 911 2 1%
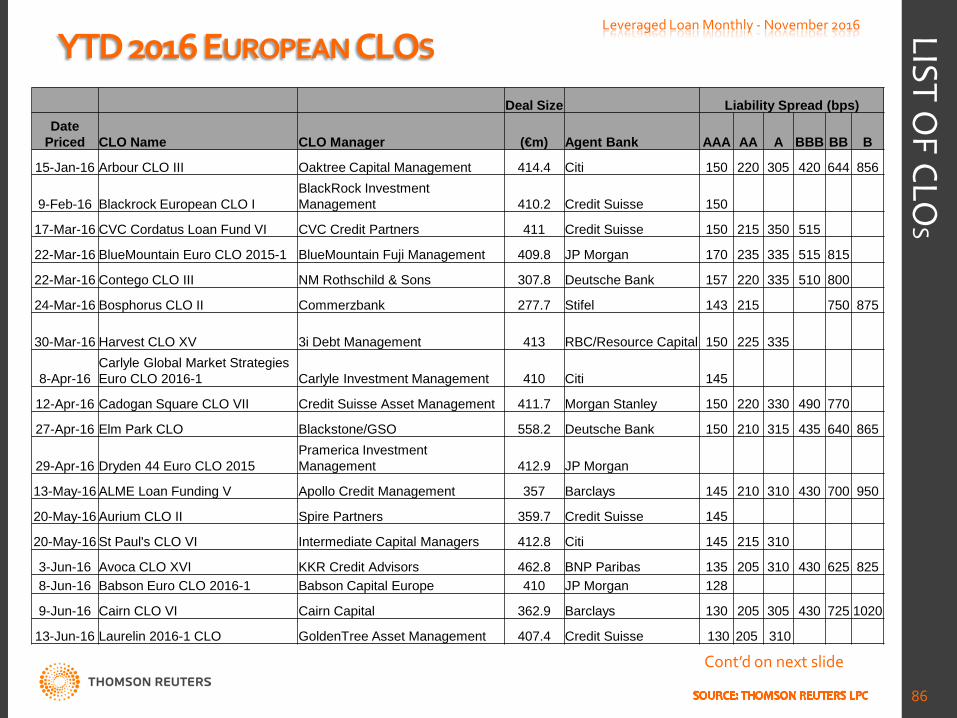
YTD 2016 EUROPEAN CLOS Leveraged Loan Monthly - November 2016
86
LIST OF CLO
S
Cont’d on next slide
Deal Size Liability Spread (bps) Date
Priced CLO Name CLO Manager (€m) Agent Bank AAA AA A BBB BB B
15-Jan-16 Arbour CLO III Oaktree Capital Management 414.4 Citi 150 220 305 420 644 856
9-Feb-16 Blackrock European CLO I BlackRock Investment Management 410.2 Credit Suisse 150
17-Mar-16 CVC Cordatus Loan Fund VI CVC Credit Partners 411 Credit Suisse 150 215 350 515
22-Mar-16 BlueMountain Euro CLO 2015-1 BlueMountain Fuji Management 409.8 JP Morgan 170 235 335 515 815
22-Mar-16 Contego CLO III NM Rothschild & Sons 307.8 Deutsche Bank 157 220 335 510 800
24-Mar-16 Bosphorus CLO II Commerzbank 277.7 Stifel 143 215 750 875
30-Mar-16 Harvest CLO XV 3i Debt Management 413 RBC/Resource Capital 150 225 335
8-Apr-16 Carlyle Global Market Strategies Euro CLO 2016-1 Carlyle Investment Management 410 Citi 145
12-Apr-16 Cadogan Square CLO VII Credit Suisse Asset Management 411.7 Morgan Stanley 150 220 330 490 770
27-Apr-16 Elm Park CLO Blackstone/GSO 558.2 Deutsche Bank 150 210 315 435 640 865
29-Apr-16 Dryden 44 Euro CLO 2015 Pramerica Investment Management 412.9 JP Morgan
13-May-16 ALME Loan Funding V Apollo Credit Management 357 Barclays 145 210 310 430 700 950
20-May-16 Aurium CLO II Spire Partners 359.7 Credit Suisse 145
20-May-16 St Paul's CLO VI Intermediate Capital Managers 412.8 Citi 145 215 310
3-Jun-16 Avoca CLO XVI KKR Credit Advisors 462.8 BNP Paribas 135 205 310 430 625 825 8-Jun-16 Babson Euro CLO 2016-1 Babson Capital Europe 410 JP Morgan 128
9-Jun-16 Cairn CLO VI Cairn Capital 362.9 Barclays 130 205 305 430 725 1020
13-Jun-16 Laurelin 2016-1 CLO GoldenTree Asset Management 407.4 Credit Suisse 130 205 310
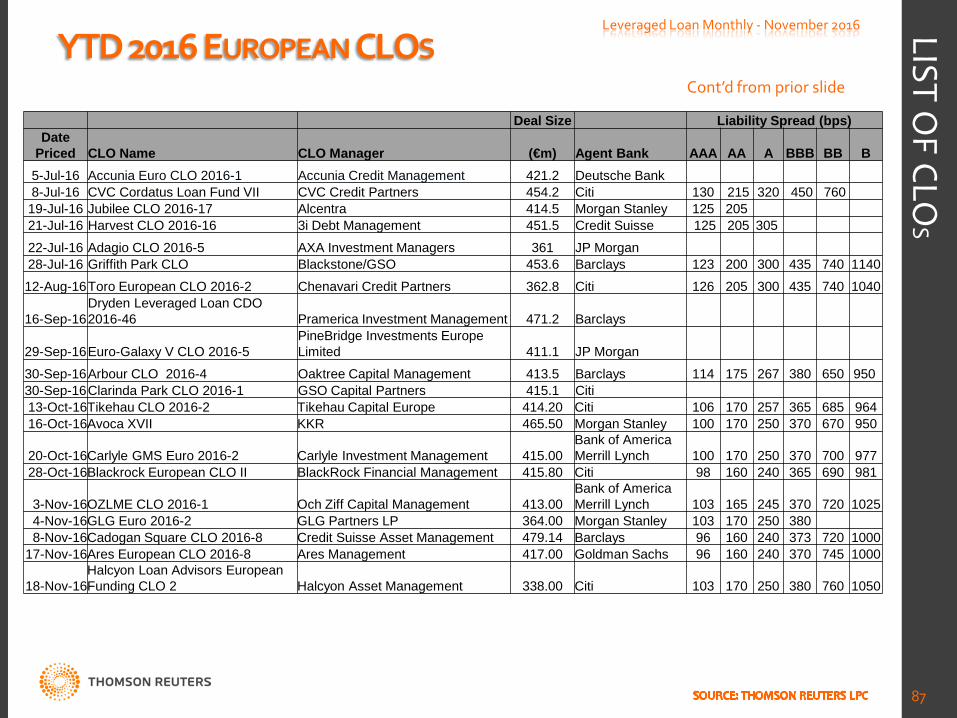
YTD 2016 EUROPEAN CLOS Leveraged Loan Monthly - November 2016
87
LIST OF CLO
S
Cont’d from prior slide
Deal Size Liability Spread (bps) Date
Priced CLO Name CLO Manager (€m) Agent Bank AAA AA A BBB BB B 5-Jul-16 Accunia Euro CLO 2016-1 Accunia Credit Management 421.2 Deutsche Bank 8-Jul-16 CVC Cordatus Loan Fund VII CVC Credit Partners 454.2 Citi 130 215 320 450 760 19-Jul-16 Jubilee CLO 2016-17 Alcentra 414.5 Morgan Stanley 125 205 21-Jul-16 Harvest CLO 2016-16 3i Debt Management 451.5 Credit Suisse 125 205 305
22-Jul-16 Adagio CLO 2016-5 AXA Investment Managers 361 JP Morgan 28-Jul-16 Griffith Park CLO Blackstone/GSO 453.6 Barclays 123 200 300 435 740 1140
12-Aug-16 Toro European CLO 2016-2 Chenavari Credit Partners 362.8 Citi 126 205 300 435 740 1040
16-Sep-16 Dryden Leveraged Loan CDO 2016-46 Pramerica Investment Management 471.2 Barclays
29-Sep-16 Euro-Galaxy V CLO 2016-5 PineBridge Investments Europe Limited 411.1 JP Morgan
30-Sep-16 Arbour CLO 2016-4 Oaktree Capital Management 413.5 Barclays 114 175 267 380 650 950 30-Sep-16 Clarinda Park CLO 2016-1 GSO Capital Partners 415.1 Citi 13-Oct-16 Tikehau CLO 2016-2 Tikehau Capital Europe 414.20 Citi 106 170 257 365 685 964 16-Oct-16 Avoca XVII KKR 465.50 Morgan Stanley 100 170 250 370 670 950
20-Oct-16 Carlyle GMS Euro 2016-2 Carlyle Investment Management 415.00 Bank of America Merrill Lynch 100 170 250 370 700 977
28-Oct-16 Blackrock European CLO II BlackRock Financial Management 415.80 Citi 98 160 240 365 690 981
3-Nov-16 OZLME CLO 2016-1 Och Ziff Capital Management 413.00 Bank of America Merrill Lynch 103 165 245 370 720 1025
4-Nov-16 GLG Euro 2016-2 GLG Partners LP 364.00 Morgan Stanley 103 170 250 380 8-Nov-16 Cadogan Square CLO 2016-8 Credit Suisse Asset Management 479.14 Barclays 96 160 240 373 720 1000
17-Nov-16 Ares European CLO 2016-8 Ares Management 417.00 Goldman Sachs 96 160 240 370 745 1000
18-Nov-16 Halcyon Loan Advisors European Funding CLO 2 Halcyon Asset Management 338.00 Citi 103 170 250 380 760 1050
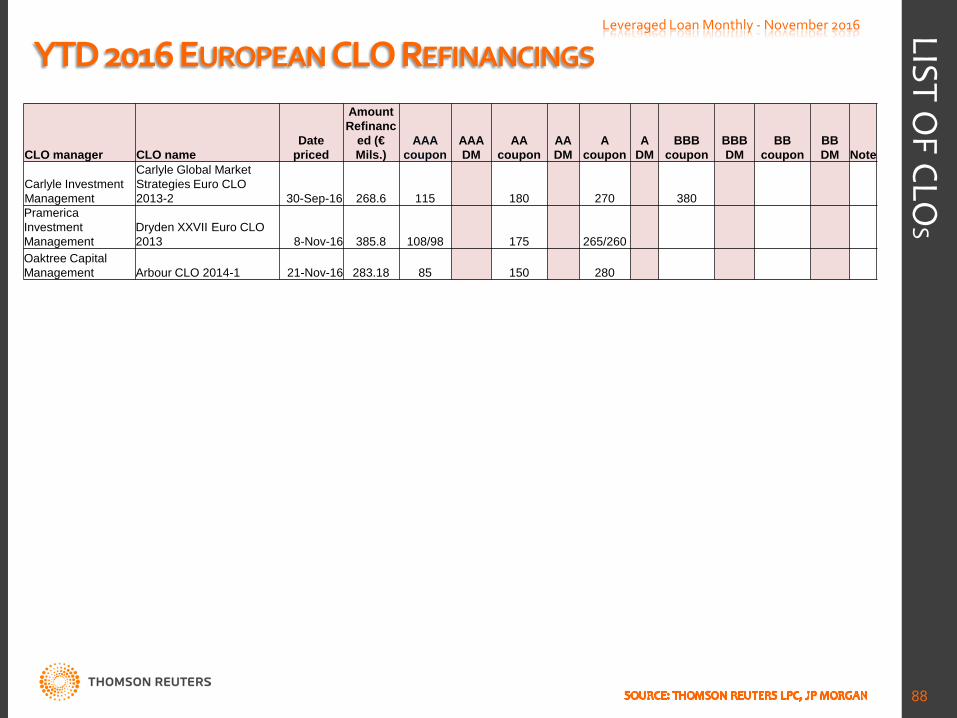
YTD 2016 EUROPEAN CLO REFINANCINGS Leveraged Loan Monthly - November 2016
88
LIST OF CLO
S
CLO manager CLO name Date
priced
Amount Refinanc
ed (€ Mils.)
AAA coupon
AAA DM
AA coupon
AA DM
A coupon
A DM
BBB coupon
BBB DM
BB coupon
BB DM Note
Carlyle Investment Management
Carlyle Global Market Strategies Euro CLO 2013-2 30-Sep-16 268.6 115 180 270 380
Pramerica Investment Management
Dryden XXVII Euro CLO 2013 8-Nov-16 385.8 108/98 175 265/260
Oaktree Capital Management Arbour CLO 2014-1 21-Nov-16 283.18 85 150 280
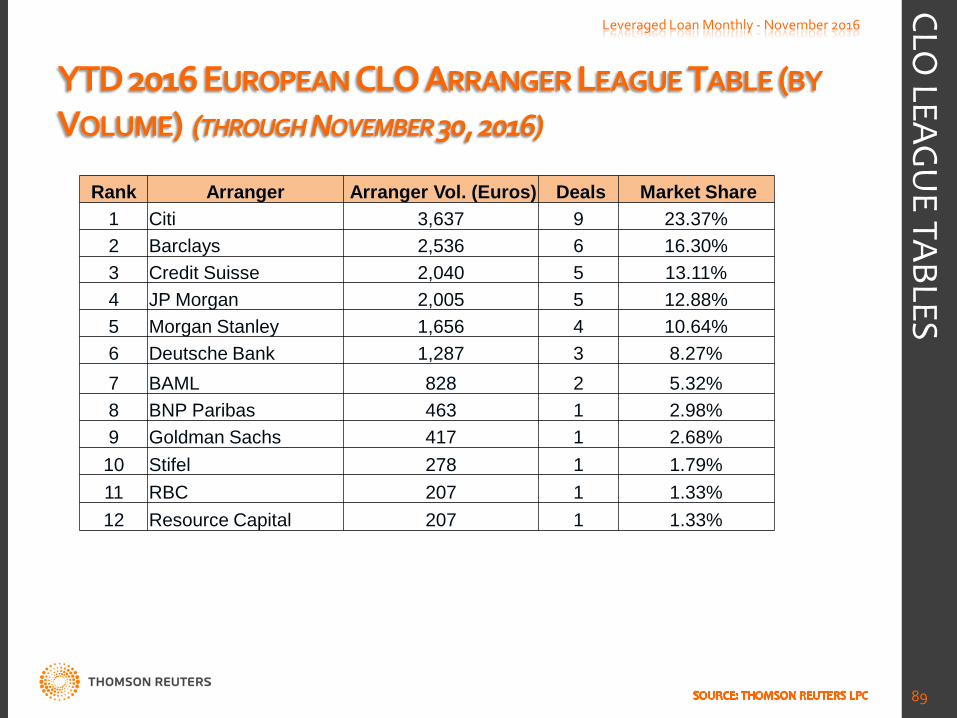
YTD 2016 EUROPEAN CLO ARRANGER LEAGUE TABLE (BY VOLUME) (THROUGH NOVEMBER 30, 2016)
Leveraged Loan Monthly - November 2016
89
CLO LEAG
UE TABLES
Rank Arranger Arranger Vol. (Euros) Deals Market Share 1 Citi 3,637 9 23.37% 2 Barclays 2,536 6 16.30% 3 Credit Suisse 2,040 5 13.11% 4 JP Morgan 2,005 5 12.88% 5 Morgan Stanley 1,656 4 10.64% 6 Deutsche Bank 1,287 3 8.27% 7 BAML 828 2 5.32% 8 BNP Paribas 463 1 2.98% 9 Goldman Sachs 417 1 2.68% 10 Stifel 278 1 1.79% 11 RBC 207 1 1.33% 12 Resource Capital 207 1 1.33%
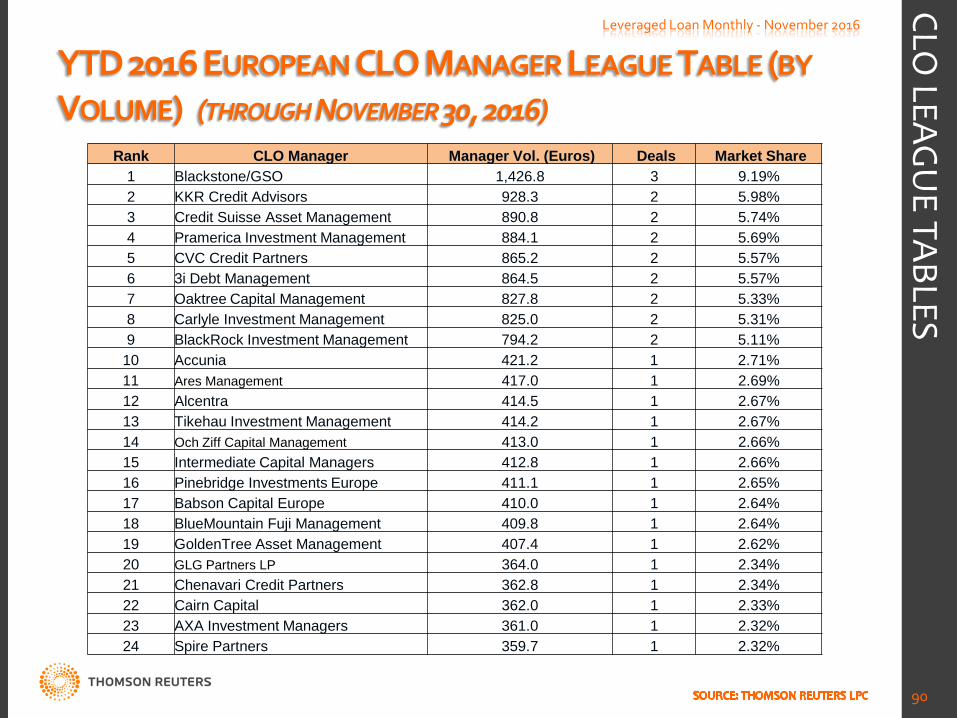
YTD 2016 EUROPEAN CLO MANAGER LEAGUE TABLE (BY VOLUME) (THROUGH NOVEMBER 30, 2016)
Leveraged Loan Monthly - November 2016
90
CLO LEAG
UE TABLES
Rank CLO Manager Manager Vol. (Euros) Deals Market Share 1 Blackstone/GSO 1,426.8 3 9.19% 2 KKR Credit Advisors 928.3 2 5.98% 3 Credit Suisse Asset Management 890.8 2 5.74% 4 Pramerica Investment Management 884.1 2 5.69% 5 CVC Credit Partners 865.2 2 5.57% 6 3i Debt Management 864.5 2 5.57% 7 Oaktree Capital Management 827.8 2 5.33% 8 Carlyle Investment Management 825.0 2 5.31% 9 BlackRock Investment Management 794.2 2 5.11%
10 Accunia 421.2 1 2.71% 11 Ares Management 417.0 1 2.69% 12 Alcentra 414.5 1 2.67% 13 Tikehau Investment Management 414.2 1 2.67% 14 Och Ziff Capital Management 413.0 1 2.66% 15 Intermediate Capital Managers 412.8 1 2.66% 16 Pinebridge Investments Europe 411.1 1 2.65% 17 Babson Capital Europe 410.0 1 2.64% 18 BlueMountain Fuji Management 409.8 1 2.64% 19 GoldenTree Asset Management 407.4 1 2.62% 20 GLG Partners LP 364.0 1 2.34% 21 Chenavari Credit Partners 362.8 1 2.34% 22 Cairn Capital 362.0 1 2.33% 23 AXA Investment Managers 361.0 1 2.32% 24 Spire Partners 359.7 1 2.32%
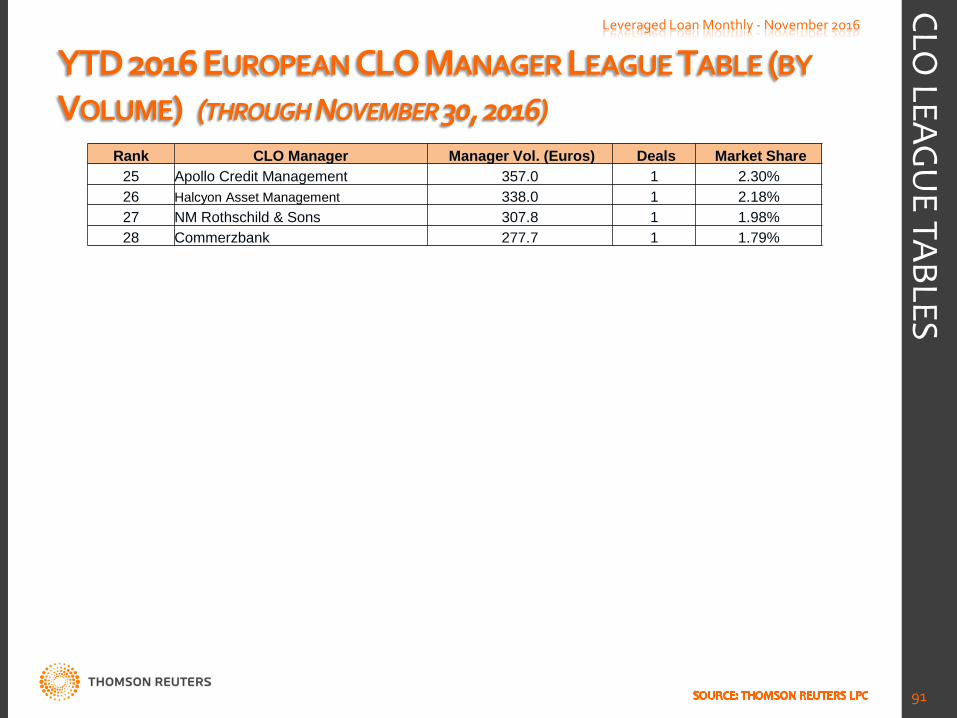
YTD 2016 EUROPEAN CLO MANAGER LEAGUE TABLE (BY VOLUME) (THROUGH NOVEMBER 30, 2016)
Leveraged Loan Monthly - November 2016
91
CLO LEAG
UE TABLES
Rank CLO Manager Manager Vol. (Euros) Deals Market Share 25 Apollo Credit Management 357.0 1 2.30% 26 Halcyon Asset Management 338.0 1 2.18% 27 NM Rothschild & Sons 307.8 1 1.98% 28 Commerzbank 277.7 1 1.79%

LOAN MUTUAL FUND FLOWS & RETURNS
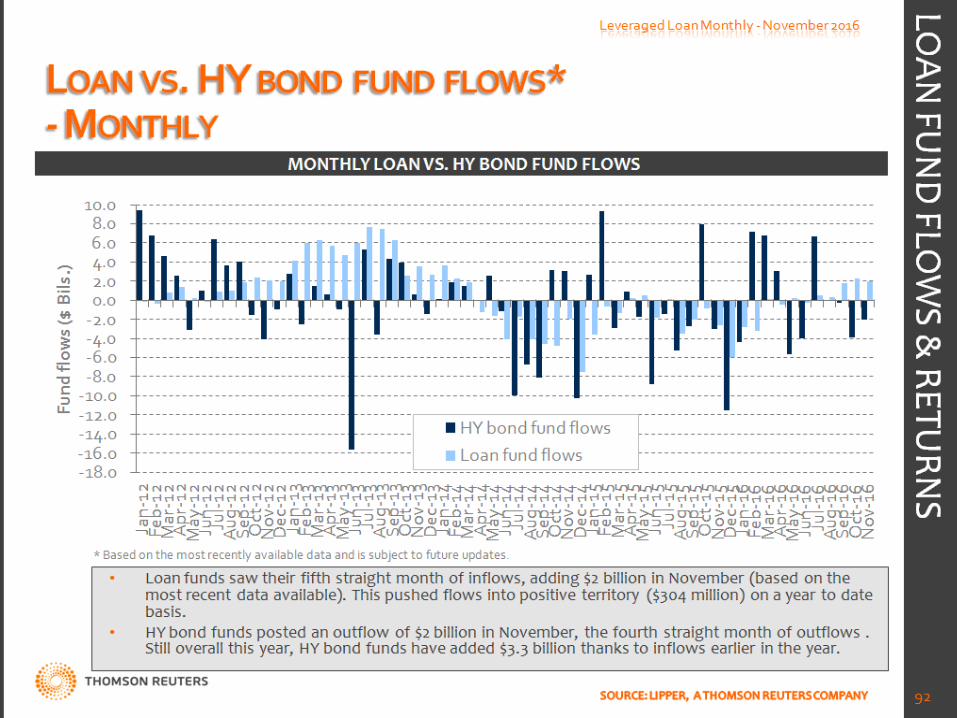
LOAN VS. HY BOND FUND FLOWS* - MONTHLY
Leveraged Loan Monthly - November 2016
93
MONTHLY LOAN VS. HY BOND FUND FLOWS
• Loan funds saw their fifth straight month of inflows, adding $2 billion in November (based on the most recent data available). This pushed flows into positive territory ($304 million) on a year to date basis.
• HY bond funds posted an outflow of $2 billion in November, the fourth straight month of outflows . Still overall this year, HY bond funds have added $3.3 billion thanks to inflows earlier in the year.
LOAN
FUN
D FLO
WS &
RETURN
S
* Based on the most recently available data and is subject to future updates.
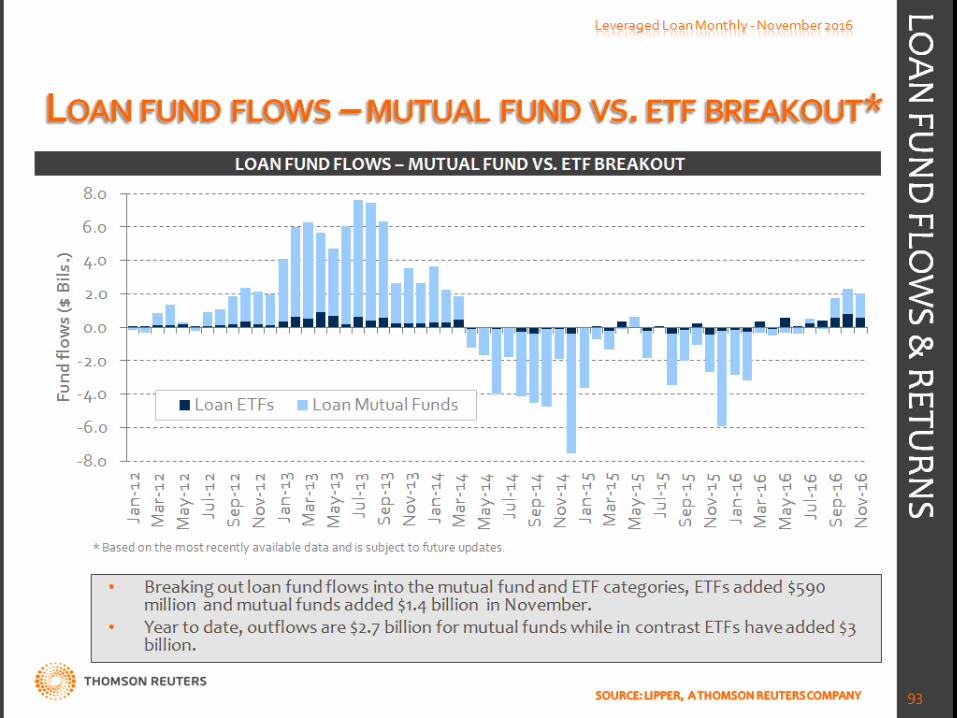
LOAN FUND FLOWS – MUTUAL FUND VS. ETF BREAKOUT*
Leveraged Loan Monthly - November 2016
94
LOAN FUND FLOWS – MUTUAL FUND VS. ETF BREAKOUT
• Breaking out loan fund flows into the mutual fund and ETF categories, ETFs added $590 million and mutual funds added $1.4 billion in November.
• Year to date, outflows are $2.7 billion for mutual funds while in contrast ETFs have added $3 billion.
LOAN
FUN
D FLO
WS &
RETURN
S
* Based on the most recently available data and is subject to future updates.

LOAN FUNDS VS. LOAN INDEX – MONTHLY RETURNS
-4.5 -4.0 -3.5 -3.0 -2.5 -2.0 -1.5 -1.0 -0.5 0.0 0.5 1.0 1.5 2.0 2.5 3.0 3.5
Jan-
11
Mar
-11
May
-11
Jul-1
1 Se
p-11
N
ov-1
1 Ja
n-12
M
ar-1
2 M
ay-1
2 Ju
l-12
Sep-
12
Nov
-12
Jan-
13
Mar
-13
May
-13
Jul-1
3 Se
p-13
N
ov-1
3 Ja
n-14
M
ar-1
4 M
ay-1
4 Ju
l-14
Sep-
14
Nov
-14
Jan-
15
Mar
-15
May
-15
Jul-1
5 Se
p-15
N
ov-1
5 Ja
n-16
M
ar-1
6 M
ay-1
6 Ju
l-16
Sep-
16
Nov
-16
Ret
urns
(%)
Open-end Loan Funds*
S&P/LSTA Leveraged Loan Index
Leveraged Loan Monthly - November 2016
95
MONTHLY FUND VS. INDEX RETURNS
Loan returns slipped in November, with 0pen-end loan fund returns averaging 0.21%, while the S&P/LSTA index gained 0.26%.
Year to date, open-end loan funds have gained 7.7%, while the index is up 8.9%.
LOAN
FUN
D FLO
WS &
RETURN
S
*Based on a straight average of all open-end loan fund returns.
96
THOMSON REUTERS LPC COPYRIGHT NOTICE
© Thomson Reuters LPC. The attached content, including, but not limited to text, data, reports and other opinions, images, photos, graphics, graphs and charts (the “Content”), may be used with proper citation to Thomson Reuters LPC. The Content is the property of Thomson Reuters LPC and is protected by copyright and other intellectual property laws. Contact Thomson Reuters LPC at (1) 646-223-6890 (Americas) or (44) 207-542-8405 (EMEA) or (852) 2294-8853 (APAC) for additional information.
Leveraged Loan Monthly - November 2016