Leveraged Buyouts and Credit Spreadsfeldhutter.com/LBOrisk.pdfLeveraged Buyouts and Credit...
52
Leveraged Buyouts and Credit Spreads * Yael Eisenthal † Peter Feldhutter ‡ Vikrant Vig § February 20, 2017 Abstract This paper studies the impact of LBO restructuring risk on corporate credit spreads. We document a negative ex-post reaction in bond prices, strongest for intermediate bond maturities. We show that LBO risk is priced ex-ante by showing that a) firms more likely to undergo an LBO have higher spreads, b) intra-industry credit spreads increase upon an LBO announcement and c) yields on bonds with event risk covenants are, on average, 28bps lower than those on same-firm bonds without such covenants. We incorporate LBO risk in structural models and estimate the impact on 10-year spreads to be as high as 50bps in high-LBO years. Keywords: Credit Spreads, LBO risk, Structural Models, Leveraged Buyouts; JEL: G12, G34 * We are grateful for comments from David Lando, Dragon Yongjun Tang, Lasse Heje Pedersen and seminar participants at the 4nations cup 2016 in Copenhagen, The CityU of Hong Kong International Finance Conference 2016 and Lancaster University. † Arison School of Business, IDC Herzliya, email: [email protected] ‡ London Business School, email: [email protected] § London Business School, CEPR; email: [email protected]
Transcript of Leveraged Buyouts and Credit Spreadsfeldhutter.com/LBOrisk.pdfLeveraged Buyouts and Credit...
Leveraged Buyouts and Credit Spreads∗
Yael Eisenthal †
Peter Feldhutter ‡
Vikrant Vig§
February 20, 2017
Abstract
This paper studies the impact of LBO restructuring risk on corporate credit spreads. We document
a negative ex-post reaction in bond prices, strongest for intermediate bond maturities. We show that
LBO risk is priced ex-ante by showing that a) firms more likely to undergo an LBO have higher spreads,
b) intra-industry credit spreads increase upon an LBO announcement and c) yields on bonds with event
risk covenants are, on average, 28bps lower than those on same-firm bonds without such covenants. We
incorporate LBO risk in structural models and estimate the impact on 10-year spreads to be as high as
50bps in high-LBO years.
Keywords: Credit Spreads, LBO risk, Structural Models, Leveraged Buyouts;
JEL: G12, G34
∗We are grateful for comments from David Lando, Dragon Yongjun Tang, Lasse Heje Pedersen and seminar participantsat the 4nations cup 2016 in Copenhagen, The CityU of Hong Kong International Finance Conference 2016 and LancasterUniversity.
†Arison School of Business, IDC Herzliya, email: [email protected]‡London Business School, email: [email protected]§London Business School, CEPR; email: [email protected]
1 Introduction
The last decade has seen unprecedented waves of leverage buyout (LBO) activity, identified by rating
agencies as “a primary force behind the global rise in credit risk and the decline in credit quality”.1
In 2013, The Federal Reserve provided new debt guidelines in response to the concern that “while
leveraged lending declined during the crisis, volumes have since increased and prudent underwriting
practices have deteriorated”.2 In late 2015 Standard & Poors issued a warning regarding excessive
leverage in the buyout market, while the Financial Times reported that “credit risks are rising to the
fore as private equity groups seek to put a near-record $540bn cash pile to work, pushing leverage
back to levels not seen since the boom of 2007”.3 Recent history, thus, clearly shows that although
buyouts ebb and flow with the business cycle, LBO activity is a mounting concern for debt investors
and regulators.
A leveraged buyout is an acquisition of a company using a significant amount of borrowed funds. It
involves substitution of equity for debt and, typically, elimination of publicly-held stock. The borrowed
funds are issued against the assets of the target firm and are repaid with cash flows generated by the
company or with revenue earned by selling off the newly acquired company’s assets. The post-LBO
firm frequently has high leverage, and as a result, LBOs typically cause a dramatic change in the risk
profile of the target firm.
The relationship between LBO risk and credit spreads is theoretically ambiguous. On one hand, as
we show, credit spreads increase around LBO announcements – due to the increase in financial leverage
– and bond investors should take this risk into account by requiring a higher credit spread ex-ante. We
call this effect the “leverage effect”. On the other hand, the threat of an LBO may reduce agency costs
by disciplining managers (Jensen and Meckling (1976), Jensen (1986) and Innes (1990)), an effect we
call the “disciplining effect”. The disciplining effect of LBOs can naturally be viewed as reducing credit
spreads (Qiu and Yu (2009) and Francis, Hasan, John, and Waisman (2010)) but may also lead to an
increase in credit spreads if managers pursue more profitable but riskier projects, beneficial for equity
1See “The leveraging of America: recent leveraged buyouts drive credit risk higher as the market churns”, S&P Rat-ingsDirect, August 6, 2007, “Moodys warns on LBO debt defaults”, Financial Times, May 29, 2012 and “LBOs 31% ofdefaults since financial crisis”, Fitch Wire, May 28, 2014.
2https://www.federalreserve.gov/newsevents/press/bcreg/20130321a.htm3’Growth in leveraged deals prompts credit risk warning’, Financial Times, November 4, 2015.
2
holders but detrimental to bondholders (Roades and Rutz (1982)).
In addition to the theoretical ambiguity of the effects of LBOs on credit risk, empirically identify-
ing a causal link between LBO risk and credit spreads is challenging. The identification challenge is
exemplified in a notable paper on this topic by Crabbe (1991). To investigate this link Crabbe (1991)
regresses a small set of corporate bond yield spreads (72 in number), at the end of 1989, on a dummy
variable indicating whether the bond includes an event risk covenant protecting bondholders against
an LBO (“Poison Put”). Crabbe interprets the negative dummy (-24bps) as the result of the leverage
effect. In light of the limited data available 25 years ago, the documented correlation was useful in
understanding LBO risk, but one concern is that firms issuing bonds with event risk covenants are dif-
ferent from those issuing bonds without such covenants, thus leading to an omitted variables bias.4 In
particular firms that face higher LBO risk are potentially also lower credit quality firms. While Crabbe
attempts to control for credit quality using several proxies, one may question the quality of the control
variables and their correct functional form. When we apply Crabbe’s cross-sectional regression to our
much larger sample of 41,181 bond yield observations over 13 years, we obtain monthly estimates that
are volatile, range from -46 to 92 basis points and are positive in 112 out of 159 months. It is difficult
to rationalize positive estimates arising from a pure leverage effect.
Employing a different approach, Qiu and Yu (2009) and Francis, Hasan, John, and Waisman (2010)
measure spread changes around laws enacted in 30 U.S. states between 1985-1991 raising the cost of
takeovers and arguably decreasing the likelihood of an LBO.5 Qiu and Yu (2009) find that credit spreads
increase in the year the law is enacted while Francis, Hasan, John, and Waisman (2010) find that credit
spreads decrease in the month around the first press announcement that is related to the expected
passage of these laws. Besides the general challenge in defining the event date in studies of law changes,
there is evidence suggesting that the laws did not have an impact on hostile takeover activity (Comment
and Schwert (1995) and Cain, McKeon, and Solomon (2016)).
In light of these ambiguous and conflicting empirical results, this paper revisits the link between
LBO risk and credit spreads using an extensive dataset of LBOs, CDS spreads and corporate bond
4Indeed, Billett, King, and Mauer (2007) find that covenant protection is increasing in growth opportunities, debtmaturity, and leverage.
5Admittedly, the potential effect of these laws were not limited to LBOs but also to other takeover events and thereforetheir results, although informative, have to be interpreted with caution in the context of LBO risk.
3
transactions from recent decades and a range of new estimation approaches.6 We provide comprehensive
and robust evidence on an economically important positive ex-ante effect of leveraged buyouts on credit
spreads. In addition, we examine the impact of LBO risk on credit spreads over time, showing that
LBO risk has had a larger impact in recent years, as well as in the maturity structure of corporate
spreads, finding its effect to be most important at 10-15 years maturities.
We begin by studying the reaction of target firm credit spreads to LBO announcements in the US
during the years 2002-2015. We study the reaction in bond markets, differentiating between bonds
protected by event risk covenants and those that are not, to control for takeover protection. We focus
on the latter since they are most common and document an average negative reaction of 4.9% in prices
of unprotected bonds, confirming results in earlier literature documenting significant bondholder losses.7
We add to the previous literature by documenting a hump-shaped pattern in bond price reaction: the
average price reaction of short-term bonds is less than -1.3%, while for 10-15 year bonds it is -15.9%
and for bonds with a maturity of more than 15 years the reaction is between -12.8% and -9.4%.
We then proceed to the main contribution of this paper, namely to quantify the ex-ante relation
between LBO risk and credit spreads. First, we separate the effect of LBO probability from the direct
effect of firm characteristics on credit spreads, by using a measure of industry-level LBO probability,
defined as the number of recent LBOs in an industry divided by the number of firms in the same industry.
We find that firms that are more likely to undergo an LBO in the future have significantly higher spreads.
Furthermore, we find the effect to be more pronounced in firms with low equity volatility, low leverage,
and high return-on-assets - all characteristics of LBO targets. While we control for credit risk, we cannot
rule out an omitted variable bias in our estimates. We therefore also investigate intra-industry credit
spread reactions around LBO announcements, based on the finding in Harford, Stanfield, and Zhang
(2015) that an LBO announcement significantly increases the likelihood that an industry peer becomes
an LBO target in the following year. We do find a significant intra-industry spread increase of 8.6%
around the announcement, providing further evidence that LBO risk has a sizeable influence on credit
spreads. A corresponding average increase in intra-industry equity value around these announcements
6In their regressions, Crabbe (1991) uses 72 observations from December 1989, Qiu and Yu (2009) use 4,951 observationsfrom 1976-1995 and Francis, Hasan, John, and Waisman (2010) use 1,857 observations from 1985-1991. We use 15,685CDS observations from 2001-2014 and 28,458 bond observations from 2007-2015 in our regressions.
7See for example Baran and King (2010), Billett, Jiang, and Lie (2010), Warga and Welch (1993), Crabbe (1991),Asquith and Wizmann (1990), and Marais, Schipper, and Smith (1989)
4
rules out that the widening in intra-industry credit spreads is driven by increased competition or a
downward revision of firm value.
To sharpen our analysis further, we restrict the sample to firms that have at least two bonds
outstanding, one with and one without an event risk covenant, and include firm fixed effects in monthly
cross-sectional regressions of the yield spread on a dummy indicating the inclusion of an event risk
covenant. Thus, we estimate the effect of an event risk covenant by comparing, at the same time and
for the same firm, the difference in yields of a bond with and a bond without an event risk covenant. This
provides a much cleaner identification of the LBO effect, in particular the leverage effect, since the within
firm comparison (firm fixed effects) allows us to control for firms’ credit quality non-parametrically. It
should be noted that this identification strategy also controls for other time-varying omitted variables,
such as expectation of changes of firm leverage unrelated to LBOs. Since such leverage changes would
affect spreads on both types of bonds, our identification strategy differences it out. Using this approach,
the average impact of including an event risk covenant during the period 2007-2015 is -28bps and the
estimated impact is negative in all months in the sample as expected based on the leverage effect.
We investigate the significance of the disciplining effect by estimating the yield change of protected
bonds around intra-industry LBO announcements. A reaction in the yield can largely be attributed to
the disciplining effect of LBOs, since protected bonds are less likely to be affected by the direct leverage
channel. Interestingly, we find almost no reaction in the yields of protected bonds, suggesting that the
leverage channel identified above (of 28 bps) is the dominant channel through which LBO risk affects
credit spreads.8
Having identified the leverage effect as the dominant one in the relation between LBO risk and credit
spreads, we incorporate LBO risk into structural models and derive closed-form solutions for credit
spreads in two cases, the Merton (1974) model and Collin-Dufresne and Goldstein (2001)’s stationary
leverage model. In both models the firm has issued a zero-coupon bond and defaults if the firm value
is below the face value of debt at maturity. We model the leverage effect by assuming that there is a
time-varying probability – governed by an underlying intensity – of the firm undergoing an LBO, at
which point there is a jump in the amount of debt issued by the target.
It is important for us to be able to distinctly interpret the implications of the model as risk of
8In contrast, yields of unprotected bonds increase by approximately 20bps in the month around the announcement.
5

an impending LBO rather than other corporate events leading to a change in leverage.9 To be able
to do so, we calibrate the model to two measurements in the data that are unique to LBO risk: the
frequency of LBOs and the ex-post impact of LBOs on bond prices. Specifically, we use the overall
number of LBOs divided by the total number of firms as an annual proxy for the unobserved LBO
intensity, allowing us to estimate the parameters of the LBO intensity. Furthermore, to estimate the
jump size in the event of an LBO, we match model-implied bond price reactions to the historical bond
price reactions. Interestingly, both models match the hump-shaped reaction of bond prices as a function
of bond maturity found in the historical data.
The average contribution of LBO risk to 10-year credit spreads is 28-34bps, consistent with the
event-risk covenants regression estimates. The impact on the 10-year credit spread of a typical BBB-
rated firm ranges from around 15bps in the early eighties to around 50bps in the high LBO periods
2005-2007 and 2012-2014. To examine the impact of LBO risk on the term structure of credit spreads
we study a typical firm in an average year and find the contribution to be only 1-4bps at the one-year
maturity, but increasing to 27-36bps at the 15-year maturity. We, therefore, conclude that while LBO
risk has little impact at very short maturities, it affects the slope of the term structure of credit spreads
quite significantly.
Incorporation of LBO risk can further our understanding of the cross-sectional variation in credit
spreads. Standard structural credit risk models suggest that only firm specific variables such as asset
volatility and leverage determine spreads. In our model, LBO risk is an additional such variable. This
additional variable might, in part, explain the finding in Collin-Dufresne, Goldstein, and Martin (2001)
that a common residual factor unrelated to firm-specific variables is an important determinant of credit
spreads.
The rest of this paper proceeds as follows. Section 2 details the CDS, bond and LBO data. Section
3 describes the event study of bond prices and CDS spreads around LBO announcements. Section 4
presents the empirical study of the ex-ante effect of LBO risk on credit spreads. Section 5 presents a
structural model with LBO risk and Section 6 concludes.
9Examples of other corporate events leading to a change in leverage are mergers, share repurchases or steep losses dueto a lawsuit.
6
2 Data
2.1 Credit Default Swaps
Credit default swaps are the most common type of credit derivative and have been actively traded in
financial markets since the early 2000s. According to a report by the Bank for International Settlements,
the total notional amount outstanding of CDS contracts was $14.6 trillion at the end of June 2015.
CDS spreads abstract from certain bond characteristics, such as coupon rates, decaying maturity, and
covenants. Furthermore, liquidity is consistently concentrated in the 5-year CDS contract while liquidity
in corporate bonds is concentrated in on-the-run bonds, changing across bonds over time (Ronen and
Zhou (2013)). We, thus, opt to use credit default swap data to study the effect of LBO announcements
on credit spreads of target firms.
The CDS dataset includes daily quotes for a broad cross-section of firms over the years 2001-2015.
CDS data are provided by Markit, a comprehensive data source that assembles a network of over 30
industry-leading partners who contribute information across several thousand credits on a daily basis.
Based on the contributed quotes, Markit creates a daily composite for each CDS contract and rigorous
cleaning of the data helps to ensure that the composite price closely reflects transaction prices. We use
all CDS quotes written on U.S. corporate entities and denominated in U.S. dollars. For consistency, we
retain only CDS on senior unsecured debt, which constitute 92% of all contracts. We focus on contracts
with Modified Restructuring (MR) or No Restructuring (XR) clauses as these are the most common
in the US. The MR contract is used, with the exception of firms for which the XR contract is more
frequently traded. The data includes contracts of 0.5, 1, 2, 3, 5, 7, 10, 15, 20, and 30-year maturities;
we focus on the 5-year contract, which is the most liquid.
2.2 Bond transaction prices
Corporate bond transactions data is obtained from the Financial Industry Regulatory Authority’s
(FINRA) Trade Reporting and Compliance Engine (TRACE). Since July 1, 2002, all dealers have
been required to report their secondary over-the-counter corporate bond transactions through TRACE.
The data set starts on July 1, 2002 and ends on September 30, 2015. We apply standard filters (Dick-
Nielsen (2009) and Dick-Nielsen (2014)) to clean the dataset for errors. The information on TRACE
7
includes time of execution, price, yield, and volume. We merge this data with information on the issue
and its covenants, as described in the following section, and exclude all convertible bonds, as these
might be expected to react differently from non-convertibles.
2.3 Bond issuance and covenants
We retrieve bond covenant information from The Fixed Income Securities Database (FISD). The FISD
contains detailed issue-level information on over 140,000 corporate, US Agency, US Treasury and supra-
national debt securities, collected from bond prospectuses and issuers’ SEC filings including 10-K, 8-K,
registration forms, etc. For each issue, the FISD provides a variable indicating whether detailed covenant
information is collected for that issue.
One covenant is directly related to LBOs, namely a put, which gives the bondholder the option to
sell the issue back to the issuer in the event of a change of control in the firm, typically at 101% of par
value. The covenant is denoted “Change Control Put Provisions” in FISD and we refer to this covenant
as an “event risk” covenant.
2.4 LBO announcements
Data on LBO announcements are retrieved from Thomson One Banker. A deal is classified as a Lever-
aged Buyout if the investor group includes management or the transaction is identified as such in the
financial press and 100% of the company is acquired. We filter by announced deals of type LBO, where
the target is a US firm.10 The total number of announcements between 1980 and 2015 is 12,210.
Merging the data on LBO transaction announcements with the CDS spreads leaves 60 events. We
exclude 17 cases where the 5-year CDS spread data is missing or stale around the event.11 The median
rating is BBB- immediately before the LBO and BB- one year after the corporate event. Since the
focus is on firms with public debt and actively traded CDS contracts, the 43 firms left in our sample
are typically large, public firms.
10Based on the CapitalIQ database and World Economic Forum reports, the coverage of deals in Thomson One Bankerseems to be incomplete, but there is no reason to suspect any bias in coverage. Furthermore, since LBO firms in oursample have quoted CDS premiums, the focus is, by definition, on the larger, public, highly traded firms, for which thecoverage is likely to be high. We checked LBOs on Bloomberg and did not find additional LBO events where the targetfirm had quoted CDS premiums.
11We define CDS prices as stale in the event window if there are more than five days where the CDS price does notchange from one day to the next.
8
3 Event study
In this section we study the effect of LBO announcements on the credit spreads of target firms. The
event study methodology is detailed in Appendix B.
3.1 Credit Default Swaps
Panel A in Figure 1 shows that the 5-year CDS premium increases, on average, in the period leading up
to the LBO announcement and, in particular, on the day of the announcement, remaining stable from
that point onwards. For investment grade firms the average CDS spread increases from approximately
120 basis points 22 days before the event to about 220 basis points after the event. It is not surprising
that there is some reaction before the announcement, as the deal may have been rumored. The change
in CDS spread, measured in basis points, is of similar magnitude for investment grade and speculative
grade firms.
Panel B in Figure 1 shows the cumulative average abnormal returns of the 5-year CDS contract
around the LBO announcements, where we define the return of a CDS contract as the logarithm of the
percentage change in the CDS premium. The cumulative average abnormal return is about 60% for
investment grade firms and 30% for speculative grade (the corresponding arithmetic average returns are
approximately 80% and 35%, respectively). We test the statistical significance of the abnormal returns
in Table 1. Panel A shows a significant abnormal return of 14.89% in the 10 days leading up to the
announcement and a large and significant abnormal return of 24.65% on the two days surrounding the
event. There is also evidence of a smaller 3.90% abnormal return in days -22 to -12, significant at a 10%
confidence level. There is no statistical evidence of any reaction after the announcement. As expected,
the reaction is stronger for investment grade firms (Panel B) than for speculative grade firms (Panel C).
Panels D-F in Table 1 display abnormal CDS returns for different maturities. In the time period
from 22 days before the event to five days after the event, the 3-year, 7-year, and 10-year CDS premiums
increase on average by 58.6, 106.4, and 113.5, respectively. While the impact in basis points increases
with maturity, abnormal returns are similar at different maturities, ranging from 36.98% to 43.77%.
Overall, a statistically significant and economically large cumulative average abnormal return of
43.77% shows that LBOs lead to a significant increase in the default risk of the target firm.
9

3.2 Corporate bonds
A bond’s price reaction to an LBO depends on the presence of an event risk covenant. We, therefore,
differentiate between unprotected bonds and bonds with event risk protection. Out of the 232 bonds in
the event study, 44 have event risk protection; we refer to these as the “protected” bonds, and to the
others as “unprotected”.12 For unprotected bonds, Panel C in Figure 1 shows a cumulative negative
abnormal return of approximately 5% in the event window. For bonds protected by event risk covenants,
we observe a small negative abnormal return of less than 1%. Panels C and D in Table 2 show the
negative returns for unprotected bonds to be highly statistically significant, while the small negative
returns for protected bonds are insignificant. Panel A of Table 2 shows that the average abnormal
return for all bonds is around -4% and highly statistically significant. Thus, although, on average, event
risk covenants mitigate losses to bondholders, the majority of bonds are unprotected and bondholders
experience significant losses.
Using a sample of bonds over the period 1991-2006, Billett, Jiang, and Lie (2010) find that protected
bonds experienced an average gain of 2.30% upon an LBO announcement, while unprotected bonds
experienced an average loss of 6.76%. A likely explanation for why we find (small) average losses for
protected bonds is that interest rate levels in our sample period were low and decreasing, thus a larger
fraction of protected bonds were likely to be trading above the event put strike price of $101, and,
therefore, experienced some losses despite the event risk protection.
Table 2 Panel E shows how the abnormal bondholder return depends on bond maturity. For bonds
with a maturity of 2 years or less there is basically no price reaction to an LBO, while for bonds with a
maturity of 2-6 years we see a statistically significant but economically small negative abnormal return
of 1.1-1.3%. For intermediate maturities 6-15 years there is a strong relation between maturity and the
size of negative returns, while for long maturities there is a positive relation between bondholders returns
and bond maturity. That is, the results shows a hump-shaped relation between bondholder returns and
bond maturity.13 We show in Section 5 that the relation arises naturally in structural models where
12Among all bonds in the Mergent FISD, 90.9% have no information about event risk covenants, 5.3% explicitly haveno event risk covenant, and 3.8% explicitly have an event risk covenant. In “unprotected bonds” we include those thathave no information about event risk covenants in the Mergent FISD.
13The hump-shaped relation between bondholder returns and maturity is present in medians as well as in means: themedian (instead of mean as in Panel E) abnormal returns for the maturities in Panel D are 0.14, -1.27, -3.37, -3.97, -12.32,-14.86, -7.48, -9.06.
10
an LBO leads to an increase in leverage, i.e. an increase in financial leverage alone can explain this
hump-shaped relation. Regressing bondholder returns on bond maturity Asquith and Wizmann (1990),
Warga and Welch (1993), and Billett, Jiang, and Lie (2010) find a negative linear relation, but our
results show that this relation is dependent on bond maturity.
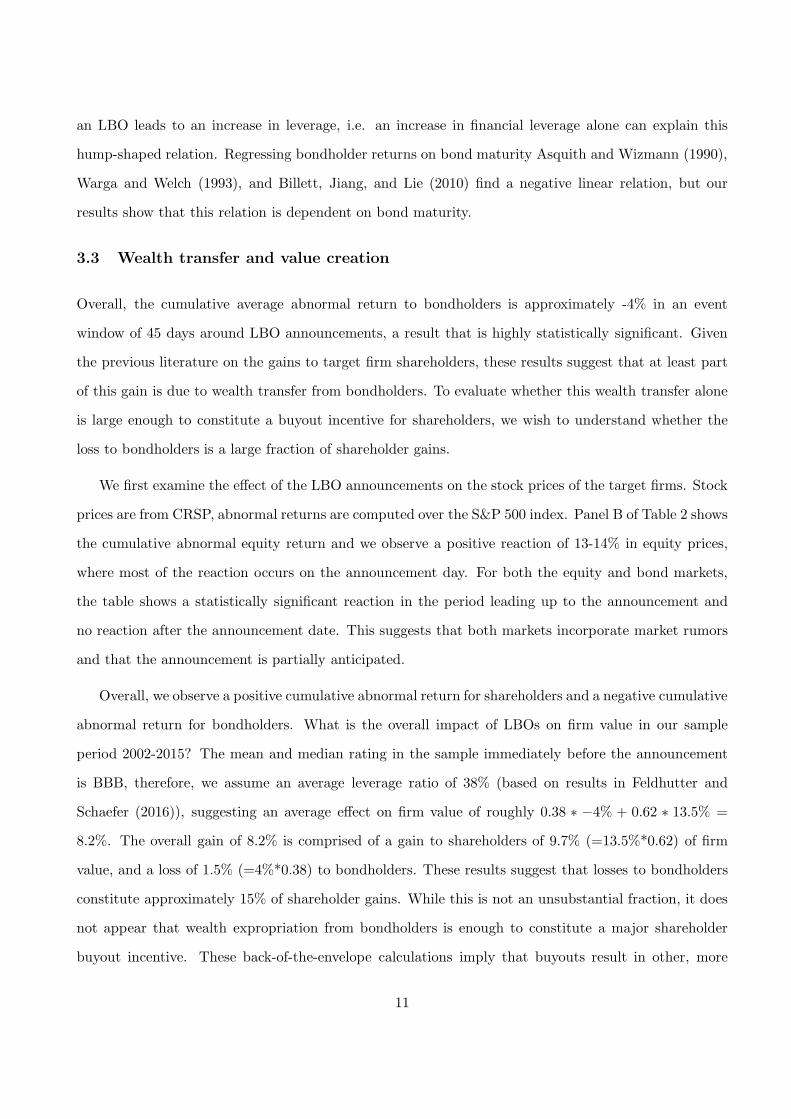
3.3 Wealth transfer and value creation
Overall, the cumulative average abnormal return to bondholders is approximately -4% in an event
window of 45 days around LBO announcements, a result that is highly statistically significant. Given
the previous literature on the gains to target firm shareholders, these results suggest that at least part
of this gain is due to wealth transfer from bondholders. To evaluate whether this wealth transfer alone
is large enough to constitute a buyout incentive for shareholders, we wish to understand whether the
loss to bondholders is a large fraction of shareholder gains.
We first examine the effect of the LBO announcements on the stock prices of the target firms. Stock
prices are from CRSP, abnormal returns are computed over the S&P 500 index. Panel B of Table 2 shows
the cumulative abnormal equity return and we observe a positive reaction of 13-14% in equity prices,
where most of the reaction occurs on the announcement day. For both the equity and bond markets,
the table shows a statistically significant reaction in the period leading up to the announcement and
no reaction after the announcement date. This suggests that both markets incorporate market rumors
and that the announcement is partially anticipated.
Overall, we observe a positive cumulative abnormal return for shareholders and a negative cumulative
abnormal return for bondholders. What is the overall impact of LBOs on firm value in our sample
period 2002-2015? The mean and median rating in the sample immediately before the announcement
is BBB, therefore, we assume an average leverage ratio of 38% (based on results in Feldhutter and
Schaefer (2016)), suggesting an average effect on firm value of roughly 0.38 ∗ −4% + 0.62 ∗ 13.5% =
8.2%. The overall gain of 8.2% is comprised of a gain to shareholders of 9.7% (=13.5%*0.62) of firm
value, and a loss of 1.5% (=4%*0.38) to bondholders. These results suggest that losses to bondholders
constitute approximately 15% of shareholder gains. While this is not an unsubstantial fraction, it does
not appear that wealth expropriation from bondholders is enough to constitute a major shareholder
buyout incentive. These back-of-the-envelope calculations imply that buyouts result in other, more
11
substantial sources of gains, suggesting that LBOs do, indeed, create value.
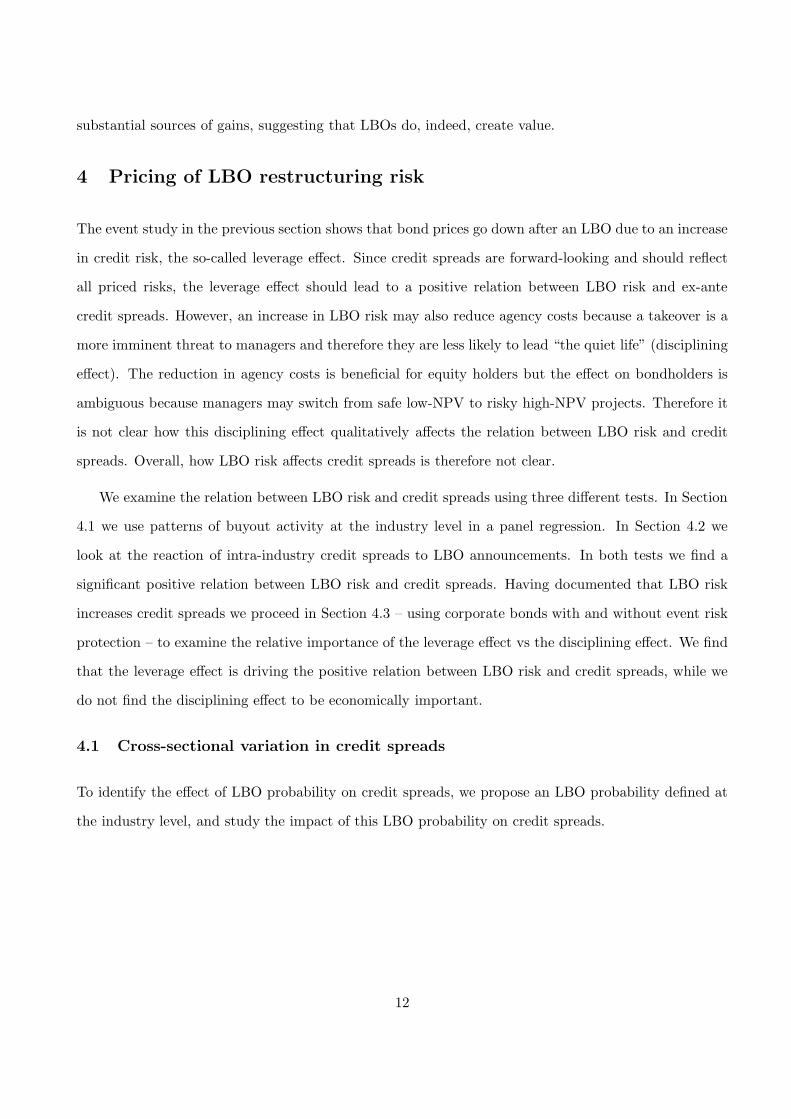
4 Pricing of LBO restructuring risk
The event study in the previous section shows that bond prices go down after an LBO due to an increase
in credit risk, the so-called leverage effect. Since credit spreads are forward-looking and should reflect
all priced risks, the leverage effect should lead to a positive relation between LBO risk and ex-ante
credit spreads. However, an increase in LBO risk may also reduce agency costs because a takeover is a
more imminent threat to managers and therefore they are less likely to lead “the quiet life” (disciplining
effect). The reduction in agency costs is beneficial for equity holders but the effect on bondholders is
ambiguous because managers may switch from safe low-NPV to risky high-NPV projects. Therefore it
is not clear how this disciplining effect qualitatively affects the relation between LBO risk and credit
spreads. Overall, how LBO risk affects credit spreads is therefore not clear.
We examine the relation between LBO risk and credit spreads using three different tests. In Section
4.1 we use patterns of buyout activity at the industry level in a panel regression. In Section 4.2 we
look at the reaction of intra-industry credit spreads to LBO announcements. In both tests we find a
significant positive relation between LBO risk and credit spreads. Having documented that LBO risk
increases credit spreads we proceed in Section 4.3 – using corporate bonds with and without event risk
protection – to examine the relative importance of the leverage effect vs the disciplining effect. We find
that the leverage effect is driving the positive relation between LBO risk and credit spreads, while we
do not find the disciplining effect to be economically important.
4.1 Cross-sectional variation in credit spreads
To identify the effect of LBO probability on credit spreads, we propose an LBO probability defined at
the industry level, and study the impact of this LBO probability on credit spreads.
12
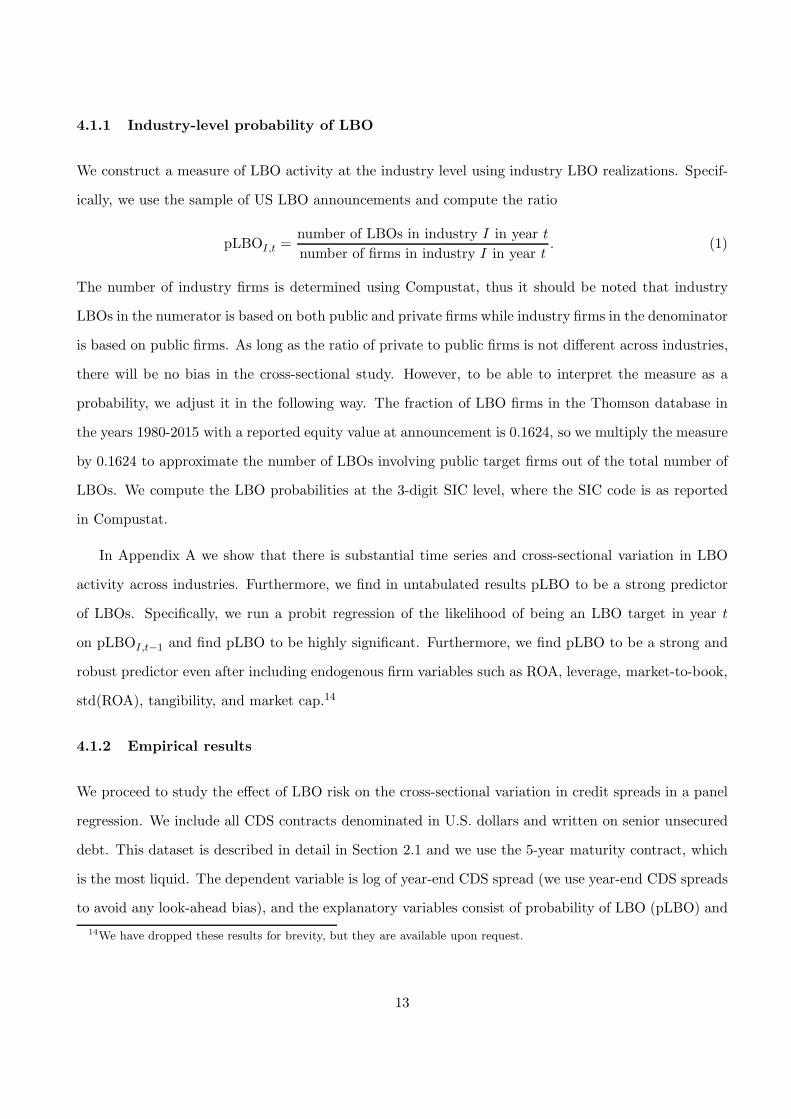
4.1.1 Industry-level probability of LBO
We construct a measure of LBO activity at the industry level using industry LBO realizations. Specif-
ically, we use the sample of US LBO announcements and compute the ratio
pLBOI,t =number of LBOs in industry I in year t
number of firms in industry I in year t. (1)
The number of industry firms is determined using Compustat, thus it should be noted that industry
LBOs in the numerator is based on both public and private firms while industry firms in the denominator
is based on public firms. As long as the ratio of private to public firms is not different across industries,
there will be no bias in the cross-sectional study. However, to be able to interpret the measure as a
probability, we adjust it in the following way. The fraction of LBO firms in the Thomson database in
the years 1980-2015 with a reported equity value at announcement is 0.1624, so we multiply the measure
by 0.1624 to approximate the number of LBOs involving public target firms out of the total number of
LBOs. We compute the LBO probabilities at the 3-digit SIC level, where the SIC code is as reported
in Compustat.
In Appendix A we show that there is substantial time series and cross-sectional variation in LBO
activity across industries. Furthermore, we find in untabulated results pLBO to be a strong predictor
of LBOs. Specifically, we run a probit regression of the likelihood of being an LBO target in year t
on pLBOI,t−1 and find pLBO to be highly significant. Furthermore, we find pLBO to be a strong and
robust predictor even after including endogenous firm variables such as ROA, leverage, market-to-book,
std(ROA), tangibility, and market cap.14
4.1.2 Empirical results
We proceed to study the effect of LBO risk on the cross-sectional variation in credit spreads in a panel
regression. We include all CDS contracts denominated in U.S. dollars and written on senior unsecured
debt. This dataset is described in detail in Section 2.1 and we use the 5-year maturity contract, which
is the most liquid. The dependent variable is log of year-end CDS spread (we use year-end CDS spreads
to avoid any look-ahead bias), and the explanatory variables consist of probability of LBO (pLBO) and
14We have dropped these results for brevity, but they are available upon request.
13
firm-level controls. The firm-level controls are year-end leverage ratio, equity volatility, distance-to-
default, and ROA.15
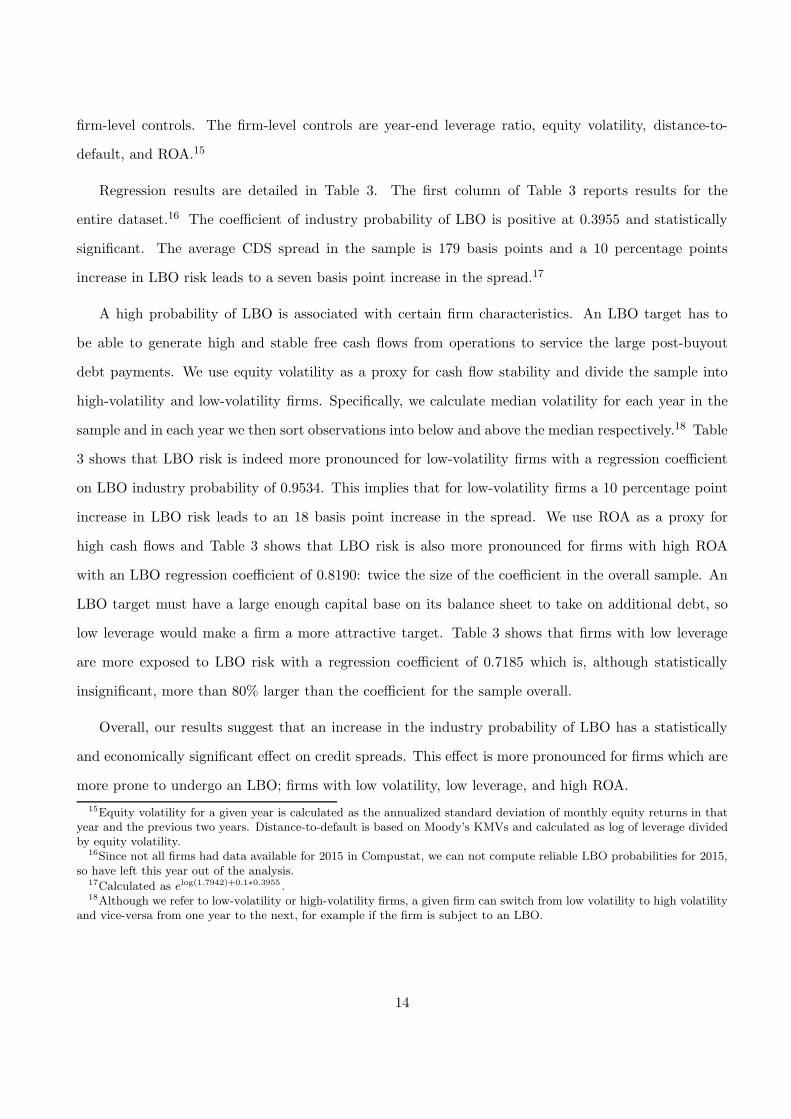
Regression results are detailed in Table 3. The first column of Table 3 reports results for the
entire dataset.16 The coefficient of industry probability of LBO is positive at 0.3955 and statistically
significant. The average CDS spread in the sample is 179 basis points and a 10 percentage points
increase in LBO risk leads to a seven basis point increase in the spread.17
A high probability of LBO is associated with certain firm characteristics. An LBO target has to
be able to generate high and stable free cash flows from operations to service the large post-buyout
debt payments. We use equity volatility as a proxy for cash flow stability and divide the sample into
high-volatility and low-volatility firms. Specifically, we calculate median volatility for each year in the
sample and in each year we then sort observations into below and above the median respectively.18 Table
3 shows that LBO risk is indeed more pronounced for low-volatility firms with a regression coefficient
on LBO industry probability of 0.9534. This implies that for low-volatility firms a 10 percentage point
increase in LBO risk leads to an 18 basis point increase in the spread. We use ROA as a proxy for
high cash flows and Table 3 shows that LBO risk is also more pronounced for firms with high ROA
with an LBO regression coefficient of 0.8190: twice the size of the coefficient in the overall sample. An
LBO target must have a large enough capital base on its balance sheet to take on additional debt, so
low leverage would make a firm a more attractive target. Table 3 shows that firms with low leverage
are more exposed to LBO risk with a regression coefficient of 0.7185 which is, although statistically
insignificant, more than 80% larger than the coefficient for the sample overall.
Overall, our results suggest that an increase in the industry probability of LBO has a statistically
and economically significant effect on credit spreads. This effect is more pronounced for firms which are
more prone to undergo an LBO; firms with low volatility, low leverage, and high ROA.
15Equity volatility for a given year is calculated as the annualized standard deviation of monthly equity returns in thatyear and the previous two years. Distance-to-default is based on Moody’s KMVs and calculated as log of leverage dividedby equity volatility.
16Since not all firms had data available for 2015 in Compustat, we can not compute reliable LBO probabilities for 2015,so have left this year out of the analysis.
17Calculated as elog(1.7942)+0.1∗0.3955 .18Although we refer to low-volatility or high-volatility firms, a given firm can switch from low volatility to high volatility
and vice-versa from one year to the next, for example if the firm is subject to an LBO.
14
4.2 Industry-wide effects of LBO announcements
In the previous section, we document the detrimental effect of LBO risk on the credit spreads of
target firms. Harford, Stanfield, and Zhang (2015) document that an LBO announced in a given year
significantly increases the likelihood that an industry peer becomes an LBO target the following year.
Thus, intra-industry LBO announcements increase the likelihood that other within-industry firms will
be targeted in LBOs. To further examine the relation between LBO risk and credit spreads, we therefore
proceed to study the effect of these announcements on the credit spreads of other firms in the same
industry.
We collect firms’ 3-digit SIC code from Compustat by matching with Markit’s ticker. For each
LBO event, the sample consists of spreads of non-targets in a window around LBO announcements in
the industry. We have a final sample of 267 event days in 133 firms in 15 industries. Event window,
abnormal returns and test statistics are as detailed in Appendix B.
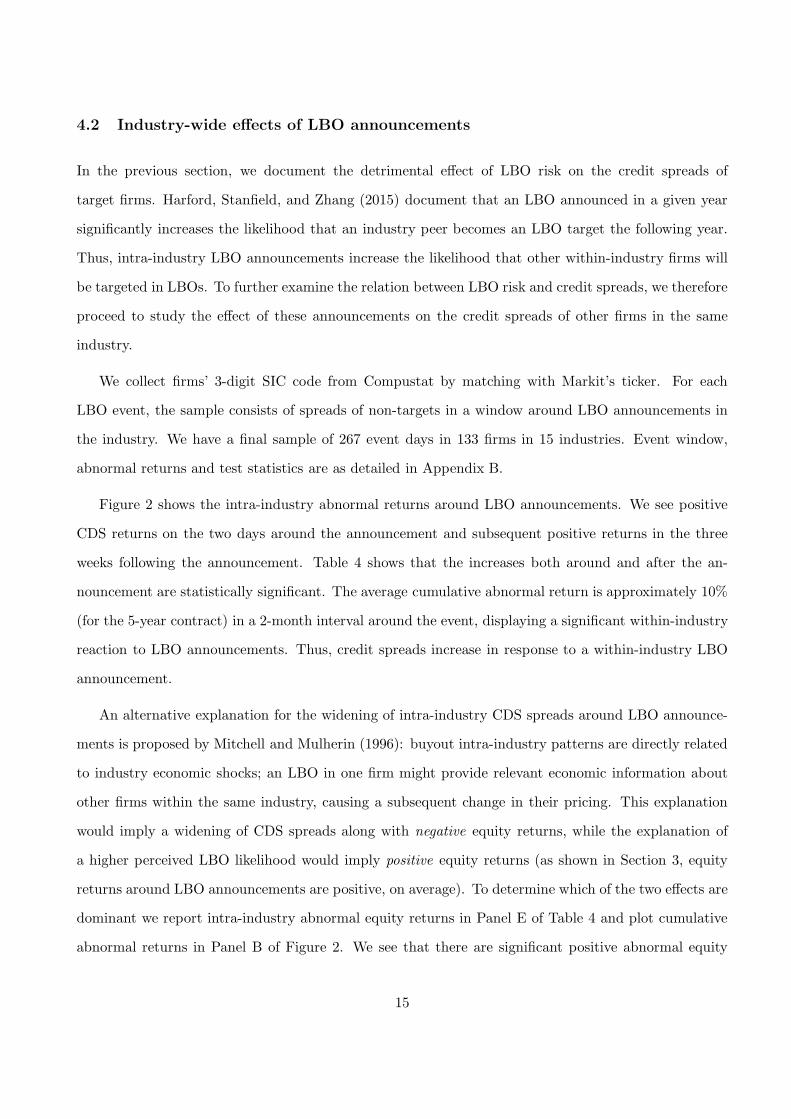
Figure 2 shows the intra-industry abnormal returns around LBO announcements. We see positive
CDS returns on the two days around the announcement and subsequent positive returns in the three
weeks following the announcement. Table 4 shows that the increases both around and after the an-
nouncement are statistically significant. The average cumulative abnormal return is approximately 10%
(for the 5-year contract) in a 2-month interval around the event, displaying a significant within-industry
reaction to LBO announcements. Thus, credit spreads increase in response to a within-industry LBO
announcement.
An alternative explanation for the widening of intra-industry CDS spreads around LBO announce-
ments is proposed by Mitchell and Mulherin (1996): buyout intra-industry patterns are directly related
to industry economic shocks; an LBO in one firm might provide relevant economic information about
other firms within the same industry, causing a subsequent change in their pricing. This explanation
would imply a widening of CDS spreads along with negative equity returns, while the explanation of
a higher perceived LBO likelihood would imply positive equity returns (as shown in Section 3, equity
returns around LBO announcements are positive, on average). To determine which of the two effects are
dominant we report intra-industry abnormal equity returns in Panel E of Table 4 and plot cumulative
abnormal returns in Panel B of Figure 2. We see that there are significant positive abnormal equity
15
returns around industry announcements, consistent with increased LBO risk being the main driver of
the widening of CDS spreads.
Anecdotal evidence from the press further supports the hypothesis that the increase in CDS spreads
is mainly driven by increased probability of further LBOs. Bloomberg Business (“Dell Lifts Default
Risk on Next Buyout Targets: Credit Markets”) wrote in January, 2013 that “Derivatives traders are
beginning to speculate that the potential leveraged buyout of computer maker Dell Inc. marks the
return of credit-busting takeovers as the cost of financing the deals gets ever cheaper. The cost to
protect against losses on Quest Diagnostics Inc. bonds reached a 15-month high yesterday and Nabors
Industries Ltd. credit-default swaps jumped to the most since July amid speculation they may become
targets for leveraged buyouts.” The Wall Street Journal also wrote on February 3, 2013 (“New Worry
for Bondholders: LBOs”) that “bonds from other likely LBO targets [...] have fallen in value. Leader
Capital Corp. portfolio manager Scott Carmack noticed unusual selling in bonds of telecommunications
provider CenturyLink Inc. and Nabors when talk of the Dell deal leaked.”
4.3 The effect of event risk covenants on bond yield spreads
So far we have documented that an increase in LBO risk leads to an increase in credit spreads. There are
two channels through which changes in LBO risk can lead to changes in credit spreads. The first channel
is the leverage effect which is due to leverage increasing substantially in a firm subject to an LBO. This
channel unambiguously implies a positive relation between LBO risk and credit spreads. The second
channel is due to the disciplining effect whereby LBO risk disciplines managers and reduces agency
costs. This channel is generally viewed in the literature to imply a negative relation between LBO risk
and credit spreads (see for example Qiu and Yu (2009) and Francis, Hasan, John, and Waisman (2010)).
Roades and Rutz (1982) find supporting evidence for the hypothesis that managers leading the quiet
life trade off higher profits for less risk, leading to a potential positive relation between LBO risk and
credit spreads. Therefore, the qualitative effect of the disciplining channel on credit spreads is not clear.
In this section we separate out the two channels through which LBO risk can influence spreads by
examining yields on bonds with and without event risk covenants. We separately study the two effects
by relying on the insight that the yield on a bond with an event risk covenant to a large extent is
sensitive to the disciplining effect but not the leverage effect, while the yield on a unprotected bond is
16
sensitive to both effects. This allows us to isolate the effect of the leverage channel by estimating the
yield difference between bonds without and with an event risk covenant. Furthermore, we can quantify
the relative importance of the two channels by estimating the yield reaction of secured and unsecured
bonds to intra-industry LBO announcements.
Leverage effect.
All corporate bonds are influenced by the disciplining effect while protected bonds to a large extent
are insulated from the leverage effect. We can therefore estimate the effect of the leverage channel by
comparing credit spreads of bonds with and without event risk covenants.
Crabbe (1991) uses a similar appreoach to isolate the impact of the leverage effect on credit spreads.
Specifically, Crabbe regresses the 1989 year-end yield spread of 72 bonds on a dummy indicator for
event risk and controls for credit risk by adding rating dummies and maturity controls and controls
for liquidity by adding size to the regression. The regression coefficient on the event risk dummy in
Crabbe’s regression is -32bps indicating that the average effect of LBO risk on credit spreads through
the leverage channel at the end of 1989 was 32 basis points. Using the same cross-sectional regression
in the first six months in 1990 Crabbe finds that the effect of LBO risk decreased to around 15bps by
June 1990.
Including covenants in a bond issue is an endogenous decision by the issuing firm. Consistent with
Smith and Warner (1979)’s Agency Theory of Covenants, Bradley and Roberts (2015) find that riskier
firms are more likely to issue loans with covenants and Billett, King, and Mauer (2007) find that
covenant protection in public bonds is increasing in growth opportunities and leverage. This poses a
challenge when using event risk covenants to assess the pricing impact of LBO risk through the leverage
channel.
To examine the approach in Crabbe more closely, we run the cross-sectional regression in Crabbe on
a monthly basis for the period 2002-2015, resulting in 159 cross-sectional regressions. Table 5 reports
the distribution of the 159 regression coefficients. The average number of observations in the regressions
is 259, compared to Crabbe’s 72 observations, and we run the regression in 159 months while Crabbe
restricts his analysis to 7 months. Thus, our analysis is on a much larger scale than that in Crabbe. The
average regression coefficient on the event risk dummy is 8.59, suggesting that the effect of adding an
17

event risk dummy is an increase in the credit spread of 8.59basis points, and the coefficient is positive
in 112 out of 159 months, i.e. in more than 70% of the months. A positive relation between an event
risk covenant and credit spreads is hard to interpret, intensifying the concerns about covenants being
an endogenous decision by firms.
To assess the pricing impact of LBO risk using event risk covenants, we propose a different approach
that directly controls for the simultaneity between pricing and the inclusion of an event risk covenant.
In our analysis, we restrict our sample to firms that have at least two bonds outstanding, where at least
one was issued with an event risk covenant, and at least one was issued without. The estimated impact
of LBO risk is the difference in yields between the bond with the covenant and the bond without. Thus,
we estimate, at the same time, the impact of an event risk covenant by comparing the yield on a bond
with an event risk covenant and a bond without an event risk covenant, where the bonds have been
issued by the same firm.
Specifically, for each month we run a cross-sectional regression with firm fixed effects where the
sample is restricted to firms which have at least one bond outstanding with an event risk covenant and
at least one bond outstanding without an event risk covenant. The bonds in our sample all have a
remaining maturity of 7-100 years, a rating of BBB- or higher and a fixed coupon. We exclude any
bonds that are puttable, convertible or asset-backed. Also, since the vast majority of bonds with event
risk covenants are callable, we exclude non-callable bonds to avoid the confounding effect of callabillity.
We account for bond maturity by including maturity and maturity2 in the regression. Billett, King,
and Mauer (2007) find that inclusion of one covenant is correlated with the inclusion of other covenants.
To separate the effect of the event risk covenant from the effect of other covenants, we include in the
regression the ratio between the number covenants a bond has and the total number of possible covenants
in Mergent FISD, where we exclude the event risk covenant in both numerator and denominator. Finally,
it is only in the later part of our sample 2002-2015 that it became common to issue investment grade
bonds with event risk covenants. We therefore exclude months where the number of firms in our sample
is less than 20, leaving us with 102 months in the period 2007:04-2015:09.
Table 6 shows the distribution of regression coefficients in the 102 cross-sectional regressions. The
coefficient on the event risk covenant dummy is negative in all months and the average coefficient is
-28.21, i.e. the average impact of LBO risk on long-term credit spreads (through the leverage effect) is
18
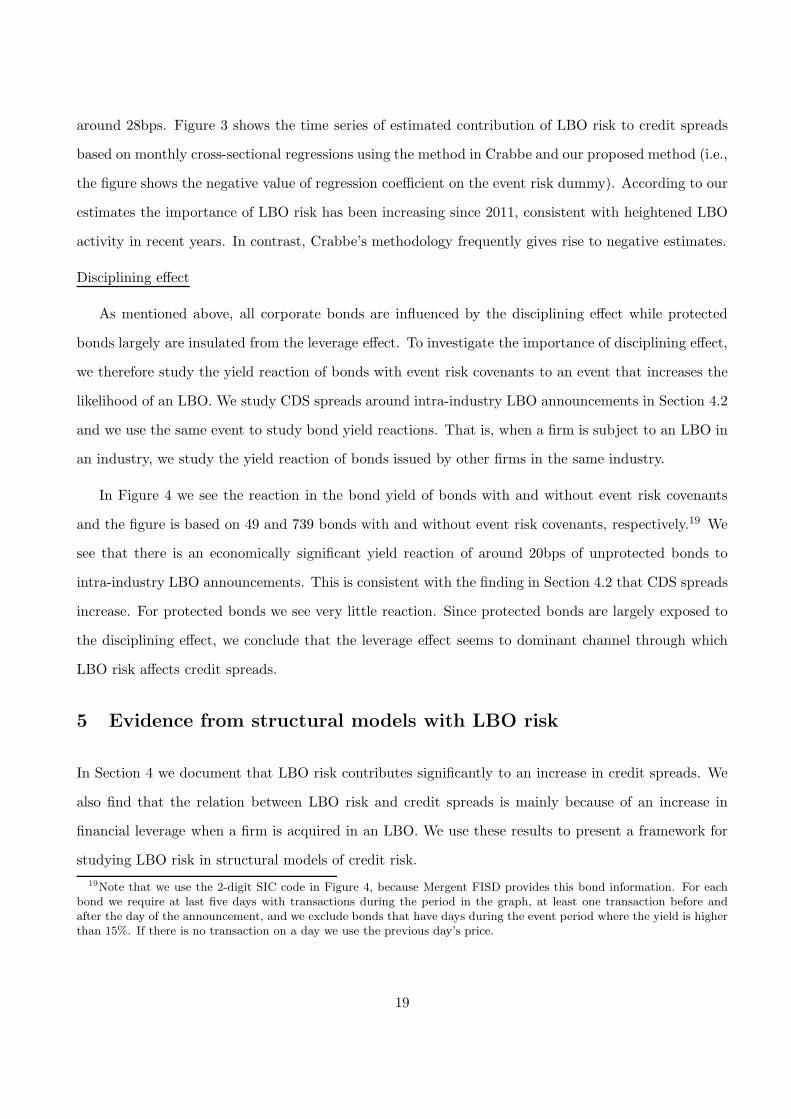
around 28bps. Figure 3 shows the time series of estimated contribution of LBO risk to credit spreads
based on monthly cross-sectional regressions using the method in Crabbe and our proposed method (i.e.,
the figure shows the negative value of regression coefficient on the event risk dummy). According to our
estimates the importance of LBO risk has been increasing since 2011, consistent with heightened LBO
activity in recent years. In contrast, Crabbe’s methodology frequently gives rise to negative estimates.
Disciplining effect
As mentioned above, all corporate bonds are influenced by the disciplining effect while protected
bonds largely are insulated from the leverage effect. To investigate the importance of disciplining effect,
we therefore study the yield reaction of bonds with event risk covenants to an event that increases the
likelihood of an LBO. We study CDS spreads around intra-industry LBO announcements in Section 4.2
and we use the same event to study bond yield reactions. That is, when a firm is subject to an LBO in
an industry, we study the yield reaction of bonds issued by other firms in the same industry.
In Figure 4 we see the reaction in the bond yield of bonds with and without event risk covenants
and the figure is based on 49 and 739 bonds with and without event risk covenants, respectively.19 We
see that there is an economically significant yield reaction of around 20bps of unprotected bonds to
intra-industry LBO announcements. This is consistent with the finding in Section 4.2 that CDS spreads
increase. For protected bonds we see very little reaction. Since protected bonds are largely exposed to
the disciplining effect, we conclude that the leverage effect seems to dominant channel through which
LBO risk affects credit spreads.
5 Evidence from structural models with LBO risk
In Section 4 we document that LBO risk contributes significantly to an increase in credit spreads. We
also find that the relation between LBO risk and credit spreads is mainly because of an increase in
financial leverage when a firm is acquired in an LBO. We use these results to present a framework for
studying LBO risk in structural models of credit risk.
19Note that we use the 2-digit SIC code in Figure 4, because Mergent FISD provides this bond information. For eachbond we require at last five days with transactions during the period in the graph, at least one transaction before andafter the day of the announcement, and we exclude bonds that have days during the event period where the yield is higherthan 15%. If there is no transaction on a day we use the previous day’s price.
19

Specifically, we extend standard structural models by incorporating the leverage effect: there is a
time-varying probability of the firm undergoing an LBO and if an LBO occurs the firm’s leverage is
increased. We implement the framework in the classic Merton (1974) model and Collin-Dufresne and
Goldstein (2001)’s model with stationary leverage, calibrate the models and use the models to present
further evidence on the pricing of LBO risk over time and across bond maturities.
5.1 The Merton model with LBO risk
Assume that firm value follows a Geometric Brownian Motion
dVt
Vt= (r − δ)dt + σdW V
t (2)
under the risk neutral measure, and r is the riskfree rate while δ is the total payout to debt and equity
holders.20 Assume that the firm has issued one zero-coupon bond with maturity T and a face value of
K. The firm can only default at bond maturity and it does so if firm value is below the face value of
debt. Following Chen, Collin-Dufresne, and Goldstein (2009) and Feldhutter and Schaefer (2016) we
assume that in the event of default, bondholders receive a fraction α of the face value of debt. If we
define leverage as Lt =KVt
and the price of the zero coupon bond at time 0 as vM (L0, δ, σ, α, r) it is
well-known that
vM (L0, δ, σ, α, r) = e−rT[
α+ (1− α)N(− log(L0) + (r − δ − 1
2σ2)T√
σ2T
)
]
. (3)
We extend the model by assuming that the firm can potentially undergo an LBO at time τ . If an
LBO occurs, the firm issues more debt with the same maturity and seniority as existing debt. The
total amount of debt after the LBO is eJK where J is normally distributed with mean η and standard
deviation ς.21 We assume that the LBO event follows a Cox process with intensity λt (see Lando (1998)).
This implies that in a short time interval between t and t +∆, the probability of an LBO occuring is
approximately λt∆. We assume that λt follows a CIR process,
dλt = κ(θ − λt)dt+ ξ√
λtdWλt , (4)
20See Feldhutter and Schaefer (2016) for a more extensive discussion of the assumptions of the model.21It can happen that the firm retires debt if J < 0. If this happens we assume that the firm buys back debt at post-LBO
market value.
20
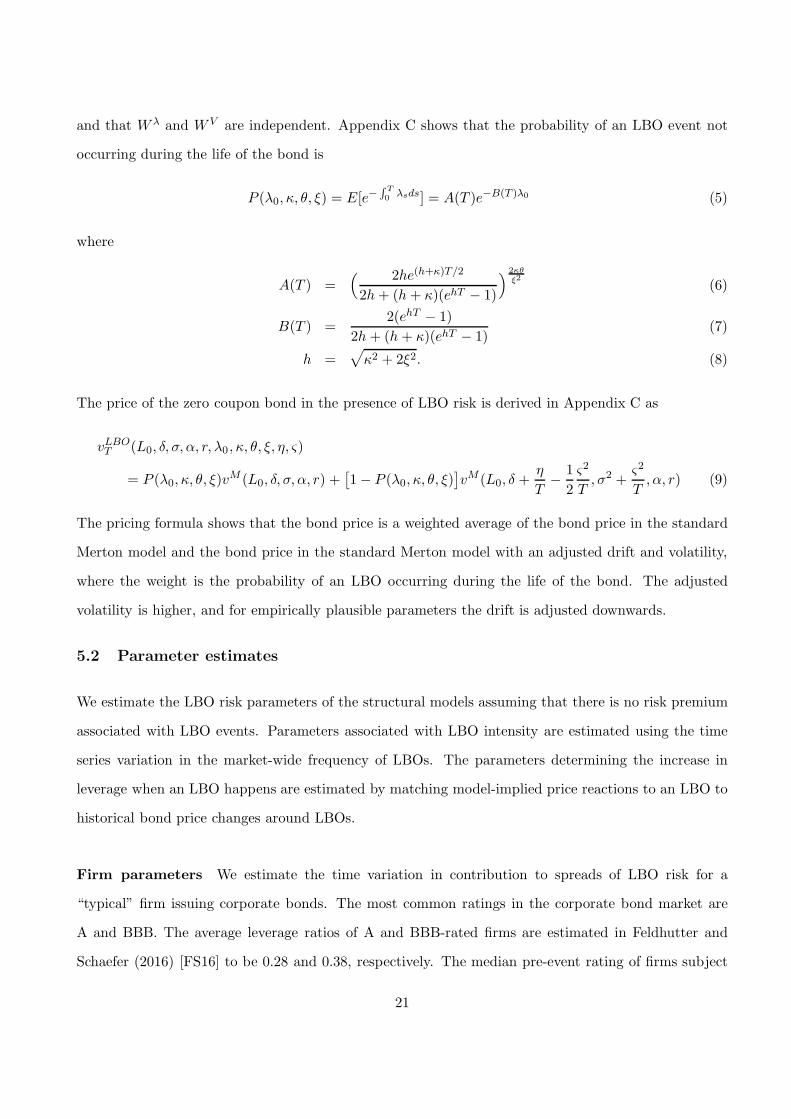
and that W λ and W V are independent. Appendix C shows that the probability of an LBO event not
occurring during the life of the bond is
P (λ0, κ, θ, ξ) = E[e−∫ T
0 λsds] = A(T )e−B(T )λ0 (5)
where
A(T ) =( 2he(h+κ)T/2
2h+ (h+ κ)(ehT − 1)
)2κθξ2 (6)
B(T ) =2(ehT − 1)
2h+ (h+ κ)(ehT − 1)(7)
h =√
κ2 + 2ξ2. (8)
The price of the zero coupon bond in the presence of LBO risk is derived in Appendix C as
vLBOT (L0, δ, σ, α, r, λ0 , κ, θ, ξ, η, ς)
= P (λ0, κ, θ, ξ)vM (L0, δ, σ, α, r) +
[
1− P (λ0, κ, θ, ξ)]
vM (L0, δ +η
T− 1
2
ς2
T, σ2 +
ς2
T, α, r) (9)
The pricing formula shows that the bond price is a weighted average of the bond price in the standard
Merton model and the bond price in the standard Merton model with an adjusted drift and volatility,
where the weight is the probability of an LBO occurring during the life of the bond. The adjusted
volatility is higher, and for empirically plausible parameters the drift is adjusted downwards.
5.2 Parameter estimates
We estimate the LBO risk parameters of the structural models assuming that there is no risk premium
associated with LBO events. Parameters associated with LBO intensity are estimated using the time
series variation in the market-wide frequency of LBOs. The parameters determining the increase in
leverage when an LBO happens are estimated by matching model-implied price reactions to an LBO to
historical bond price changes around LBOs.
Firm parameters We estimate the time variation in contribution to spreads of LBO risk for a
“typical” firm issuing corporate bonds. The most common ratings in the corporate bond market are
A and BBB. The average leverage ratios of A and BBB-rated firms are estimated in Feldhutter and
Schaefer (2016) [FS16] to be 0.28 and 0.38, respectively. The median pre-event rating of firms subject
21

to an LBO is BBB and the average leverage in the year before the LBO is 0.33 in our sample. We
therefore choose 0.33 as leverage. The asset volatilities of A and BBB-rated firms are 0.23 and 0.25,
respectively (FS16), so we choose the average of 0.24 as asset volatility. The drift of the assets under
the risk neutral measure is r− δ, where r is the riskfree rate and δ is the payout rate to debt and equity
holders (as a percentage of firm value). We set r equal to the average 5-year Treasury yield for the
period 1980-2014 of 6.10% and the payout ratio to 4.85% (the average payout rate of A and BBB firms
according to FS16).22 Finally, we set the recovery rate α = 37.8%, Moody’s (2013)’s average recovery
rate for senior unsecured bonds for 1982-2012.
LBO intensity parameters We calculate a market-wide annual LBO probability by computing
the ratio of the number of firms that were targets of an LBO (according to Thomson Financial LBO
announcements) to the number of industry firms (as reported in Compustat). As discussed in Section
4.1.1 we adjust this ratio by 0.1624. We let the time series of LBO probabilities proxy for the path of λ,
observed on a yearly basis. The average LBO probability in the period 1980-2014 is 2.76%. We use this
number as the estimate of the unconditional mean θ. We estimate the remaining two parameters κ and
ξ by Maximum Likelihood using the method in Kladıvko (2007); they are estimated to be κ = 0.124
and ξ = 0.0523. A mean reversion of κ = 0.124 implies that the half-life of a shock to the LBO intensity
is log(2)0.124 = 5.6 years consistent with LBO intensity varying with the business cycle.
Leverage jump parameters As the previous model section explains, if there is an LBO, total debt
jumps from K to KeJ where J ∼ N(η, ς). ς is hard to identify and we therefore set this parameter to
ς = 0.2 (other values give rise to similar results). The average jump in log-leverage, η, is crucial and we
back out the parameter by fitting model-implied price reactions to historical price reactions around an
LBO. The average historical price reactions are given in Table 2 Panel E and we denote the historical
price reaction at bond maturity ti for prehist(ti) (we assume that ti is the mid-point in a given maturity
range, such that for example the range 8-10 years corresponds to ti = 9). For a given bond maturity ti,
the corresponding model-implied price reaction in the Merton model is calculated as
pr(η, ti) := vMti (eηL0, δ, σ, α, r) − vLBO
ti (L0, δ, σ, α, r, λ0 , κ, θ, ξ, η, ς) (10)
22Feldhutter and Lando (2008) show that the swap rate is a better proxy for the riskfree rate than the Treasury yield,but swap rates are not available before 1987.
22
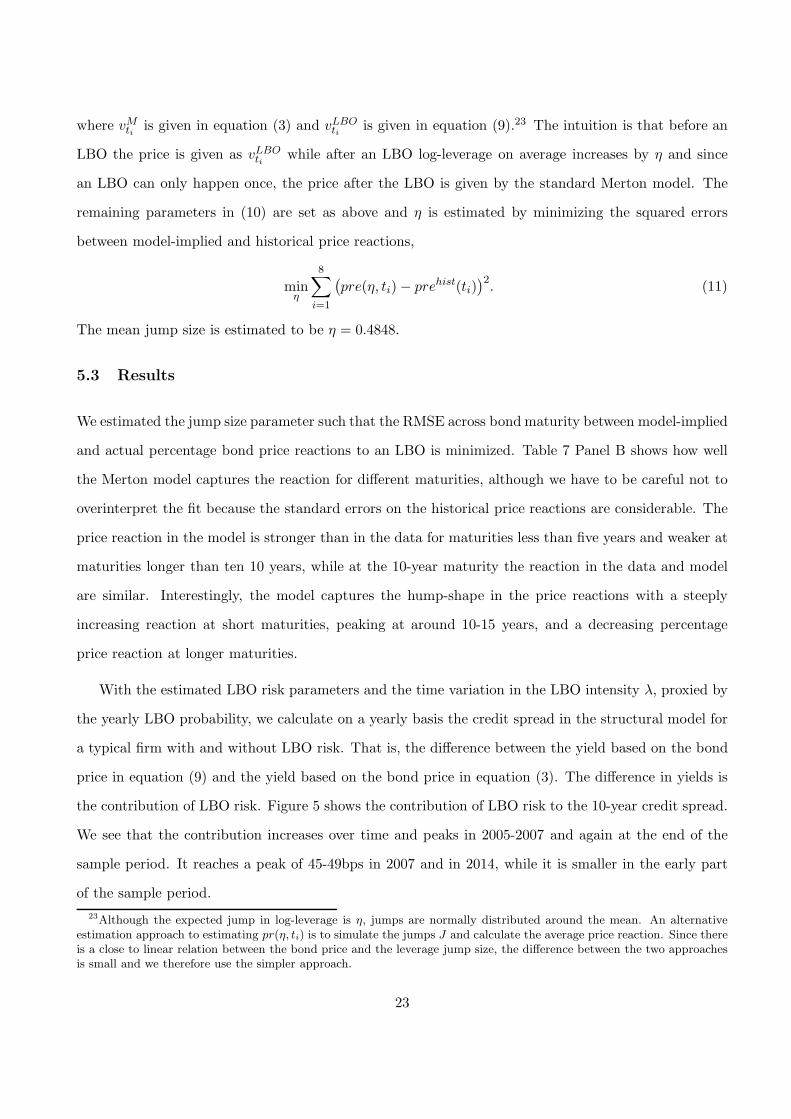
where vMti is given in equation (3) and vLBOti is given in equation (9).23 The intuition is that before an
LBO the price is given as vLBOti while after an LBO log-leverage on average increases by η and since
an LBO can only happen once, the price after the LBO is given by the standard Merton model. The
remaining parameters in (10) are set as above and η is estimated by minimizing the squared errors
between model-implied and historical price reactions,
minη
8∑
i=1
(
pre(η, ti)− prehist(ti))2. (11)
The mean jump size is estimated to be η = 0.4848.
5.3 Results
We estimated the jump size parameter such that the RMSE across bond maturity between model-implied
and actual percentage bond price reactions to an LBO is minimized. Table 7 Panel B shows how well
the Merton model captures the reaction for different maturities, although we have to be careful not to
overinterpret the fit because the standard errors on the historical price reactions are considerable. The
price reaction in the model is stronger than in the data for maturities less than five years and weaker at
maturities longer than ten 10 years, while at the 10-year maturity the reaction in the data and model
are similar. Interestingly, the model captures the hump-shape in the price reactions with a steeply
increasing reaction at short maturities, peaking at around 10-15 years, and a decreasing percentage
price reaction at longer maturities.
With the estimated LBO risk parameters and the time variation in the LBO intensity λ, proxied by
the yearly LBO probability, we calculate on a yearly basis the credit spread in the structural model for
a typical firm with and without LBO risk. That is, the difference between the yield based on the bond
price in equation (9) and the yield based on the bond price in equation (3). The difference in yields is
the contribution of LBO risk. Figure 5 shows the contribution of LBO risk to the 10-year credit spread.
We see that the contribution increases over time and peaks in 2005-2007 and again at the end of the
sample period. It reaches a peak of 45-49bps in 2007 and in 2014, while it is smaller in the early part
of the sample period.
23Although the expected jump in log-leverage is η, jumps are normally distributed around the mean. An alternativeestimation approach to estimating pr(η, ti) is to simulate the jumps J and calculate the average price reaction. Since thereis a close to linear relation between the bond price and the leverage jump size, the difference between the two approachesis small and we therefore use the simpler approach.
23
When analysing LBO risk by investigating bonds with and without event risk covenants, we found
that the average contribution to spreads in 2007-2015 was 28bps. To compare this result with the results
implied by the structural model, we note that the average bond maturity in the event risk covenant
regression in Table 6 is 17.4 years and at this maturity the average spread implied by the structural
model in the years 2007-2014 is 33bps. Thus, the two different approaches give rise to similar estimates
of the average contribution of LBO risk.
Panel A in Table 7 shows the contribution of LBO risk to credit spreads is hump-shaped as a function
of maturity. We see that the ontribution of LBO risk increases from 4.4bps at the one-year maturity to
27.6bps at the 10-year maturity and then declines to 20.5bps at the 30-year maturity. Intuitively, LBO
risk is not important for short-maturity bonds, because although leverage jumps in an LBO, the firm
is unlikely to be on the verge of default immediately after the LBO.
5.4 Stationary leverage ratios
Collin-Dufresne and Goldstein (2001) incorporate a stationary leverage ratio in a standard structural
model. As Flannery, Nikolova, and Oztekin (2012) find further empirical support for this model, we
consider stationary leverage ratios in the context of LBO risk. The effect of LBO risk is distinct from a
stationary leverage ratio. In particular, changes in debt due to a stationary leverage ratio are predictable
and slow-moving, while changes in debt due to LBO risk are unpredictable and large. To show that
LBO risk is significant in debt pricing under a range of model assumptions, we incorporate LBO risk in
Collin-Dufresne and Goldstein (2001)’s stationary leverage model and estimate the impact of LBO risk
in the case of a stationary leverage ratio.
Assume that firm value follows a Geometric Brownian Motion
dVt
Vt= (r − δ)dt + σdW V
t (12)
under the risk neutral measure and r is the riskfree rate while δ is the total payout to debt and equity
holders. Define yt = log(Yt) and assume as in Collin-Dufresne and Goldstein (2001) that the firm targets
a long-run leverage ratio and that the dynamics of the log of the amount of debt, kt, are given by
dkt = φ(ν − (kt − yt))dt. (13)
24

If we define log-leverage as lt = kt − yt, the intuition is that if lt is less than ν, the firm increases
the amount of debt and vice versa, i.e. log-leverage is stationary around a mean leverage of ν. This
specification captures the idea that the firm tends to issue more debt when leverage is low and tends to
retire debt when leverage is high. We assume that all debt has equal priority and matures at time T ,
i.e. if the firm issues more debt, it issues more debt with the same maturity and seniority as existing
debt. The firm can only default at bond maturity T and it does so if firm value is below the face value
of all debt KT . If the firm defaults, bondholders receive a fraction α of the face value of debt.
As in Section 5.1, we assume that the firm can potentially undergo an LBO that occurs at time τ , in
which case the firm issues more debt (with the same maturity and seniority as existing debt). To capture
that leverage jumps after the LBO and that the target leverage is higher after an LBO, we assume that
the total amount of debt immediately after the LBO is KτeJ where J is normally distributed with mean
η and standard deviation ς, while the target log-leverage after the LBO changes from ν to ν + J . As
in Section 5.1 we assume that the LBO event follows a Cox process with intensity λt where λt follows
a CIR process,
dλt = κ(θ − λt)dt+ ξ√
λtdWλt (14)
and that there is no risk premium associated with LBO risk.
Appendix C shows that the bond price is given as
P (λ0, κ, θ, ξ)N( l + (l0 − l)e−φT
√
σ2
2φ(1− e−2φT )
)
+[
1− P (λ0, κ, θ, ξ)]
N( l + (l0 − l)e−φT + η√
σ2
2φ (1− e−2φT ) + ς2
)
(15)
where
l =−r + δ + 1
2σ2
φ+ ν (16)
and P (λ0, κ, θ, ξ) is given in equations (5)-(8).
To disentangle the effect of LBO risk from that of a stationary leverage ratio, we calculate the
spread in the model with and without LBO risk and compute the difference. We use Collin-Dufresne
and Goldstein (2001)’s parameters of φ = 0.18 and ν = −0.6. We use the same estimated LBO intensity
parameters as for the Merton model. The leverage jump size η is estimated in the same way as for the
25

Merton model by minimizing the RMSEs between actual and model-implied price reactions to an LBO,
where the model-implied price reaction is calculated as the percentage difference between the price in
the standard model without LBO risk and a target log-leverage of ν + J and the model with LBO risk
and a target log-leverage of ν. The mean jump size is estimated to η = 0.3520.
Table 7 shows the results. Panel B show that, as was the case in the Merton model, the stationary
leverage model captures the historical hump-shaped relation between price reaction around LBOs and
maturity. Panel A shows that the effect of LBO risk is similar to that in the Merton model. For
example, the effect of LBO risk is 23bps at the 5-year maturity and 28-34bps at the 10-year maturity
in both models. It is only for long maturities (15-30 years) that a 10bps difference in spread predictions
starts to emerge.
Figure 5 shows the time series variation in spread contribution of LBO risk at a maturity of 10 years
in the stationary leverage model as well as the Merton model. The spread contribution in the stationary
leverage model is slightly higher than in the Merton model, but the time series variation implied by
both models is very similar.
6 Summary
Although LBO activity is cyclical, LBO volume has generally increased in the past three decades as
private equity activity has grown, rendering LBO risk a growing concern for investors in credit markets.
This paper studies the impact of LBO risk on credit spreads over time, in the cross section, and across
bond maturities.
We first establish that bondholders’ ex-post losses around LBOs are as significant a concern in
the recent decade compared to earlier decades: on average unprotected bonds lose 4.9% in value. We
document that losses are strongly dependent on bond maturity and there is a hump-shaped relation
between losses and maturity: bonds with a maturity less than two years have an insignificant average
abnormal price reaction of -0.2% while bonds with a maturity of 10-15 years show the strongest average
abnormal price reaction of -15.0%.
We examine the relation between LBO risk and credit spreads in a range of different tests. We
define an industry-level probability of LBO risk and show that firms more likely to undergo an LBO have
26
spreads that are significantly higher in a panel regression. The effect is more pronounced in low-volatility,
low-leverage, and high-ROA firms - characteristics of typical LBO targets. While informative, this
regression may suffer from omitted variable bias, and we therefore also show that intra-industry credit
spreads increase around LBO announcements, consistent with the notion that investors revise upward
the probability of future LBOs leading to higher spreads. To rule out the most obvious alternative
explanation of this result – that the increase in spreads is due to lower valuations of firms in the
industry – we show that equity returns are significantly positive around the announcement.
Having presented two tests showing a positive relation between LBO risk and credit spreads we
sharpen our analysis further and examine two channels that may contribute to this relation. One
channel is due to an increase in leverage around an LBO. We isolate the contribution of this channel
by comparing, at the same time, the yield of bonds without event risk covenants protecting against
LBOs and bonds with event risk covenants, issued by the same firm. We find an average sizeable
difference of 28 basis points. This identification strategy allows us to control for firms’ credit quality
non-parametrically and therefore provides strong support for the leverage effect being economically
important. Another potential channel is due to the disciplining effect of LBOs, i.e. managers cannot
lead the quiet life when a takeover threat is looming. To investigate this channel, we rely on the insight
that all corporate bonds are exposed to the disciplining effect, but bonds with event risk covenants are
largely insulated from the leverage effect. Specifically, we examine the disciplining effect by calculating
yield changes of bonds with event risk covenants around intra-industry LBO announcements. In a
month around the announcement the average yield change of those bonds is small, suggesting that the
leverage effect is the dominant channel for understanding the relation between LBO risk and credit
spreads.
Based on our evidence that the leverage effect is the main driver of the link between LBO risk and
credit spreads, we incorporate this effect in structural models of credit risk. We do so by letting the
firm be exposed to a time varying probability of an LBO occurring, in which case the firm’s outstanding
debt jumps. Importantly, we calibrate the models to two measurements in the data that isolate LBO
risk from risks coming from other corporate events: the frequency of LBOs and the ex-post impact of
LBOs on bond prices. The calibrated structural models allow us to study the contribution to credit
spreads across bond maturities and over a long time period, 1980-2014.
27

We find that the contribution of LBO risk to 10-year credit spreads has increased substantially from
around 15 bps in 1980 to approximately 50bps in 2014, underpinning the increased significance of LBO
risk in credit pricing. We also find that the effect of LBO risk is hump-shaped with respect to maturity
and the effect is strongest for bonds with a remaining maturity of 10-15 years, consistent with historical
evidence.
Our results further the understanding of the variation in credit spreads. According to standard
structural models, only firm-specific variables, such as leverage and asset volatility, affect spreads. Yet
Collin-Dufresne, Goldstein, and Martin (2001) find that a significant fraction of credit spread changes is
explained by a common factor unrelated to firm-specific variables and bond market liquidity. LBO risk
can help explain these findings, as an increasingly significant, unaccounted-for risk. Corporate issuers
have been increasingly exposed to potentially hostile takeovers, which result in a dramatic change in
risk profile, particularly for investment-grade firms. While buyout activity is subject to recurring boom
and bust cycles, a significant part of the growth in private equity activity is, according to Kaplan and
Stromberg (2009), believed to be permanent.
28
References
Asquith, P. and A. Wizmann (1990). Event risk, covenants, and bondholder returns in leveraged
buyouts. Journal of Financial Economics 27 (1).
Baran, L. and T.-H. D. King (2010). Going private transactions, bondholder returns, and wealth
transfer effects. Journal of Banking and Finance 34, 1856–1872.
Billett, M., Z. Jiang, and E. Lie (2010). The effect of change-of-control covenants on takeovers:
Evidence from leveraged buyouts. Journal of Corporate Finance 16, 1–15.
Billett, M., T.-H. D. King, and D. Mauer (2007). Growth Opportunities and the Choice of Leverage,
Debt Maturity, and Covenants. Journal of Finance 62 (2), 697–730.
Boehmer, E., J. Musumeci, and A. Poulsen (1991). Event-study methodology under conditions of
event-induced variance. Journal of Financial Economics 50, 253–272.
Bradley, M. and M. Roberts (2015). The Structure and Pricing of Corporate Debt Covenants. Quar-
terly Journal of Finance 5, 1550001.
Cain, M. D., S. B. McKeon, and S. D. Solomon (2016). Do Takeover Laws Matter? Evidence from
Five Decades of Hostile Takeovers. Forthcoming, Journal of Financial Economics.
Campani, C. H. and F. Goltz (2011). A review of corporate bond indices: Construction principles,
return heterogeneity, and fluctuations in risk exposures. Unpublished Manuscript, EDHEC-RISK
Institute, 1–68.
Chen, L., P. Collin-Dufresne, and R. S. Goldstein (2009). On the relation between the credit spread
puzzle and the equity premium puzzle. Review of Financial Studies 22, 3367–3409.
Collin-Dufresne, P. and R. Goldstein (2001). Do Credit Spreads Reflect Stationary Leverage Ratios?
Journal of Finance 56, 1929–1957.
Collin-Dufresne, P., R. Goldstein, and S. Martin (2001). The Determinants of Credit Spread Changes.
Journal of Finance 56, 2177–2207.
Comment, R. and G. W. Schwert (1995). Poison or placebo? Evidence on the deterrence and wealth
effects of modern antitakeover measures. Journal of Financial Economics 39, 3–43.
29
Cox, J., J. Ingersoll, and S. Ross (1985). A Theory of the Term Structure of Interest Rates. Econo-
metrica 53, 385–407.
Crabbe, L. (1991). Event Risk: An Analysis of Losses to Bondholders and “Super Poison Put” Bond
Covenants. Journal of Finance 46, 689–706.
Dick-Nielsen, J. (2009). Liquidity biases in TRACE. Journal of Fixed Income 19 (2), 43–55.
Dick-Nielsen, J. (2014). How to Clean Enhanced TRACE Data. Unpublished Manuscript .
Feldhutter, P. and D. Lando (2008). Decomposing Swap Spreads. Journal of Financial Economics 88,
375–405.
Feldhutter, P. and S. Schaefer (2016). The Myth of the Credit Spread Puzzle. Unpublished Manuscript .
Flannery, M. J., S. Nikolova, and O. Oztekin (2012). Leverage Expectations and Bond Credit Spreads.
Journal of Financial and Quantitative Analysis 47, 689–714.
Francis, B., I. Hasan, K. John, and M. Waisman (2010). The effect of state antitakeover laws on the
firm’s bondholders. Journal of Financial Economics 96, 127–154.
Harford, J., J. Stanfield, and F. Zhang (2015). What does an LBO signal for the target’s industry?
Working Paper .
Innes, R. D. (1990). Limited Liability and Incentive Contracting with Ex-ante Action Choices. Journal
of Economic Theory 52, 45–67.
Jensen, M. (1986). Agency Costs of Free Cash Flow, Corporate Finance, and Takeovers. American
Economic Review 76, 323–329.
Jensen, M. and W. Meckling (1976). Theory of the Firm: Managerial Behavior, Agency Costs and
Ownership Structure. Journal of Financial Economics 3, 305–360.
Kaplan, S. N. and P. Stromberg (2009). Leveraged Buyouts and Private Equity. Journal of Economic
Perspectives 23 (1), 121–146.
Kladıvko, K. (2007). Maximum likelihood estimation of the cox-ingersoll-ross process: the matlab
implementation. In Technical Computing Prague. working paper.
Lando, D. (1998). On cox processes and credit-risky securities. Review of Derivatives Research 2,
99–120.
30
Lehn, K., J. Netter, and A. Poulsen (1990). Consolidating Corporate Control: The Choice Between
Dual-Class Recapitalizations and Going Private Transactions. Journal of Financial Economics 27,
557–580.
Loon, Y. C. and Z. K. Zhong (2014). The impact of central clearing on counterparty risk, liquidity,
and trading: Evidence from the credit default swap market. Journal of Financial Economics 112,
91–115.
Marais, L., K. Schipper, and A. Smith (1989). Wealth effects of going private for senior securities.
Journal of Financial Economics 23, 155–191.
Merton, R. (1974). On the Pricing of Corporate Debt: The Risk Structure of Interest Rates. Journal
of Finance 29, 449–470.
Micu, M., E. Remolona, and P. Wooldridge (2006). The Pricing Impact of Rating Announcements:
Which announcements matter? BIS Working Paper .
Mitchell, M. and H. Mulherin (1996). The Impact of Industry Shocks on Takeover and Restructuring
Activity. Journal of Financial Economics 41, 193–229.
Moody’s (2013). Annual Default Study: Corporate Default and Recovery Rates, 1920-2012. Moody’s
Investors Service, 1–64.
Qiu, J. and F. Yu (2009). The market for corporate control and the cost of debt. Journal of Financial
Economics 93, 505–524.
Roades, S. and R. Rutz (1982). MARKET POWER AND FIRM RISK A Test of the ’Quiet Life’
Hypothesis. Journal of Monetary Economics, 73–85.
Ronen, T. and X. Zhou (2013). Trade and information in the corporate bond market. Journal of
Financial Markets 16, 61–103.
Smith, C. and J. Warner (1979). On Financial Contracting: An Analysis of Bond Covenants. Journal
of Financial Economics 7, 117–161.
Warga, A. and I. Welch (1993). Bondholder losses in leveraged buyouts. Review of Financial Studies,
959–982.
31
A Time series and cross-sectional variation in LBO activity
This appendix shows that there is significant time series variation and industry variation in LBO activity.
Figure A1 details the number and total value of LBO announcements in the U.S. by year. The figure
illustrates clear trends in buyout activity over time.24 We observe increased LBO activity in the late
1980s, in the 2004-2007 period preceding the financial crisis, and again in 2012-2015, both in number
and magnitude of deals.25
Figure A2 presents a breakdown of LBO activity by industry and time period. It displays the
percentage of LBOs occurring in different industries out of the total number of LBOs by decade. Industry
is classified according to two-digit SIC codes and the figure shows industries for which the percentage was
over 3% in at least one decade. The composition of LBO-intensive industries has clearly changed over
time. In the early period (1980-1989), there was a higher frequency of LBOs in Industrial Machinery and
Equipment, particular in Primary Metal Industries (e.g. Kaiser Aluminium & Chemical, NorthWest
Industries Inc.) and Paper Products (e.g. Fort Howard Corp., Jefferson Smurfit Corp.). This is
consistent with the finding in Lehn, Netter, and Poulsen (1990) that LBOs occurred in low growth and
low R&D industries. A different picture emerges when studying the more recent LBOs. In 2010-2015
LBOs are heavily concentrated in services, with a clear focus on technology and telecommunications.26
Particularly striking is the gradual increase in LBO activity in Business Services from 3.4% in 1980-
1989 to 19.0% in 2010-2015, out of which Computer and Data Processing Services account for 1.5% and
13.3% respectively.27
24We retain only deals with “completed” status, which leaves a sample of 10851 announcements out of the 12210mentioned in Section 2.4.
25The value is the equity value of target firms, but since only 16.2% of the deals in Thomson One Banker have informationon the equity value, the reported value is a lower bound on the actual total value (although we do expect that the 16.2%for which there is information are among the largest LBO deals).
26Examples of LBO firms are BMC Software Inc. and Informatica Inc. in Business Services, REsCare Inc. and AmericanDental partners Inc. in Health Services, and InVentiv Health Inc. and eResearch Technology Inc. in Engineering &Management Services.
27An interesting question in itself is the reason for the documented clustering in these specific industries and the changein focus of LBO sponsors over time. Mitchell and Mulherin (1996) find inter-industry patterns to be directly related tothe economic shocks borne by the sample industries, e.g. deregulation, changes in input costs and innovations in financingtechnology, suggesting that a similar shock might have driven recent trends.
32
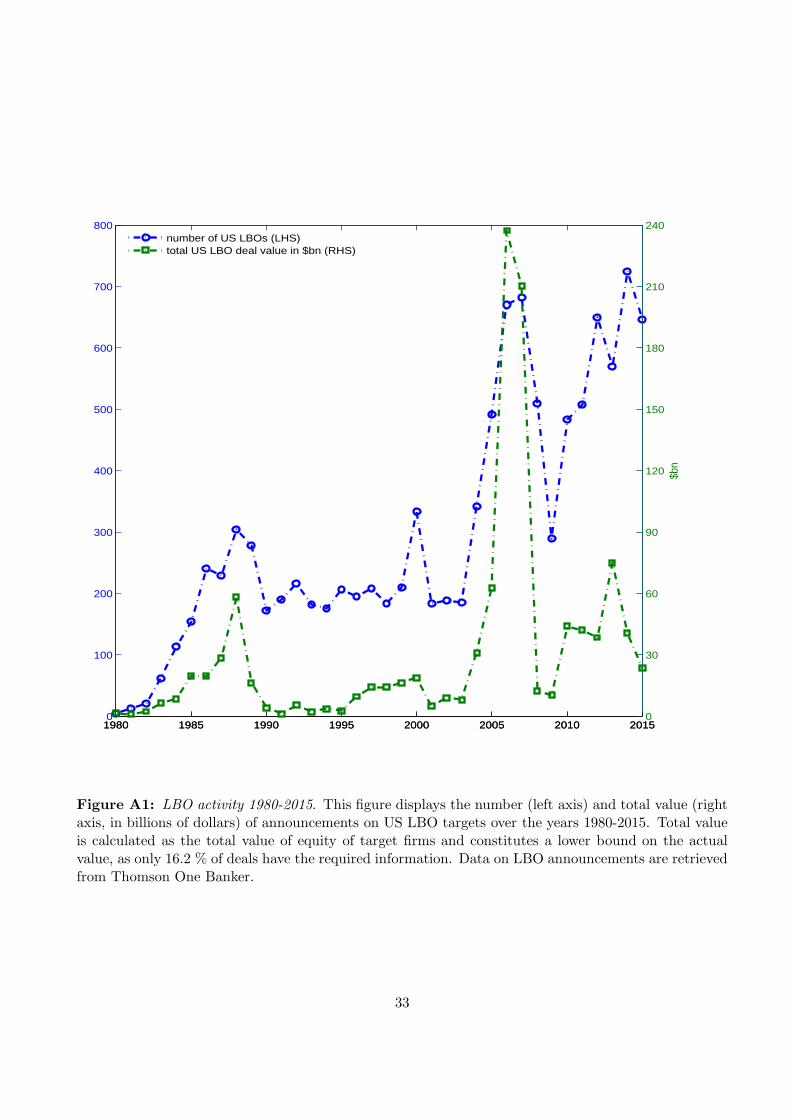
1980 1985 1990 1995 2000 2005 2010 20150
100
200
300
400
500
600
700
800
1980 1985 1990 1995 2000 2005 2010 20150
30
60
90
120
150
180
210
240
$bn
number of US LBOs (LHS)total US LBO deal value in $bn (RHS)
Figure A1: LBO activity 1980-2015. This figure displays the number (left axis) and total value (rightaxis, in billions of dollars) of announcements on US LBO targets over the years 1980-2015. Total valueis calculated as the total value of equity of target firms and constitutes a lower bound on the actualvalue, as only 16.2 % of deals have the required information. Data on LBO announcements are retrievedfrom Thomson One Banker.
33
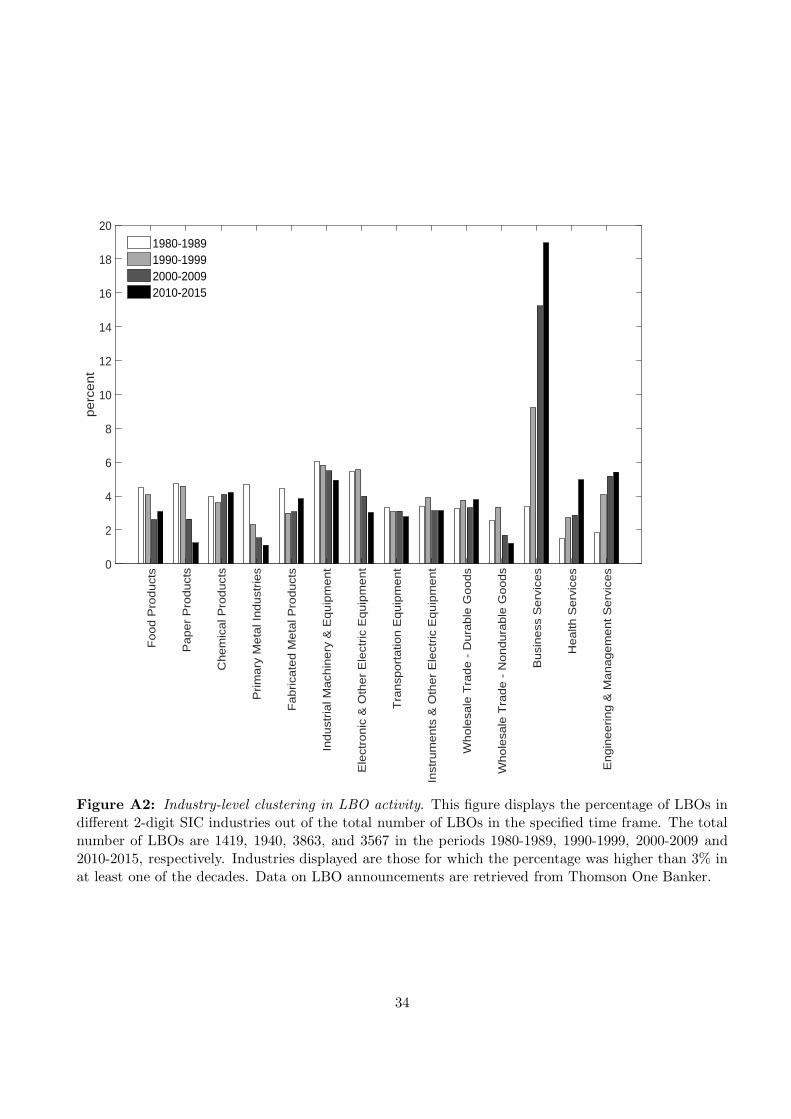
Fo
od
Pro
du
cts
Pa
pe
r P
rod
uct
s
Ch
em
ica
l Pro
du
cts
Prim
ary
Me
tal I
nd
ust
rie
s
Fa
brica
ted
Me
tal P
rod
uct
s
Ind
ust
ria
l Ma
chin
ery
& E
qu
ipm
en
t
Ele
ctro
nic
& O
the
r E
lect
ric
Eq
uip
me
nt
Tra
nsp
ort
atio
n E
qu
ipm
en
t
Inst
rum
en
ts &
Oth
er
Ele
ctric
Eq
uip
me
nt
Wh
ole
sale
Tra
de
- D
ura
ble
Go
od
s
Wh
ole
sale
Tra
de
- N
on
du
rab
le G
oo
ds
Bu
sin
ess
Se
rvic
es
He
alth
Se
rvic
es
En
gin
ee
rin
g &
Ma
na
ge
me
nt
Se
rvic
es
pe
rce
nt
0
2
4
6
8
10
12
14
16
18
201980-19891990-19992000-20092010-2015
Figure A2: Industry-level clustering in LBO activity. This figure displays the percentage of LBOs indifferent 2-digit SIC industries out of the total number of LBOs in the specified time frame. The totalnumber of LBOs are 1419, 1940, 3863, and 3567 in the periods 1980-1989, 1990-1999, 2000-2009 and2010-2015, respectively. Industries displayed are those for which the percentage was higher than 3% inat least one of the decades. Data on LBO announcements are retrieved from Thomson One Banker.
34

B Event study methodology
In this appendix we describe the event study methodology we use in the paper.
B.1 CDS
Daily Returns To measure the effect of the LBO announcements on CDS spreads, we follow Micu,
Remolona, and Wooldridge (2006), Loon and Zhong (2014) and others and study normalized changes
in spreads. In particular, for issuer i at time t the normalized change in spread is
Ri,t = log(si,t
si,t−1) (17)
where si,t is the CDS premium for issuer i on day t.
Abnormal Returns Abnormal return is computed over a market-wide CDS index. The index is
calculated daily, per maturity, as the average CDS premium across all firms in the sample. We use the
market-adjusted model with an estimation window of 100 days, i.e. approximately 70 business days,
and include only events where there are spread changes on at least half of the days in the estimation
window.
Abnormal returns in the market-adjusted model are computed as:
ARi,t = Ri,t − (αi + βiRM,t) (18)
where ARi,t is the abnormal return for issuer i on day t, Ri,t is the return for issuer i on day t
(calculated according to equation (17)), RM,t is the return on the index on day t (computed similarly
to issuer return), and αi and βi are estimated in a regression of issuer i returns against the index over
the estimation window.
In computing the significance of the abnormal return, we must be careful to address two issues
which may affect the variance. First is the error in the estimation of αi and βi and, second, LBO
announcements could potentially lead to a change in the variance of CDS spreads due to a change in
the firm’s risk. We use Boehmer, Musumeci, and Poulsen (1991)’s test statistics, which correct for both
issues (see Micu, Remolona, and Wooldridge (2006) for details).
35

B.2 Corporate bonds
Daily Returns Daily corporate bond returns are defined as:
Ri,t = log(Pi,t
Pi,t−1)
Abnormal returns Abnormal return is computed over the The Bank of America Merrill Lynch US
Corporate Bond Master Index (see Campani and Goltz (2011) for a review of corporate bond indices).
We use a market-adjusted model with an estimation window of 30 days, i.e. approximately 22 business
days.28 Test statistics are the same as those used in the CDS study. We calculate daily bond prices as
the average price across all transactions on that day. If there are no transactions on a specific day in
the event window, we use the last available daily price. If there are more than five days in the event
window with missing prices we discard the bond.
C Structural models with LBO risk
In this Appendix we derive credit spreads in two structural models with LBO risk. The first is the
Merton model (as implemented in Chen, Collin-Dufresne, and Goldstein (2009) and Feldhutter and
Schaefer (2016)) and the second is Collin-Dufresne and Goldstein (2001)’s stationary leverage model.
Assume that firm value follows a Geometric Brownian Motion under the risk-neutral measure
dVt
Vt= (r − δ)dt + σdW V
t (19)
where r is the riskfree rate, δ the payout rate, and σ is the asset volatility. We define y = log(V ) and
have
dyt = (r − δ − 1
2σ2)dt+ σdW V
t . (20)
C.1 Merton model with LBO risk
Assume that the firm has issued one zero-coupon bond with maturity T and face value of K. The firm
can only default at bond maturity and it does so if firm value is below the face value of all debt KT . If
28We use a shorter estimation window than for CDS returns because a significant number of bonds do not have a longenough transaction history.
36

the firm defaults bondholders receive a fraction α of the face value of debt. If the firm has not undergone
an LBO between time 0 and T there is only one bond outstanding and the face value of debt at time T
is equal to the face value of debt at time 0, namely K.
The firm can potentially undergo an LBO that occurs at time τ . If an LBO occurs the firm issues
more debt with the same maturity and seniority as existing debt. The total amount of debt after the
LBO is KeJ where J is normally distributed with mean η and standard deviation ς. We assume that
the LBO event follows a Cox process with intensity λt (see Lando (1998)). This implies that in a short
time interval between t and t+∆ the probability of an LBO occuring is approximately λt∆. We assume
that λt follows a CIR process,
dλt = κ(θ − λt)dt+ ξ√
λtdWλt . (21)
We assume that there is no risk premium associated with LBO risk, such that the dynamics of LBO risk
are the same under the natural and risk-neutral measure. If we are at time 0 and define the expected
payoff at maturity T of the risky zero coupon bond as w(T ) we have that
w(T ) = E[1{VT>KT } + α1{VT≤KT }] (22)
= E[α+ (1− α)1{VT>KT }] (23)
= E[α+ (1− α)1{VT>KT }|τ > T ]P (τ > T ) + E[α+ (1− α)1{VT>KT }|τ ≤ T ]P (τ ≤ T )(24)
= E[α+ (1− α)1{VT>K}]P (τ > T ) + E[α+ (1− α)1{VT>KeJ}]P (τ ≤ T ) (25)
According to Lando (1998) we have that
P (τ > T ) = E[e−∫ T
0λsds] (26)
and we know from Cox, Ingersoll, and Ross (1985) that
E[e−∫ T
0 λsds] = A(T )e−B(T )λ0 (27)
where
A(T ) =( 2he(h+κ)T/2
2h+ (h+ κ)(ehT − 1)
)2κθξ2 (28)
B(T ) =2(ehT − 1)
2h+ (h+ κ)(ehT − 1)(29)
h =√
κ2 + 2ξ2. (30)
37

Define Lt =KVt. We have that
E[1{VT>KeJ}] = P (LT < e−J) = P (log(Lt) + J < 0) (31)
and because – using (20) – log(VT ) is normally distributed with mean log(V0) + (r − δ − 12σ
2)T and
variance σ2T , we have that log(LT )+ J is normally distributed with mean log(L0)− (r− δ− 12σ
2)T + η
and variance σ2T + ς2. Therefore
E[1{VT>KeJ}] = N(− log(L0) + (r − δ − 1
2σ2)T − η√
σ2T + ς2
)
= N(− log(L0) + ([r − δ − η
T + 12ς2
T ]− 12 [σ
2 + ς2
T ])T√
[σ2 + ς2
T ]T
)
(32)
where N is the normal cumulative distribution function. Overall, this implies that the price of the zero
coupon bond, w(T ) is
w(T ) = vM (T )P (τ > T ) + e−rT[
α+ (1− α)E[1{VT >KeJ}]][
1− P (τ > T )]
where
vM (T ) = e−rT[
α+ (1− α)N(− log(L0) + (r − δ − 1
2σ2)T√
σ2T
)
]
(33)
is the price of a zero coupon bond in the standard Merton model without LBO risk.
C.2 A model with stationary leverage ratios and LBO risk
Assume as in Collin-Dufresne and Goldstein (2001) that the firm targets a long-run leverage ratio and
that the dynamics of the log of the amount of debt, kt, are given by
dkt = φ(ν − (kt − yt))dt. (34)
If we define log-leverage as lt = kt − yt, then the intuition is that if lt is less than ν, the firm increases
the amount of debt and vice versa, i.e. log-leverage is stationary around a mean leverage of ν. This
specification captures the idea that the firm tends to issue more debt when leverage is low and tends to
retire debt when leverage is high. Ito’s Lemma gives that
dlt = φ(l − lt)dt− σdW Vt (35)
where l =−r+δ+ 1
2σ2
φ + ν. We assume that all debt has equal priority and matures at time T , i.e. if the
firm issues more debt, it issues more debt with the same maturity and seniority as existing debt. The
38

firm can only default at bond maturity T and it does so if firm value is below the face value of all debt
KT . If the firm defaults, bondholders receive a fraction α of the face value of debt.
As in the previous section, we assume that the firm can potentially undergo an LBO that occurs at
time τ , in which case the firm issues more debt (with same maturity and seniority as existing debt).
To capture that leverage jumps after the LBO and that the target leverage is higher after an LBO,
we assume that the total amount of debt immediately after the LBO is KτeJ where J is normally
distributed with mean η and standard deviation ς, while the target log-leverage after the LBO changes
from ν to ν+J . We assume that the LBO event follows a Cox process with intensity λt where λt follows
a CIR process,
dλt = κ(θ − λt)dt+ ξ√
λtdWλt . (36)
and that there is no risk premium associated with LBO risk. If we are at time 0 and define the expected
payoff at maturity T of the risky zero coupon bond as w(T ) we have that
w(T ) = E[α+ (1− α)1{lT>0}|τ > T ]P (τ > T ) + E[α+ (1− α)1{lT>0}|τ ≤ T ]P (τ ≤ T ) (37)
where P (τ > T ) is given in equations (26)-(30).
In the event of no LBO (τ > T ), we have that the dynamics of lt given in equation (35) are
an Ornstein-Uhlenbeck process, and it is well-known that the conditional distribution lt|l0, τ > T is
normally distributed with mean l + (l0 − l)e−φt and variance σ2
2φ(1− e−2φt). This implies that
E[1{lT>0}|τ > T ] = N( l + (l0 − l)e−φT
√
σ2
2φ (1− e−2φT )
)
. (38)
It is useful to define the lLBOt as the leverage process in case of an LBO at time τ and lt as the leverage
process if no LBO happens before T . Then lLBOt = lt when t < τ and lLBO
τ = lτ + J . Because the new
target log-leverage is ν + J , the dynamics of log-debt immediately after the LBO are
dkLBOτ = φ(ν + J − lLBO
τ )dt = φ(ν + J − (lτ + J))dt = φ(ν − lτ )dt, (39)
and we see that kLBO and k have the same rate of change at all times except when leverage jumps at
τ . Since asset value is not affected by an LBO, lLBO and l have the same rate of change at all times
except at τ , so lLBOt = lt + J for any t > τ . Thus, the conditional distribution lt|l0, τ ≤ T is normally
39

distributed with mean l + (l0 − l)e−φt + η and variance σ2
2φ(1− e−2φt) + ς2. Overall, this implies that
E[1{lT>0}|τ ≤ T ] = N( l + (l0 − l)e−φT + η√
σ2
2φ(1− e−2φT ) + ς2
)
. (40)
40
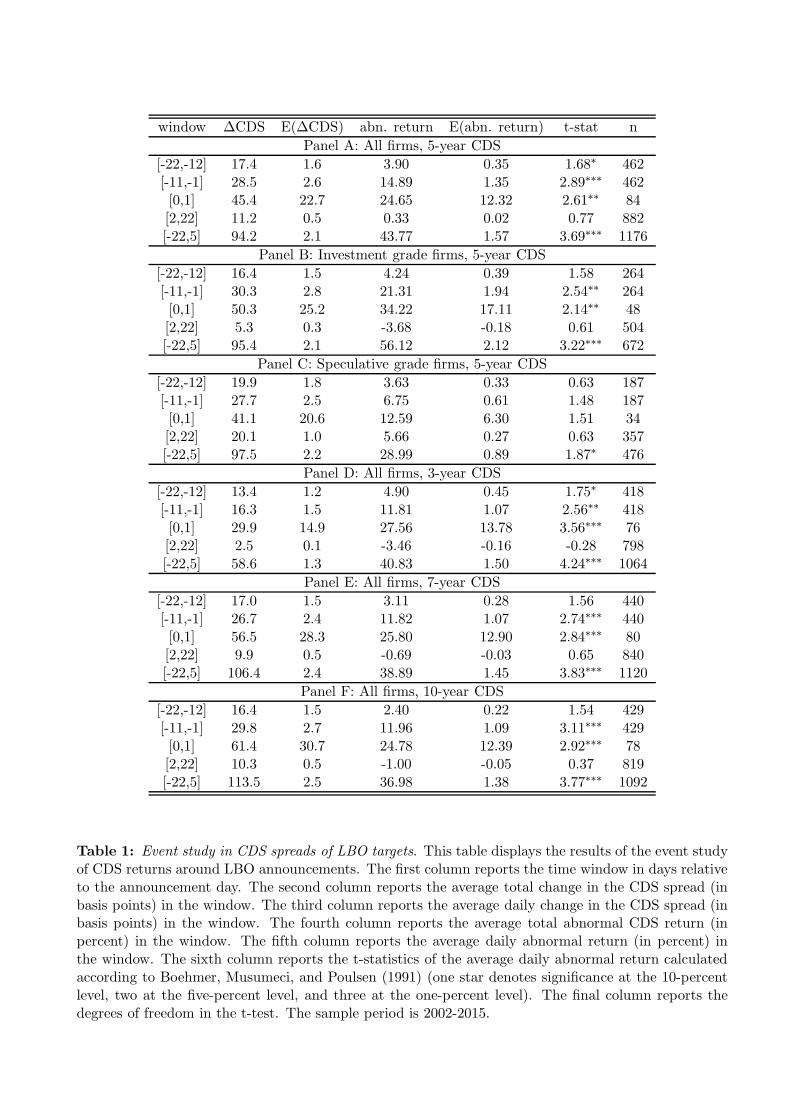
window ∆CDS E(∆CDS) abn. return E(abn. return) t-stat n
Panel A: All firms, 5-year CDS
[-22,-12] 17.4 1.6 3.90 0.35 1.68∗ 462[-11,-1] 28.5 2.6 14.89 1.35 2.89∗∗∗ 462[0,1] 45.4 22.7 24.65 12.32 2.61∗∗ 84[2,22] 11.2 0.5 0.33 0.02 0.77 882[-22,5] 94.2 2.1 43.77 1.57 3.69∗∗∗ 1176
Panel B: Investment grade firms, 5-year CDS
[-22,-12] 16.4 1.5 4.24 0.39 1.58 264[-11,-1] 30.3 2.8 21.31 1.94 2.54∗∗ 264[0,1] 50.3 25.2 34.22 17.11 2.14∗∗ 48[2,22] 5.3 0.3 -3.68 -0.18 0.61 504[-22,5] 95.4 2.1 56.12 2.12 3.22∗∗∗ 672
Panel C: Speculative grade firms, 5-year CDS
[-22,-12] 19.9 1.8 3.63 0.33 0.63 187[-11,-1] 27.7 2.5 6.75 0.61 1.48 187[0,1] 41.1 20.6 12.59 6.30 1.51 34[2,22] 20.1 1.0 5.66 0.27 0.63 357[-22,5] 97.5 2.2 28.99 0.89 1.87∗ 476
Panel D: All firms, 3-year CDS
[-22,-12] 13.4 1.2 4.90 0.45 1.75∗ 418[-11,-1] 16.3 1.5 11.81 1.07 2.56∗∗ 418[0,1] 29.9 14.9 27.56 13.78 3.56∗∗∗ 76[2,22] 2.5 0.1 -3.46 -0.16 -0.28 798[-22,5] 58.6 1.3 40.83 1.50 4.24∗∗∗ 1064
Panel E: All firms, 7-year CDS
[-22,-12] 17.0 1.5 3.11 0.28 1.56 440[-11,-1] 26.7 2.4 11.82 1.07 2.74∗∗∗ 440[0,1] 56.5 28.3 25.80 12.90 2.84∗∗∗ 80[2,22] 9.9 0.5 -0.69 -0.03 0.65 840[-22,5] 106.4 2.4 38.89 1.45 3.83∗∗∗ 1120
Panel F: All firms, 10-year CDS
[-22,-12] 16.4 1.5 2.40 0.22 1.54 429[-11,-1] 29.8 2.7 11.96 1.09 3.11∗∗∗ 429[0,1] 61.4 30.7 24.78 12.39 2.92∗∗∗ 78[2,22] 10.3 0.5 -1.00 -0.05 0.37 819[-22,5] 113.5 2.5 36.98 1.38 3.77∗∗∗ 1092
Table 1: Event study in CDS spreads of LBO targets. This table displays the results of the event studyof CDS returns around LBO announcements. The first column reports the time window in days relativeto the announcement day. The second column reports the average total change in the CDS spread (inbasis points) in the window. The third column reports the average daily change in the CDS spread (inbasis points) in the window. The fourth column reports the average total abnormal CDS return (inpercent) in the window. The fifth column reports the average daily abnormal return (in percent) inthe window. The sixth column reports the t-statistics of the average daily abnormal return calculatedaccording to Boehmer, Musumeci, and Poulsen (1991) (one star denotes significance at the 10-percentlevel, two at the five-percent level, and three at the one-percent level). The final column reports thedegrees of freedom in the t-test. The sample period is 2002-2015.
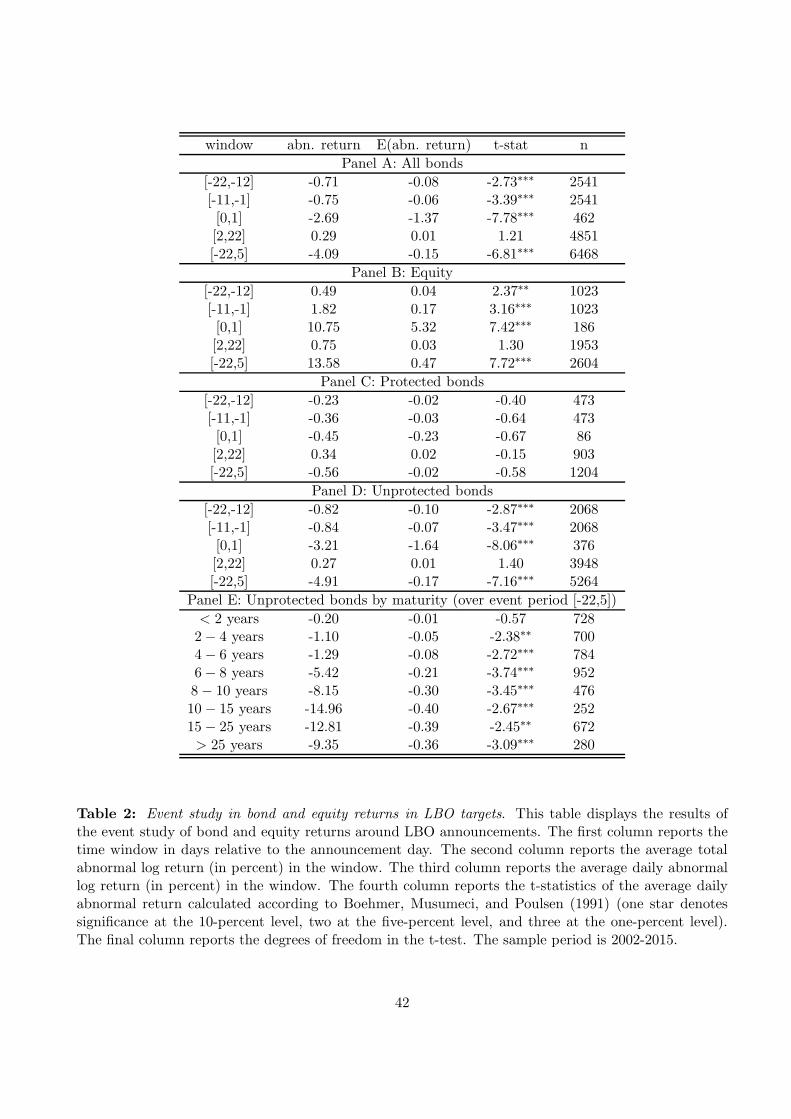
window abn. return E(abn. return) t-stat n
Panel A: All bonds
[-22,-12] -0.71 -0.08 -2.73∗∗∗ 2541[-11,-1] -0.75 -0.06 -3.39∗∗∗ 2541[0,1] -2.69 -1.37 -7.78∗∗∗ 462[2,22] 0.29 0.01 1.21 4851[-22,5] -4.09 -0.15 -6.81∗∗∗ 6468
Panel B: Equity
[-22,-12] 0.49 0.04 2.37∗∗ 1023[-11,-1] 1.82 0.17 3.16∗∗∗ 1023[0,1] 10.75 5.32 7.42∗∗∗ 186[2,22] 0.75 0.03 1.30 1953[-22,5] 13.58 0.47 7.72∗∗∗ 2604
Panel C: Protected bonds
[-22,-12] -0.23 -0.02 -0.40 473[-11,-1] -0.36 -0.03 -0.64 473[0,1] -0.45 -0.23 -0.67 86[2,22] 0.34 0.02 -0.15 903[-22,5] -0.56 -0.02 -0.58 1204
Panel D: Unprotected bonds
[-22,-12] -0.82 -0.10 -2.87∗∗∗ 2068[-11,-1] -0.84 -0.07 -3.47∗∗∗ 2068[0,1] -3.21 -1.64 -8.06∗∗∗ 376[2,22] 0.27 0.01 1.40 3948[-22,5] -4.91 -0.17 -7.16∗∗∗ 5264
Panel E: Unprotected bonds by maturity (over event period [-22,5])
< 2 years -0.20 -0.01 -0.57 7282− 4 years -1.10 -0.05 -2.38∗∗ 7004− 6 years -1.29 -0.08 -2.72∗∗∗ 7846− 8 years -5.42 -0.21 -3.74∗∗∗ 9528− 10 years -8.15 -0.30 -3.45∗∗∗ 47610− 15 years -14.96 -0.40 -2.67∗∗∗ 25215− 25 years -12.81 -0.39 -2.45∗∗ 672> 25 years -9.35 -0.36 -3.09∗∗∗ 280
Table 2: Event study in bond and equity returns in LBO targets. This table displays the results ofthe event study of bond and equity returns around LBO announcements. The first column reports thetime window in days relative to the announcement day. The second column reports the average totalabnormal log return (in percent) in the window. The third column reports the average daily abnormallog return (in percent) in the window. The fourth column reports the t-statistics of the average dailyabnormal return calculated according to Boehmer, Musumeci, and Poulsen (1991) (one star denotessignificance at the 10-percent level, two at the five-percent level, and three at the one-percent level).The final column reports the degrees of freedom in the t-test. The sample period is 2002-2015.
42

2001-2014 equity vol leverage ROA
dep. var: log(5y CDS spread) high low high low high low
pLBO 0.3955∗∗(0.1873)
0.1374(0.2883)
0.9534∗∗∗(0.3056)
0.0386(0.2090)
0.7185(0.5112)
0.8190∗∗(0.3802)
0.0004(0.1600)
leverage 2.2207∗∗∗(0.2066)
2.3635∗∗∗(0.2786)
1.8610∗∗∗(0.2677)
1.7951∗∗∗(0.2026)
1.3084∗∗(0.5296)
2.1050∗∗∗(0.2104)
2.0243∗∗∗(0.2659)
equity volatility 1.3057∗∗∗(0.1550)
0.8548∗∗∗(0.1817)
2.5804∗∗∗(0.4248)
0.8694∗∗∗(0.1157)
1.7507∗∗∗(0.3744)
1.0273∗∗∗(0.1768)
1.5262∗∗∗(0.1984)
distance-to-default 0.0561∗∗∗(0.0202)
0.0487∗∗∗(0.0215)
0.0086(0.0069)
0.1104∗∗∗(0.0124)
0.0286∗∗∗(0.0094)
0.0658∗∗∗(0.0096)
0.0261∗∗∗(0.0067)
ROA 0.0375(0.6127)
−0.3451(0.6943)
−1.1087∗∗(0.5177)
−1.2032∗∗(0.3093)
−0.2014(0.9803)
0.0755(0.5169)
−1.9180∗∗∗(0.4753)
number of observations 15655 7695 7960 7807 7848 7827 7828R2 0.76 0.73 0.70 0.79 0.66 0.77 0.79
Table 3: Pricing of LBO risk in CDS spreads. This table presents results of regressing credit spreads of US firms from 2001-2014on annual industry probability of LBO and firm-level controls. The dependent variable is log(5y CDS spread), using annual closingspread per firm (quoted in percentages). pLBO is the industry probability of LBO and is computed per year as 0.1624 times the ratioof: 1. number of industry firms that were targets of LBO (according to Thomson Financial LBO announcements) to 2. number ofindustry firms (as reported in Compustat). Industry is determined at the 3-digit SIC level, where SIC is as reported in Compustat.Leverage is long-term + short-term debt to total assets, equity volatility is the annualized standard deviation of monthly equity returnsin the previous 36 months, distance-to-default is log leverage to equity volatility, ROA is EBITDA to total assets. The first columnreports regression results for the entire sample of CDS contracts. The following columns report results where the sample is split intotwo samples above or below (or equal to) the median equity volatility, leverage, and ROA. Specifically, for each year in the sampleobservations are split according to the median value. Regression is run with year, restructuring clause and 4-digit SIC fixed effects.Standard errors are clustered at the firm level. ***,** and * indicate significance at the 1%, 5%, and 10% levels, respectively.
43
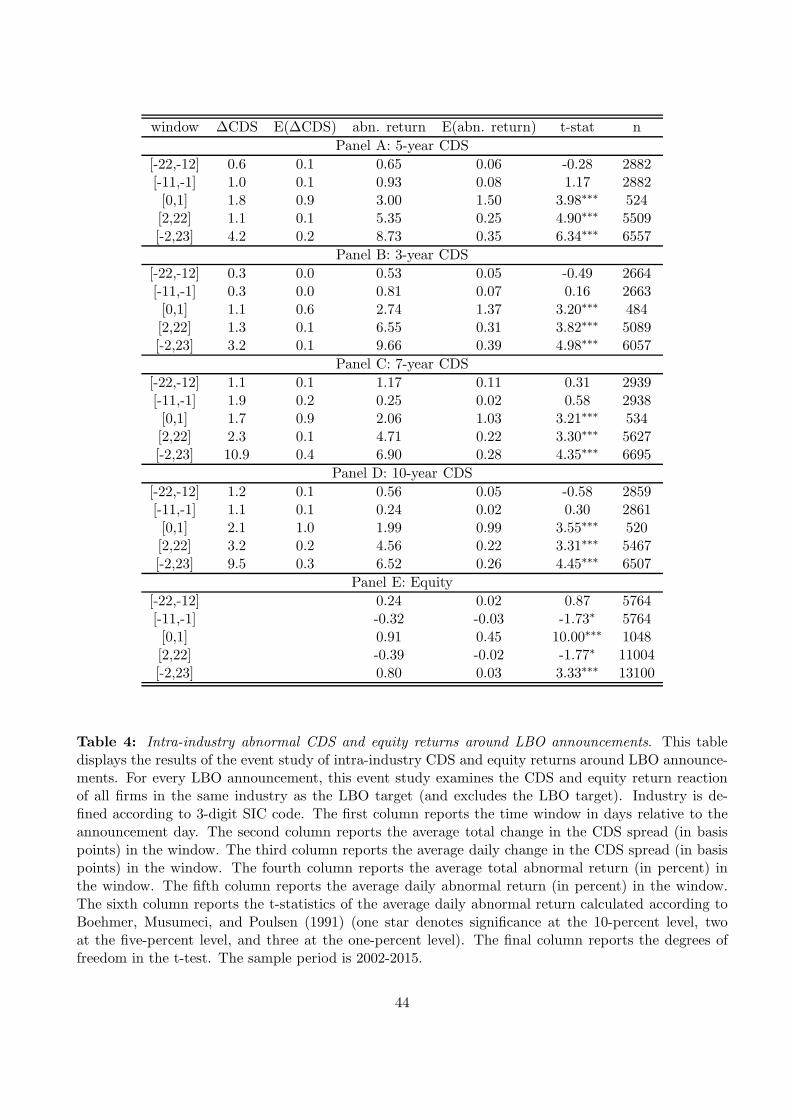
window ∆CDS E(∆CDS) abn. return E(abn. return) t-stat n
Panel A: 5-year CDS
[-22,-12] 0.6 0.1 0.65 0.06 -0.28 2882[-11,-1] 1.0 0.1 0.93 0.08 1.17 2882[0,1] 1.8 0.9 3.00 1.50 3.98∗∗∗ 524[2,22] 1.1 0.1 5.35 0.25 4.90∗∗∗ 5509[-2,23] 4.2 0.2 8.73 0.35 6.34∗∗∗ 6557
Panel B: 3-year CDS
[-22,-12] 0.3 0.0 0.53 0.05 -0.49 2664[-11,-1] 0.3 0.0 0.81 0.07 0.16 2663[0,1] 1.1 0.6 2.74 1.37 3.20∗∗∗ 484[2,22] 1.3 0.1 6.55 0.31 3.82∗∗∗ 5089[-2,23] 3.2 0.1 9.66 0.39 4.98∗∗∗ 6057
Panel C: 7-year CDS
[-22,-12] 1.1 0.1 1.17 0.11 0.31 2939[-11,-1] 1.9 0.2 0.25 0.02 0.58 2938[0,1] 1.7 0.9 2.06 1.03 3.21∗∗∗ 534[2,22] 2.3 0.1 4.71 0.22 3.30∗∗∗ 5627[-2,23] 10.9 0.4 6.90 0.28 4.35∗∗∗ 6695
Panel D: 10-year CDS
[-22,-12] 1.2 0.1 0.56 0.05 -0.58 2859[-11,-1] 1.1 0.1 0.24 0.02 0.30 2861[0,1] 2.1 1.0 1.99 0.99 3.55∗∗∗ 520[2,22] 3.2 0.2 4.56 0.22 3.31∗∗∗ 5467[-2,23] 9.5 0.3 6.52 0.26 4.45∗∗∗ 6507
Panel E: Equity
[-22,-12] 0.24 0.02 0.87 5764[-11,-1] -0.32 -0.03 -1.73∗ 5764[0,1] 0.91 0.45 10.00∗∗∗ 1048[2,22] -0.39 -0.02 -1.77∗ 11004[-2,23] 0.80 0.03 3.33∗∗∗ 13100
Table 4: Intra-industry abnormal CDS and equity returns around LBO announcements. This tabledisplays the results of the event study of intra-industry CDS and equity returns around LBO announce-ments. For every LBO announcement, this event study examines the CDS and equity return reactionof all firms in the same industry as the LBO target (and excludes the LBO target). Industry is de-fined according to 3-digit SIC code. The first column reports the time window in days relative to theannouncement day. The second column reports the average total change in the CDS spread (in basispoints) in the window. The third column reports the average daily change in the CDS spread (in basispoints) in the window. The fourth column reports the average total abnormal return (in percent) inthe window. The fifth column reports the average daily abnormal return (in percent) in the window.The sixth column reports the t-statistics of the average daily abnormal return calculated according toBoehmer, Musumeci, and Poulsen (1991) (one star denotes significance at the 10-percent level, twoat the five-percent level, and three at the one-percent level). The final column reports the degrees offreedom in the t-test. The sample period is 2002-2015.
44
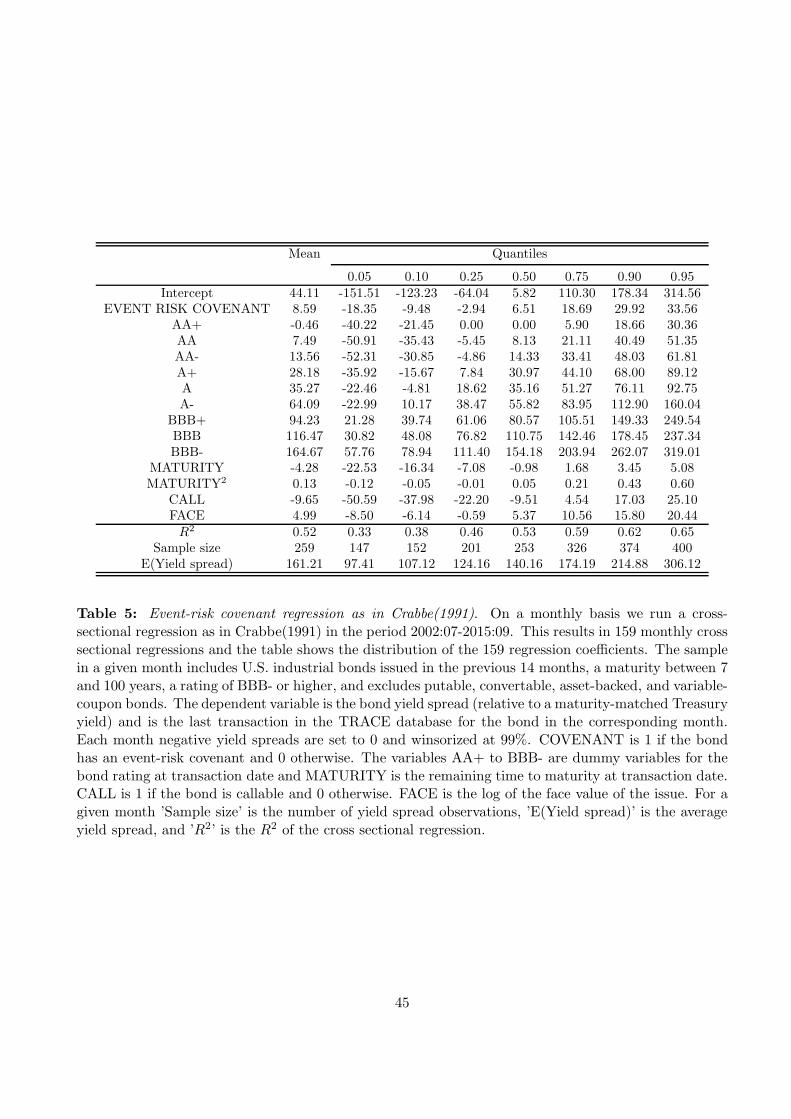
Mean Quantiles
0.05 0.10 0.25 0.50 0.75 0.90 0.95Intercept 44.11 -151.51 -123.23 -64.04 5.82 110.30 178.34 314.56
EVENT RISK COVENANT 8.59 -18.35 -9.48 -2.94 6.51 18.69 29.92 33.56AA+ -0.46 -40.22 -21.45 0.00 0.00 5.90 18.66 30.36AA 7.49 -50.91 -35.43 -5.45 8.13 21.11 40.49 51.35AA- 13.56 -52.31 -30.85 -4.86 14.33 33.41 48.03 61.81A+ 28.18 -35.92 -15.67 7.84 30.97 44.10 68.00 89.12A 35.27 -22.46 -4.81 18.62 35.16 51.27 76.11 92.75A- 64.09 -22.99 10.17 38.47 55.82 83.95 112.90 160.04
BBB+ 94.23 21.28 39.74 61.06 80.57 105.51 149.33 249.54BBB 116.47 30.82 48.08 76.82 110.75 142.46 178.45 237.34BBB- 164.67 57.76 78.94 111.40 154.18 203.94 262.07 319.01
MATURITY -4.28 -22.53 -16.34 -7.08 -0.98 1.68 3.45 5.08MATURITY2 0.13 -0.12 -0.05 -0.01 0.05 0.21 0.43 0.60
CALL -9.65 -50.59 -37.98 -22.20 -9.51 4.54 17.03 25.10FACE 4.99 -8.50 -6.14 -0.59 5.37 10.56 15.80 20.44R2 0.52 0.33 0.38 0.46 0.53 0.59 0.62 0.65
Sample size 259 147 152 201 253 326 374 400E(Yield spread) 161.21 97.41 107.12 124.16 140.16 174.19 214.88 306.12
Table 5: Event-risk covenant regression as in Crabbe(1991). On a monthly basis we run a cross-sectional regression as in Crabbe(1991) in the period 2002:07-2015:09. This results in 159 monthly crosssectional regressions and the table shows the distribution of the 159 regression coefficients. The samplein a given month includes U.S. industrial bonds issued in the previous 14 months, a maturity between 7and 100 years, a rating of BBB- or higher, and excludes putable, convertable, asset-backed, and variable-coupon bonds. The dependent variable is the bond yield spread (relative to a maturity-matched Treasuryyield) and is the last transaction in the TRACE database for the bond in the corresponding month.Each month negative yield spreads are set to 0 and winsorized at 99%. COVENANT is 1 if the bondhas an event-risk covenant and 0 otherwise. The variables AA+ to BBB- are dummy variables for thebond rating at transaction date and MATURITY is the remaining time to maturity at transaction date.CALL is 1 if the bond is callable and 0 otherwise. FACE is the log of the face value of the issue. For agiven month ’Sample size’ is the number of yield spread observations, ’E(Yield spread)’ is the averageyield spread, and ’R2’ is the R2 of the cross sectional regression.
45
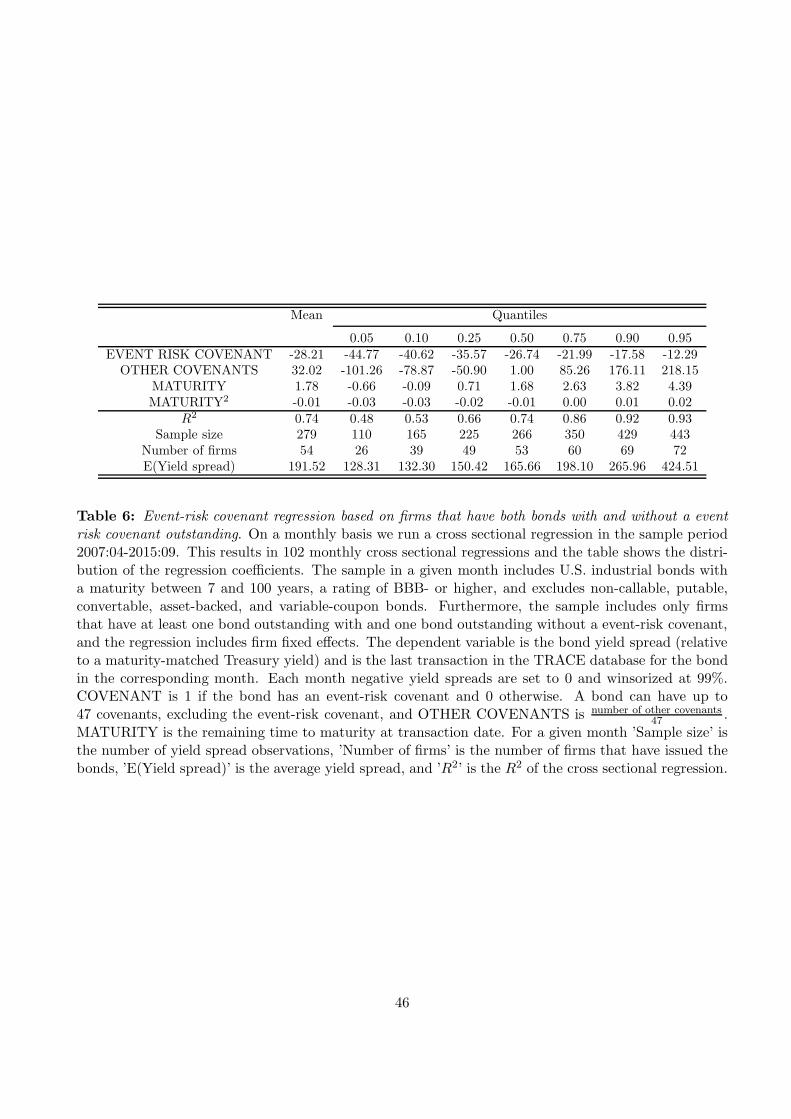
Mean Quantiles
0.05 0.10 0.25 0.50 0.75 0.90 0.95EVENT RISK COVENANT -28.21 -44.77 -40.62 -35.57 -26.74 -21.99 -17.58 -12.29
OTHER COVENANTS 32.02 -101.26 -78.87 -50.90 1.00 85.26 176.11 218.15MATURITY 1.78 -0.66 -0.09 0.71 1.68 2.63 3.82 4.39MATURITY2 -0.01 -0.03 -0.03 -0.02 -0.01 0.00 0.01 0.02
R2 0.74 0.48 0.53 0.66 0.74 0.86 0.92 0.93Sample size 279 110 165 225 266 350 429 443
Number of firms 54 26 39 49 53 60 69 72E(Yield spread) 191.52 128.31 132.30 150.42 165.66 198.10 265.96 424.51
Table 6: Event-risk covenant regression based on firms that have both bonds with and without a eventrisk covenant outstanding. On a monthly basis we run a cross sectional regression in the sample period2007:04-2015:09. This results in 102 monthly cross sectional regressions and the table shows the distri-bution of the regression coefficients. The sample in a given month includes U.S. industrial bonds witha maturity between 7 and 100 years, a rating of BBB- or higher, and excludes non-callable, putable,convertable, asset-backed, and variable-coupon bonds. Furthermore, the sample includes only firmsthat have at least one bond outstanding with and one bond outstanding without a event-risk covenant,and the regression includes firm fixed effects. The dependent variable is the bond yield spread (relativeto a maturity-matched Treasury yield) and is the last transaction in the TRACE database for the bondin the corresponding month. Each month negative yield spreads are set to 0 and winsorized at 99%.COVENANT is 1 if the bond has an event-risk covenant and 0 otherwise. A bond can have up to47 covenants, excluding the event-risk covenant, and OTHER COVENANTS is number of other covenants
47 .MATURITY is the remaining time to maturity at transaction date. For a given month ’Sample size’ isthe number of yield spread observations, ’Number of firms’ is the number of firms that have issued thebonds, ’E(Yield spread)’ is the average yield spread, and ’R2’ is the R2 of the cross sectional regression.
46
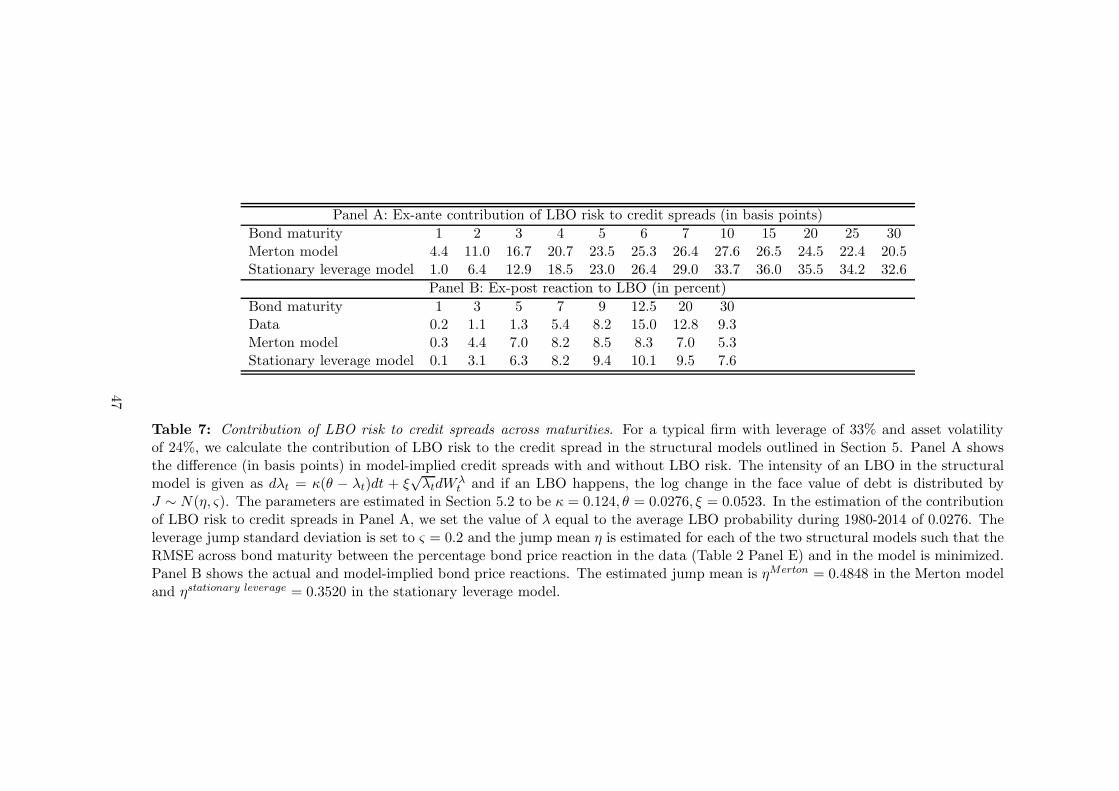
Panel A: Ex-ante contribution of LBO risk to credit spreads (in basis points)
Bond maturity 1 2 3 4 5 6 7 10 15 20 25 30Merton model 4.4 11.0 16.7 20.7 23.5 25.3 26.4 27.6 26.5 24.5 22.4 20.5Stationary leverage model 1.0 6.4 12.9 18.5 23.0 26.4 29.0 33.7 36.0 35.5 34.2 32.6
Panel B: Ex-post reaction to LBO (in percent)
Bond maturity 1 3 5 7 9 12.5 20 30Data 0.2 1.1 1.3 5.4 8.2 15.0 12.8 9.3Merton model 0.3 4.4 7.0 8.2 8.5 8.3 7.0 5.3Stationary leverage model 0.1 3.1 6.3 8.2 9.4 10.1 9.5 7.6
Table 7: Contribution of LBO risk to credit spreads across maturities. For a typical firm with leverage of 33% and asset volatilityof 24%, we calculate the contribution of LBO risk to the credit spread in the structural models outlined in Section 5. Panel A showsthe difference (in basis points) in model-implied credit spreads with and without LBO risk. The intensity of an LBO in the structuralmodel is given as dλt = κ(θ − λt)dt + ξ
√λtdW
λt and if an LBO happens, the log change in the face value of debt is distributed by
J ∼ N(η, ς). The parameters are estimated in Section 5.2 to be κ = 0.124, θ = 0.0276, ξ = 0.0523. In the estimation of the contributionof LBO risk to credit spreads in Panel A, we set the value of λ equal to the average LBO probability during 1980-2014 of 0.0276. Theleverage jump standard deviation is set to ς = 0.2 and the jump mean η is estimated for each of the two structural models such that theRMSE across bond maturity between the percentage bond price reaction in the data (Table 2 Panel E) and in the model is minimized.Panel B shows the actual and model-implied bond price reactions. The estimated jump mean is ηMerton = 0.4848 in the Merton modeland ηstationary leverage = 0.3520 in the stationary leverage model.
47
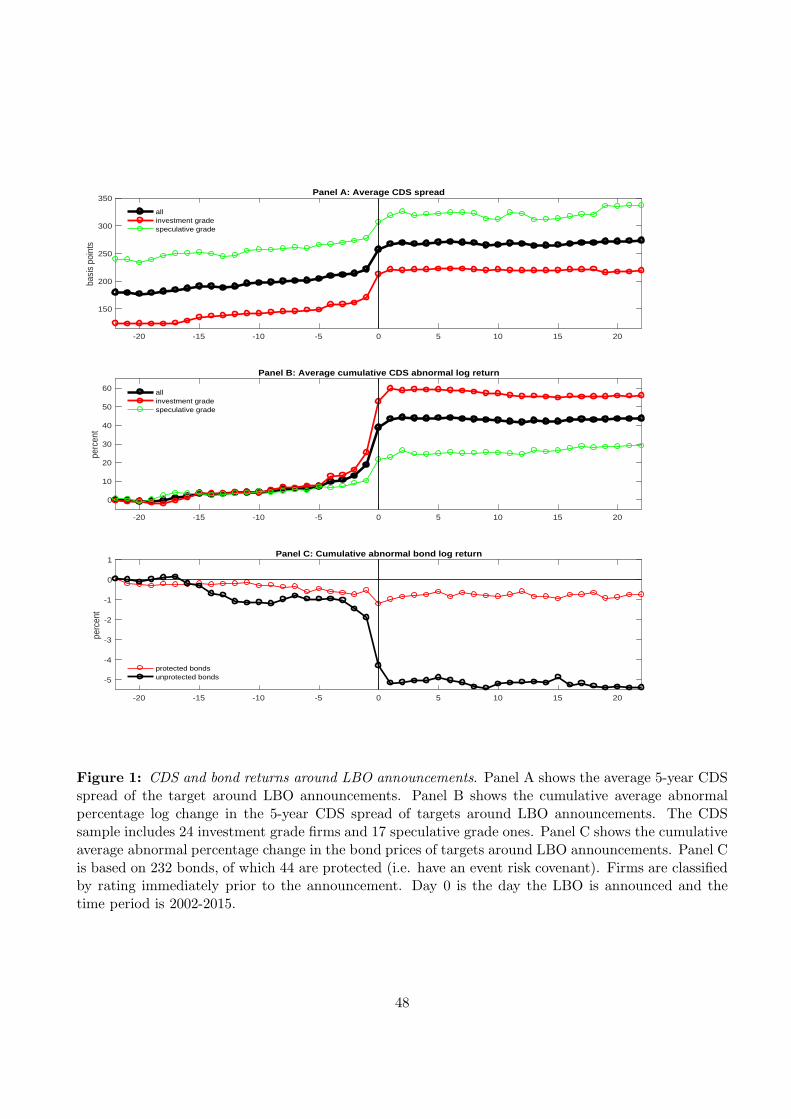
-20 -15 -10 -5 0 5 10 15 20
150
200
250
300
350
basi
s po
ints
Panel A: Average CDS spread
allinvestment gradespeculative grade
-20 -15 -10 -5 0 5 10 15 20
0
10
20
30
40
50
60
perc
ent
Panel B: Average cumulative CDS abnormal log return
allinvestment gradespeculative grade
-20 -15 -10 -5 0 5 10 15 20
-5
-4
-3
-2
-1
0
1
perc
ent
Panel C: Cumulative abnormal bond log return
protected bondsunprotected bonds
Figure 1: CDS and bond returns around LBO announcements. Panel A shows the average 5-year CDSspread of the target around LBO announcements. Panel B shows the cumulative average abnormalpercentage log change in the 5-year CDS spread of targets around LBO announcements. The CDSsample includes 24 investment grade firms and 17 speculative grade ones. Panel C shows the cumulativeaverage abnormal percentage change in the bond prices of targets around LBO announcements. Panel Cis based on 232 bonds, of which 44 are protected (i.e. have an event risk covenant). Firms are classifiedby rating immediately prior to the announcement. Day 0 is the day the LBO is announced and thetime period is 2002-2015.
48
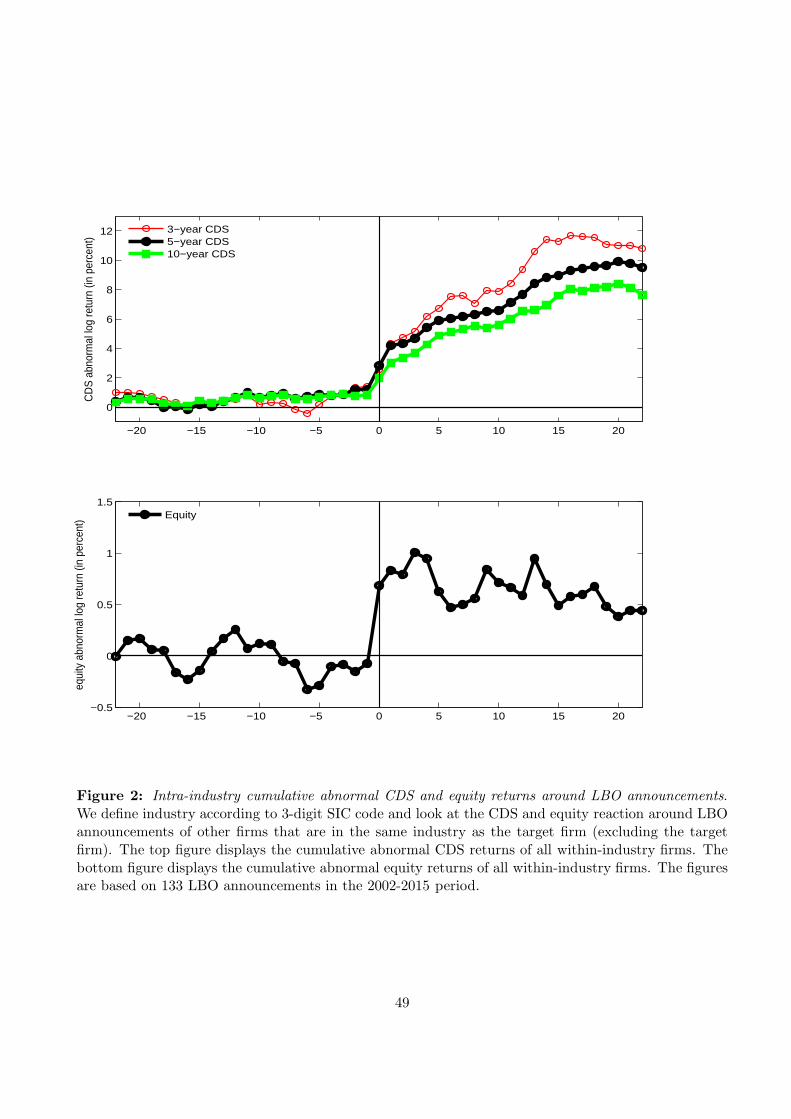
−20 −15 −10 −5 0 5 10 15 20
0
2
4
6
8
10
12
CD
S a
bnor
mal
log
retu
rn (i
n pe
rcen
t)
3−year CDS5−year CDS10−year CDS
−20 −15 −10 −5 0 5 10 15 20−0.5
0
0.5
1
1.5
equi
ty a
bnor
mal
log
retu
rn (i
n pe
rcen
t)
Equity
Figure 2: Intra-industry cumulative abnormal CDS and equity returns around LBO announcements.We define industry according to 3-digit SIC code and look at the CDS and equity reaction around LBOannouncements of other firms that are in the same industry as the target firm (excluding the targetfirm). The top figure displays the cumulative abnormal CDS returns of all within-industry firms. Thebottom figure displays the cumulative abnormal equity returns of all within-industry firms. The figuresare based on 133 LBO announcements in the 2002-2015 period.
49
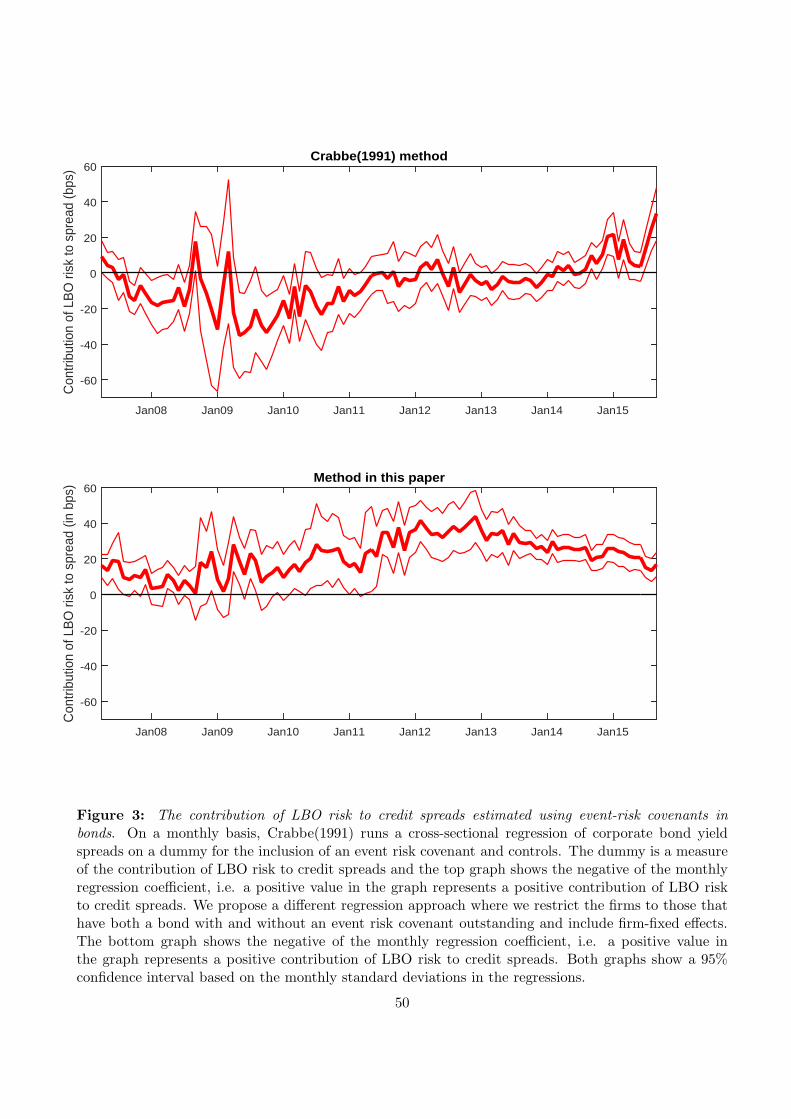
Jan08 Jan09 Jan10 Jan11 Jan12 Jan13 Jan14 Jan15
Con
trib
utio
n of
LB
O r
isk
to s
prea
d (b
ps)
-60
-40
-20
0
20
40
60Crabbe(1991) method
Jan08 Jan09 Jan10 Jan11 Jan12 Jan13 Jan14 Jan15
Con
trib
utio
n of
LB
O r
isk
to s
prea
d (in
bps
)
-60
-40
-20
0
20
40
60Method in this paper
Figure 3: The contribution of LBO risk to credit spreads estimated using event-risk covenants inbonds. On a monthly basis, Crabbe(1991) runs a cross-sectional regression of corporate bond yieldspreads on a dummy for the inclusion of an event risk covenant and controls. The dummy is a measureof the contribution of LBO risk to credit spreads and the top graph shows the negative of the monthlyregression coefficient, i.e. a positive value in the graph represents a positive contribution of LBO riskto credit spreads. We propose a different regression approach where we restrict the firms to those thathave both a bond with and without an event risk covenant outstanding and include firm-fixed effects.The bottom graph shows the negative of the monthly regression coefficient, i.e. a positive value inthe graph represents a positive contribution of LBO risk to credit spreads. Both graphs show a 95%confidence interval based on the monthly standard deviations in the regressions.
50
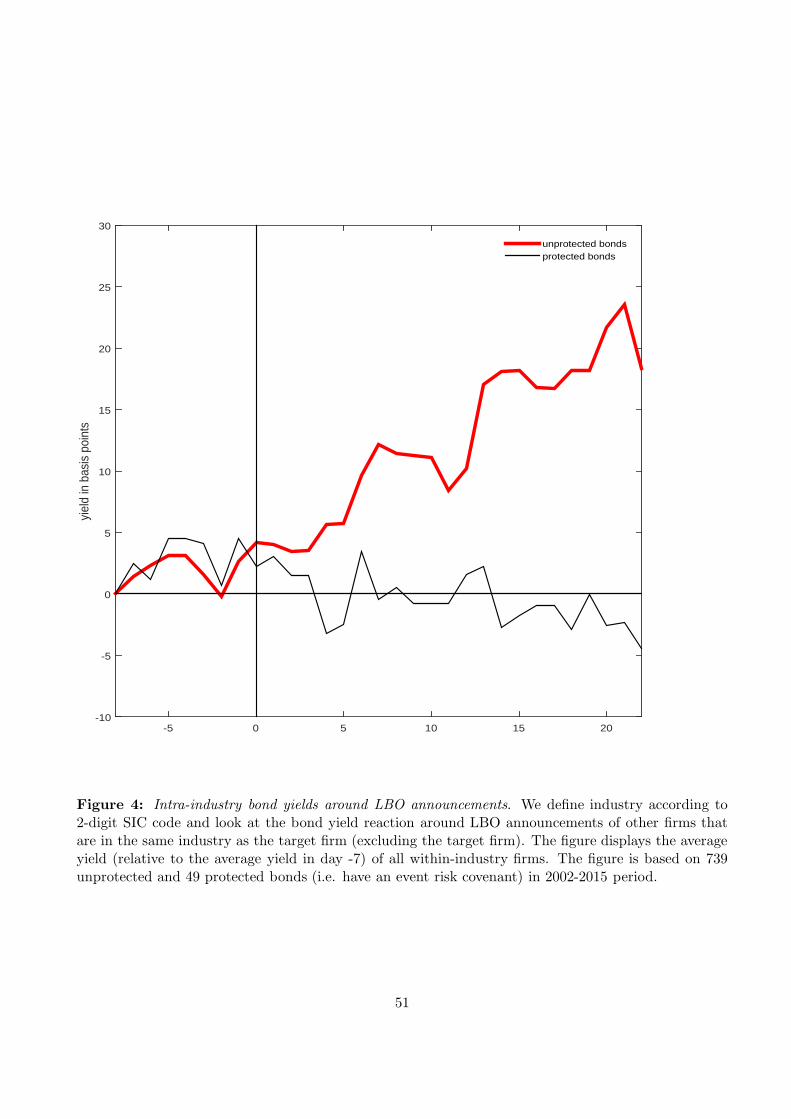
-5 0 5 10 15 20
yiel
d in
bas
is p
oint
s
-10
-5
0
5
10
15
20
25
30
unprotected bondsprotected bonds
Figure 4: Intra-industry bond yields around LBO announcements. We define industry according to2-digit SIC code and look at the bond yield reaction around LBO announcements of other firms thatare in the same industry as the target firm (excluding the target firm). The figure displays the averageyield (relative to the average yield in day -7) of all within-industry firms. The figure is based on 739unprotected and 49 protected bonds (i.e. have an event risk covenant) in 2002-2015 period.
51
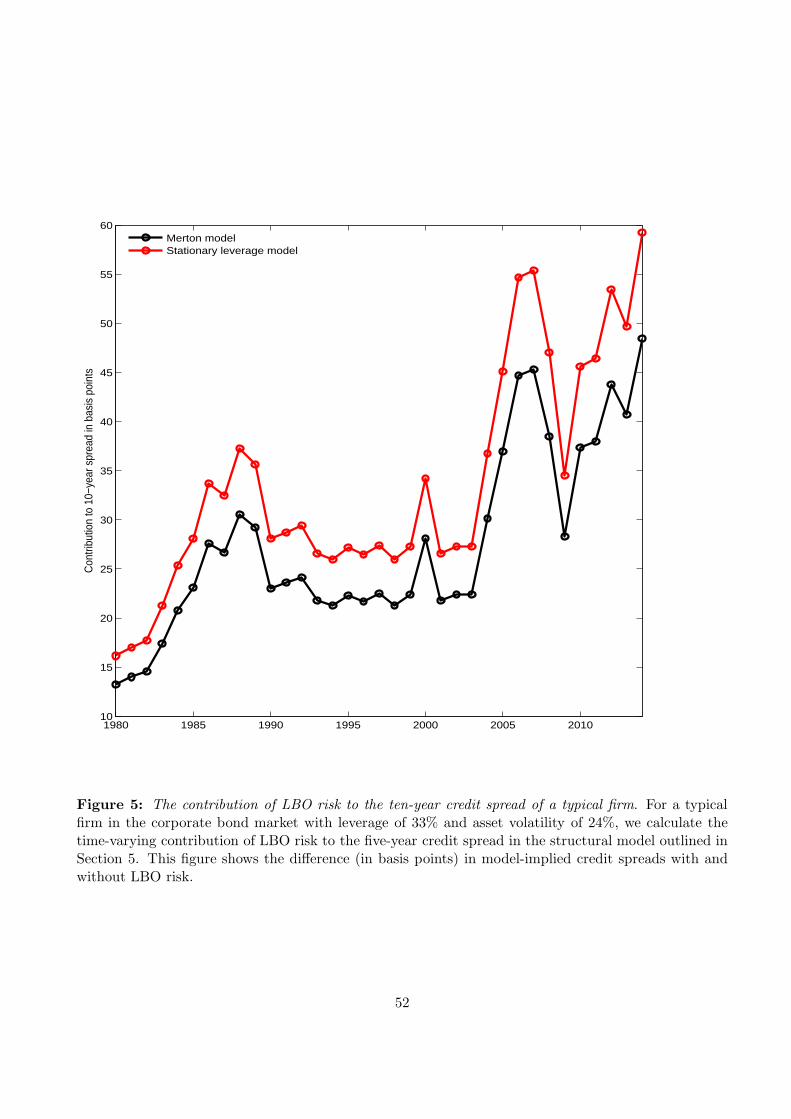
1980 1985 1990 1995 2000 2005 201010
15
20
25
30
35
40
45
50
55
60
Con
tribu
tion
to 1
0−ye
ar s
prea
d in
bas
is p
oint
s
Merton modelStationary leverage model
Figure 5: The contribution of LBO risk to the ten-year credit spread of a typical firm. For a typicalfirm in the corporate bond market with leverage of 33% and asset volatility of 24%, we calculate thetime-varying contribution of LBO risk to the five-year credit spread in the structural model outlined inSection 5. This figure shows the difference (in basis points) in model-implied credit spreads with andwithout LBO risk.
52