
LEVERAGE EFFECT AND CAPITAL MARKET VOLATILITY – …
11
Indian Journal of Finance and Economics Vol. 2, No. 1, 2021 : pp. 15-25 © ARF India. All Right Reserved URL : www.arfjournals.com ARF INDIA Academic Open Access Publishing www. arfjournals. com To cite this article: Maheen Muhammad Sali & Ajmi Nazar (2021). Leverage Effect and Capital Market Volatility– Evidence from Indian Equity Market. Indian Journal of Finance and Economics, Vol. 2, No. 1, pp. 15-25 LEVERAGE EFFECT AND CAPITAL MARKET VOLATILITY – EVIDENCE FROM INDIAN EQUITY MARKET Maheen Muhammad Sali 1,2 & Ajmi Nazar 3 1 TKM College of Arts and Science, Kollam -5 Kerala, India; E-mail: [email protected] 2 University of Kerala, Trivandrum, Kerala India 3 Cochin University of Science and Technology (CUSAT), Eranakulam, Kerala, India Received : 14 December 2020; Revised : 21 December 2020; Accepted : 6 January 2021; Published : 3 May 2021 Abstract: Efficient market theory states that the market responds to the negative and positive shocks symmetrically. In reality, the market exhibit asymmetric response to the negative shocks over the positive shocks, this is called information asymmetry. The concept of leverage effects states that market is highly volatile during the arrival of negative shocks than the positive shocks. The standard GARCH model failed to capture leverage effect into its variance equation. This has been done by incorporating longer memory process into the variance equation of the EGARCH and TGARCH models. The paper focused on identifying the leverage effect in Indian stock market by studying the volatility of selected indices for a period of 6 years. The results accept the presence of information asymmetry and the models were failed in some extent to identify the presence of a strong leverage effect. Key words: Leverage effect, Information Asymmetry, GARCH Model, EGARCH MODEL, TGARCH MODEL 1. INTRODUCTION Efficient market theory states that the market processes the negative and positive shocks symmetrically, meaning that the information will contain in the prices quickly and there will not be any chance of making superior return from the fundamental difference. In reality, the efficiency of the market is in question and we cannot expect every investors in the market behave unanimously. This assimilated response is called information asymmetry. The leverage effect states that the market exhibits a differential response to the negative shocks over the positive shocks.
Transcript of LEVERAGE EFFECT AND CAPITAL MARKET VOLATILITY – …
Indian Journal of Finance and EconomicsVol. 2, No. 1, 2021 : pp. 15-25© ARF India. All Right ReservedURL : www.arfjournals.com
ARF INDIAAcademic Open Access Publishingwww. arfjournals. com
To cite this article:
Maheen Muhammad Sali & Ajmi Nazar (2021). Leverage Effect and Capital Market Volatility–Evidence from Indian Equity Market. Indian Journal of Finance and Economics, Vol. 2, No.1, pp. 15-25
LEVERAGE EFFECT AND CAPITAL MARKET VOLATILITY –EVIDENCE FROM INDIAN EQUITY MARKET
Maheen Muhammad Sali1,2 & Ajmi Nazar3
1TKM College of Arts and Science, Kollam -5 Kerala, India; E-mail: [email protected] of Kerala, Trivandrum, Kerala India3Cochin University of Science and Technology (CUSAT), Eranakulam, Kerala, India
Received : 14 December 2020; Revised : 21 December 2020; Accepted : 6 January 2021; Published : 3 May 2021
Abstract: Efficient market theory states that the market responds to the negativeand positive shocks symmetrically. In reality, the market exhibit asymmetricresponse to the negative shocks over the positive shocks, this is called informationasymmetry. The concept of leverage effects states that market is highly volatileduring the arrival of negative shocks than the positive shocks. The standardGARCH model failed to capture leverage effect into its variance equation. Thishas been done by incorporating longer memory process into the variance equationof the EGARCH and TGARCH models. The paper focused on identifying theleverage effect in Indian stock market by studying the volatility of selected indicesfor a period of 6 years. The results accept the presence of information asymmetryand the models were failed in some extent to identify the presence of a strongleverage effect.
Key words: Leverage effect, Information Asymmetry, GARCH Model, EGARCHMODEL, TGARCH MODEL
1. INTRODUCTION
Efficient market theory states that the market processes the negative andpositive shocks symmetrically, meaning that the information will containin the prices quickly and there will not be any chance of making superiorreturn from the fundamental difference. In reality, the efficiency of themarket is in question and we cannot expect every investors in the marketbehave unanimously. This assimilated response is called informationasymmetry. The leverage effect states that the market exhibits a differentialresponse to the negative shocks over the positive shocks.
16 Maheen Muhammad Sali & Ajmi Nazar
India is an emerging market economy with the high potential fordevelopment. The structural reforms done by the Government boost theForeign Investments in all spheres of economic activity including the capitalmarket by the way of FII’s. This makes the market more volatile andvulnerable. Volatility is the measure of tranquillity or the fluctuation instocks performance (Engle 1982) by exhibiting dispersion in the stocksreturns than the direction (Hady, 2014). Differential response of the marketto the positive and negative shocks can be understood by checking theasymmetry in processing the information. Auto Regressive ConditionalHeteroskedasticity (ARCH) models were used for identifying volatility ofthe market. This has been done by the studies of Engle, in 1982; byincorporating the variance of past innovation as a function of the presentinnovation. Later, the GARCH model was introduced by extending thevariance of the past return along with the ARCH model (Bollerslev,1986).The scholars like Robins (1987), Nelson (1991), Poon & Granger (1992), Engle,Lilien (2003), further improvised the standard GARCH model.
Exponential GARCH model (Nelson,1991) was developed to tackle theimpact of negative shocks over the positive shocks. This model uses logreturns to absorb the Leverage effect in the performance of the stock returns.In 1993 the studies by Engle & Ng found that the bad shock makes highvolatility than the good shocks. Threshold GARCH model was developedby the Zakoian (1994) by including the standard deviation of the pastvariance as in contrast to the conditional variance used in the basic GARCHmodel. Glosten, Jagannathan & Runkle (1993), applied the TGARCH modelfor checking the information asymmetry and they found that the bad shockshakes the market than the positive one.
Large number of studies was conducted on the volatility of Indian stockmarkets by using ARCH family models. It show the EGARCH andTGARCH models were fit the market to identify the information asymmetry.
National Stock Exchange (NSE) and Bombay Stock exchanges (BSE) arethe major stock exchanges in India. BSE is the world’s 10th largest stockexchange having higher market capitalization than the NSE. Hence the studyfocused on the sectoral indices of BSE for measuring the leverage effect.The S&P BSE BANKEX, S&P BSE OIL & GAS, S&P BSE India InfrastructureIndex, S&P BSECONSUMER DURABLE, S&P BSE Healthcare were usedfor a period of six years for measuring the leverage effect on the marketvolatility.
The present study follows EGARCH and TARCH models using E-viewsin conformity with the existing literatures. The study has been done by thedaily data of five sectoral indices for a period of six years from Jan 2012 to
Leverage Effect and Capital Market Volatility – Evidence from Indian Equity Market 17
July 2018. This period witnessed the tranquil performance of the stockmarket due to the various socio economic reasons such as change of centralGovt and the policies priorities, Demonetization of higher denominationcurrency, and implementation of new indirect tax etc., In general, we wantto check whether the returns were affected by the good and bad news onthe Indian industries by using EGARCH and TARCH model.
2. OBJECTIVES OF THE STUDY
The study confine to the five sectoral indices of BSE for a period of six yearsfrom 02 January 2012 to 2018. All these sectors contribute to a major sharein the GDP of the country. The very purpose of this study is to understandthe existence of leverage effect in processing the information in Indianmarket by studying the sectoral indices.
3. DATA AND THE METHODOLOGY
Study uses daily closing data of the S&P BSE sectoral indices of banking,oil and gas, infrastructure, consumer durables and the health care sectors,spanning over a period of 6 years. The returns of the indices rt is calculatedby applying the following formula,
1
1 1
1t t tt
t t
VI VI VIr
VI VI (1)
11
ln ln ln lntt t t
t
VIr VI VIVI (2)
tVI Stands for the Value of index for the tth period and VIt–1 stands forthe value of index for t-1th period. In equation (2) the log return of the indiceswere applied by natural logarithm.
The following section explains the specification of GARCH model,EGARH and TGARH models under the condition of normal Gaussian errordistribution.
GARCH MODEL: The basic form of GARCH model applied here isthe GARCH (1,1) model, with one ARCH term (past innovation) and theone garch term (past conditional variance). The model has two parts, suchas mean equation and the variance equation.
Mean equation: The daily Index returns obtained from the equation (1)were applied for running the uni-variate regression model
rt = 0 + (3)
18 Maheen Muhammad Sali & Ajmi Nazar
Where, rt is the return of index; 0 is the constant term and � is the errorterm. In equation (3), the index return is the linear function of constant andthe error term.
Variance equation: Variance equation of GARCH Model explains thevariance of the returns depends on the variance of the previous return andthe error term.
2 20 1 1tr t� � � � �� � (4)
0 is the constant term; 1 is the coefficient of the ARCH term, 1 is the
coefficient of the past returns (ie, GARCH term) and1
2
tr�
�is the variance of
the past index return.
The mean equation of the GARCH (1,1) model is regressed and theresidual obtained was applied in the variance equation.
ARCH(1) model- this model regress the conditional variance with theprevious error term innovation. Variance equation of this model is givenby
2 20 1 1tr t� � � � �� � (5)
ARCH Test: the residual obtained from model (3) were plotted to checkthe presence of volatility clustering. It is a necessary condition for testingARCH effect (presence of autocorrelation of the time series). If there is ARCHeffect, it justifies testing the EGARCH model and TGARCH model.
Exponential GARCH Model
This model extended variance equation of the basic GARCH model byincorporating the long memory process for information asymmetry.
1
1 1
2 21 1
2 2log( ) log( )
t t
t t
t tr r
r r
� �� � � � � �
� ��
� �
� �� �� �� � � �� �� �
(5)
is the constant term; 1
2
tr�
�is the variance of the past index return and
1
1
2
t
t
r
�
��
�� �� �� �� �
EGARCH term
Leverage Effect and Capital Market Volatility – Evidence from Indian Equity Market 19
TGARCH or GJR Model: This model is developed for capturing theinformation asymmetry. It is a simple extension of basic GARCH (1,1) model
by adding the Threshold term 21 1t td� � � in to the variance equation.
1
2 2 2 20 1 1 1t tr t t t rd� � �� �� ��
�� � �� � � � (5)
After running this models the residual were diagnosed and included inthe result session.
4. RESULTS AND DISCUSSIONS
The descriptive statistics of the sample returns were shown in the table 5.1.
Table 4.1Showing Descriptive Statistics of the sample returns
RET_BANK RET_CON RET_ RET_ RET_EX _DURA HLTH INFR OIL
Mean 0.000630 0.001019 0.000397 0.000257 0.000367Maximum 0.049156 0.085951 0.048376 0.038921 0.048177Minimum -0.069885 -0.072283 -0.067546 -0.086650 -0.092041Std. Dev. 0.011777 0.012799 0.011147 0.011514 0.011798Observations 1033 1033 1033 1033 1033
Source: Calculation by author using Eviews
From the table above, the mean return of the Bankex is .063%, theconsumer durable index is 8.5951%, the health care index is 4.8376%, theinfra index is 3.8921% and the mean of the oil and gas index is 4.8177%.Sample statistics is corresponds to the 1033 observation for a period of 6years.
SKEWNESS AND KURTOSIS TEST
Table 4.2Showing Normality test of the sample returns
RET_BANK RET_CON RET_ RET_ RET_EX _DURA HLTH INFR OIL
Skewness -0.109010 0.250143 -0.514081 -0.780554 -0.600411Kurtosis 5.117259 7.084823 5.725408 6.924108 7.067129
Source: Calculation by author using Eviews
Skewness is used to measure the normality of the data. If the valuecloses to zero, it means that there is symmetry in left and right half of the
20 Maheen Muhammad Sali & Ajmi Nazar
standard normal curve. The values of the bankex and consumer durableindices are in the range of (-0.5, 0.5) which shows an approximate symmetryin the distribution. The other indices are moderately skewed
Kurtosis measure the peak of the normal curve and the standard shouldbe 3. All the indices have a higher value of kurtosis hence it is leptokurticdistribution, meaning that the indices have a heavier tail than the normal.
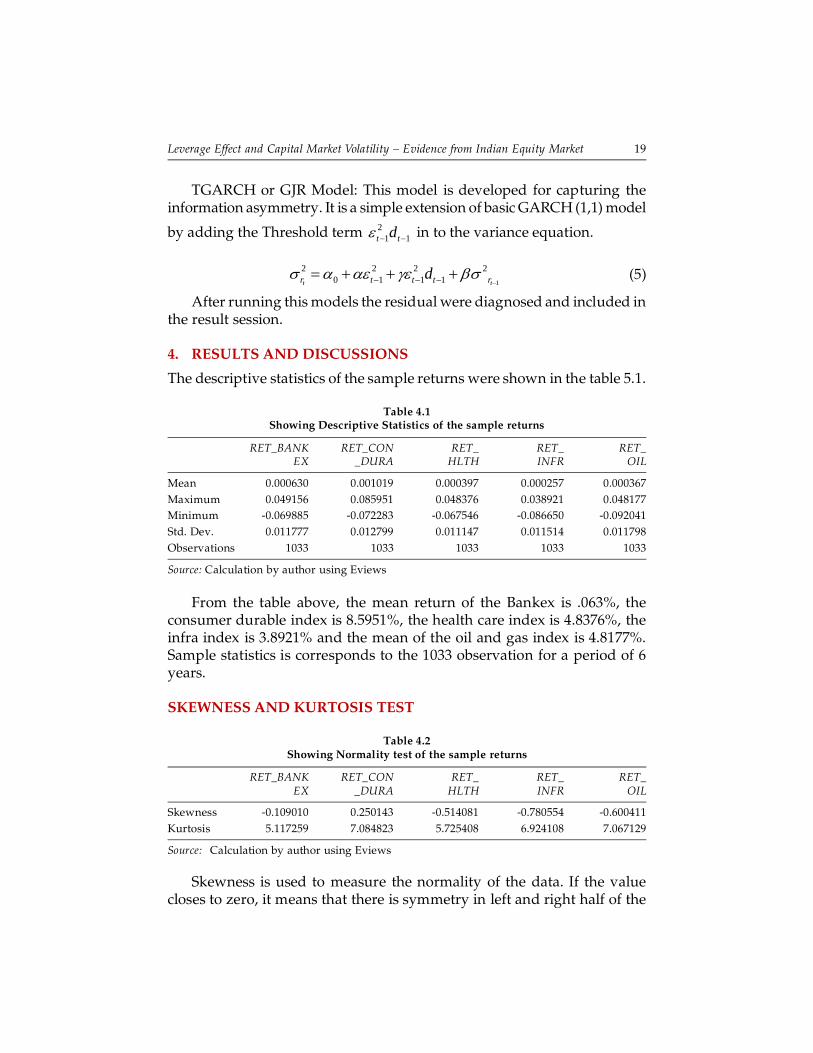
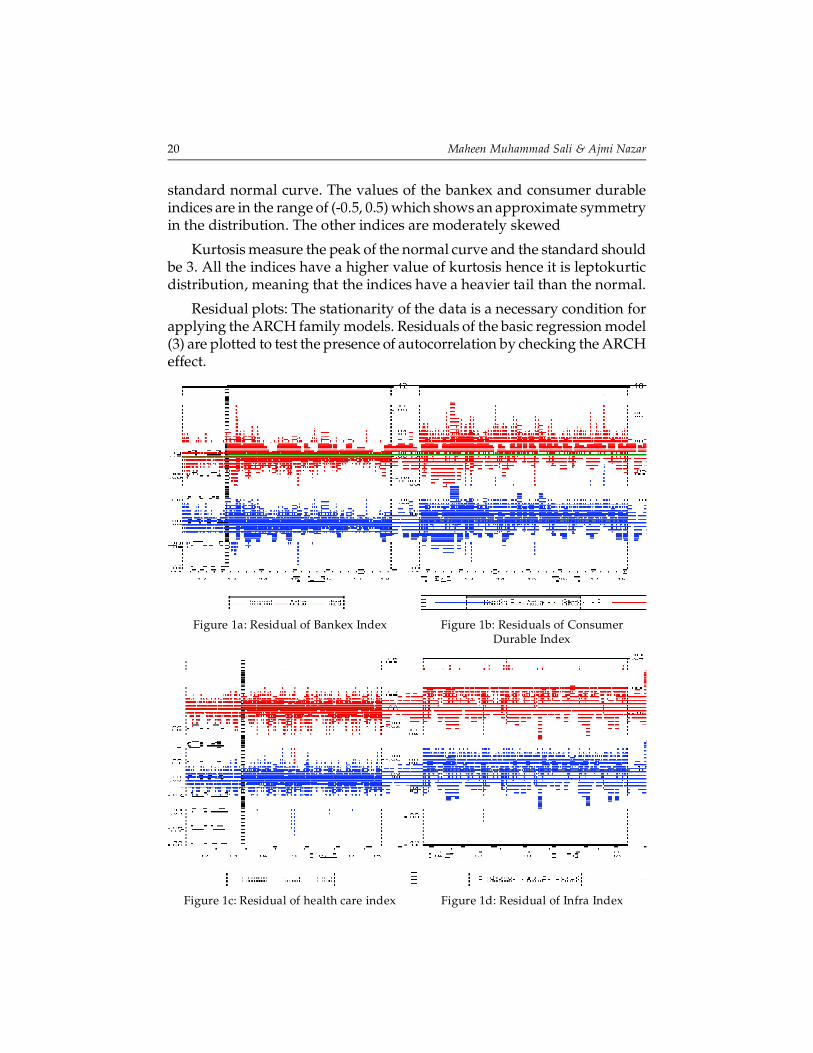
Residual plots: The stationarity of the data is a necessary condition forapplying the ARCH family models. Residuals of the basic regression model(3) are plotted to test the presence of autocorrelation by checking the ARCHeffect.
Figure 1a: Residual of Bankex Index Figure 1b: Residuals of ConsumerDurable Index
Figure 1c: Residual of health care index Figure 1d: Residual of Infra Index
Leverage Effect and Capital Market Volatility – Evidence from Indian Equity Market 21
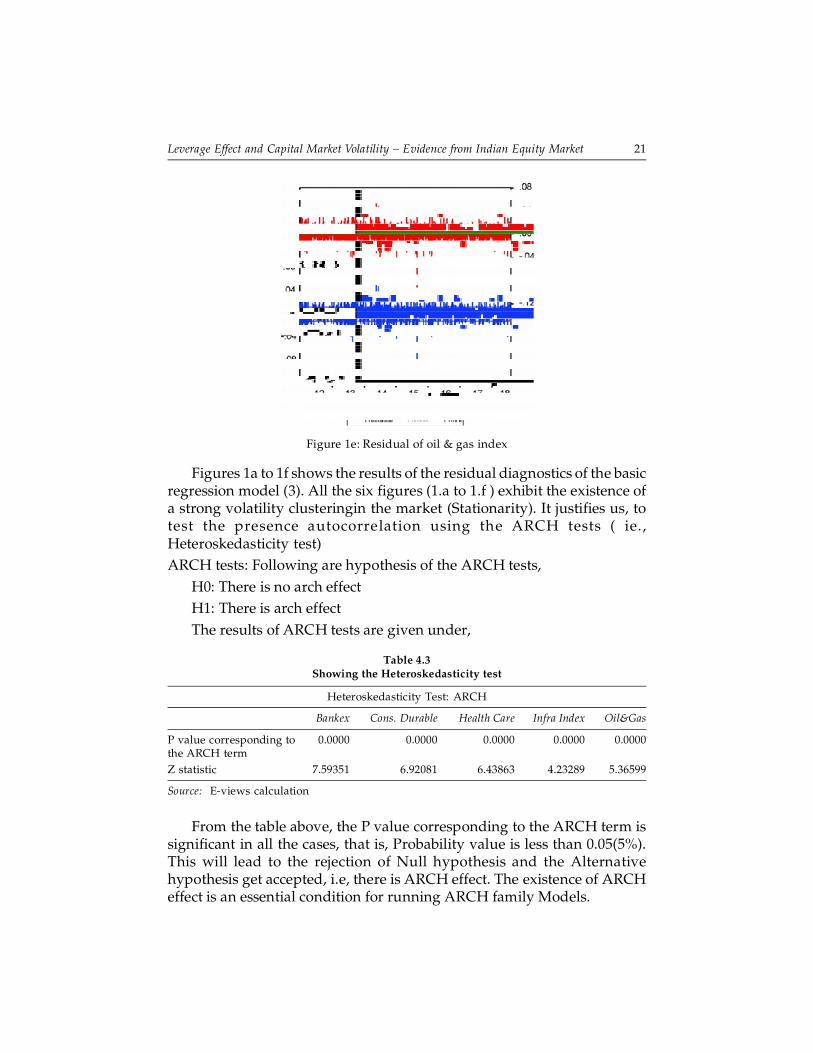
Figures 1a to 1f shows the results of the residual diagnostics of the basicregression model (3). All the six figures (1.a to 1.f ) exhibit the existence ofa strong volatility clusteringin the market (Stationarity). It justifies us, totest the presence autocorrelation using the ARCH tests ( ie.,Heteroskedasticity test)ARCH tests: Following are hypothesis of the ARCH tests,
H0: There is no arch effectH1: There is arch effectThe results of ARCH tests are given under,
Table 4.3Showing the Heteroskedasticity test
Heteroskedasticity Test: ARCH
Bankex Cons. Durable Health Care Infra Index Oil&Gas
P value corresponding to 0.0000 0.0000 0.0000 0.0000 0.0000the ARCH termZ statistic 7.59351 6.92081 6.43863 4.23289 5.36599
Source: E-views calculation
From the table above, the P value corresponding to the ARCH term issignificant in all the cases, that is, Probability value is less than 0.05(5%).This will lead to the rejection of Null hypothesis and the Alternativehypothesis get accepted, i.e, there is ARCH effect. The existence of ARCHeffect is an essential condition for running ARCH family Models.
Figure 1e: Residual of oil & gas index
22 Maheen Muhammad Sali & Ajmi Nazar
In order to identify the presence of leverage effect i.e. the differentialresponse of the market towards the negative shocks over the positiveshocks. Exponential GARCH (EGARCH) and Threshold GARCH(TGARCH) models were applied under the Normal Gaussian errordistribution.
EGARCH model: As suggested by literature, Exponential GARCHmodel were applied to test the presence of leverage effect. In doing so, themodel incorporates the EGARCH term in to the normal GARCH model.Coefficient of this term makes the sense in understanding the presence ofleverage effect.
H0: there is symmetry processing the information
H1: there exists information asymmetry
The results of the EGRACH model is as under,
Table 4.4Showing the P value corresponding to the Coefficient of EGRACH term
Test: EGARCH
Bankex Cons. Durable Health Care Infra Index Oil&Gas
P value 0.0000 0.0000 0.0000 0.0000 0.0000Coefficient of EGARCH 0.99253 0.913444 0.97075 0.93045 0.93735term ie. ,
1
1
2
t
t
Ir
�
��
�� �� �� �� �
Source: authors calculation using E-views
In all the cases, the coefficients of the EGARCH terms are positive andthe corresponding p-values are significant (P < .05). This will leads to theacceptance of the alternative hypothesis that there exists informationasymmetry. But the model failed to explain the impact of informationassimilation due to negative shocks as the coefficients of all the indiceswere positive.
TGARCH model: This model is applied for testing the informationassimilation in the Market.
H0: there is symmetry processing the information
H1: there exists information asymmetry
The results of the model were as under.
Leverage Effect and Capital Market Volatility – Evidence from Indian Equity Market 23
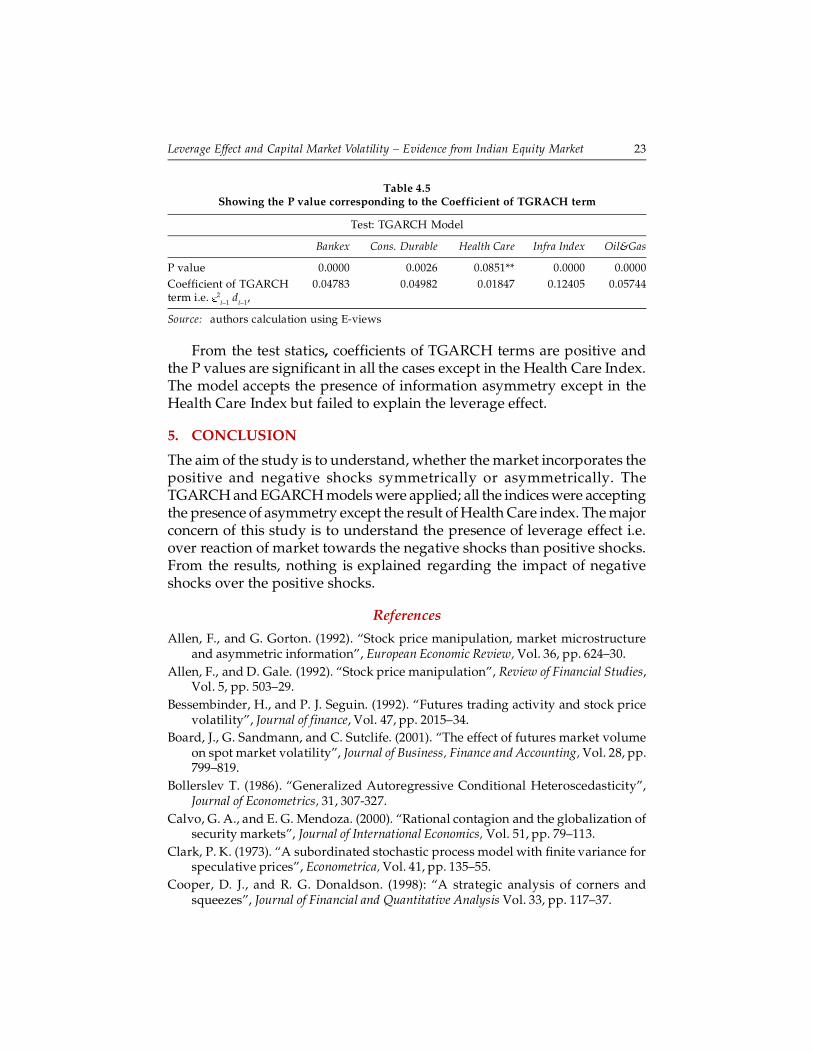
Table 4.5Showing the P value corresponding to the Coefficient of TGRACH term
Test: TGARCH Model
Bankex Cons. Durable Health Care Infra Index Oil&Gas
P value 0.0000 0.0026 0.0851** 0.0000 0.0000Coefficient of TGARCH 0.04783 0.04982 0.01847 0.12405 0.05744term i.e. 2
t–1 dt–1,
Source: authors calculation using E-views
From the test statics, coefficients of TGARCH terms are positive andthe P values are significant in all the cases except in the Health Care Index.The model accepts the presence of information asymmetry except in theHealth Care Index but failed to explain the leverage effect.
5. CONCLUSION
The aim of the study is to understand, whether the market incorporates thepositive and negative shocks symmetrically or asymmetrically. TheTGARCH and EGARCH models were applied; all the indices were acceptingthe presence of asymmetry except the result of Health Care index. The majorconcern of this study is to understand the presence of leverage effect i.e.over reaction of market towards the negative shocks than positive shocks.From the results, nothing is explained regarding the impact of negativeshocks over the positive shocks.
References
Allen, F., and G. Gorton. (1992). “Stock price manipulation, market microstructureand asymmetric information”, European Economic Review, Vol. 36, pp. 624–30.
Allen, F., and D. Gale. (1992). “Stock price manipulation”, Review of Financial Studies,Vol. 5, pp. 503–29.
Bessembinder, H., and P. J. Seguin. (1992). “Futures trading activity and stock pricevolatility”, Journal of finance, Vol. 47, pp. 2015–34.
Board, J., G. Sandmann, and C. Sutclife. (2001). “The effect of futures market volumeon spot market volatility”, Journal of Business, Finance and Accounting, Vol. 28, pp.799–819.
Bollerslev T. (1986). “Generalized Autoregressive Conditional Heteroscedasticity”,Journal of Econometrics, 31, 307-327.
Calvo, G. A., and E. G. Mendoza. (2000). “Rational contagion and the globalization ofsecurity markets”, Journal of International Economics, Vol. 51, pp. 79–113.
Clark, P. K. (1973). “A subordinated stochastic process model with finite variance forspeculative prices”, Econometrica, Vol. 41, pp. 135–55.
Cooper, D. J., and R. G. Donaldson. (1998): “A strategic analysis of corners andsqueezes”, Journal of Financial and Quantitative Analysis Vol. 33, pp. 117–37.
24 Maheen Muhammad Sali & Ajmi Nazar
Copeland, T. E. (1976). “A model of asset trading under the assumption of sequentialinformation arrival”, Journal of Finance, Vol. 31, pp. 1149–67.
Damodaran, A., and M. Subrahmanyam. (1992). “The effects of derivative securitieson the markets for the underlying assets in the United States: A survey”, FinancialMarkets, Institutions and Instruments, Vol. 1, pp. 1–21.
Danthine, J. (1978). “Information, futures prices, and stabilizing speculation”, Journalof Economic Theory, 17, 79–98.
Devenow, A., and I. Welch. (1996). “Rational herding in Financial economics”, EuropeanEconomic Review, Vol. 40, pp. 603–15. 177.
Glosten, L., Jaganathan, R. and Runkle, D. (1993). “Relationship between the expectedvalue and volatility of the nominal excess returns on stocks”, Journal of Finance,Vol. 48, pp. 1779-802.
Grinblatt, M., S. Titman, and R. Wermers. (1995). “Momentum investment strategies,portfolio performance, and herding: A study of mutual fund behavior”, AmericanEconomic Review, Vol. 85, pp. 1088–105.
Gulen, H. and Mayhew, S. (2000). “Stock Index Futures Trading and Volatility inInternational Equity Markets,” The Journal of Futures Markets, Vol. 20, No. 7, 661-685.
Hady, Dina Hassan Abdel (2014). “Modeling the volatility with GARCH family models-An application to daily stock log returns in pharmaceutical companies”, PenseeJournal, Vol 76.
Harris, L. (1986). “Cross-security tests of the mixture of distribution hypothesis”, Journalof Financial and Quantitative Analysis, Vol. 21, pp. 39–46.
Harris, L. (1987). “Transaction data tests of the mixture of distributions hypothesis”,Journal of Financial and Quantitative Analysis Vol. 22, pp. 127–41.
Harris, L. (1989). S&P 500 cash stock price volatilities. Journal of Finance, 44, 1155–1175.
Jarrow, R. A. (1992). “Market manipulation, bubbles, corners, and short squeezes”,Journal of Financial and Quantitative Analysis, Vol. 27, pp. 311–36. 178.
Jarrow, R. A. (1994). “Derivative securities markets, market manipulation, and optionpricing theory”, Journal of Financial and Quantitative Analysis Vol. 29, pp. 241–61.
Jennings, R. H., L. T. Starks, and J. C. Fellingham. (1981). “An equilibrium model ofasset trading with sequential information arrival”, Journal of Finance, Vol. 36,pp.143–61.
Jennings, R. H., and C. Barry. (1983). “Information dissemination and portfolio choice”,Journal of Financial and Quantitative Analysis, Vol. 18, pp. 1–19.
Kanas A (2009). “Regime Switching in Stock Index and Futures Markets: A Note onthe Nikkei Evidence”, International Journal of Financial Economics, 14(4): 394-99.
Maheen, M & Jeena R (2017). Information Asymmetry Evidence from IndianInfrastructure Industry, International Journal of Academic Research in Commerce andManagement, vol. 4, PP. 8-11.
Merton, R. C. (1995). “Financial innovation and the management and regulation offinancial institutions”, Journal of banking and Finance, Vol. 19, pp. 461–81.

Leverage Effect and Capital Market Volatility – Evidence from Indian Equity Market 25
Miller, M. H. (1993). “The economics and politics of index arbitrage in the US andJapan”, Pacific Basin Financial Journal, Vol. 1, pp. 3–11.
Min, J. H, Najand, M. (1999). “A Further Investigation of the Lead-Lag Relationshipbetween the Spot Market and Stock Index Futures: Early Evidence from Korea”,Journal of Futures Market, 19(2): 217-232.
Mishra, P. K., (2010). “A GARCH Model Approach to Capital Market Volatility: TheCase of India”, Indian Journal of Economics and Business, Vol.9, No. 3, pp. 631- 641.
Morse, D. (1980). “Asymmetrical information in securities market and trading volume”,Journal of Financial and Quantitative Analysis, Vol. 15, pp. 1129–46.
Nath, G. C. (2003). “Behaviour of stock market volatility after derivatives”, NSE workingpaper, Retrieved May 23, 2011, from http://www.nseindia.com/content/ research/Paper60.pdf/.
Schwert, G. W. (1990). “Stock market volatility”, Financial Analyst Journal, Vol. 46, pp.23–34
Stein, J. (1989). “Overreaction in options markets”, Journal of Finance, Vol. 44, pp. 1011–23
Zakoian, J. M. (1994). “Threshold Autoregressive Models”, Journal of Economic DynamicControl, Vol. 18, pp. 931-955.