
Leverage Analytics to Improve Online and Social Media Professional Development
46
Leverage Analytics to Improve Online and Social Media Professional Development View the slides at facdev.niu.edu/pod14analytics
-
Upload
stephanie-richter -
Category
Education
-
view
77 -
download
0
Transcript of Leverage Analytics to Improve Online and Social Media Professional Development
Leverage Analytics to Improve Online and Social Media
Professional Development
View the slides at facdev.niu.edu/pod14analytics
The Need for Web and Social Media Analytics
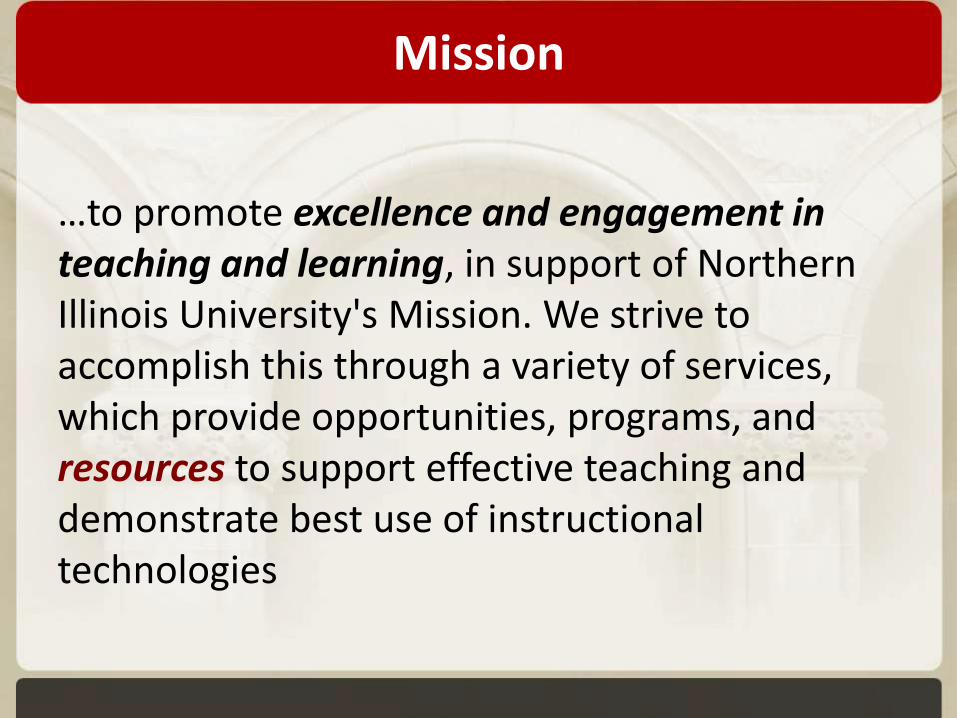
Mission
…to promote excellence and engagement in teaching and learning, in support of Northern Illinois University's Mission. We strive to accomplish this through a variety of services, which provide opportunities, programs, and resources to support effective teaching and demonstrate best use of instructional technologies

Faculty Development and Instructional Design Center
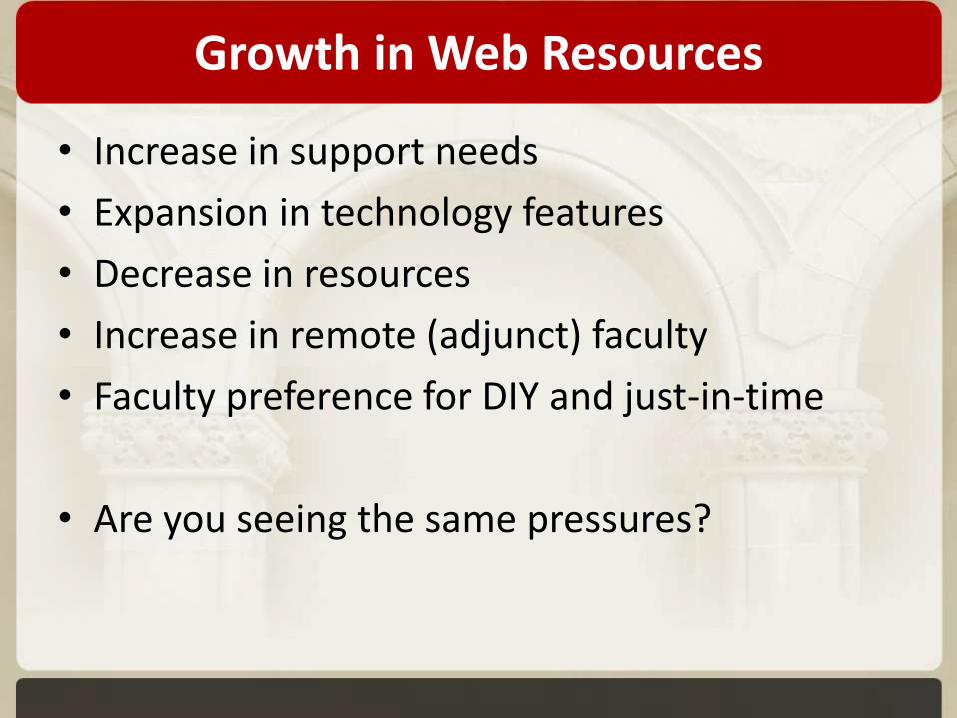
Growth in Web Resources
• Increase in support needs
• Expansion in technology features
• Decrease in resources
• Increase in remote (adjunct) faculty
• Faculty preference for DIY and just-in-time
• Are you seeing the same pressures?

Faculty Development and Instructional Design Center
niu.edu/facdev
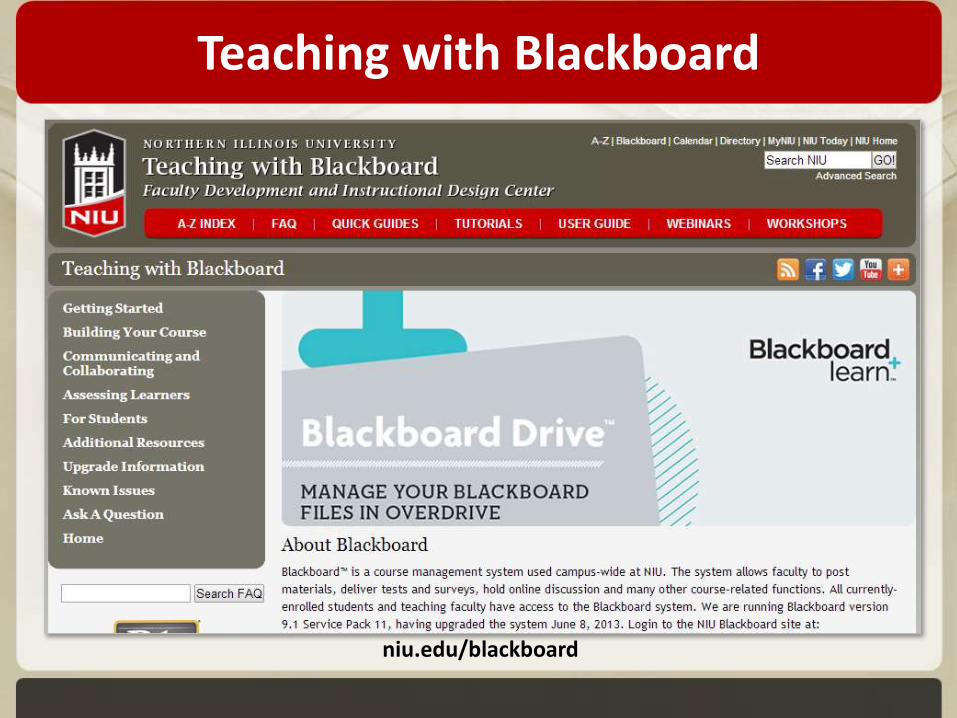
Teaching with Blackboard
niu.edu/blackboard
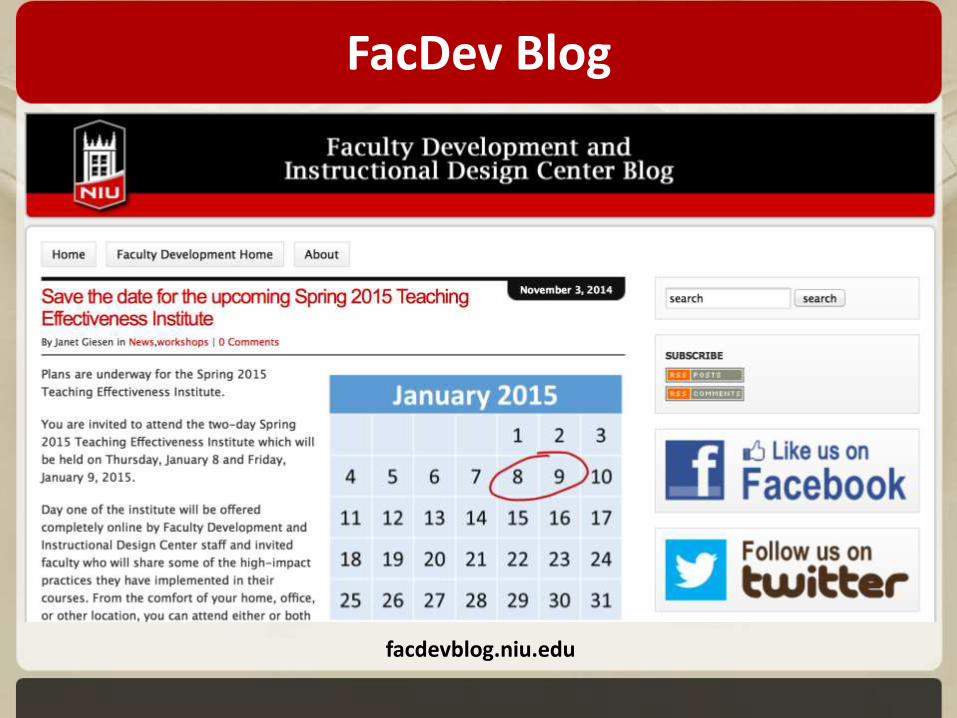
FacDev Blog
facdevblog.niu.edu

Academic Integrity Tutorial
niu.edu/ai
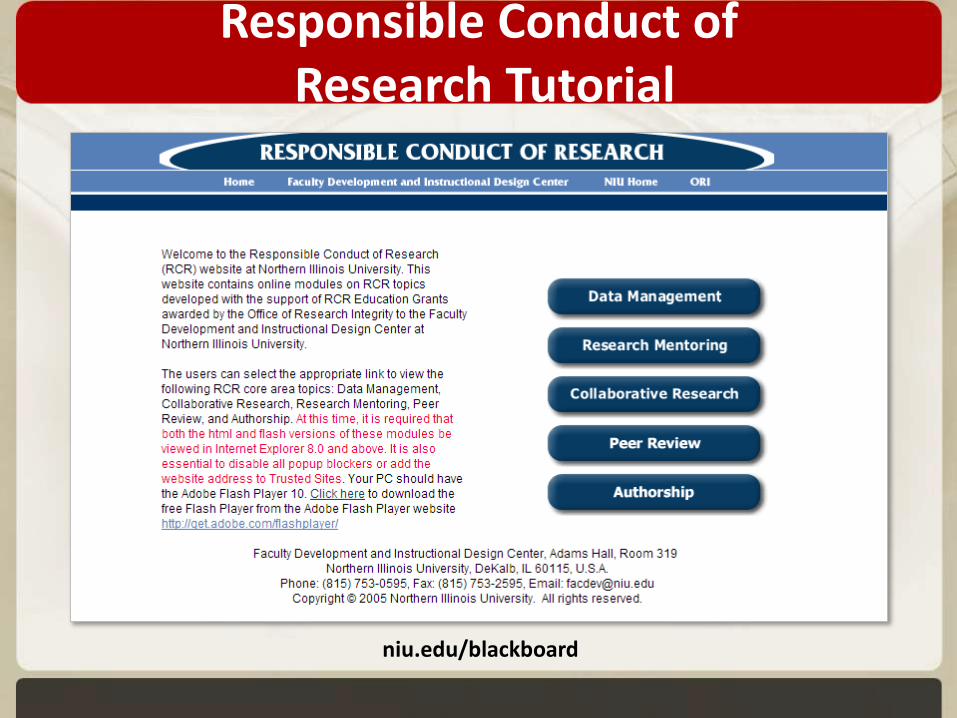
Responsible Conduct ofResearch Tutorial
niu.edu/blackboard
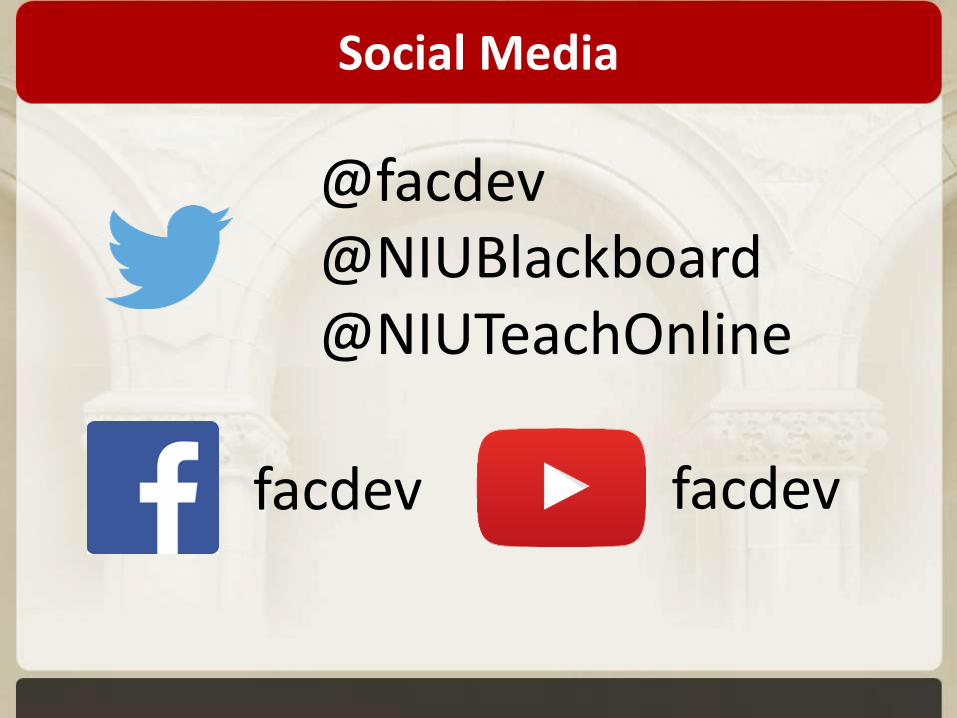
Social Media
@facdev@NIUBlackboard@NIUTeachOnline
facdev facdev
What web or social media resources do you offer?
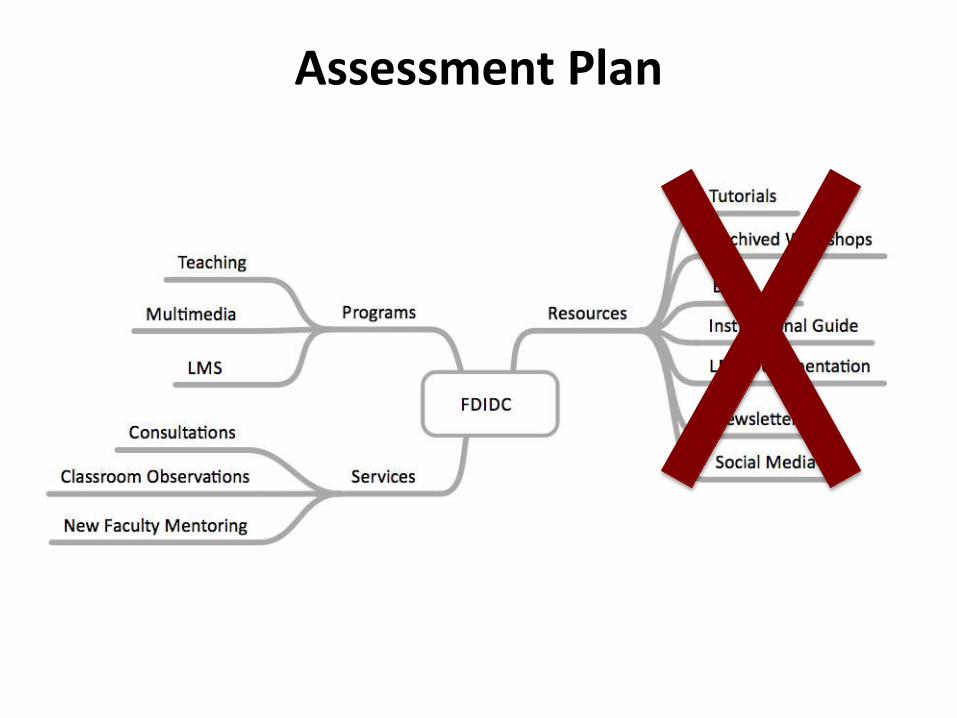
Assessment Plan
How do you assess web and social media resources?
Web Analytics
Analytics
The use of data, statistical analysis, and explanatory and predictive models to gain insights and act on complex issues
Bichsel, 2012, p. 6
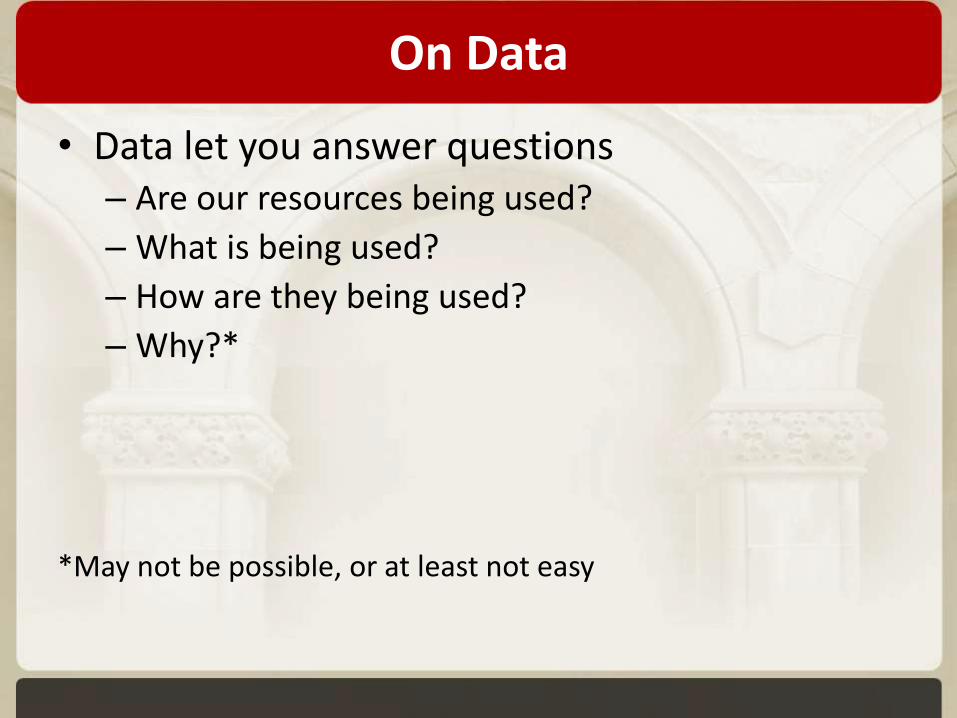
On Data
• Data let you answer questions– Are our resources being used?
– What is being used?
– How are they being used?
– Why?*
*May not be possible, or at least not easy
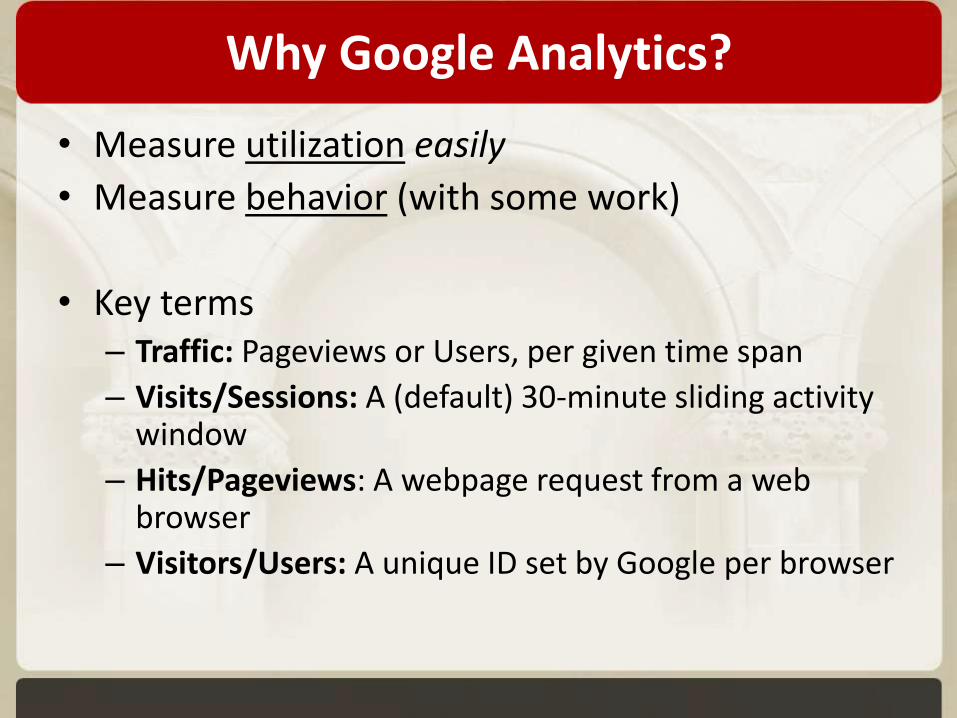
Why Google Analytics?
• Measure utilization easily
• Measure behavior (with some work)
• Key terms– Traffic: Pageviews or Users, per given time span
– Visits/Sessions: A (default) 30-minute sliding activity window
– Hits/Pageviews: A webpage request from a web browser
– Visitors/Users: A unique ID set by Google per browser
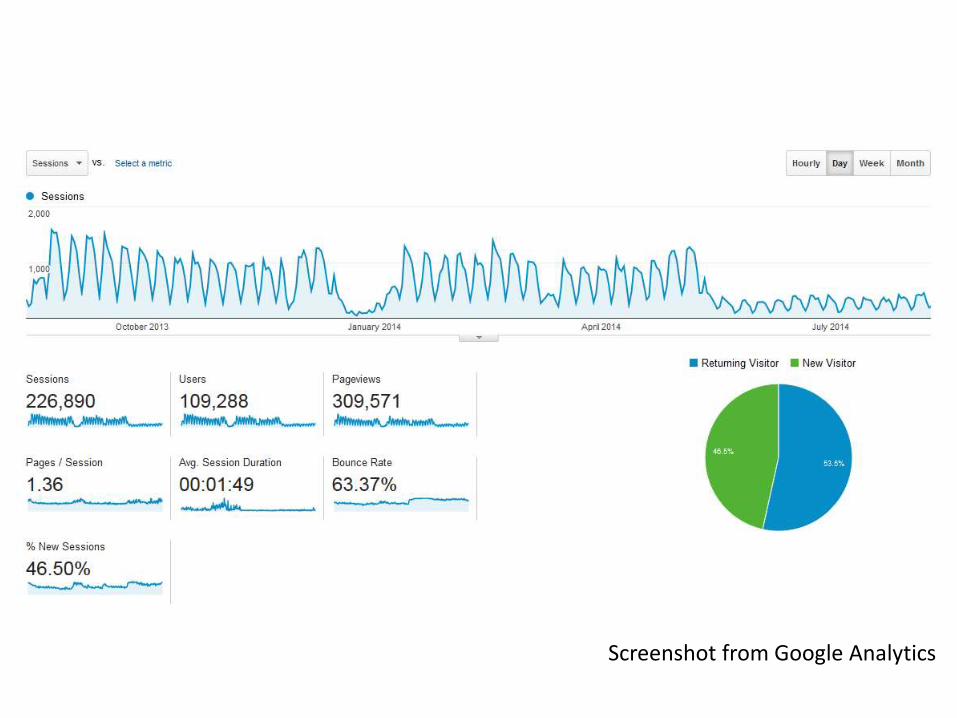
What can GA do?
Screenshot from Google Analytics
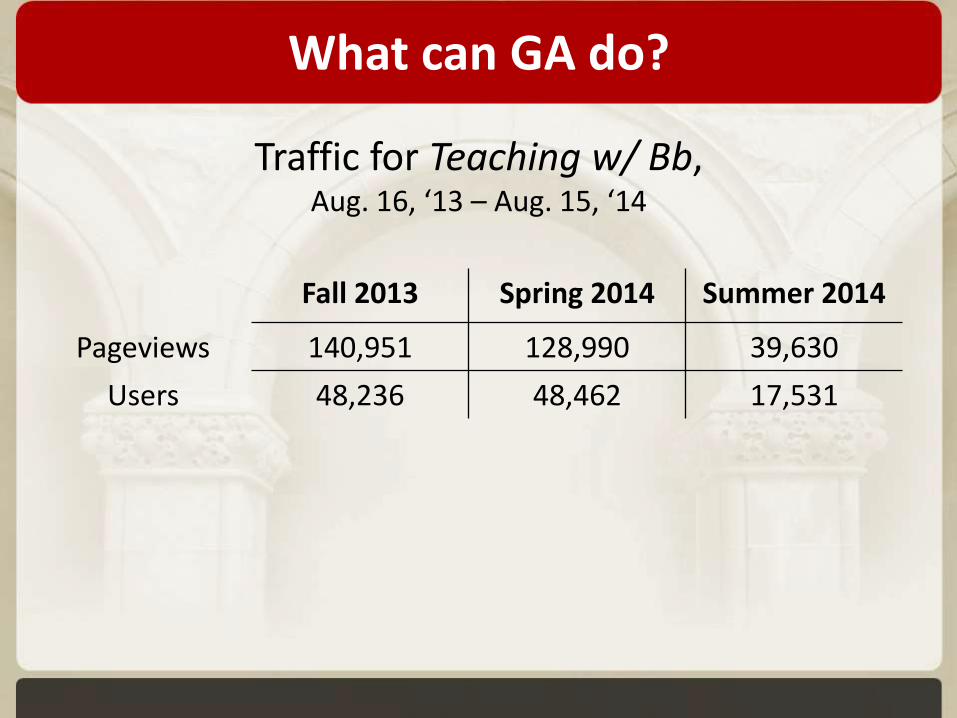
What can GA do?
Fall 2013 Spring 2014 Summer 2014
Pageviews 140,951 128,990 39,630
Users 48,236 48,462 17,531
Traffic for Teaching w/ Bb,Aug. 16, ‘13 – Aug. 15, ‘14
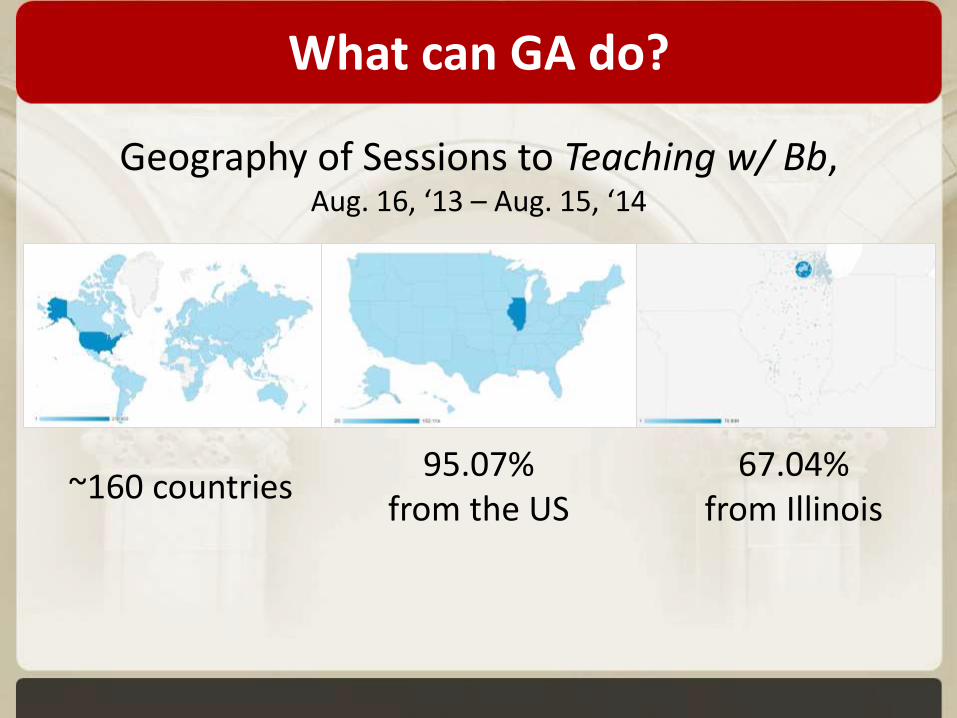
What can GA do?
95.07% from the US
67.04% from Illinois
Geography of Sessions to Teaching w/ Bb,Aug. 16, ‘13 – Aug. 15, ‘14
~160 countries
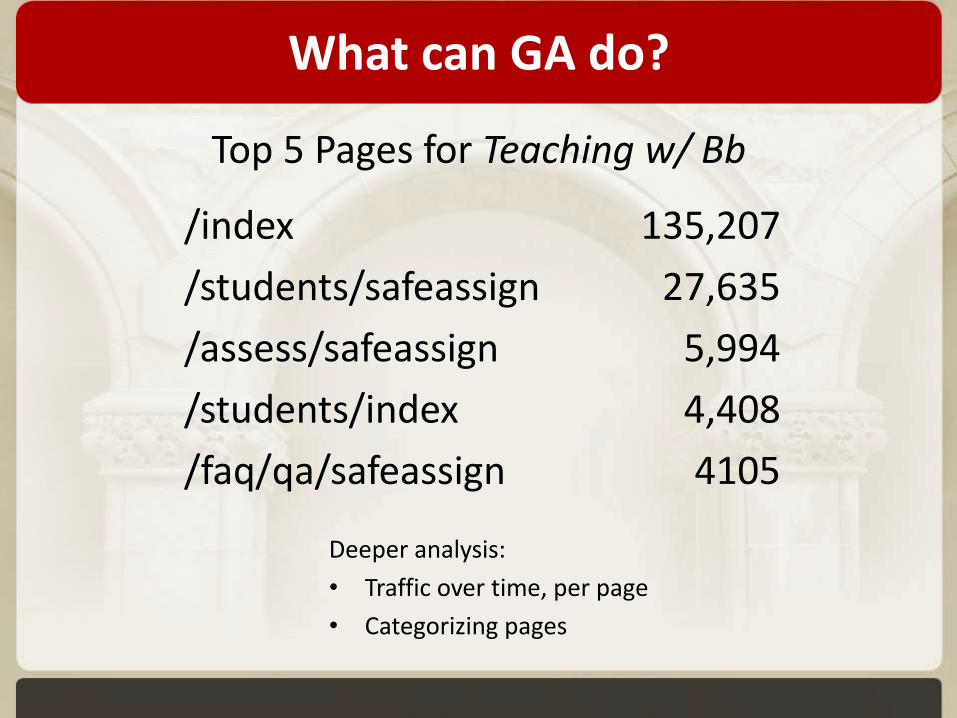
What can GA do?
/index
/students/safeassign
/assess/safeassign
/students/index
/faq/qa/safeassign
135,207
27,635
5,994
4,408
4105
Deeper analysis:
• Traffic over time, per page
• Categorizing pages
Top 5 Pages for Teaching w/ Bb
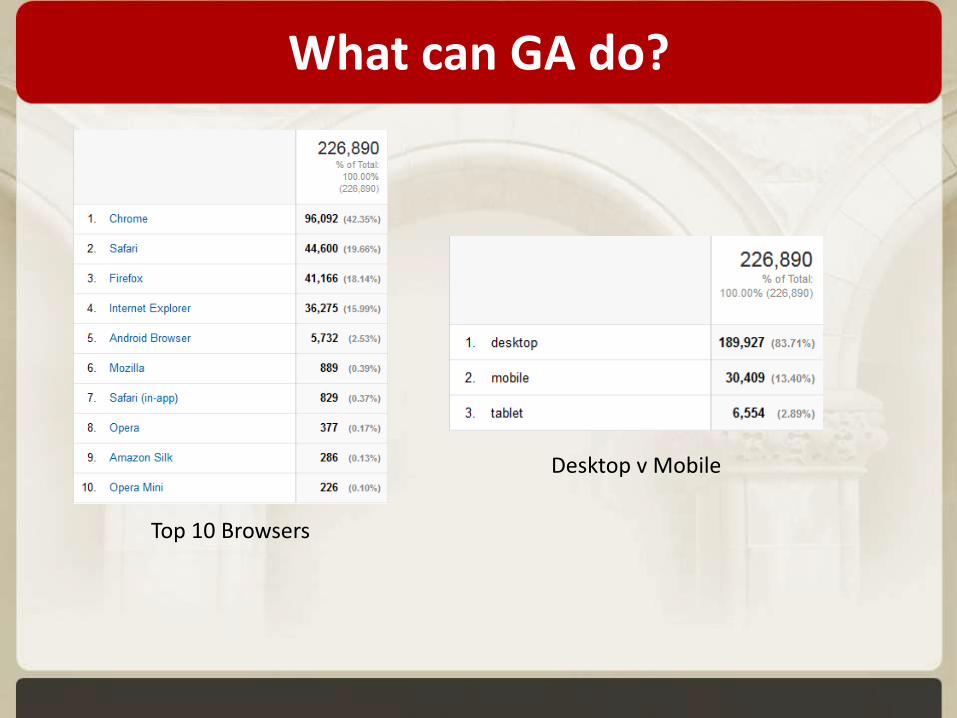
What can GA do?
Top 10 Browsers
Desktop v Mobile
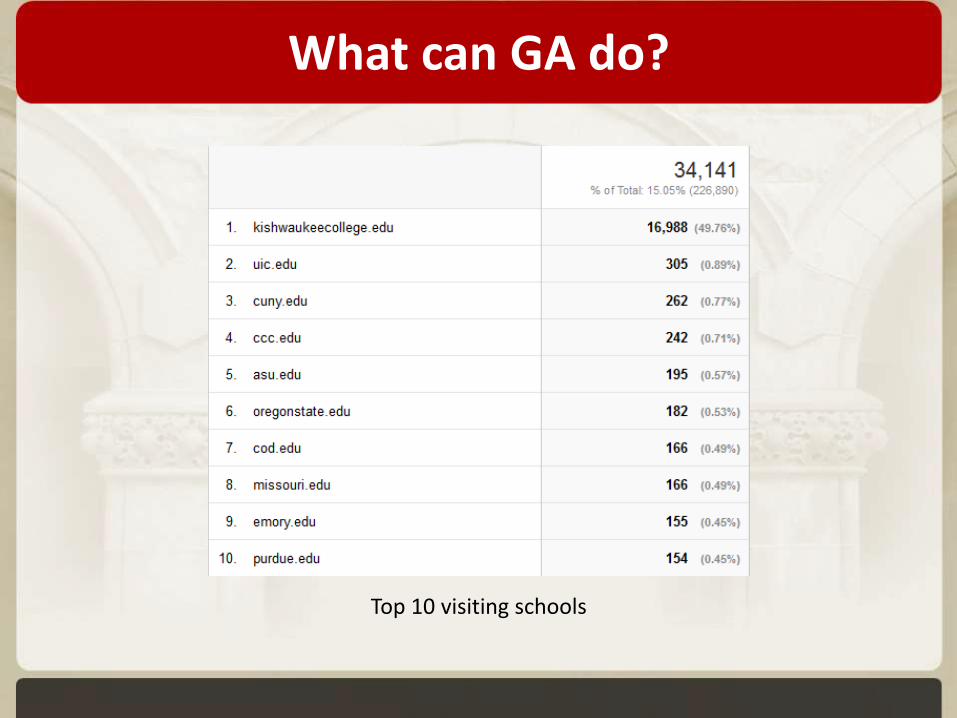
What can GA do?
Top 10 visiting schools
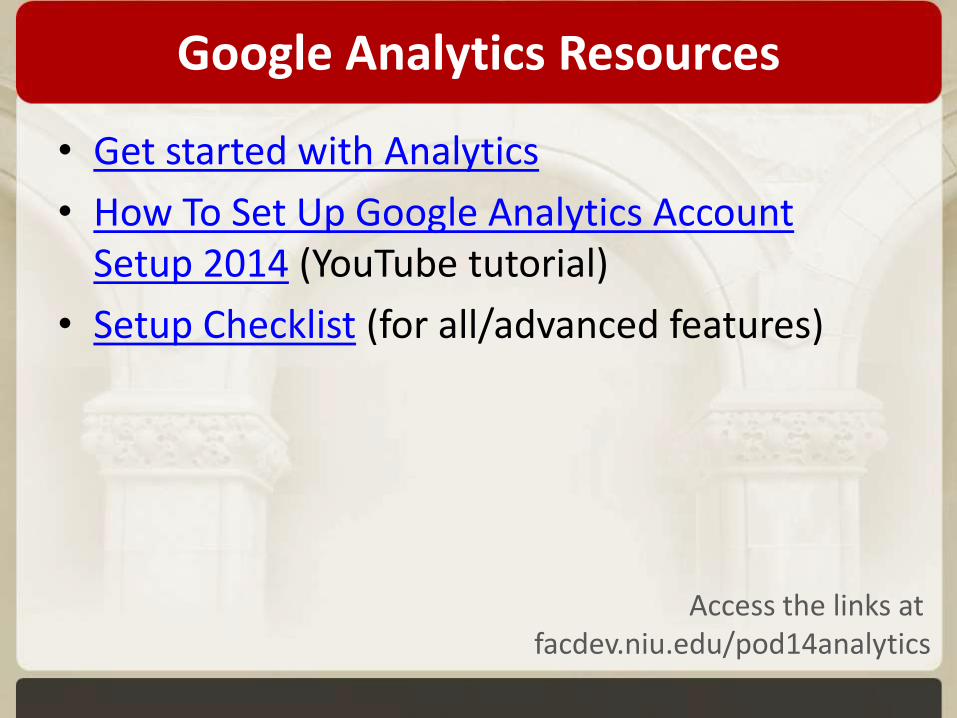
Google Analytics Resources
• Get started with Analytics
• How To Set Up Google Analytics Account Setup 2014 (YouTube tutorial)
• Setup Checklist (for all/advanced features)
Access the links at facdev.niu.edu/pod14analytics
Social Media Analytics
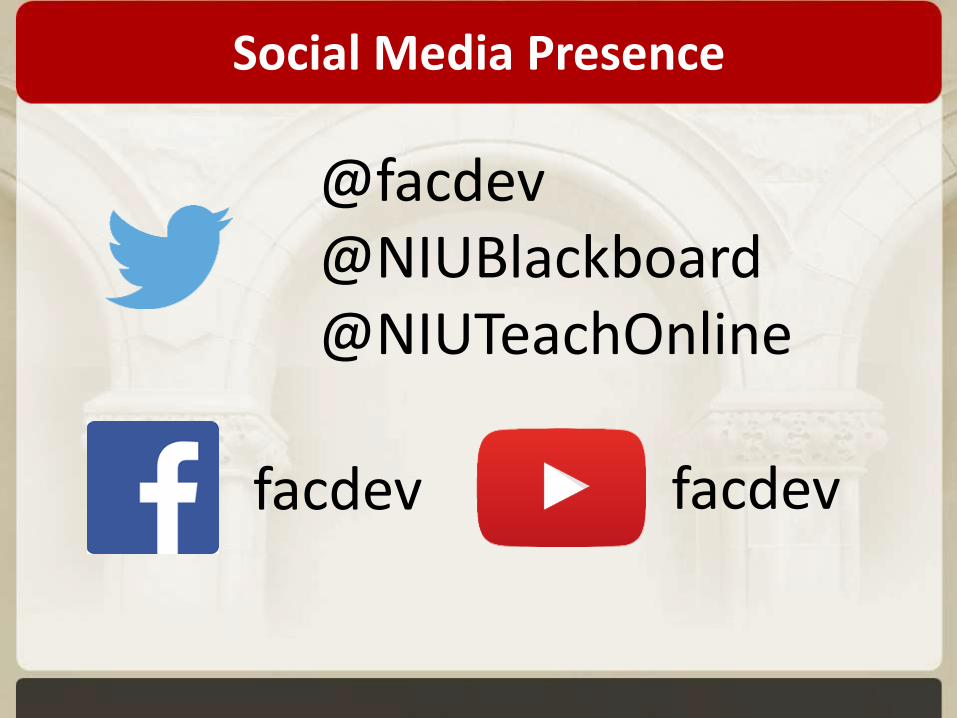
Social Media Presence
@facdev@NIUBlackboard@NIUTeachOnline
facdev facdev
What social media do you use?
How do you know it is useful?
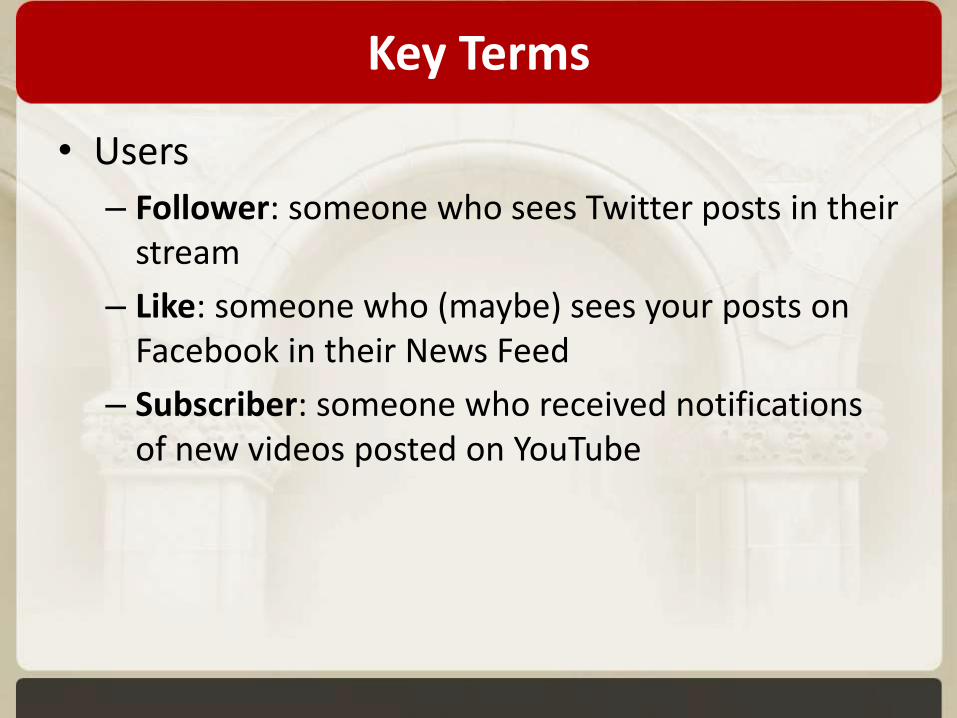
Key Terms
• Users
– Follower: someone who sees Twitter posts in their stream
– Like: someone who (maybe) sees your posts on Facebook in their News Feed
– Subscriber: someone who received notifications of new videos posted on YouTube
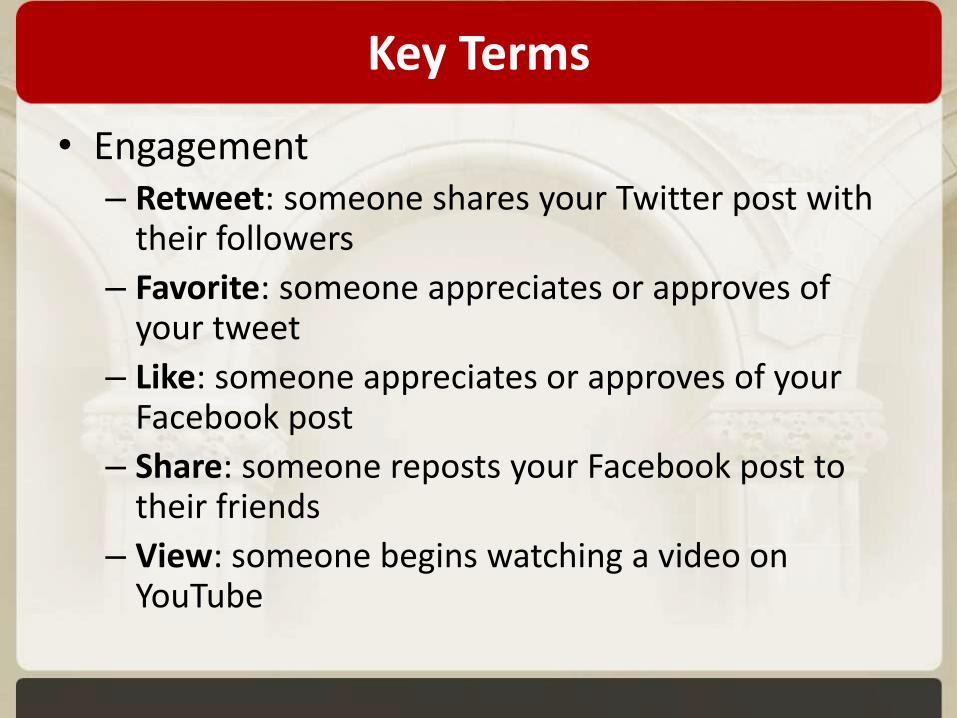
Key Terms
• Engagement– Retweet: someone shares your Twitter post with
their followers
– Favorite: someone appreciates or approves of your tweet
– Like: someone appreciates or approves of your Facebook post
– Share: someone reposts your Facebook post to their friends
– View: someone begins watching a video on YouTube
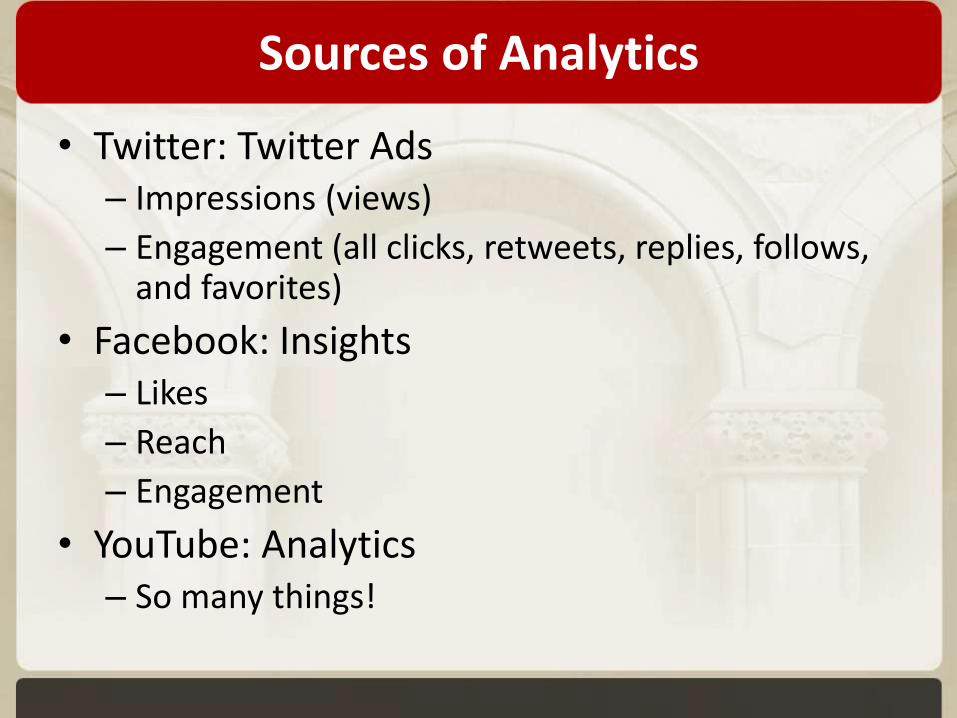
Sources of Analytics
• Twitter: Twitter Ads– Impressions (views)
– Engagement (all clicks, retweets, replies, follows, and favorites)
• Facebook: Insights– Likes
– Reach
– Engagement
• YouTube: Analytics– So many things!
Tracking
• Mandated by Web Communications
– Must be submitted monthly via Google Form
• We keep a separate copy for our reference
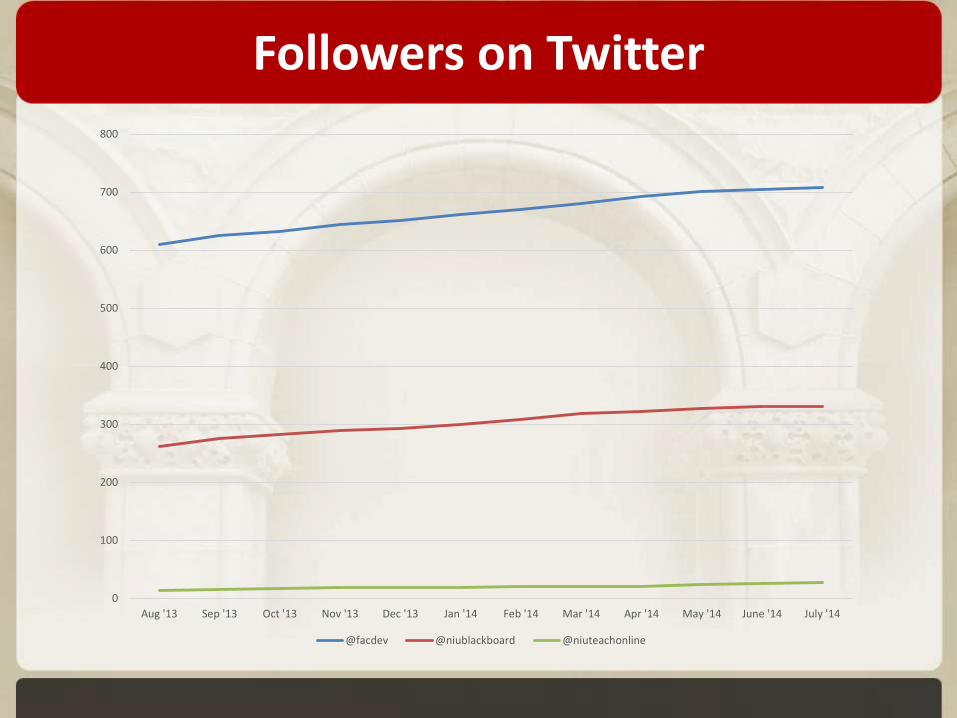
Followers on Twitter
0
100
200
300
400
500
600
700
800
Aug '13 Sep '13 Oct '13 Nov '13 Dec '13 Jan '14 Feb '14 Mar '14 Apr '14 May '14 June '14 July '14
@facdev @niublackboard @niuteachonline
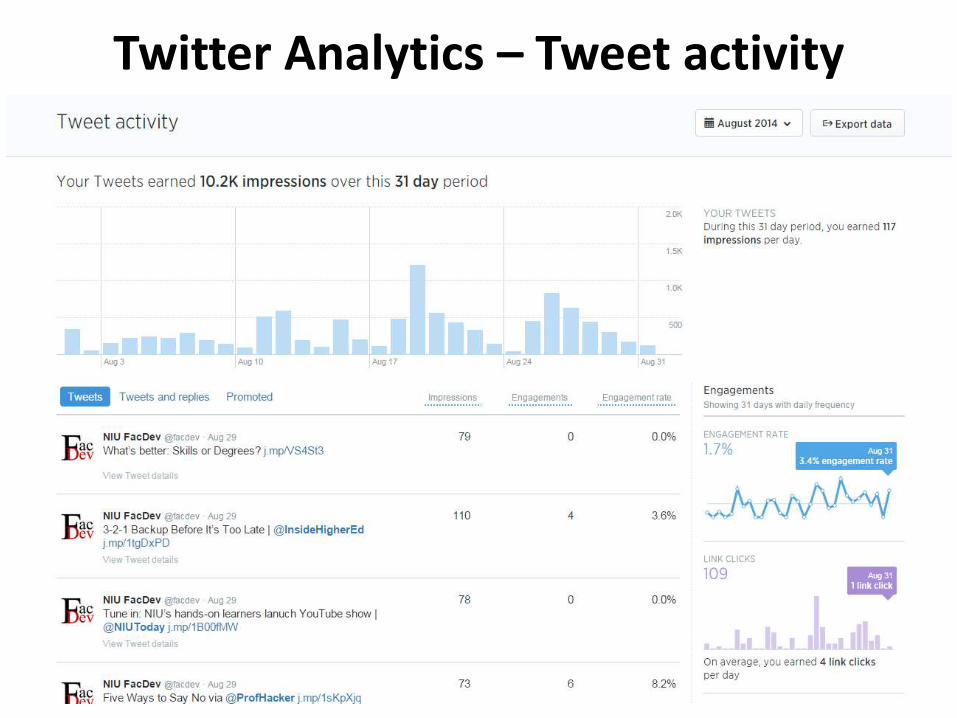
Twitter Analytics – Tweet activity
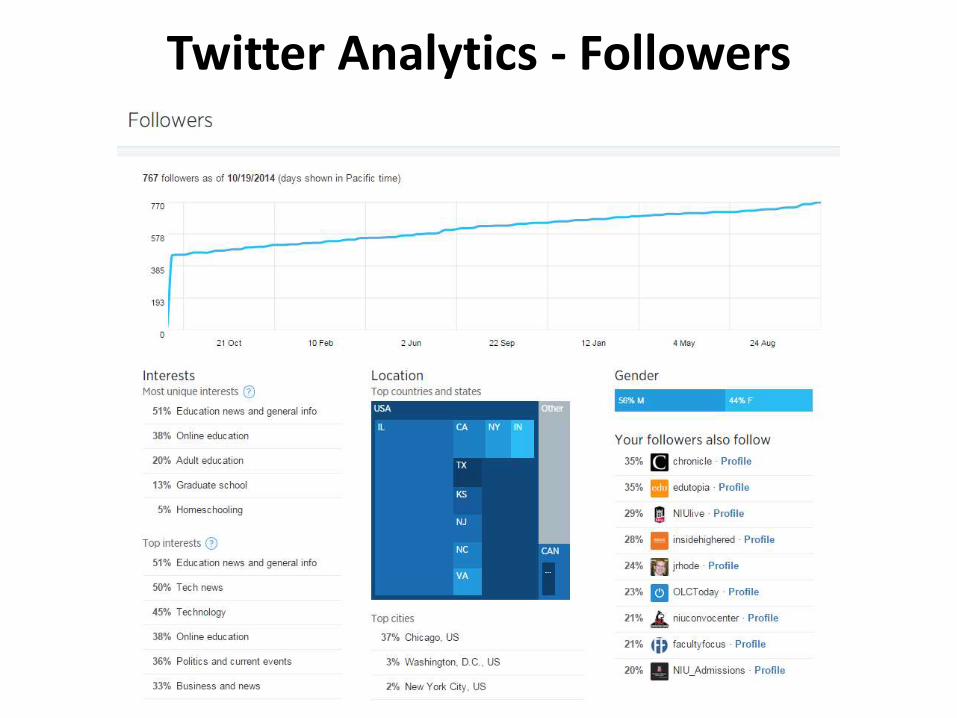
Twitter Analytics - Followers
150
155
160
165
170
175
180
185
190
195
200
8/13 9/13 10/13 11/13 12/13 1/14 2/14 3/14 4/14
facdev
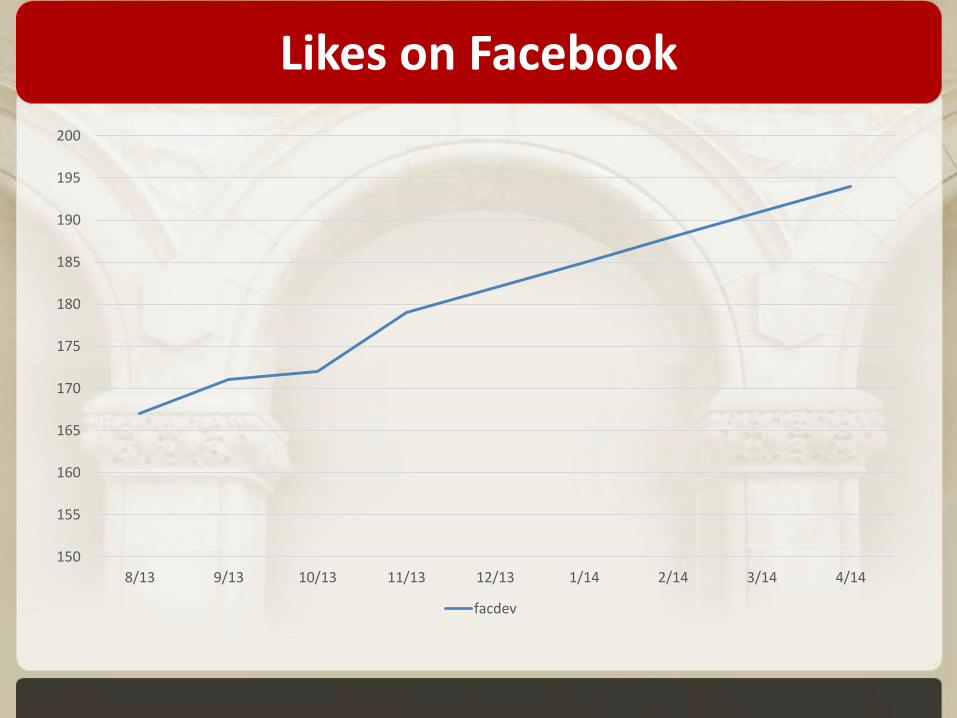
Likes on Facebook
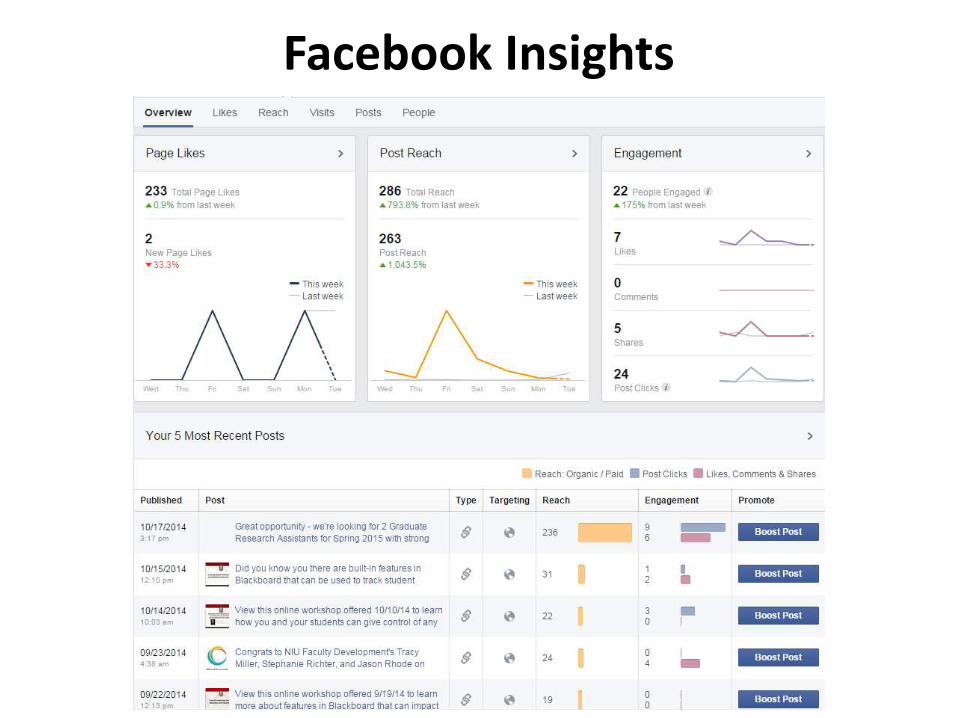
Facebook Insights
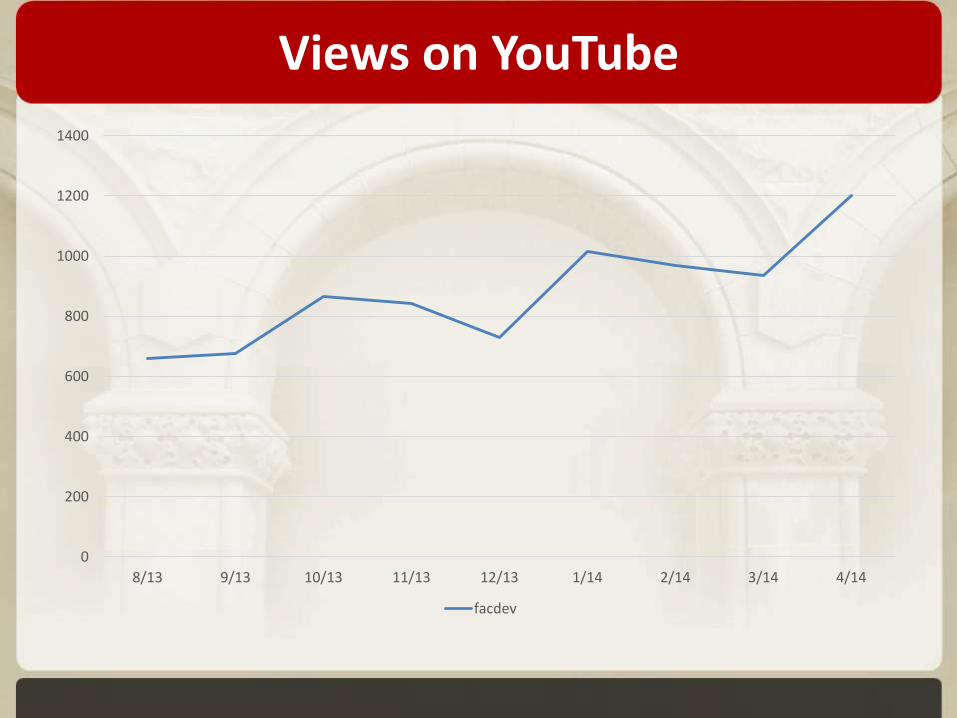
Views on YouTube
0
200
400
600
800
1000
1200
1400
8/13 9/13 10/13 11/13 12/13 1/14 2/14 3/14 4/14
facdev
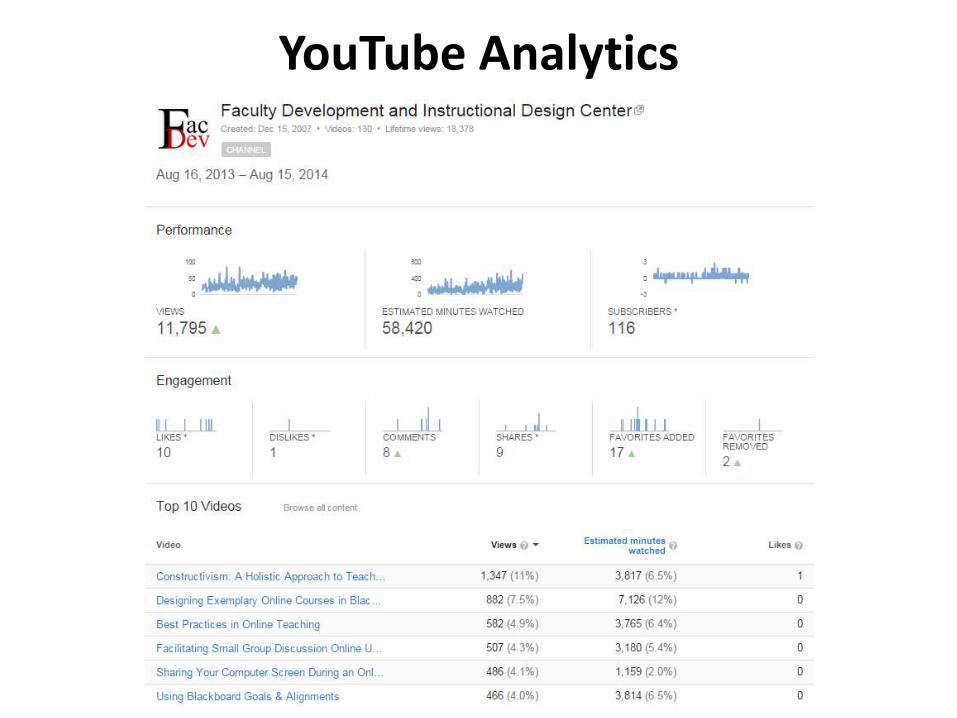
YouTube Analytics
Other Data Sources
• Authenticated resource tracking
• Online question submission
• Requests to use materials
• MailChimp
Conclusions
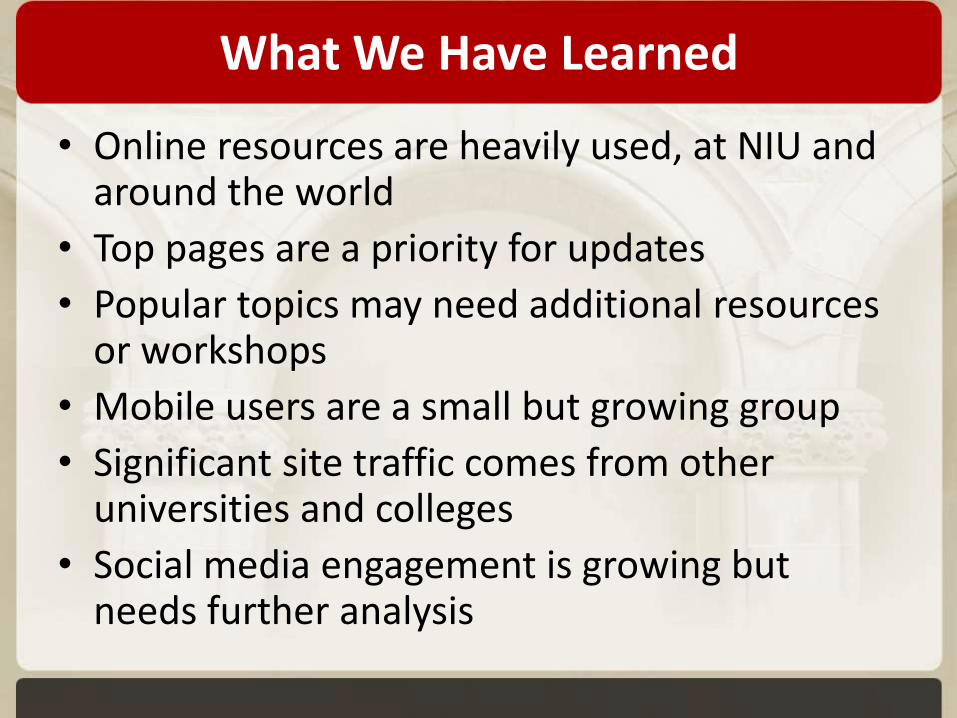
What We Have Learned
• Online resources are heavily used, at NIU and around the world
• Top pages are a priority for updates
• Popular topics may need additional resources or workshops
• Mobile users are a small but growing group
• Significant site traffic comes from other universities and colleges
• Social media engagement is growing but needs further analysis
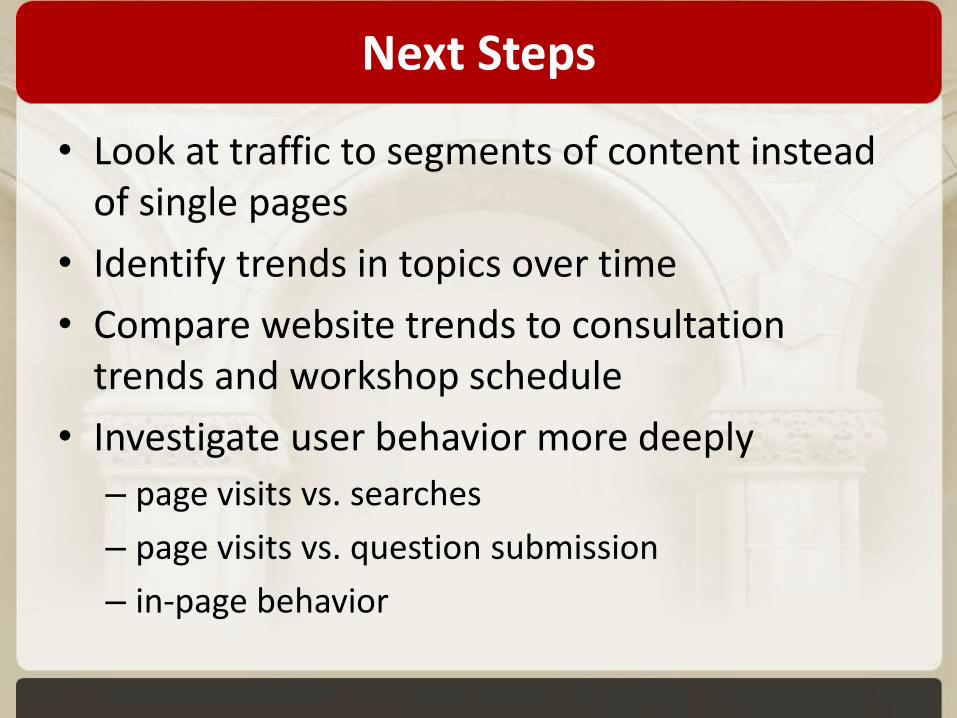
Next Steps
• Look at traffic to segments of content instead of single pages
• Identify trends in topics over time
• Compare website trends to consultation trends and workshop schedule
• Investigate user behavior more deeply
– page visits vs. searches
– page visits vs. question submission
– in-page behavior
Questions?
Stephanie Richter
[email protected]@slrichter
View the slides at facdev.niu.edu/pod14analytics
References
• Bichsel, J., 2012. Analytics in higher education: Benefits, barriers, progress, and recommendations. Louisville, CO: EDUCAUSE Center for Applied Research. Available from: http://net.educause.edu/ir/library/pdf/ERS1207/ers1207.pdf [Accessed 21 February 2014].