Oct 2016 DISCUSSION Levelised Cost of Energy (LCOE ... - Solar
Upload
truonghanhCategory
view
220download
1
Levelised Costs of Power Generation
4th SEE Energy Dialogue
Thessaloniki 3-4 June 2010
Dr. Nick F Frydas
Contents
• What are levelised costs?“Levelised cost of generation is the discounted lifetime cost ofowning and operating a generation asset expressed on a per unit ofoutput basis (£/MWh). - Busbar Cost – No externalities exceptCarbon Price
• Recent trends in EPC prices• Recent trends in EPC prices
• Build up of EPC and overnight capex costs
• Base case assumptions
• Outlook for levelised costs
Who is Mott MacDonald?
One of the world’s largest management, engineering
and development consultancies
active in power, oil & gas, water, transport, buildings, communication, education, health etc.
Leading capability in power covering renewables, thermal and nuclear
We work in over 140 countriesWe work in over 140 countries
From 200 permanent offices
On some 16,000 projects
Over 14,000 staff
Turnover of ~ $1.5bn

Power Sector – Our Services
Project initiation & development
Design & Design & construction
Commissioning & operation
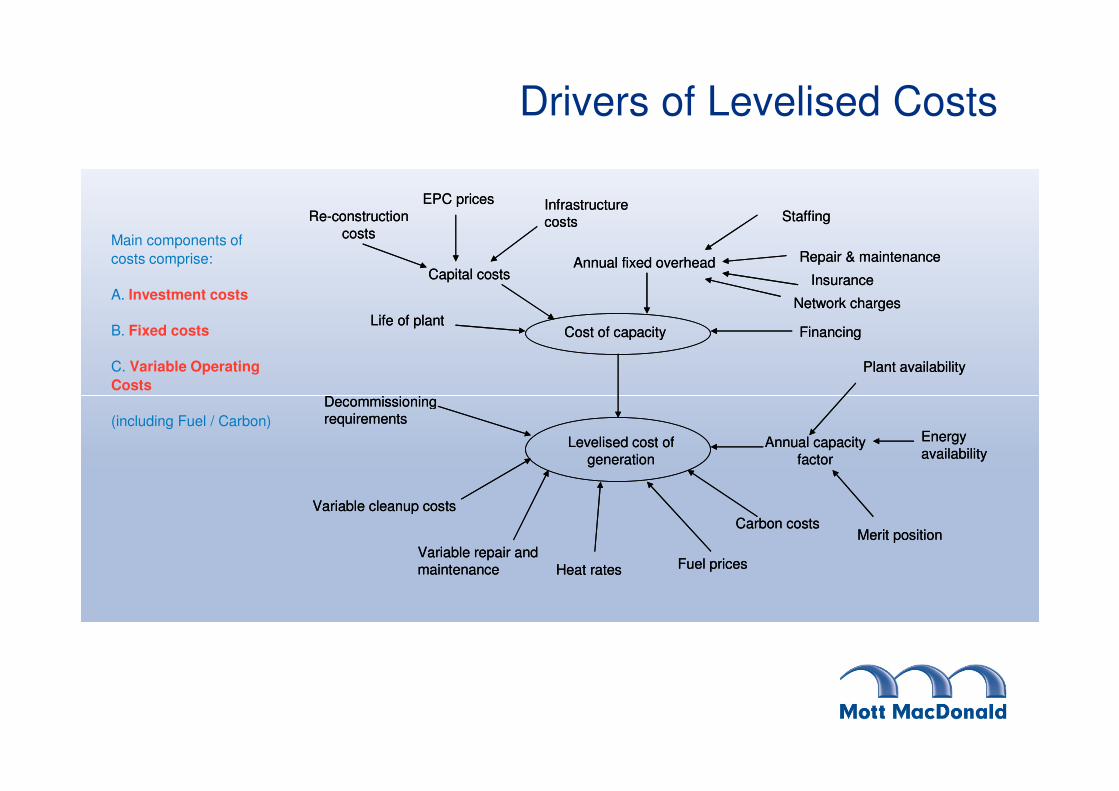
Drivers of Levelised Costs
Re-construction costs
EPC prices
Cost of capacity
Decommissioning
Plant availability
Financing
Annual fixed overhead
Staffing
Repair & maintenance
Insurance
Network chargesLife of plant
Capital costs
Infrastructure costsRe-construction
costs
EPC prices
Cost of capacity
Decommissioning
Plant availability
Financing
Annual fixed overhead
Staffing
Repair & maintenance
Insurance
Network chargesLife of plant
Capital costs
Infrastructure costs
Main components of
costs comprise:
A. Investment costs
B. Fixed costs
C. Variable Operating
Costs
Energy availability
Levelised cost of generation
Decommissioning requirements
Variable cleanup costs
Variable repair and maintenance Fuel prices
Carbon costs
Annual capacity factor
Merit position
Heat rates
Energy availability
Levelised cost of generation
Decommissioning requirements
Variable cleanup costs
Variable repair and maintenance Fuel prices
Carbon costs
Annual capacity factor
Merit position
Heat rates
(including Fuel / Carbon)

Levelised Cost - Main Components
• Pre-construction costs
• Capex including financing costs
• Annual overheads of plant (excludes central HQ
overheads)overheads)
• Variable non-fuel opex (var. O&M, ash disposal, etc.)
• Fuel and carbon
• CO2 transport and disposal
• Decommissioning

Technologies
Mainly looking “baseload” and >10MW
• CCGT, ASC Coal, IGCC + CCS variants
• Nuclear – EPR/AP1000
• Wind – on and offshore
• Biomass combustion 50MW/ 300MW
• Gas and biomass fired CHP
• Bio-methane (LFG, Sewage, AD of agri wastes)
• Hydro reservoir +PSP

Representative EPC prices: 1990-2009
EPC prices in nomial US Dollars
2000
2500
3000
3500U
S$/k
W
CCGT
Coal Plant
Hydro
0
500
1000
1500
1990
1992
1994
1996
1998
2000
2002
2004
2006
2008
US
$/k
W

Coal has developed a huge premium versus CCGT
Coal's EPC premium versus CCGT
1500
2000
0
500
1000
1990 1992 1994 1996 1998 2000 2002 2004 2006 2008
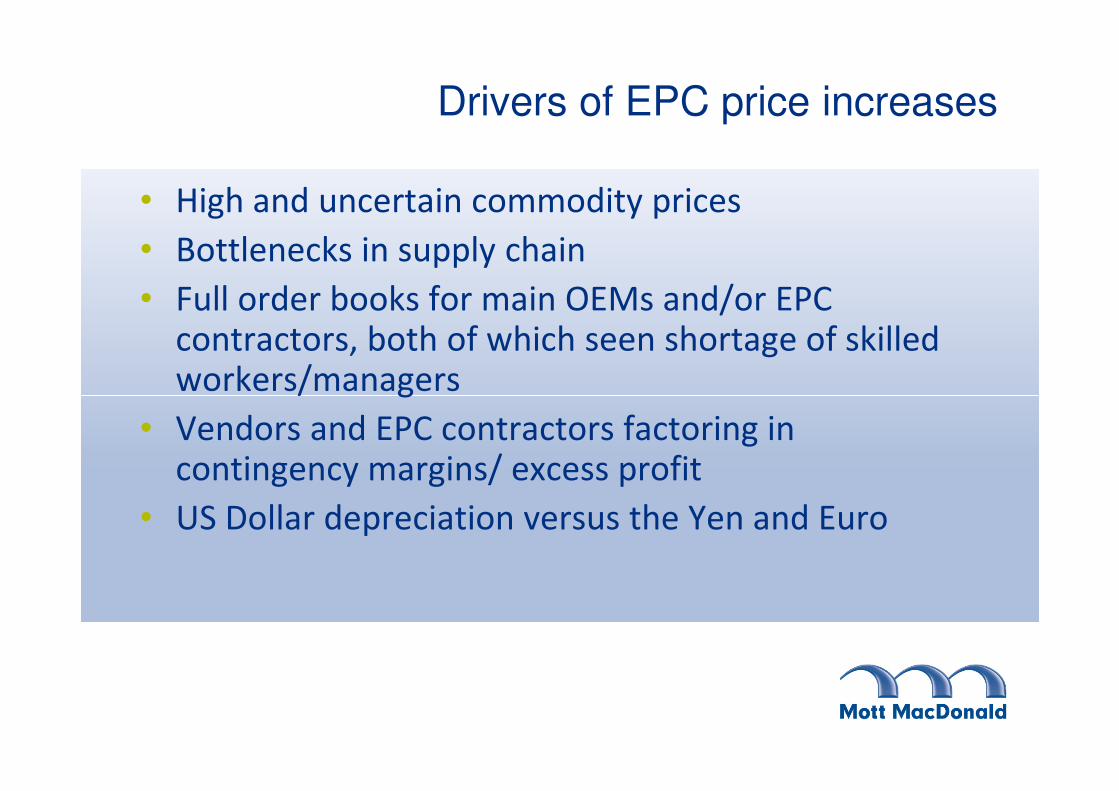
Drivers of EPC price increases
• High and uncertain commodity prices
• Bottlenecks in supply chain
• Full order books for main OEMs and/or EPC contractors, both of which seen shortage of skilled workers/managersworkers/managers
• Vendors and EPC contractors factoring in contingency margins/ excess profit
• US Dollar depreciation versus the Yen and Euro

Other drivers of EPC costs
• Hardware/process complexity
• Economies of scale
• Maturity of technology
• Jurisdictional risk• Jurisdictional risk

EPC options and costs by fuel type
Nuclear
Demanding biomass waste
Sewage gasMSW
Woody biomass
Easy biomass waste
CoalCoal
HFO
Landfill gas
Diesel
Natural gas
Industrial
GT Gas engine Aero GT
Large
boiler ST
Small boiler
ST

Indicative build-up of nuclear plant costs: $/kW
FOAK build up
Cost to build 3500
FOAK premium 700
Contractor's normal profit 300
OEM's risk premium 250OEM's risk premium 250
Headline EPC price 4750
Owners allowed contingency 750
Unallocated over-runs 500Total overnight EPC cost 6000
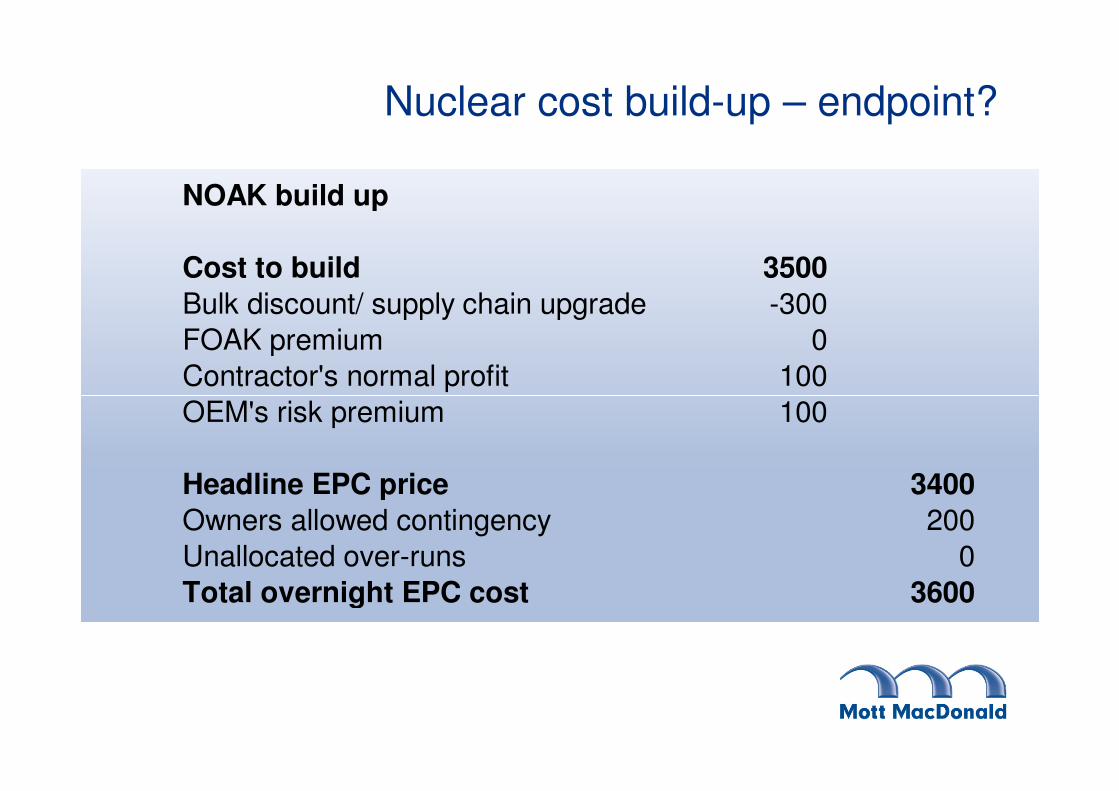
Nuclear cost build-up – endpoint?
NOAK build up
Cost to build 3500
Bulk discount/ supply chain upgrade -300
FOAK premium 0
Contractor's normal profit 100
OEM's risk premium 100
Headline EPC price 3400
Owners allowed contingency 200
Unallocated over-runs 0
Total overnight EPC cost 3600

Fixed opex
• What drives fixed opex? Core operating and
maintenance linked to specific capex cost (EPC
costs) – Insurance also?
• Some items like TNUoS and rates linked to • Some items like TNUoS and rates linked to
MW
• Seems to have risen with EPC prices
• Varies between 1.5% and 8% of capex

Base Case Assumptions
• Discount rate: 10%
• Used economic plant lives rather than loan terms
• Fuel prices taken from DECC projections – all scenarios higher than pre-2005 averagescenarios higher than pre-2005 average
• Carbon prices - MM central case £32/t
• General EPC prices – softening in medium term, then level

Fuel prices
DECCs high, mid and low coal and gas price
projections
150
200
Co
al:
$/t
@25G
J A
RA
(so
lid
lin
es)
0.75
1.00
Gas:
£/t
herm
NB
P (
bro
ken
lin
e)
Mid case has coal at £2.25/GJ
0
50
100
2009 2014 2019 2024 2029 2034 2039 2044 2049
Co
al:
$/t
@25G
J A
RA
(so
lid
lin
es)
0.00
0.25
0.50
Gas:
£/t
herm
NB
P (
bro
ken
lin
e)
at £2.25/GJ ($80/t) versus gas at £7.70/GJ (73ppt).

Carbon prices: £/tCO2, DECC versus MM
150
200
250
300
-
50
100
2009 2014 2019 2024 2029 2034 2039 2044 2049

Base Case Results
• ASC Coal and CCGT are lowest cost of main technologies excluding carbon, at £62/MWh
• Adding carbon at average price of €32/t makes CCGT least cost, at £74/MWh versus £82/MWh for coal (£108/MWh)
• CCGT+CCS and least cost coal+CCS costs £104-115/MWh, well above nuclear at under £99/MWh – In the longer term nuclear becomes the Least Cost Option at £67/MWhnuclear becomes the Least Cost Option at £67/MWh
• On-shore wind sits between ASC coal and nuclear at £94/MWh, while offshore wind well over CCS options at £157-185/MWh (£110-125/MWh)
• Biomass CHP with 50% steam credit < £70/MWh (£102/MWh)
• LFG/SG < £60/MWh

LEC main technologies, Base case – 2009 start
80
100
120
140
160
180
200
£/M
Wh
Capital Costs Fixed operating Costs Variable Operating Costs Fuel Costs
Carbon Costs Decomm and w aste fund CO2 transport and storage
-
20
40
60
Ga
s P
lan
t - CC
GT
Ga
s P
lan
t - CC
GT
with
CC
S
Co
al P
lan
t - Pu
lve
rsie
d
fue
l, AS
C w
ith F
GD
Co
al P
lan
t - Pu
lve
rsie
d
fue
l, AS
C w
ith F
GD
an
d C
CS
Co
al P
lan
t - Pu
lve
rsie
d
fue
l, AS
C w
ith F
GD
an
d re
tro-fitte
d C
CS
Co
al P
lan
t - IGC
C
Co
al P
lan
t - IGC
C w
ith
CC
S
Win
d - O
ns
ho
re W
ind
Win
d - O
ffsh
ore
Win
d
Win
d - O
ffsh
ore
Win
d
R3
Nu
cle
ar - C
om
pa
ct
mo
du
lar P
WR

LEC premium versus CCGT, main technologies, Base case – 2009 start
40
60
80
100
120
0
20
40
Gas
Pla
nt -
CC
GT
CC
GT+C
CS
ASC
Coa
lC
oal+
CC
SC
oal+
CC
S retro
IGC
CIG
CC
+CC
SO
nsho
re w
ind
Offs
hore
win
dR
3 of
fsho
reN
ucle
ar P
WR
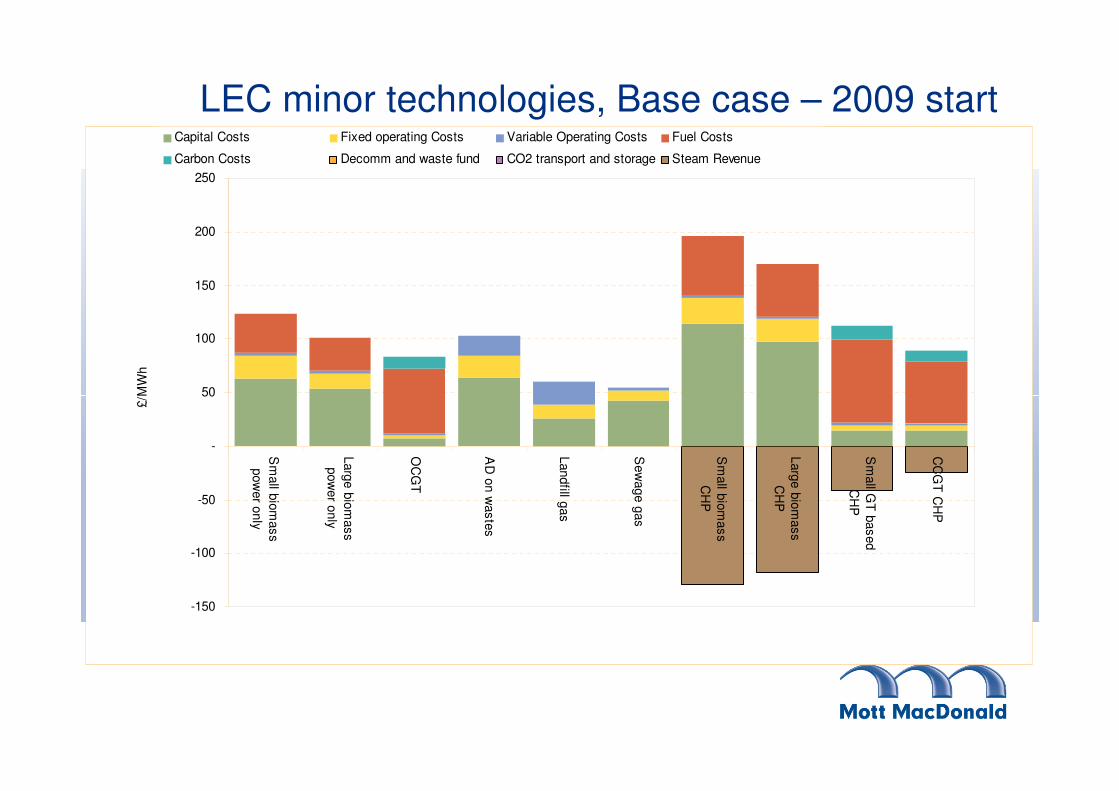
LEC minor technologies, Base case – 2009 start
50
100
150
200
250
£/M
Wh
Capital Costs Fixed operating Costs Variable Operating Costs Fuel Costs
Carbon Costs Decomm and waste fund CO2 transport and storage Steam Revenue
-150
-100
-50
-
50
Sm
all b
iom
ass
pow
er o
nly
Larg
e b
iom
ass
pow
er o
nly
OC
GT
AD
on w
aste
s
Landfill g
as
Sew
age g
as
Sm
all b
iom
ass
CH
P
Larg
e b
iom
ass
CH
P
Sm
all G
T b
ased
CH
P
CC
GT
CH
P
£/M
Wh

LEC premium versus CGGT, Base case – 2009 start
20
30
40
50
60
-30
-20
-10
-
10
Small
biomass
power
only
Large
biomass
power
only
OCGT AD on
wastes
Landfill
gas
Sewage
gas
Small
biomass
CHP
Large
biomass
CHP
Small GT
based
CHP
CCGT
CHP

LEC main technologies, project start 2020
60
80
100
120
140
£/M
Wh
Capital Costs Fixed operating Costs Variable Operating Costs Fuel Costs
Carbon Costs Decomm and w aste fund CO2 transport and storage
-
20
40
Ga
s P
lan
t - CC
GT
Ga
s P
lan
t - CC
GT
with
CC
S
Co
al P
lan
t - Pu
lve
rsie
d
fue
l, AS
C w
ith F
GD
Co
al P
lan
t - Pu
lve
rsie
d
fue
l, AS
C w
ith F
GD
an
d C
CS
Co
al P
lan
t - Pu
lve
rsie
d
fue
l, AS
C w
ith F
GD
an
d re
tro-fitte
d C
CS
Co
al P
lan
t - IGC
C
Co
al P
lan
t - IGC
C w
ith
CC
S
Win
d - O
ns
ho
re W
ind
Win
d - O
ffsh
ore
Win
d
Win
d - O
ffsh
ore
Win
d
R3
Nu
cle
ar - C
om
pa
ct
mo
du
lar P
WR
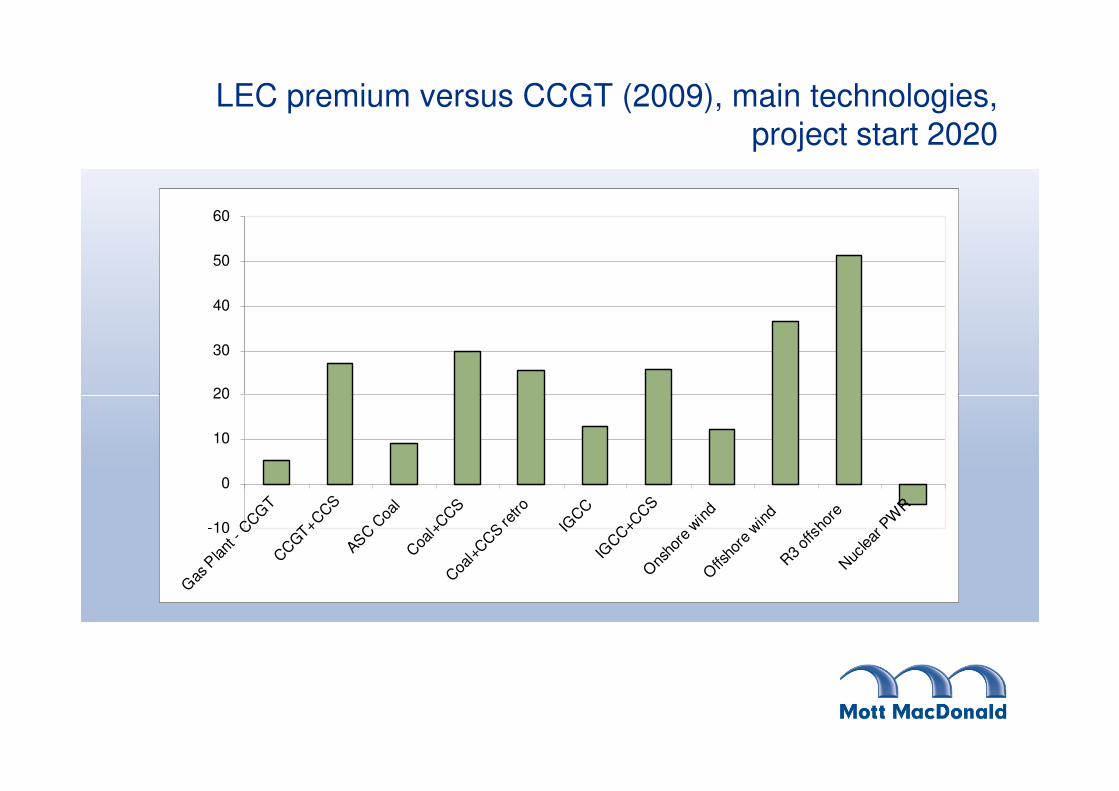
LEC premium versus CCGT (2009), main technologies, project start 2020
20
30
40
50
60
-10
0
10
20
Gas
Pla
nt -
CC
GT
CC
GT+C
CS
ASC
Coa
lC
oal+
CC
SC
oal+
CC
S retro
IGC
CIG
CC
+CC
SO
nsho
re w
ind
Offs
hore
win
dR
3 of
fsho
reN
ucle
ar P
WR

LEC minor technologies, project start 2020
50
100
150
200
£/M
Wh
Capital Costs Fixed operating Costs Variable Operating Costs Fuel Costs
Carbon Costs Decomm and waste fund CO2 transport and storage Steam Revenue
-150
-100
-50
- Sm
all b
iom
ass
pow
er o
nly
Larg
e b
iom
ass
pow
er o
nly
OC
GT
AD
on w
aste
s
Landfill g
as
Sew
age g
as
Sm
all b
iom
ass
CH
P
Larg
e b
iom
ass
CH
P
Sm
all G
T b
ased
CH
P
CC
GT
CH
P
£/M
Wh

LEC premium versus CCGT (2009), minor technologies, project start 2020
-10
-
10
20
30
40
Small
biomass
Large
biomass
OCGT AD on
wastes
Landfill
gas
Sewage
gas
Small
biomass
Large
biomass
Small GT
based
CCGT
CHP
-60
-50
-40
-30
-20
-10 biomass
power
only
biomass
power
only
wastes gas gas biomass
CHP
biomass
CHP
based
CHP
CHP

Results using DECC assumptions – main technologies
100
120
140
160
180
200
-
20
40
60
80
100
Current 2009 2013 2017 2017 all NOAK 2023 all NOAK
Gas - CCGT Gas - CCGT with CCS
ASC Coal - with FGD ASC Coal - with FGD and CCS
Coal - IGCC Coal - IGCC with CCS
Onshore Wind Offshore Wind
Offshore Wind R3 Nuclear - PWR
Conclusions
• Levelised costs for new plant will be higher than current prices
• CCGT will be the benchmark to beat in near to medium term –ASC coal £9/MWh above this, while nuclear and coal+CCS are £27-60/MWh above
• As nuclear, CCS and offshore wind move to NOAK status costs will fall markedlywill fall markedly
• In longer term nuclear looks a good deal and should substantially undercut CCS and offshore wind, and could even be less than CCGT without CCS
• But high FOAK premium creates special funding challenge for first units, even assuming all benign regulatory and market environment