Level of Service Delivery of Public Transport and Mode Choice in … · 2016-03-10 · Level of...
93
Level of Service Delivery of Public Transport and Mode Choice in Accra, Ghana. Level of Service Delivery of Public Transport and Mode Choice in Accra, Ghana. MSc Programme in Urban Management and Development Rotterdam, The Netherlands September 2014 Thesis Title: Level of service delivery of public transport and mode choice in Accra, Ghana. Name: Dora Birago Supervisor: Somesh Sharma Specialization: Managing and Financing Urban Infrastructure UMD 10
Transcript of Level of Service Delivery of Public Transport and Mode Choice in … · 2016-03-10 · Level of...
Level of Service Delivery of Public Transport and Mode Choice in Accra, Ghana. Level of Service Delivery of Public Transport and Mode Choice in Accra, Ghana.
MSc Programme in Urban Management and Development
Rotterdam, The Netherlands
September 2014
Thesis Title: Level of service delivery of public transport and mode choice in Accra, Ghana.
Name: Dora Birago
Supervisor: Somesh Sharma
Specialization: Managing and Financing Urban Infrastructure
UMD 10
Level of Service Delivery of Public Transport and Mode Choice in Accra, Ghana ii
MASTER’S PROGRAMME IN URBAN MANAGEMENT AND DEVELOPMENT
(October 2013 – September 2014)
Title Level of Service Delivery of Public Transport and
Mode Choice in Accra, Ghana.
Name: Dora Birago
Country
Ghana
Supervisor: Somesh Sharma
UMD 10 Report number:
Rotterdam, September 2014
Level of Service Delivery of Public Transport and Mode Choice in Accra, Ghana iii
Summary
Increasing motorisation and its resultant effects such as congestion and pollution has underscored the need for a shift towards the use of more sustainable modes of transport such as public transport. Worsening traffic congestion and air quality have been associated with the proliferation of informal operation of private microbus and minibus in most African cities, of which Accra is no exception. It is recognised that large buses hold the promise of relieving the growing congestion of African cities if they are managed efficiently and sustainably. The Metro Mass Transit Limited (MMT) was established in response to public concerns about increasing traffic congestion and transport fares posed mostly taxis and mini-buses which dominate public transport in Ghana. The establishment of the company was also to bring instant relief to travellers especially in Metropolitan and Municipal areas by promoting mass transportation. However, over a decade after its establishment and its provision of intra-city bus services, it is recognised that mini-bus (trotro) is still the most preferred mode for trips in major cities of the country such as Accra, while the MMT has the least modal share among public transport modes.
It is against this backdrop that this study sought to explain why commuters in Accra do not prefer to use public bus transport service for intra-city commuting. A revealed preference survey was administered to 134 commuters in Accra to find out their perception of the level of service delivery of MMT and the reasons behind their non-preference of its service. A semi-structured interview guide was also used to collect information from the MMT as a services provider. Data was analysed and interpreted using the Statistical Package for Social Sciences (SPSS), employing both descriptive and inferential statistics such as independent sample tests and analysis of variance (ANOVA).
The study revealed that indeed, mini-buses are still the most frequently used mode of transport in the city of Accra. Commuters perceived that MMT’s service delivery was poor in their of travel time, accessibility, comfort, reliability and to a lesser aesthetics in terms of vehicle and waiting area cleanliness. Contrastingly, there is a general consensus among commuters that MMT’s service delivery in terms of fares were excellent, offering a fare 20 percent cheaper than other mode. The study further revealed that the main reasons why commuters did not patronise MMT’s service lied in the over-crowded of bus, the non-adherence to time schedule, long in-vehicle time, and the perception of not getting access to a seat, the non-availability of the bus at respondents’ origins and destinations, accessibility of alternative modes, long waiting times for the bus; all of which are reflected in the commuters poor perception of MMT..
It is recommended that for MMT to increase its modal share, it should firstly improve on travel time especially in-vehicle time and waiting time at stations, comfort on buses in terms of seat access, crowding and noise level, reliability and accessibility since these are important considerations to its choice as a primary intra-city among commuters. It is also recommended that review its pricing system to enable it delivery the required level of service expected by commuters. With this it is further recommended that MMT conducts a willingness to pay for improved service delivery among commuters. Implementing these would contribute to achieving the objective of promoting mass transit in Accra by shifting people from the use of unsustainable modes such as mini-buses and taxis to the use of efficient high capacity systems as MMT.
Keywords: Public transport; Level of Service; Perception; Mode choice; Metro Mass Transit
Level of Service Delivery of Public Transport and Mode Choice in Accra, Ghana iv
Acknowledgements
For by your mercies, we are not consumed. Your compassions has brought me this far. I am most grateful to you, God.
My great appreciation to The Netherlands government and NUFFIC for the financial support, without which this masters study would not have been realised.
I would like to offer special thanks to Somesh Sharma and Taslim Alade, my research supervisor and co-supervisor, for their guidance in producing this research. My grateful thanks are also extended to Mark Brussel for his valuable and constructive suggestions in this work. I also would like to thank all the staff of Institute for Housing and Urban Development their support and warmth during this one year study period.
To all my friends, family and colleagues, Ablin Consult Engineers and Planners Limited; none left out I am so grateful for your encouragement, prayers and good wishes and support during my studies.
Level of Service Delivery of Public Transport and Mode Choice in Accra, Ghana v
Abbreviations
ANOVA Analysis of variance
CEN European Committee for Standardization
CST Centre for Sustainable Transport
ERTRAC European Road Transport Research Advisory Council
GHG Greenhouse Gas
GPRTU Ghana Private Road Transport Union
GSS Ghana Statistical service
HCM Highway Capacity Manual
IHS Institute for Housing and Urban Development
LOS Level of Service Delivery
MMT Metro Mass Transit Limited
MoT Ministry of Transport
QOS Quality of service
SPSS Statistical Package for Social Sciences
SSNIT Social Security and National Insurance Trust
SUV Sport Utility Vehicles
TUC Trades Union Congress
UATP International Association of Public Transport
UK United Kingdom
UN United Nations

Level of Service Delivery of Public Transport and Mode Choice in Accra, Ghana vi
Table of Contents Summary ................................................................................................................................. iii
Acknowledgements ................................................................................................................. iv
Abbreviations ........................................................................................................................... v
List of Tables .......................................................................................................................... vii
List of Charts ........................................................................................................................ viii
List of Figures ....................................................................................................................... viii
Chapter 1: Introduction .......................................................................................................... 1
1.1 Background of Study .................................................................................................................... 1 1.2 Problem Statement ........................................................................................................................ 2 1.3 Research Objective ....................................................................................................................... 3 1.4 Main Research Question ............................................................................................................... 4 1.4.1 Sub Research Questions ............................................................................................................ 4 1.5 Significance of the study .............................................................................................................. 4 1.6 Scope and Limitations of the study .............................................................................................. 4
Chapter 2: Literature Review ................................................................................................. 5
2.1 Introduction .................................................................................................................................. 5 2.2 Urban Public Transport Systems .................................................................................................. 5
2.2.1 Modes of Urban Public Transport .......................................................................................................... 6 2.2.2 Characteristics of Public Transport Services .......................................................................................... 6 2.2.3 Sustainable Urban Public Transportation ............................................................................................... 7
2.3 Travel Behaviour ........................................................................................................................ 8 2.4 Factors that Affect Choice of Travel Mode ................................................................................ 10 2.5 Transit Level of Service (LOS) .................................................................................................. 11
2.5.1 Evaluating LOS ..................................................................................................................................... 12 2.6 Empirical Literature Review....................................................................................................... 15 2.7 Conceptual Framework ............................................................................................................... 17
Chapter 3: Research Design and Methods .......................................................................... 18
3.1 Introduction ................................................................................................................................ 18 3.2 Operationalization of Variables and Indicators .......................................................................... 18 3.3 Research strategy ........................................................................................................................ 19
3.3.1 Research Techniques ............................................................................................................................. 19 3.4 Data Collection Methods and Sampling ..................................................................................... 21
3.4.1 Sampling techniques and Sample size selection .................................................................................. 21 3.4.2 Data Collection Methods and Instruments ........................................................................................... 21
3.5 Validity and reliability ................................................................................................................ 22 3.6 Data Analysis Techniques .......................................................................................................... 23
Chapter 4: Research Findings .............................................................................................. 24
4.1 Introduction .............................................................................................................................. 24 4.2 Public Transport in Accra ....................................................................................................... 24
4.2.1 The Metro Mass Transit (MMT) Limited ............................................................................................. 24 4.2.2 Operations of MMT .............................................................................................................................. 25
4.3 Demographic and Travel Characteristics of Respondents ................................................... 25 4.3.1 Demographic Characteristics of Respondents ...................................................................................... 25 4.3.2 Trip Characteristics of Respondents ..................................................................................................... 27
4.3.2 .1 Frequency of Travel by Mode Type ............................................................................................ 28 4.3.2 .2 Purpose of Travel by Type of Mode ............................................................................................. 29 4.3.2 .3 Purpose of Mini-bus use ............................................................................................................... 30

Level of Service Delivery of Public Transport and Mode Choice in Accra, Ghana vii
4.3.2 .4 Purpose of MMT bus use .............................................................................................................. 31 4.3.2 .4 Purpose of Private car use ........................................................................................................... 31 4.3.2 .5 Purpose of Motorcycle use ........................................................................................................... 32 4.3.2 .6 Combination of modes for travel ................................................................................................. 32
4.4 Perception of the Level of Service delivery of MMT among commuters in Accra.................... 33 4.4.1 Level of service rating by Respondents ................................................................................................ 34
4.5 Preference of MMT bus as a primary Intra-city Transport Mode .............................................. 36 4.5.1 Reasons for Non-preference of MMT bus Services ............................................................................. 36
Chapter 5: Conclusions and recommendations .................................................................. 45
5.1 Introduction ................................................................................................................................ 45 5.2 Analysis of the Data ................................................................................................................... 45 5.3 Travel by Public Transport ......................................................................................................... 45 5.4 Perception of Level of Service of Metro Mass Transit ............................................................... 46 5.4 Perceived Level of Service and Patronage of Public Transport - Reasons for Metro Mass Transit Non-usage ............................................................................................................................. 47 5.5 Recommendations and Conclusion ............................................................................................. 48
Bibliography ........................................................................................................................... 50
Appendix 1: Frequently used Modes of Transport ............................................................. 54
Appendix 2: Perception of LOS by User group .................................................................. 55
Appendix 3: Discouraging factors of MMT use .................................................................. 58
Appendix 4: Post Hoc Tests (Respondent Category) .......................................................... 61
Appendix 5: Independent Samples Test (Gender) .............................................................. 64
Appendix 6: Post Hoc Tests (Age Categories) ..................................................................... 66
Appendix 7: Post Hoc Tests (Income Categories) ............................................................... 67
Annex 1: Research Instruments ........................................................................................... 69
Annex 1A: Questionnaire for Commuters ........................................................................................ 69 Annex 1B: Interview Guide for Mero Mass Transit Limited ........................................................... 84
List of Tables
Table 1: Operationalization of Variables and Indicators ......................................................................................................... 19
Table 2: Employment Status of Respondents ............................................................................................................................ 26
Table 3: Monthly Income Range of Respondents ..................................................................................................................... 26
Table 4: Purpose of Travel by MMT (Frequent users) ............................................................................................................. 31
Table 5: Purpose of Travel by MMT (Occasional users).......................................................................................................... 31
Table 6: Cost of Travel per single trip ....................................................................................................................................... 33
Table 7: Reasons for non-use of MMT ...................................................................................................................................... 37
Table 8: ANOVA results of Respondents Perception of MMT's LOS ................................................................................. 42

Level of Service Delivery of Public Transport and Mode Choice in Accra, Ghana viii
List of Charts
Chart 1: Modes of Transports used by Respondents * .......................................................................................................... 27
Chart 2: Frequency of Taxi use ................................................................................................................................................ 28
Chart 3: Frequency of mini-bus use ........................................................................................................................................ 28
Chart 4: Frequency of private car use ..................................................................................................................................... 29
Chart 5: Frequency of MMT use ............................................................................................................................................. 29
Chart 6: Purpose of travel by taxi ............................................................................................................................................ 30
Chart 7: Purpose of Travel by mini-bus .................................................................................................................................. 30
Chart 8: Purpose of private car use ......................................................................................................................................... 32
Chart 9: Combination of modes for travel .............................................................................................................................. 32
Chart 10: LOS rating by all Users ........................................................................................................................................... 35
Chart 11: Discouraging factors for MMT use ........................................................................................................................ 38
Chart 12: Most Important LOS Factors of Non-users .......................................................................................................... 38
Chart 13: Reasons for MMT use by Frequent users .............................................................................................................. 39
Chart 14: Reasons for MMT use by Occasional users ........................................................................................................... 39
Chart 15: Discouraging Factors - Frequent users .................................................................................................................. 40
Chart 16: Discouraging Factors - Occasional users ............................................................................................................... 40
List of Figures
Figure 1: Conceptual Framework ............................................................................................................................................ 17
Figure 2: Map of Accra, showing data collection points ....................................................................................................... 22
Figure 3: MMT buses at a terminal ......................................................................................................................................... 28
Figure 4: Passengers waiting bus at MMT Terminal ............................................................................................................ 35
Figure 5: An over-crowded MMT Bus .................................................................................................................................... 36
Level of Service Delivery of Public Transport and Mode Choice in Accra, Ghana 1
Chapter 1: Introduction
This chapter gives a general overview of the study, underlining the background, problem statement and research objective. It also outlines the research questions, significance of the study and concludes with the scope and limitations of the study.
1.1 Background of Study
The concept of sustainable development advocates the need to seek a balance between economic, environmental and social objectives of development due to the irreversible damage to the human environment resulting from a world in which more emphasis have been placed on economic prosperity to the detriment of environment and concern for others. The contribution of transportation sector to the sustainability of cities have been widely recognised. It has been inseparably linked to the climate-change challenge since it is currently responsible for 13 percent of Greenhouse Gas (GHG) emissions worldwide and 23 percent of total energy-related GHG emissions (UN Habitat, 2011, cited in Cervero (2013). The main causal factor been increasing motorisation and its resultant effects of congestion, pollution among others. The way forward has been a shift towards more sustainable modes of transport such as public transport and the integration of non-motorised transport. The importance of public transport cannot be underestimated. According to Cervero (2013, citing Pourbaix, 2011), roughly about 16 percent of the 7.5 billion trips made in urban areas world-wide in 2005, were by some form of public transport (i.e., formal, institutionally recognized services, such as local buses and rail transit). The rapid urban growth globally, especially in developing countries, coupled with low per capita income, and low automobile ownership in most of these cities means that the population will continue to rely heavily on public transport to meet their daily mobility needs (Kumar et al, 2004). According to Munzilah et al, (2012) public bus operation plays an important role to provide transport for commuting passengers across the world. Their study state that in London (UK), buses are by far the most used mode of public transport because of its flexibility, high availability and accessibility. They further note that public bus service in Kuala Lumpur (Malaysia) is normally preferred due to its cheaper cost and the better coverage of areas compared to other types of public transport such as trains and air travel. According to Phanikumar and Maitra (2006), “travel needs in developing countries are largely served by public transportation systems, especially bus transportation systems”. As Kumar and Barrett, (2008) also observed, “buses (both) large and small are the most common mode of public transit in most cities, (even though) mini-buses are much more prevalent than large buses”. As stated by the authors, “the key advantage of small vehicles is their speed, their operability on narrow and congested streets, and their ability to make a profit serving outlying areas with low passenger density”. It can also be said that mini-buses are more demand responsive and can be operated much more flexibly. van As and Joubert, (1990), add that the use of low volume vehicles such as mini-buses also tends to be appropriate in low density situations because they can offer a more direct route between origin-destination pairs while at the same time operating relatively full. The advantages of large buses however cannot be overstated. As noted by the authors, “large buses provide greater comfort, safety, and speed than minibuses particularly on high-density corridors, if they can be managed efficiently and sustainably”. Thus holding the promise of relieving the growing congestion of African cities. In high density environments, as exists in most African cities, they are no longer appropriate because they require more space to carry the same number of passengers
Level of Service Delivery of Public Transport and Mode Choice in Accra, Ghana 2
as high volume modes which can carry passengers at a lower cost, when they operate relatively full (van As and Joubert, 1990).
Worsening traffic congestion and air quality have been associated with the proliferation of informal operators, such as the private microbus and minibus in most African cities. In addition to this, these mini-buses have been said to be typically composed of second-hand vehicles which are inadequately maintained; operated for long hours at low speed as well as characterised by unpredictability of routes, schedules, and fares which present clear disadvantages from the perspective of the public interest. These characteristics notwithstanding, twice as many trips are taken by minibus than by large bus in most African cities (Kumar and Barrett 2008).
Beirão and Cabral, (2005) underscore the fact that choosing one mode of transport over another is an essential issue in understanding travel behaviour even though travel behaviour is said to be complex. This is due to the fact that “for each journey, people have the choice between different transport modes, each one having specific characteristics, advantages and disadvantages, and costs” (Beirão and Cabral, 2005). Most travel behaviour literature indicates that travellers’ mode choice is not only dependent on their socioeconomic backgrounds, journey characteristics, and the characteristics of the transport facility but also perception of particular modes plays a significant role in affecting travellers’ mode choice (Gebeyehu and Takano, 2007). Beirão and Cabral, (2007 citing Ajzen, 1991; Fujii and Kitamura, 2003) also note that travel behaviour is influenced by the level of service of a transport system which in turn is also influenced by psychological factors of perceptions, attitudes and habits. Level of service measures, also known as quality of service, as defined by Kanafani and Wang, (2010), “represent a set of all the measures of performance needed for transportation analysis and reflect primarily the attributes of the system that affect user perception of the quality of service”.
It is therefore important for service providers to identify the most important attributes of service levels (considered quality of service from the passenger’s point of view) perceived by both current and potential users. Since different user segments are influenced by different service attributes with significant difference between different segments, it is essential to understand how different user segments evaluate the same service quality. For public transport finding out how non-users perceptions are “important in understanding the reasons for non-use; how they would feel if they had to use public transport; and also what would make them switch to alternative modes” (Beirão and Cabral, 2007). It is recognised that an improvement of supplied service quality can attract further users and consequently contribute to resolve problems such as traffic congestion, air and noise pollution, and energy consumption, consequently leading to sustainable transportation (Mazzulla and Eboli, 2006; 2007).
1.2 Problem Statement
Accra, Ghana’s capital has a population of about 4 million. The city of Accra serves as both the commercial and political centre of the country (GSS, 2012; Okoye et al, 2010).
The vast majority of public transport services in Accra is provided by the informal sector, with the only formal bus transport being provided by Metro Mass Transit Limited (IBIS, 2005). The informal sector predominantly operates a mix of buses, minibuses (trotro) and taxis. The Metro Mass Transit Limited (MMT), is a quasi-government agency established through a public private partnership between the government and private institutions like the

Level of Service Delivery of Public Transport and Mode Choice in Accra, Ghana 3
State Insurance Company, National Investment Bank, Ghana Oil Company Limited, Agriculture Development Bank, Prudential Bank and SSNIT. The Government holds 45% shares with the Private institutions holding the remaining 55% shares (MMT, 2013).
According to Armah et al, (2010 citing Quarshie, 2006; and Morrison, 2007) over half (56%) of daily passengers in Accra are carried by mini vans, and a further 15% by taxi with approximately 1 million passenger trips being made each day in and out of the central area of Accra using mini vans and taxis. They iterate the inefficiency of these vehicles in terms of the amount of road space used and congestion caused, to transport each passenger. In addition to this a recent study by the World Bank in 2010 on the city residents’ primary transportation mode choice to and from shopping and work in Accra also indicates that tro-tro are the most popular mode of motorised transport accounting for 70 percent of public transport. This is followed by private cars (10%), taxis (8%) with the Metro Mass Transit (MMT) buses recording the least of 0.3%. The Consumer Unit and Trust Society International (CUTS) indicates in its concept note on the CREW (Competition Reforms in Key Markets for Enhancing Social And Economic Welfare) project for bus transport in Ghana, that the MMT’s operation is characterized by poorly designed depots and packing lots, unavailability of seating and shade for passengers, uncertain departure/arrival schedules and an unbalanced mix of intra to intercity service.
However, the MMT was established in response to public concerns about increasing traffic congestion and transport fares posed mostly taxis and mini-buses which dominate public transport in Ghana. In addition to this, the establishment of the company was to bring instant relief to travellers especially in Metropolitan and Municipal areas by promoting mass transportation by re-introducing high occupancy vehicles to maximize the person-carrying capacity (Salifu, 2004). It is also aimed at providing services that are effective and satisfy the needs of its users through reduced travel times, journey delays and waiting times as well as travel comfort and efficiency at affordable prices. With the inauguration of the MMT and its provision of intra-city bus services in Accra since 2003, one would expect a change in the modal preference or choice of minibuses as the primary public transport for trips. However, Abane (2011), in a study on travel behaviour in Ghana, observed that mini-buses (trotro) operating under the umbrella of the Ghana Private Road Transport Union (GPRTU) is still the most preferred mode for trips in major cities of the country such as Accra. It is therefore necessary to find out why commuters do not prefer the MMT buses as their primary mode of transport in the city of Accra. This is relevant because the Ministry of Transport (MoT) in its Sector Medium-term Development Plan (2012-2014) recognises the need to pay attention to mass transport in cities and urban areas specifically; due to the associated problems of rapid urbanization in major Metro and Municipal centres in Accra, Kumasi, Takoradi/Sekondi, among others (MoT, 2011).
1.3 Research Objective
It is the objective of this research; To explain why commuters in Accra do not prefer to use public bus transport service
for commuting.

Level of Service Delivery of Public Transport and Mode Choice in Accra, Ghana 4
1.4 Main Research Question
How does Commuters’ perception of the level of service of Metro Mass Transit affect its mode choice in Accra, Ghana?
1.4.1 Sub Research Questions
1. What are the travel characteristics of commuters in Accra? 2. What is the perception of the Level of Service Delivery (LOS) of Metro Mass Transit
among commuters in Accra? 3. Why do commuters not prefer Metro Mass Transit or otherwise as an Intra-city
Transport Mode? 4. Which strategies can be developed to make mass transit more attractive in Accra?
1.5 Significance of the study
The contribution of the transport sector especially the use of private cars to air pollution, traffic congestion and related health problems has long been recognised. Public transport is thus considered a sustainable, viable alternative to private car use and key to the sustainability aim (Redman et al, 2013). Undertaking this research will serve as inputs into policy and planning interventions for encouraging sustainable public transportation in Accra and Ghana as a whole. By determining what level of service attributes influence the choice of modes in Accra, strategies can be designed and implemented to make mass transportation more attractive encouraging a modal shift from less sustainable modes.
Secondly, in spite of the abundant literature on public transport and mode choice analysis globally, Ghana lags behind in these theoretical and empirical literature. Porter and Abane (citied Abane, 2011) assert that a substantial proportion of behavioural aspects of transport research in Ghana still focuses on planning and infrastructure provision, particularly road building and maintenance. This study will therefore contribute to building up academic and empirical literature on travel behaviour in Ghana. It will also be useful to transportation planners in travel demand analysis.
1.6 Scope and Limitations of the study
This study aims at explaining how commuters’ perception of level of service of public transport affects their mode choice. It particularly considers how the situation affects the use of Metro Mass Transit, a mass transportation system in Ghana. The study was undertaken in Accra, the capital of Ghana which is rapidly urbanising and experiencing some of the negative effects of urbanization in terms of traffic congestion and its resultant effects. The study used survey research strategy to sample commuters, to assess their perception of the level of service of the Metro Mass Transit Limited (MMT), a public bus company in Accra.
The study only focused on the intra-city bus service among the three services (intercity service, intra-city service and rural services) run by the MMT. This is because of the traffic situation experienced within the metro and municipal areas of Accra. Though a study of this nature requires large samples to statistically generalise results, the survey limited the number of respondents due to limited resources; especially that of time.

Level of Service Delivery of Public Transport and Mode Choice in Accra, Ghana 5
Chapter 2: Literature Review
2.1 Introduction
The essence of this chapter is to provide a theoretical background to the research. It does so by reviewing academic literature on concepts and theories relating to public transportation. The chapter begins with a look at urban public transport systems and their characteristics. It then discusses literature on travel behaviour, the factors that affect mode choice and level of service delivery. The chapter further considers some empirical literature on the subject of public transport and mode choice and concludes with a conceptual framework for this research.
2.2 Urban Public Transport Systems
Urban centres are receiving much attention due to the rapid population growth being experienced. This trend implies increased quantities of passengers and freight moving within urban areas since cities are said to be the economic engines of countries with a high level of accumulation and concentration of economic activities (Rodrigue, 2013). An effective transport system is thus a necessary prerequisite for sustaining the socio-economic foundations and other needs of urban communities (Salifu, 2004).
As explained by GWilliam (2003), the three variables of economic, political and demographic characteristics of cities of developing and transitional economies yield a taxonomy of city types that partly explains the type of transport systems which they have acquired. Economically, he illustrates that relatively rich countries are highly motorized and congested, but also more able to afford rail-based mass transit systems. On the other hand, he further notes that, the development of mass transit is less likely to have occurred, where growth has been very rapid demographically. All, however, he concludes that Dominating all these are the influences of city size, which affects average trip lengths, and density, which determines trip numbers per unit of space. Luthra (2006), alternatively labels the uniqueness of road networks, demographic, physical and societal requirements as determinants of a particular transport system in a city.
According to Takyi et al (2013), “urban transportation refers to the system of transportation that provides access and mobility for people and goods within cities” and includes elements such as public transit (collective transport); non-motorised transport (pedestrians, cyclists) and freight. While most households own automobiles and rely on them for travel, a vast majority also depend on public transport to meet their travel needs. Public transport is among one of the major strategy recommendation to address the general problems attributed to car dependence such as urban congestion, environmental sustainability and global warming concerns associated with car dependence (Currie and Wallis, 2008 citing Booz Allen Hamilton, 2006; Victorian Competition and Efficiency Commission, 2006).
White (cited in Abreha, 2007) defines public transport as all modes of transport available to the public irrespective of ownership. Urban public transport is often referred to as mass transit (Carruthers, 2005). Anin et al, (2013 citing Smerk, (1991) and Cheape, (1980) refer to mass transit as “the movement of people within urban areas using group travel technologies such as buses and trains”.
Level of Service Delivery of Public Transport and Mode Choice in Accra, Ghana 6
2.2.1 Modes of Urban Public Transport
The main modes of urban public transport generally comprise of para-transit (including minibus-taxi), bus (mini, midi, standard and articulated), bus rapid transit (BRT), light rail transit (LRT), suburban rail and rapid rail transit/Metro-rail (RRT) (Wright and Fjellstrom, 2005; van As and Joubert, 1990). Urban public transport modes particularly the mass rapid transit enable movement of large numbers of people at one time creating efficiency and reducing traffic congestion. According to Berhan et al, 2013 (citing Borndorfer et al, 2009), mass transport facilities also provide a versatile form of public transportation with the flexibility to serve a variety of access-needs, unlimited range of locations throughout a metropolitan area. He goes on to mention that mass transit “services the public at a cheaper operating cost, with less amount of fuel, more safely and environmental friendly as compared to the private cars, small and collective taxicabs” (citing UATP, 2010)
The growing support for an attractive alternative means of transportation to the car in cities, has led to investment in improved public transport such as heavy rail, light rail, and especially BRT as a legitimate alternative to heavy and light rail due to their cost effectiveness compared to the more expensive urban rail (Hensher 2007; Cervero 2013). In spite of the growing attractiveness and investment in BRT systems the ‘conventional bus’ is the dominant public transport mode in most developing countries. This can be attributed to the flexibility it offers satisfying high short distance mobility demands, economic feasible to all groups especially the urban poor; its environmental friendliness as well as its compatible level of technology to local experience and facilities (Abreha 2007; van As and Joubert, 1990). In developing countries as well buses are still an efficient mode of public transport due to their cheap, flexible and, in many cases, tailored to the needs of end-customers both in terms of capacity and speed. According to the European Road Transport Research Advisory Council (ERTRAC, 2011) urban buses have a stake of 60% of the total European public transport in urbanised areas.
Meakin, (2004) define the term ‘bus’ to include all road-based, frequent, fixed route passenger services including all sizes of bus from 9-seat microbuses (Bali, Indonesia) to the largest rigid 12-metre double deckers (Hong Kong, Dhaka, Mumbai) and bi-articulated buses in Curitiba, Brazil. As most developing cities depend on some form of buses (both large and small) there is the need for them to be reliable, affordable, and efficiently managed to deliver the required quality services (Kumar et al, 2004). As Hensher (2007) recognises, there is still a lot that can be achieved by simple solutions to bus-based transit systems such as adding more buses, adjusting fare schedules, improving information systems, and integrating ticketing. 2.2.2 Characteristics of Public Transport Services
Provision of Mass Transit Systems The Provision and ownership of mass transit systems have been a share among private profit-making companies, government or quasi-government agencies that may not operate for profit (Anin et al, 2013). Even though public bus transport services in most developing countries are provided by the government, privately owned and operated transport services are said to be widespread throughout developed and developing countries (mostly informal para-transit or mini-buses). This is attributed to the disappointing service provision by the government for reasons such as;
“the contradictory roles of government as policy maker, regulator and operator, in most cases, the quest to satisfy social goals while trying to act commercially; restrictions on

Level of Service Delivery of Public Transport and Mode Choice in Accra, Ghana 7
management freedom caused by public service norms and procedures; constraints on financial autonomy and investment emanating from government budgeting processes; as well as competition for resources from the core government functions of health, education, welfare, among other reasons” (Amos, 2004 pg. 2).
In Ghana privately operated public transport services provide about 95% of the bulk urban bus passenger transport in cities like Accra (Kumar et al, 2004).
Financing Public bus transport services are in most cases highly subsidized by government, recognising the social and economic importance of urban public transport. This subsidization has often resulted in very low return and inhibits investment and expansion leading to reduced standards (Armstrong-Wright et al, (1987) cited in Abreha 2007). Meakin, (2004) however notes that, not all public bus services operate with subsidies. For such bus systems, cost recovery from fares is an important threshold. As denoted by the author, bus systems that achieve cost recovery are simplier to regulate since they may use the incentive of competition between operators in the market and such competition provides the most effective incentive to efficiency and responsiveness to demand.
Operation The European Committee for Standardization (CEN) considers public passenger transport services as one that have characteristics such as “openness to all whether travelling singly or in groups; are publicly advertised; have fixed times or frequencies, and periods of operation; provided on a continuing basis; and have published fare” (page 5). Most bus services operate on schedule along specified routes and conform to these characteristics. However most bus services in developing countries are characterised by inefficient terminal dispatch practices (for example sending buses out only when full), among others (Kumar et al 2004). High demands on these bus services particularly during peak hours are beyond their capacity resulting in poor quality of service (Abreha, 2007).
2.2.3 Sustainable Urban Public Transportation
The contribution of the transportation sector to the sustainability of cities has been widely recognised. It has been inseparably linked to the climate-change challenge since it is currently responsible for 13 percent of Greenhouse Gas (GHG) emissions worldwide and 23 percent of total energy-related GHG emissions (UN Habitat, 2011, cited in Cervero 2013). The way forward has been a shift towards more sustainable modes of transport such as public transport and the integration of non-motorised transport.
According to the European Road Transport Research Advisory Council (ERTRAC, 2011) “buses still remain the most universal solution for a balanced and sustainable urban development from an economic, environmental and social point of view”. It notes that urban buses offer clear advantages in terms of less space needed to answer the mobility needs of citizens.
Making urban bus transit sustainable in developing countries where the majority of passengers rely on buses (informal para-transit or formal buses) would mean that service organisations are put to task to improve the level of service (reliability, efficiency, investment in new buses et cetera.) of bus transits. In support of this, Anin et al (2013) in studying the role of Mass Transit and its Effect on Fuel Efficiency effects concludes that improving upon the mass transit services by increasing the number of metro buses within the city, especially during peak hours would improve access to transportation. They also add that increasing the

Level of Service Delivery of Public Transport and Mode Choice in Accra, Ghana 8
buses would save on energy as the use of mass transit was seen to be more fuel efficient compared with car, SUV and mini-bus. As Hensher (2007) also recognises there is still a lot that can be achieved by simple solutions to bus-based transit systems such as adding more buses, adjusting fare schedules, improving information systems, and integrating ticketing. These not only promote environmental sustainability, but also economic and social sustainability because buses have moderate infrastructure costs easy to put in service, and subsequently offers a cheap, flexible and in many cases, tailored to the needs of end-customers particularly the urban poor and others who cannot afford their own means of transport.
2.3 Travel Behaviour
“It is widely recognised that attempts to address unsustainable patterns of travel involve a detailed understanding of travel behaviour and the reasons for choosing one mode of transport over another” (Anable, 2005). Most of explanations surrounding commuters´ choice of travel mode have employed both microeconomic and psychological attitude-behaviour relations theories to map the individual’s decision process. While some have used psychological theory of planned behaviour formulated by Ajzen to predict choice of individual travel mode (Anable, 2005; Olsson, 2003); others have used the theory of maximum utility. To sociologists individuals are perceived as being different with differences in needs and ambitions and thus with different preferences. This implies that individuals face different alternatives, acquire different resources and choose the best alternative of behaviour according to both their preferences and abilities. Economists on the other hand assume that individuals evaluate their alternatives of behaviour, restrictions and costs, and finally choose rationally the best alternative according to their preferences (Davidov, 2003).
Theory of Planned behaviour The theory of planned behaviour according to Bamberg and Schmidt, (1998) and Forward, 1998 (both cited in Osslon, 2003) has made it possible to explain the choice of travel mode. It is a theory that tries to predict and explain human behaviour by dealing with possible linkages between attitudes and behaviour assuming that people have a free choice. It also assumes that choice is dependent on the individual’s perception of his or her ability to execute a certain behaviour (Osslon, 2003 citing Ajzen 1985).
Some studies (Bamberg and Schmidt, 1998; Forward, 1998) have generally concluded that the choice of travel mode is largely a reasoned decision related particularly to attitudes and perceived barriers to behaviour. However other studies (Verplanken et al., 1994; Ga¨rling et al., 2000; Bamberg et al., 2003), suggest that much of people’s daily travel mode choices are habitual and not always preceded by the deliberation of alternatives. The Theory of Planned Behaviour assumes that choice is also dependent on the individual’s perception of his or her ability to execute a certain behaviour. The intention behind a certain behaviour is dependent on factors such as attitude toward the behaviour, the social norm and the perceived behavioural control (Osslon, 2003). According to Osslon (2003), whereas “attitude includes all important convictions related to the personal consequences of a certain behaviour (e.g. travel by bus), social norms are the product of normative convictions, which the individual’s environment expects of him or her, and the individual’s motivation to adapt to these expectations. On the other hand perceived behavioural control is a function of control convictions, which in turn arise partly out of one’s own experiences and partly indirectly, as a consequence of information given by other people, for instance how difficult someone believes it is to travel by train)”. These variables are however said to be independent of each other with their degree of influence varying from one travel mode to the other. Thus according the theory of planned behaviour factors such as gender, age, and personality

Level of Service Delivery of Public Transport and Mode Choice in Accra, Ghana 9
influence behaviour, but indirectly. It also shows that it is possible to change a person’s behaviour by influencing their attitudes, the subjective norm and their perceived behavioural control. For instance by people attitude can be influenced by offering them free test trips for people’s personal experience if the intention is to encourage travel by public transport
Criticism against attitude-based theories partly has to do with the difficulty of knowing whether attitudes control travel mode choice or instead travel mode choice influence attitudes. A qualitative studies of travel mode choice by Rystam (cited in Osslon, 2003) indicated that changes in behaviour lead to changes in attitudes. In this study, respondents felt that it was their changed behaviour that caused them to change their attitudes, not the other way around. “Another shortcoming is that attitude-based theories are not easy to use to predict what happens when the standard of the service, for example travelling time, changes” (Osslon, 2003).
Maximum Utility Theory The utility maximisation theory which is based on economic theory stipulates that, travellers choose their mode of travel depending on how great they perceive the benefit for travelling to be or how they value the travel modes and their supply. The basic economic assumption is that individuals are rational and thus make choices that will give them the greatest possible personal benefit by weighing personal benefit derived from alternatives’ different characteristics against each other from a number of alternatives. As a result most people choose the mode of travel with the least sacrifice. Whereas factors such as the travelling time, the fare, the level of comfort and quality offered in connection with making the journey influence the benefit of journeys; the standard of the supply, in terms of factors as travelling times and proximity to stops and stations, et cetera can be expressed relatively in measures of advantage. The benefit derived from different characteristics however is perceived differently by different individuals and as such all people will not choose the same products, way of living, or means of transport. The major criticism against theory comes in on its basic assumption that people are rational beings and choose mode of travel that gives the greatest benefit. It is critiqued that choices between travel modes are not made solely on the basis of rational economic decisions as to what is best (Osslon, 2003).
From the two theories above, it can be concluded that this study of level of service and mode choice fits well into the maximum utility theory. This is because it is supposed that, commuters choose a mode of travel from a list of alternatives from which they would derive the maximum benefit as posited by the theory.
Modelling Choice The logit model is the most common economic method of describing how individuals choose between different alternatives. It operates on the individuals choose the alternative that provides the highest utility. The utility of the alternatives is dependent on the different characteristics of the alternatives, the design of the transport system, and the individual (Osslon, 2003). Among choice models commonly used to model choice behaviour, the random utility models (RUMs) have received utmost popularity to simulate the choice of an individual among available alternatives (Quentin and Hong, 2005). Choice is often modelled either by using Revealed Preferences (RP) or Stated Preferences (SP) or a combination of both (Louviere et al. 2000 cited in Osslon, 2003). Revealed Preference deals with how the individual acted, and therefore based on actual behaviour, while Stated Preference is based on what individuals say about how they will react and behave in imaginary situations. Revealed Preference data offers the advantage of finding out how important different factors are in people’s choices when travelling. Ortuzar and Willumsen, (2011) noted that stated preference
Level of Service Delivery of Public Transport and Mode Choice in Accra, Ghana 10
experiments could be instrumental in helping to decide the most appropriate functional form to model a given choice situation. In an earlier study (Ortúzar and Willumsen 1994) the authors observe that SP experiments is, by far, the most-used model for processing data from choice experiments in transportation research. This is because of the advantage it offers over the revealed preference studies in that Stated Preferences (SP) requires little data since one can choose the choice situations oneself according to certain statistical principles. RP on the other hand is said to require substantial amounts of basic data and thus difficult to separate, for example, travel cost and travelling time (Osslon, 2003).The SP model assumes that travel decision makers face a utility maximization problem based on the cost and quality of service stemming from using a given mode and the uncertainty of choosing the given mode (Nkurunziza, 2012). However, some researchers are of the opinion that SP studies in determining influencing factors are unreliable for instance in cases where a choice between car and bicycle is being studied, as it is difficult for the individual to imagine the situation realistically (Nilsson 1998 cited in Osslon, 2003). Habib et al. (2011), however agree that the straight-forward way to investigate the relationship between the reason for choosing transit and socio-economic and other variables of concerns is to use a simple multinomial logit model by selecting one out of the ten above-mentioned reasons.
2.4 Factors that Affect Choice of Travel Mode
A lot of factors from literature account for mode choice of individuals for trip purposes. Most significant among them have centred on the socio-demographic characteristics of the trip maker, the type of journey being undertaken and the characteristics of the transport facility which is sub-classified under quantitative and quality factors (Ortuzar and Willumsen, 2011).
The features generally believed to be important under characteristics of the trip maker include; car availability and/or ownership, possession of a driving licence, household structure, income; decisions made elsewhere, and residential density. The trip purpose, time of the day, when the journey is undertaken and whether the trip is undertaken alone or with others are seen to strongly influence mode choice.
Finally, quantitative factors such as components of travel time (in-vehicle, waiting and walking times by each mode); components of monetary costs (fares, tolls, fuel and other operating costs); availability and cost of parking; reliability of travel time and regularity of service as well as qualitative factors such as comfort and convenience; safety, protection, security; the demands of the driving task; opportunities to undertake other activities during travel (use the phone, read, etc.) influence mode choice (Ortuzar and Willumsen, 2011). These factors can also be classified as quality of service indicators or level of service indicators depending on the perspective from which one is evaluating transport service performance. Whilst passengers’ perspective reflect their perception of the service provided, transport agencies and community’s perspectives reflect the performance of the transit agency as a business and its role in meeting broad community objectives (such as employment, property values, or economic growth, contribution to community mobility and environmental effects) respectively (Transportation Research Board, 2003b, cited in Eboli and Mazzula, 2012).

Level of Service Delivery of Public Transport and Mode Choice in Accra, Ghana 11
2.5 Transit Level of Service (LOS)
The measurement of transit performance represents a very useful tool for ensuring continuous increase of the quality of the delivered transit services, and for allocating resources among competing transit agencies. (Eboli and Mazzulla, 2012). Several approaches exist in transport performance measurement. Transportation systems can be evaluated in various ways to reflect users, modes, land use, and transport problems and solutions perspectives which further determines the type of performance indicators to use (Litman 2011). Most transport literature indicate the losing attractiveness of public transport services due to their inability to meet the required level of service expected by customers as in addition to the large advantages offered by automobiles over public transit. As a result of this a particular level of service of transit is necessary to have people choose to use transit over a car when they have the choice (Racca and Ratledge, 2004). As pointed out by the authors, factors that reflect transit level of service are necessary in any transport model because they have significant influence on mode choice.
The level-of-service concept is widely recognized in traffic and transportation engineering operations as a performance measurement tool. It is used in the Highway Capacity Manual (HCM) to represent the quality of service (QOS) and or corresponding satisfaction indices provided by a transportation facility as perceived by the users or customers (Kittelson and Associates Inc, 2003; Transport Research Board, 2000; Kadiyali, 2008 cited in Ali 2010). Assessing level of service is therefore a way of ensuring continuous improvement of the delivered transit services and focusing transit agencies on their strategic goals (Eboli and Mazzula, 2012). According to the HCM (2000), “level of service (LOS) is a quality measure describing operational conditions within a traffic stream, generally in terms of such service measures as speed and travel time, freedom to manoeuvre, traffic interruptions, and comfort and convenience”. Thus the Florida Department of Transport (FDOT, 2013) construes LOS as a quantitative stratification of quality of service (i.e. traveller-based perception of how well a transportation service or facility operates) based on the HCM’s six letter grades. These six letter grades ranging from A through F (LOS A representing the best operating conditions and LOS F, the worst) provides LOS measures, thresholds, and estimation procedures for auto, transit, bicycle, and pedestrian modes. The FDOT observes that the use of the HCM’s LOS A through F scheme, enabled traffic engineers to more easily explain operating and design concepts to the general public and elected officials. However, despite its widespread use as an independent measurement, the Organisation notes that, LOS is simply a quantitative breakdown from transportation users’ perspectives of transportation QOS. LOS hence reflects the quality of service as measured by a scale of user satisfaction and is applicable to roadways modes such as automobiles, trucks, bicycles, pedestrians, and buses (FDOT, 2013)
However the level of service concept is said to be generally difficult to define exhaustively due to the different emphasis placed on various components of the concept by different people and different urban regions (Ali, 2010). While travellers conceive the dimension of level of service as travel time, bus frequency, comfort, terminal standards, bus stop facilities, interchanges between routes and services among others, the level-of-service concept in the transportation engineering profession is widely used to denote the quality of service derived from the operational characteristics of transportation facilities (George, 1979; Ume, 1991; Mfinanga and Ochieng, 2006, cited in Ali, 2010). Thus Kanafani and Wang, (2010) define “level of service measures represent a set of all the measures of performance needed for transportation analysis and reflect primarily the attributes of the system that affect user perception of the quality of service”.
Level of Service Delivery of Public Transport and Mode Choice in Accra, Ghana 12
Perspective is considered as very significant in the performance and delivery of transit services. Though performance can be assessed based on the perspective of the transit provider, customer and community issues are considered fundamental perspectives in the evaluation of a service. Many researchers thus consider the customer’s point of view the most relevant for evaluating transit performance. This is because customers opinions allows the perceived performances of a given transit service to be analysed based on what they expect from the service and their perceptions of what they receive from the service. This helps transit operators in identifying which service quality factors are considered most important by their customers. The main disadvantages of this type of measure however has been expressed in the strong subjectivity of transit users’ judgements and the failure to take into account non-users’ perceptions (Eboli and Mazzula, 2012). 2.5.1 Evaluating LOS Transit service quality has been evaluated from various. Litman, (2014) gives examples of such evaluations to include the works of AARP (2005); Dhinghi (2011); Hale (2011); Kenworthy (2008); Kittleson & Associates (2003a); Litman (2008 and 2014); Marsden and Bonsall (2006); Stradling, et al. (2007); TRB 2010; Tomer, et al. (2011); and Tumlin, et al. (2005). Eboli and Mazzulla, (2012) however categories the aspects that generally describe transit services into characteristics that more properly describe the service (e.g. frequency of runs), and characteristics that depend more on customer tastes and less easily measurable (e.g. comfort). Various studies on LOS/QOS determinants in public transportation (Eboli and Mazzulla, 2007; 2012; Tyrinopoulos and Antoniou, 2013; Litman, 2014; Beirão and Cabral, 2007; Kanafani and Wang, 2010; Polat, 2012) have revealed some main service characteristics as important. In Eboli and Mazzulla (2012) the aspects that mainly characterize bus services include; service availability, service reliability, comfort, cleanliness, safety and security, fare, information, customer care and environmental impacts. In Litman (2014), such factors considered by various studies in evaluating transit qualities or service levels include;
Availability: (when and where transit service is available), and coverage (the portion of a geographic area, or the portion of common destinations in a community, located within reasonable distance of transit service.
Frequency (how many trips are made each hour or day). Travel speed (absolute and relative to automobile travel). Reliability (how frequently service follows published schedules). Integration (ease of transferring within the transit system and with other travel
modes). Price structure and payment options. User comfort and security, including riding on, walking to, and waiting for transit. Accessibility (ease of reaching transit stations and stops, particularly by walking). Universal design (ability to accommodate diverse users including people with
disabilities, baggage, inability to understand local languages, etc.). Affordability (user costs relative to their income and other travel options). Information (ease of obtaining information about transit services). Aesthetics (appearance of transit vehicles, stations, waiting areas and documents).
Amenity (extra features and services that enhance user comfort and enjoyment) (page 12)
There are various ways in which these service attributes can be measured, taking into consideration different indicators (Eboli and Mazzulla, 2012). The TRB (HCM, 2000) and the FDOT (2013) give a description and LOS ranges for some of these service measures in the as follows;

Level of Service Delivery of Public Transport and Mode Choice in Accra, Ghana 13
Service Availability and Coverage Eboli and Mazzulla, (2012) categorise attributes belonging to this category of service aspects are represented by characteristics of the route belonging to service availability to include bus line in terms of path and coverage, number of bus stops, distance between bus stops, location of the bus stops, and characteristics of the service, like service frequency, span of service, travel time, need for transfers. As discussed in the HCM 2000, whether or not transit service is provided near a person’s origin and destination is key in use of transit. It acknowledges that ideally transit service is provided within a reasonable walking distance of the origin and destination, or demand-responsive service is available. It is however, noted that the reasonability of walking distance varies from source to source and depends on the situation, s for instance people walk farther to rail stations than to bus routes and elderly will not walk as far as younger adults. In general it recommends 400m or 5min of walk time as the limit for a bus route’s typical service area. The farther away transit service is located from a potential passenger, the less likely it is to be an option.
Frequency For transit analysis planning purposes, the FDOT notes that the most significant assumption is that bus frequency is the single most important factor in determining the Q/LOS to transit users along a transit route segment or roadway facility. It refers to bus frequency (also known as headway), as the number of scheduled fixed route buses which have a potential to stop on a given roadway segment in one direction of flow in a one-hour time period. According Eboli and Mazzulla (2012 citing the TRB, 2003), service frequency is the most distinctive aspect among service characteristics. They deem it as an important factor in on one’s decision to use transit, in that the more frequent the service, the shorter the waiting time when a bus or train is missed, and the greater the flexibility that customers have in selecting travel times. The number of hours during the day when services is provided is also considered important as irrespective of whether a transit stop is located within walking distance, it cannot be an option if service is not provided at the desired time of travel.
Reliability Service reliability is one of the most investigated transit service aspects and it is considered as a very important aspect for the transit users Citing Turnquist and Blume (1980) service reliability is defined as “the ability of the transit system to adhere to schedule or maintain regular headways and a consistent travel time”. Some researchers (Strathman et al., 1999; Kimpel, 2001; and Beirao and Cabral 2007) mostly agree that reliability is related to schedule adherence and the lack of control due to the uncertainty of vehicle arrival makes the service unreliable (Eboli and Mazzulla, 2012). The TRB, (2000) observes that reliability affects the amount of time passengers must wait at a transit stop, as well as the consistency of a passenger’s arrival time at a destination from day to day. It defines reliability to encompass on-time performance as well as the regularity of headways between successive transit vehicles. To the TRB, uneven headways result in uneven passenger loadings, so that a transit vehicle arriving late picks up not only its regular passengers but others who have arrived early for the following vehicle, resulting in vehicles falling further behind schedule. It also, recognises that reliability is influenced by traffic conditions (in on-street, mixed traffic operations), staff availability and vehicle maintenance (reflecting whether a vehicle can leave the yard or is likely to break down on the road) and by how well vehicle operators adhere to schedules.
Level of Service Delivery of Public Transport and Mode Choice in Accra, Ghana 14
Total trip time The TRB (2000) refers to total trip time to include the travel time from the origin to a transit stop, waiting time for a transit vehicle, travel time on-board a vehicle, travel time from transit to the destination, and any time required for transfers between routes during the trip. Both absolute travel time and the travel time in relation to competing mode are said to factor in a traveller’s decision about transit. Total trip time is however influenced by factors, including route spacing (affecting the walking distance to transit), service frequency (affecting the waiting time), and frequency of stops, traffic congestion, signal timing, and the fare collection system (affecting time on-board).
Fare Extensive literature support that cost affect mode choice behaviour of travellers. It includes the monetary cost of the journey by bus, for instance the cost of a one-way ride, the cost of a transfer, the availability of discounted fares the availability of volume discounts the cost of parking at bus stops. Though much literature give credence to cost in mode choice behaviour, others (Wallin and Wright (1974) conclude that monetary travel cost is not an important factor in modal-choice decisions. Also the exception of the users with low income, who consider travel cost as a very important Beirao and Sarsfield-Cabral (2007) stated that public transport is generally perceived as cheaper than car and monetary cost does not appear as a key factor for changing to public transport (Eboli and Mazzulla, 2012). The HCM, 2000 also add that potential passengers weigh the cost and value of using transit against the out-of-pocket costs and value of using other modes. Out-of-pocket transit costs consist of the fare for each trip or the cost of a monthly pass while out-of-pocket automobile costs includes only road and bridge tolls and parking charges. Other automobile costs such as fuel, maintenance, insurance, taxes and the automobile’s purchase price are generally not part of the consideration for a particular trip. Thus if a person does not have to pay a toll and parking is free, transit may appear less desirable because driving incurs no immediate out-of-pocket costs TRB, 2000).
Safety and Security Riders’ perceptions as well as the actual conditions of the safety and security of transit is said to enter into the mode-choice decision. Safety specifies the degree of safety from crime or accidents while and security results from psychological factors. Generally, the term “safety” is used to indicate the possibility of being involved in a road accident, while the term “security” refers to the possibility of becoming the victim of a crime (Eboli and Mazzulla, 2012). Riders consider not only personal safety in relation to potential transit crime and vehicular crashes, but also such personal irritants as unruly passengers or someone else’s loud radio (TRB, 2000).
Appearance, Comfort and Load Factors Both the physical comfort in vehicles, comfort in terms of ambient conditions on board or at stops are all considered as important for transit users during the journey. Comfort on board means having soft and clean seats, comfortable temperature, not many people on board, smoothness of the bus ride, low levels of noise and vibrations, not nasty odours. The indicator most frequently used for evaluating comfort during the journey is linked to the degree of crowding on bus (Eboli and Mazzulla, 2012). Transit becomes less attractive when passengers must stand for long periods of time especially in crowds. Crowded vehicles also slow down transit operation, adding time for passengers to get on and off (TRB, 2000).
Level of Service Delivery of Public Transport and Mode Choice in Accra, Ghana 15
Information Availability of information is another service factor which affects transit service quality and important to the planning and execution of a journey. Passengers need to know how to use transit service, where the access is located, where to get off in the proximity of their destination, whether any transfers are required, and when transit services are scheduled to depart and arrive. Without this information, potential passengers will not be able to use transit service. Regular riders also need to be informed about the service changes that affect them (Eboli and Mazzulla, 2012; TRB, 2000).
Transfers Trips requiring transfers between routes adds to a passenger’s total trip time while a missed transfer also can increase the length of a transit trip. Required transfers increase the complexity of a transit trip for a first-time passenger and transfer surcharges also inhibit ridership (TRB, 2000).
2.6 Empirical Literature Review
Several empirical studies on mode choice have illuminated the importance of level or quality of service factors that influence the mode choice decision of travellers. Various approaches and techniques have also been employed to evaluate or assess quality or level of service of public transit especially in the developed world. Few of such empirical analysis as the work of Nkurunziza et al., (2012) on individual commuter preferences towards a proposed bus rapid transit (BRT) system in Dar-es-Salaam, Tanzania have been carried out in sub-Sahara Africa. Using a stated preference survey and a specially developed pictorial score card suited for the local context, and needed to capture the preferences of the commuter respondents; the study sought to identify how commuters perceived and valued the proposed BRT service quality attributes. With a binary logit model the study concluded that comfort is the most valued attribute compared to travel time and travel fare, in order of importance respectively.
Abane (2011) examined the travel behaviour of residents in four key metropolitan areas (Accra, Kumasi, Secondi-Takoradi and Tamale) in Ghana. The study used multinomial logit model complemented with in-depth interviews and observations to and explain some behavioural patterns of the travellers in their mode choice and travel behaviour. The study reported that trotros (mini-buses) and taxis generally remained the preferred modes of travel in the study areas. It also concluded that issues of affordability and availability were found to greatly influence choice of mode in all the metropolitan areas studied. In addition, seating arrangement, time management by the transport companies and services on board the vehicles were found to be partial influencers of attracting people to trotros, taxi cabs and private cars over and above government/ company vehicles irrespective of gender and geographical location .
Ali (2010) assessed the quality of intra-urban bus services provided by government agencies and private bus operators in the city of Enugu, Nigeria as perceived by bus commuters. The study used descriptive statistic of mean and maps were employed to analyse data collected. The analysis revealed that the quality of bus service indicators passengers waiting time, walking distance to the nearest bus stops and bus service frequency varied from one centre to another, indicating variations in the level of bus services in different part of the city.
Glerum, Monticone and Bierlaire (2011) presented an analysis of the impact of perceptions on transport mode choice from a revealed preference survey performed in low-density areas of Switzerland. Using a calibration of an integrated choice and latent variable

Level of Service Delivery of Public Transport and Mode Choice in Accra, Ghana 16
model, their study showed that in addition to travel times, costs, and socio-economic information of the respondents, perceptions can have a significant impact on mode choice. They concluded in the study that travellers’ perception of comfort in public transports has a significant impact on their mode preferences. Their study also revealed that the perception of comfort in public transports was interacted with a frequent use of public transports and suggested a development of a latent class model to better capture differences between frequent riders and other travellers.
Beirão, and Cabral’s, (2007) conducted a qualitative study of public transport users and car users to obtain understanding of travellers’ attitudes towards transport and their perceptions of public transport service quality in the region of Porto, Portugal. The study used series of in-depth interviews of public transport users, car users as well as to the transport operator staff to figure out how and why people use or not use public transport, what factors influenced these decisions, and how customers evaluated the services offered to them. The authors indicated that in order to increase public transport usage, the service should be designed in a way that accommodates the levels of service required by customers. This would attract potential users. The study also concurs to the fact that choice of transport mode is influenced individual characteristics and lifestyle, the type of journey, the perceived service performance of each transport mode and situational variables. The study concluded that travel time and reliability play a key role and are determinants of transport mode decisions, as well as the having a comfortable journey, expressed in having a seat on the vehicle, a nice ambience free from unpleasant smells, a not too crowded space and a smooth ride. The study realised that, attitude towards transport is also an important determinant for mode choice, though it acknowledge the fact that not all car users in general will change from driving a car to using public transport exclusively by improving the public transport system. However, it concludes that if the public transport service is unreliable, has a low frequency or lack of comfort, people are likely to shift to using cars because they do not perceive public transport as a viable alternative to them.
Tyrinopoulos and Antoniou (2013) studied the factors affecting modal choice in urban mobility in the Municipality of Kalamaria, Greece. The study used probit and structural equation models estimation in addition to statistical analysis to gain better insight of the commuters’ mobility behaviour. Their research investigated the key factors and attributes that have particular impact on the choice of the available means of transport in urban areas and could encourage or discourage commuters from using local public transport services. According to their research, the main factor affecting the preference of respondents toward passenger car is the availability of parking space. They also found that female respondents have a lower preference towards car than male respondents, while respondents between the ages of 35 and 44 showed a higher preference for car. Furthermore respondents without kids are more likely than those with kids to choose transit for their trips whiles female respondents indicated a higher tendency for using car for work trips, followed by shopping and personal trips and finally leisure trips for trip purposes. One of the key finding of the research on factors discouraging respondents for public transit was crowding followed by service unreliability. High fare, lack of public transport information and bad accessibility to the transit network did not seem to discourage respondents’ use of public transport in that particular situation.
Redman et al, (2013) reviewed the quality attributes of public transport that attract car users to contribute to a better understanding of those aspects of Public Transport quality. Their literature review revealed that reliability is a key quality attribute of Public Transport service, with frequency, fare prices, and speed also being commonly important. They however agree that the relative importance of quality attributes in affecting Public Transport
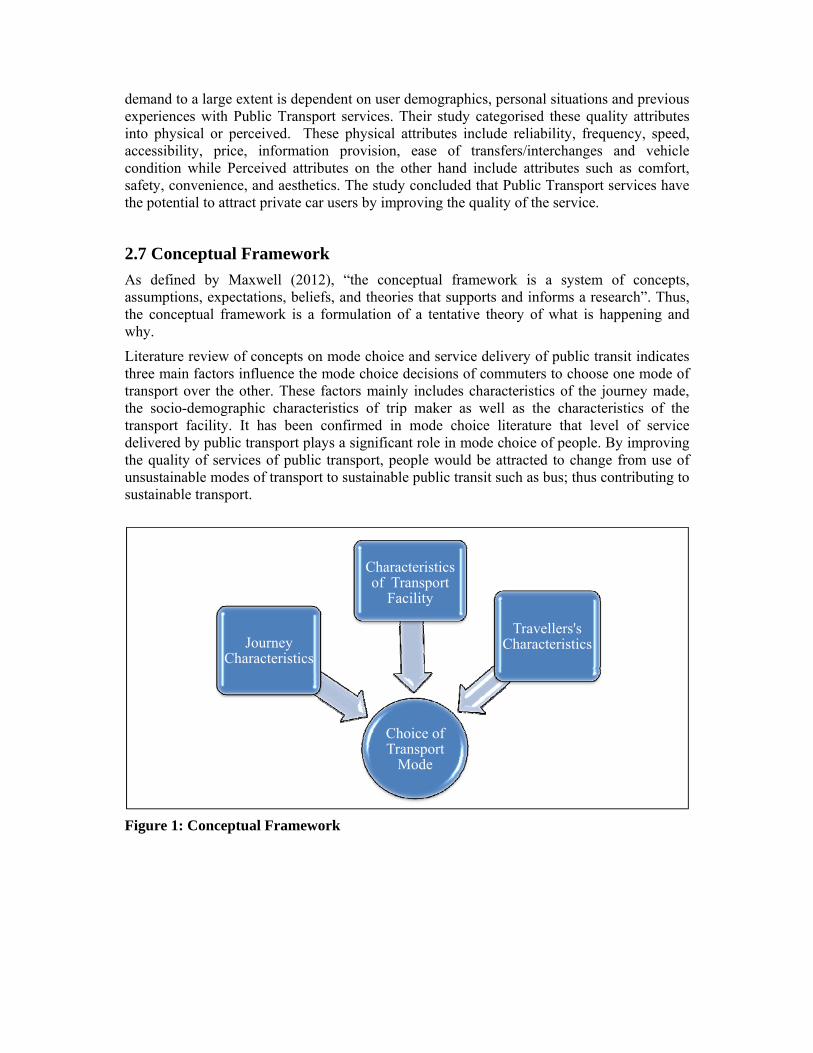
L l f S i D li f P bli T d M d Ch i i A Gh 17
demand to a large extent is dependent on user demographics, personal situations and previous experiences with Public Transport services. Their study categorised these quality attributes into physical or perceived. These physical attributes include reliability, frequency, speed, accessibility, price, information provision, ease of transfers/interchanges and vehicle condition while Perceived attributes on the other hand include attributes such as comfort, safety, convenience, and aesthetics. The study concluded that Public Transport services have the potential to attract private car users by improving the quality of the service.
2.7 Conceptual Framework
As defined by Maxwell (2012), “the conceptual framework is a system of concepts, assumptions, expectations, beliefs, and theories that supports and informs a research”. Thus, the conceptual framework is a formulation of a tentative theory of what is happening and why.
Literature review of concepts on mode choice and service delivery of public transit indicates three main factors influence the mode choice decisions of commuters to choose one mode of transport over the other. These factors mainly includes characteristics of the journey made, the socio-demographic characteristics of trip maker as well as the characteristics of the transport facility. It has been confirmed in mode choice literature that level of service delivered by public transport plays a significant role in mode choice of people. By improving the quality of services of public transport, people would be attracted to change from use of unsustainable modes of transport to sustainable public transit such as bus; thus contributing to sustainable transport.
Figure 1: Conceptual Framework
Choice of Transport
Mode
Journey Characteristics
Characteristics of Transport
Facility
Travellers's Characteristics
Level of Service Delivery of Public Transport and Mode Choice in Accra, Ghana 18
Chapter 3: Research Design and Methods
3.1 Introduction
This chapter presents a description of the methods steps employed in the study. It commences with operationalization of variables and indicators, specifies sample size and sampling techniques as well as the procedures used in data collection. The chapter further gives a brief description of the study area and the techniques used for data analysis.
3.2 Operationalization of Variables and Indicators
Straits & Singleton (2011) defines Operationalization as the “detailed description of the research operations or procedures necessary to assign units of analysis to the categories of a variable in order to represent conceptual properties”.
In this study characteristics of transport facility have been operationalised as level of service variables as reliability, frequency, travelling time, accessibility, price, ease of transfers, vehicle conditions, comfort, safety and aesthetics. These variables were adopted because a study by Abane (2011), on travel behaviour in Ghana revealed that commuters choice of frequently preferred modes were based on people’s perception of the modes’ affordability, reliability, safety, availability, quality of driving and seating arrangements which influence comfort and safety on board vehicles. In a separate study on mode choice for journey to work among formal sector employees in Accra by the same author (Abane, 1993), gender roles, age differences, disposable incomes as well as reliability of schedules by the individual modes were identified as the most important factors workers take into consideration in choosing their modes. Hence, travellers’ characteristics of trip maker in this study were operationalised based on socio-demographic indicators as gender, age, income and occupational status. According to Racca and Ratledge (2004) examples of factors identified in literature to be involved in a person’s travel mode choice under journey or trip characteristics include, trip purpose (work, school, shopping, recreation, or others), trip distance and origin and destination information. In the context of Accra, journey characteristics is limited to purpose of trip. Purpose of trip is considered to play a significant role in mode choice in Accra based on the researcher’s knowledge and observation.
The table 1 presents the operationalization of concepts with variables and their corresponding measurable indicators. Conducting surveys on such number of variables have both advantages and disadvantages. Due to imperfect correspondence between indicators and concepts, Straits & Singleton, (2011) confirm that researchers often choose to rely on more than one indicator when operationalizing a concept. However this may also result in the formulation of length survey instruments which can be time consuming especially in commuter surveys. However the employment a scale rating of LOS variables made it easier for respondents to respond to questionnaires. The study also ensured that respondents had enough time to complete the questionnaire before interviews were carried out.
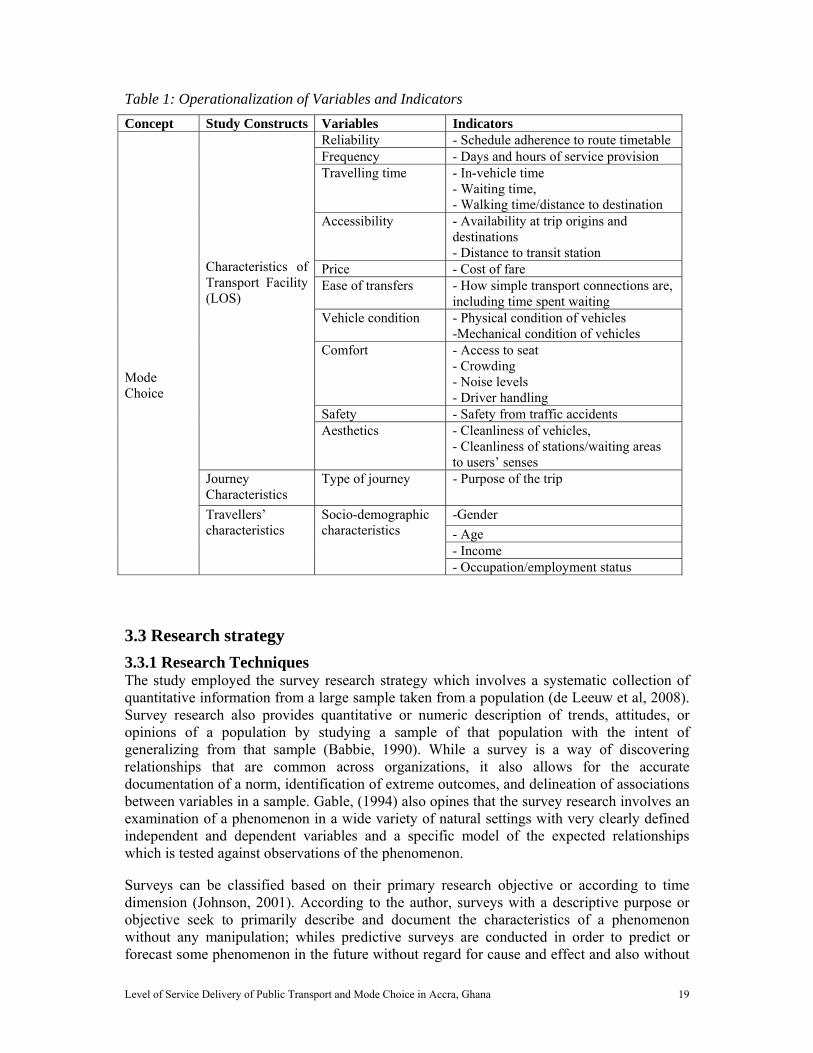
Level of Service Delivery of Public Transport and Mode Choice in Accra, Ghana 19
Table 1: Operationalization of Variables and Indicators
Concept Study Constructs Variables Indicators Mode Choice
Characteristics of Transport Facility (LOS)
Reliability - Schedule adherence to route timetable Frequency - Days and hours of service provision Travelling time - In-vehicle time
- Waiting time, - Walking time/distance to destination
Accessibility - Availability at trip origins and destinations - Distance to transit station
Price - Cost of fare Ease of transfers - How simple transport connections are,
including time spent waiting Vehicle condition - Physical condition of vehicles
-Mechanical condition of vehicles Comfort - Access to seat
- Crowding - Noise levels - Driver handling
Safety - Safety from traffic accidents Aesthetics - Cleanliness of vehicles,
- Cleanliness of stations/waiting areas to users’ senses
Journey Characteristics
Type of journey - Purpose of the trip
Travellers’ characteristics
Socio-demographic characteristics
-Gender
- Age - Income - Occupation/employment status
3.3 Research strategy
3.3.1 Research Techniques The study employed the survey research strategy which involves a systematic collection of quantitative information from a large sample taken from a population (de Leeuw et al, 2008). Survey research also provides quantitative or numeric description of trends, attitudes, or opinions of a population by studying a sample of that population with the intent of generalizing from that sample (Babbie, 1990). While a survey is a way of discovering relationships that are common across organizations, it also allows for the accurate documentation of a norm, identification of extreme outcomes, and delineation of associations between variables in a sample. Gable, (1994) also opines that the survey research involves an examination of a phenomenon in a wide variety of natural settings with very clearly defined independent and dependent variables and a specific model of the expected relationships which is tested against observations of the phenomenon.
Surveys can be classified based on their primary research objective or according to time dimension (Johnson, 2001). According to the author, surveys with a descriptive purpose or objective seek to primarily describe and document the characteristics of a phenomenon without any manipulation; whiles predictive surveys are conducted in order to predict or forecast some phenomenon in the future without regard for cause and effect and also without
Level of Service Delivery of Public Transport and Mode Choice in Accra, Ghana 20
any manipulation. Explanatory, surveys on the other hand seek to develop or test a theory about a phenomenon to explain “how” and “why” it operates by identifying the causal factors that produce change in a phenomenon without manipulation. By time dimension, surveys may include cross-sectional research, longitudinal research, and retrospective research. Cross-sectional research collects data from a sample at a single point in time or during a single, relatively brief time period and make comparisons across the variables of interest. Longitudinal research (with subtypes of trend studies, cohort studies, and panel studies) allows a researcher to collect data at more than one point in time and make comparisons across time. Retrospective surveys however, looks backward in time and make comparisons between the past and present for cases in a data set. Here the aim of the researcher is basically to simulate or approximate a longitudinal study by obtaining data representative of more than one time period (Johnson, 2001). Survey approach allows data to be collected using questionnaires or structured interviews in the forms of as mail questionnaires, telephone interviews, or from published statistics, and are analysed using statistical techniques (Babbie, 1990; Gable, 1994). Among other things, surveys are flexible tools, which can produce both qualitative and quantitative information depending on how they are structured and analysed.
According to Pinsonneault and Kraemer (1993) survey research is most appropriate when the point of interest or central questions about a phenomenon concerns “what is happening?”, and "how and why is it happening?" or when questions of about what, how much or how many, and why are to be answered. In addition, surveys research are also most appropriate where there is no desire or when it is impossible to control the independent and dependent variables and more so when the phenomena of interest must be studied in its natural setting occurring in current time or the recent past. The main limitation of the survey approach lies in the inadequacy of detailed explanation or understanding of contextual issues. As asserted by Gable, (1994) “the survey approach provides only a "snapshot" of the situation at a certain point in time, yielding little information on the underlying meaning of the data. Moreover, some variables of interest to a researcher may not be measurable by this method”. Compared to other methods such as case studies therefore, surveys are less appropriate when detailed understanding of context and history of given computing phenomena is desired (Pinsonneault and Kraemer, 1993). Gable (1994), suggest however that, “for a survey to succeed in elucidating causal relationships or even in providing descriptive statistics, it must contain all the right questions asked in the right way”. Another limitation association with surveys lies in its inflexibility to discoveries during data collection; in that there is little to be done upon realizing the omission of vital items from a questionnaire or upon discovering that a question is ambiguous or is being misunderstood by respondents when work is already underway (Gable, 1994).
From the above discussion, this study adopted the explanatory survey typology as it is most applicable. This is because the objective of this study seeks to explain how service delivery of public transport affects passengers’ mode choice in Accra, Ghana. Specifically, the research aims to answer how service delivery of Metro Mass Transit Limited (MMT) affects its choice/preference among commuters in Accra, Ghana. Stemming from this the study seeks to establish the relationship between the independent variable of service delivery and the dependent variable of mode choice of transit. With this the study seeks to collect data quantitative and qualitative data through structured questionnaires, the main premise of the survey research.

Level of Service Delivery of Public Transport and Mode Choice in Accra, Ghana 21
3.4 Data Collection Methods and Sampling
3.4.1 Sampling techniques and Sample size selection
The population of Accra according to Ghana’s 2010 census is about 4 million. Based on this figure, and using a confidence level of 95% at a confidence interval of 5, a sample size of 384 respondents would have been a representative sample to interview. However due to time constraint stemming from the fact that data collection was conducted within four weeks, a total of 150 respondents were interviewed, resulting in 134 completed questionnaires and a response rate of 89.3 percent.
The study employed a number of non-probability data sampling techniques. This was used because, even though the population size is known, probability techniques such as simple random sampling requires a list of population elements, which can be time-consuming and expensive (Cooper and Schindler, 2014). Purposive and convenience sampling techniques were used in selecting data collection points and respondents. The MMT has four depots in the city of Accra, which operates a mix of intercity, intra-city and rural services where all journeys start or terminate. Commuters were randomly selected and asked a screening question on their frequency of use of MMT. Based on the answer given they were then categorised into Frequent, Occasional and Non-users of MMT and applicable questionnaires administered to them. Frequent users were defined as commuters who used the bus services every day, between 3-6 days a week as well as 1-2 days in a week. Categories of passengers who patronised the bus services once or twice within a month or as and when the occasion arose were classified under Occasional. Non-users on the other hand were considered as categories of commuters who have never used the intra-city services of the MMT or used it three or more years back. An official from the Metro Mass Transit Limited was purposively sampled to acquire information on the service delivery of the company. The official was from the Planning and Research Department of the company and had in-depth knowledge on the operations and service delivery of the company in Accra.
3.4.2 Data Collection Methods and Instruments
The research used survey as the main data collection method. A structured interview schedule with a combination of open and closed-ended questions was used to collect revealed preference data from commuters. A semi-structured interview guide was also used to collect information from the MMT as a bus services provider. Both self-administered and researcher-administered methods were used in collecting data. Questions were read aloud in English or translated to vernacular (Akan) where respondents did not understand English.
The questionnaire was structured into three parts with the first part bordering on the socio-demographic characteristics of respondents. The second part considered travel characteristics of respondents with the third part focusing on a perception assessment of the service delivery of the MMT. The study also used secondary data from academic articles and journals, books, archived reports of the MMT, both published and unpublished policy documents relating to public transportation. Concepts used in this study was based reviewed literature from academic articles, journals, and books. Archived reports and academic articles have also been referenced in data analysis to triangulate and valid results from field studies.
Data was collected at four main geographical areas of the city (Achimota, Madina, Accra Central and Kaneshie) where MMT’s terminals are located. These terminals were sampled

L l f S i D li f P bli T d M d Ch i i A Gh 22
because, as revealed by Abane (2011) over 80% of passenger traffic in the Accra metropolis are controlled by these terminals and also possess most vehicles plying various destinations in and around the metropolis. The map below shows geographical points of data collection.
3.5 Validity and reliability
McGoey et al, (2010) refer to reliability as the internal stability and consistency of measurement instruments while validity is the term that refers to the utility of instruments in measuring selected constructs. Alternatively, Cooper and Schindler, (2014), posit that validity is the extent to which a test measures what it actually seeks to measure whiles reliability is the accuracy and precision of a measurement procedure. The two main forms of validity include external and internal validity. The external validity of research findings is the data’s ability to be generalized across persons, settings, and times; whiles internal validity the ability of a research instrument to measure what it is purported to measure.
In a survey, the possibility of interviewer bias can undermine the reliability of responses resulting in socially desirable responses. These bias result from the way in which questions are asked, or in the personal characteristics of the interviewer. In terms of reliability, methods used in selecting sample should be replicable at a different time using the same procedure.
The research ensured validity by constructing questionnaires based on operationalized concepts reviewed in literature. Sourcing data using both questionnaires and semi-structured questionnaires from different groups of respondents and secondary sources ensured that data was triangulated and validity ensured. Questionnaires were also pretested to avoid ambiguity and to ensure that the content of the research is understood by respondents before the actual survey was conducted.
Reliability was ensured by employing multiple indicators in measuring same variables in the questionnaire. The researcher also observed data design and collection procedures and
Figure 2: Map of Accra, showing data collection points

Level of Service Delivery of Public Transport and Mode Choice in Accra, Ghana 23
applied appropriate statistical analysis such as the Cronbach’s alpha test of reliability to ensure results of the study are reliable.
3.6 Data Analysis Techniques
As discussed in chapter two, logit models especially multinomial logit model present the straight-forward way of investigating relationships between reasons for choosing transit and socio-economic and other variables of investigation. However, simple statistical frequency analysis was used in this study to evaluate service levels/quality, as the main aim of the study is to explain why commuters do not prefer to use public transit in Accra, models have not been employed in the analysis of data.
Data was prepared by editing, coding and then captured using the Statistical Package for Social Sciences (SPSS). Data was interpreted using frequency tables, custom tables and cross tabulations where appropriate. Charts and graphs were also generated using excel spread sheets. Results were also interpreted using statistical tests of association such as independent sample tests and analysis of variance (ANOVA).
Level of Service Delivery of Public Transport and Mode Choice in Accra, Ghana 24
Chapter 4: Research Findings
4.1 Introduction
This chapter presents the major findings resulting from data collected from the field. It begins with a brief overview of the Metro Mass Transit (MMT) Limited in Ghana, and the general characteristics of public transport in the study area. The second part gives a description of the socio-demographic characteristics of respondents, their modes of transport for travel in addition to the main purpose of travel. This is followed by an analysis of respondents perceived level of service delivery of MMT. The last part assigns reasons to why commuters use or otherwise not use bus services of the MMT and what factors they consider most important in their choice of public transport modes. A further analysis of as to what factors have an influence on commuters’ choice of public transport is discussed as an end to the chapter.
4.2 Public Transport in Accra
The vast majority of public transport services in Accra is largely provided by the sector, with the only formal bus transport being provided by Metro Mass Transit Limited (IBIS, 2005). This informal sector operates a mix of fleets provided by the private sector include a mix of large buses, minibuses (trotro) and taxis.
Most of these privately owned public transport operate under the control of Transport Unions through routing, loading by turns and permission to operate on specific routes though there are a few (floating drivers) who do not belong to any transport union (Kumar et al, 2008).
The Ghana Private Road Transport Union (GPRTU) the biggest transport union and a member of the Ghana Trades Union Congress (TUC) oversees commercial vehicles whose owners have registered with them. 4.2.1 The Metro Mass Transit (MMT) Limited
Access to public transport is identified as significant to achieving the policy objective of Ghana’s transport sector to establish an efficient, modally complementary and integrated transport network for the movement of people and goods at least cost throughout the country (National Transport Policy, 2008). The Metro Mass Transit Limited (MMT) was instituted in March, 2003 under the Ghana Companies Code 1963, Act 179, by the Government of Ghana through the Ministry of Transport and other institutions to operate mass transportation services. As a quasi-government company the government of Ghana owns 45% shares, 2.5% shares in Treasury with the remaining 52.5% shares held by incorporated bodies including the State Insurance Company (5.83%), National Investment Bank (9.33%), Ghana Oil Company limited (7.5%), Agricultural Development Bank (16.67%), Prudential Bank Limited (1.67%) and Social Security and National Insurance Trust (11.50%).
The mandate of MMT is to carry on the business of mass transportation in Ghana in all its aspects and other businesses incidental to it, including provision of contract bus services and school bussing services. In support of government’s pro-poor policy, the company charges lower fares ensuring affordability to the poor, run on routes generally considered unattractive and unprofitable by private transport operators (in terms of state of road and patronage), implantation of free bus ride for school children in uniform up to Junior High School, as well as influencing and stabilizing transport fares throughout the country (unpublished report, 2011).

Level of Service Delivery of Public Transport and Mode Choice in Accra, Ghana 25
4.2.2 Operations of MMT
The MMT operates three levels of service. These are intercity service, intra-city service and rural urban service. The intercity service covers all regional capitals of the country. Out of the 169 districts in Ghana as of 2011, MMT operated in 130, representing about 77 percent District coverage. The intra-city services covers major cities and towns within Metros and Municipalities.
In the study area, the MMT operates on about ninety-seven intra-city routes, covering almost every part of the city. The company has a fleet size of 231 buses of the VDL Neoplan and Jonckheere city bus types. The bus have seating capacities of 47 persons to maximum of 80 persons including standing capacity. The MMT run a seven day service starting from about 5:30am in the morning to a close at about 7 pm in the night.
In terms of routing, the MMT does not have a formalized basis for selection of routes and thus shares a high proportion of its routes with other public transport vehicles. Its social responsibility towards pro-poor government policies forces it to run on routes deemed unattractive by other commercial public transport systems. In addition to this, the intra-city services of MMT has no formalized scheduling system. Buses thus operate on regular rotation when available which is same for other intra-city commercial transport services, thus increasing the waiting time of passengers.
The company has designated terminals or stations where passengers board buses. Most of these stations are however shared with other intra-city commercial vehicles which increases the competition for ridership among service providers. MMT operates on a ticketing systems in which passengers wait in queue to purchase in turns before getting on board the buses. This is mostly an orderly manner but with occasional incidences of disorderly boarding by some passengers especially during peak periods.
4.3 Demographic and Travel Characteristics of Respondents
4.3.1 Demographic Characteristics of Respondents
The gender, age, educational level, employment status, household size and the monthly income earning of respondents were generally solicited from all respondents who were made up frequent users, occasional users and non-users of the bus services provided by the MMT. Frequent users were defined as commuters who used the bus services every day, between 3-6 days a week as well as 1-2 days in a week. Categories of passengers who patronised the bus services once or twice within a month or as and when the occasion arose were classified under Occasional. Non-users on the other hand were considered as categories of commuters who have never used the intra-city services of the MMT or used it three or more years back. Frequencies and cross tabulations were employed to analyse these demographic characteristics
In all, 134 commuters were sampled for interview. These comprised of 60 Non-users, 40 Occasional and 34 frequent users. Out of the total sample there was an even divide between male and female with each constituting 50 percent of the sample. On sub-group levels however, 53.3 percent of Non-users were male, while 46.7 percent were female. Females represented a higher percentage of 55.0 and males, 45.0 percent among the Occasional user category. In the Frequent user subgroup there was an equal split of 50 percent each for males and females as shown on figure 3 below.

Level of Service Delivery of Public Transport and Mode Choice in Accra, Ghana 26
Respondents varied from young to old on age scale. In all respondents between the ages of 18 and 57 years were interviewed. Whilst the minimum and maximum ages for Non-users were 23years and 51 years, that of Occasional users were 22 and 57 years; with Frequent recording a minimum of 18 years and a maximum of 51 years respectively. Means ages were for 31.3, 34.9 and 33.1 years for Frequent, Occasional and Non-users respectively. A cross tabulation of age by gender for respondent category show that for Non-users, most respondents both male and female fell into the age bracket of between 26 to 39 years. Whiles 40.0% were males, about 38.3% were females. This is also true for Occasional (30.0% males and 35.0% females) and Frequent users (26.5% males and 29.4% females) respectively.
An analysis of the employment status of respondents show that passengers were self-employed, students, worked for government or were employed by the private sector. However a further analysis among the different categories of respondents as shown table 2 indicates that almost half (47.1) of Frequent users were self-employed whereas a high of 45 percent of Non-users worked in the private sector. It is further observed that Government employees were high (55%) among Occasional users. Table 2: Employment Status of Respondents
Non-users Occasional Users Frequent users Employment Status Count Percent Count Percent Count Percent Unemployed 0 0.0 3 7.5 2 5.9 Self-employed 10 16.7 6 15.0 16 47.1 Student 0 0.0 3 7.5 6 17.6 Government Employee 23 38.3 22 55.0 6 17.6 Private Sector Employee 27 45.0 6 15.0 4 11.8 Total 60 100.0 40 100.0 34 100.0
From the table 3 below, whilst most Non-users (30% and 40%) were clustered in the monthly income range of above GHC800 and GHC601 - GHC800, respectively, the opposite was true for Frequent users who were mostly within the less than GHC200 (44.1%) and between GHC201 - GHC400 (20.6%). On the other hand, majority of Occasional users (47.5%) earned between GHC601 - GHC800 monthly, with more than a quarter (27.5%) earning above GHC800.
Table 3: Monthly Income Range of Respondents
Non-users Occasional Users Frequent users Monthly Income Range Count Percent Count Percent Count Percent Less than GHC200 6 10.0 1 2.5 15 44.1 GHC201 - GHC400 4 6.7 3 7.5 7 20.6 GHC401 - GHC600 8 13.3 3 7.5 3 8.8 GHC601 - GHC800 18 30.0 19 47.5 5 14.7 Above GHC800 24 40.0 11 27.5 3 8.8 No Income 0 0.0 3 7.5 1 2.9 Total 60 100.0 40 100.0 34 100
Inferring from table 3 Income levels of respondent can be explained by the fact that majority of Occasional users worked in the public sector whereas most Non-users worked in the
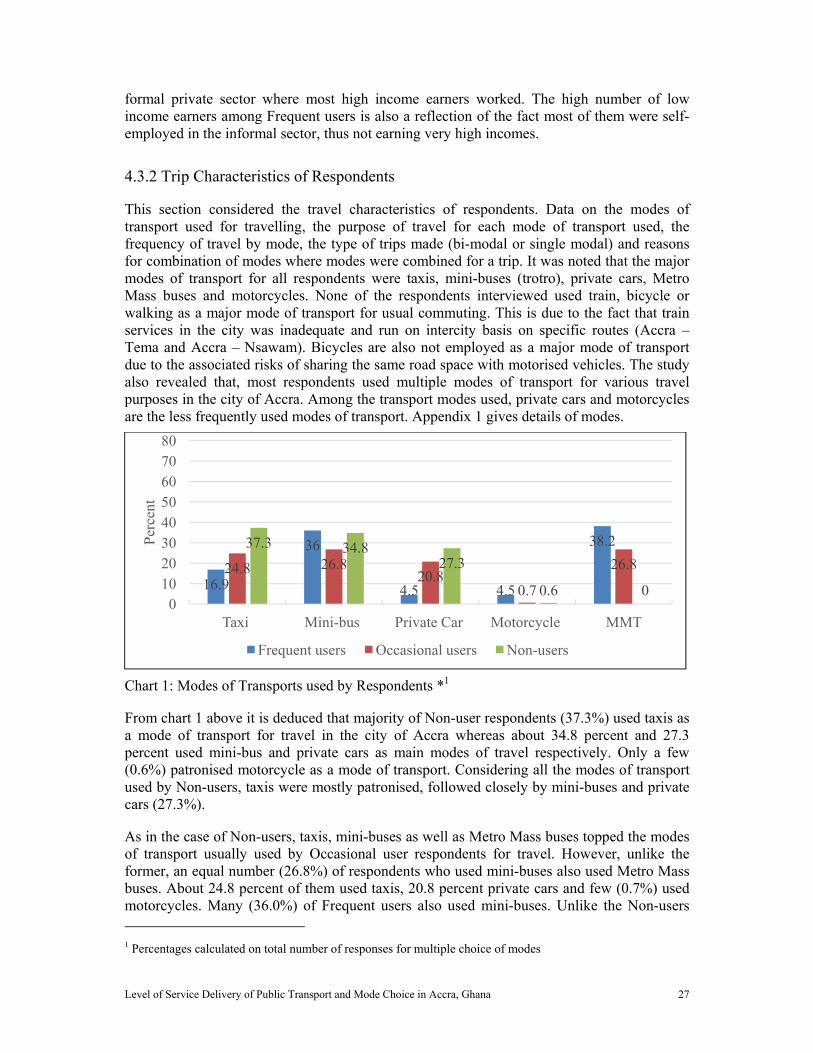
Level of Service Delivery of Public Transport and Mode Choice in Accra, Ghana 27
formal private sector where most high income earners worked. The high number of low income earners among Frequent users is also a reflection of the fact most of them were self-employed in the informal sector, thus not earning very high incomes.
4.3.2 Trip Characteristics of Respondents
This section considered the travel characteristics of respondents. Data on the modes of transport used for travelling, the purpose of travel for each mode of transport used, the frequency of travel by mode, the type of trips made (bi-modal or single modal) and reasons for combination of modes where modes were combined for a trip. It was noted that the major modes of transport for all respondents were taxis, mini-buses (trotro), private cars, Metro Mass buses and motorcycles. None of the respondents interviewed used train, bicycle or walking as a major mode of transport for usual commuting. This is due to the fact that train services in the city was inadequate and run on intercity basis on specific routes (Accra – Tema and Accra – Nsawam). Bicycles are also not employed as a major mode of transport due to the associated risks of sharing the same road space with motorised vehicles. The study also revealed that, most respondents used multiple modes of transport for various travel purposes in the city of Accra. Among the transport modes used, private cars and motorcycles are the less frequently used modes of transport. Appendix 1 gives details of modes.
Chart 1: Modes of Transports used by Respondents *1
From chart 1 above it is deduced that majority of Non-user respondents (37.3%) used taxis as a mode of transport for travel in the city of Accra whereas about 34.8 percent and 27.3 percent used mini-bus and private cars as main modes of travel respectively. Only a few (0.6%) patronised motorcycle as a mode of transport. Considering all the modes of transport used by Non-users, taxis were mostly patronised, followed closely by mini-buses and private cars (27.3%).
As in the case of Non-users, taxis, mini-buses as well as Metro Mass buses topped the modes of transport usually used by Occasional user respondents for travel. However, unlike the former, an equal number (26.8%) of respondents who used mini-buses also used Metro Mass buses. About 24.8 percent of them used taxis, 20.8 percent private cars and few (0.7%) used motorcycles. Many (36.0%) of Frequent users also used mini-buses. Unlike the Non-users 1 Percentages calculated on total number of responses for multiple choice of modes
16.9
36
4.5 4.5
38.2
24.8 26.820.8
0.7
26.8
37.3 34.827.3
0.6 00
1020304050607080
Taxi Mini-bus Private Car Motorcycle MMT
Per
cent
Frequent users Occasional users Non-users

L l f S i D li f P bli T d M d Ch i i A Gh 28
and Occasional users, only about16.9% of Frequent user respondents used taxis as a mode of transport. However, more respondents (4.5%) from this category used motorcycles compared to Non-users and Occasional users. Last of all, only a handful Frequent users (4.5%) used private cars as part of their frequent choice modes.
Figure 3: MMT buses at a terminal
4.3.2 .1 Frequency of Travel by Mode Type
Chart 2 below shows that taxis were used at least 1-2 days in a week. It is observed that about 63.3 percent of Non-users, 50.0 percent of Occasional users and 26.7 percent of Frequent users patronised taxis once or twice in a week for travel. On daily basis however, it is observed that only few respondents used taxis for travel whereas, more than half (52.9%) of Frequent users did not patronise taxis. This is attributed to the fact that travel by taxi is relatively higher compared to other modes of transport such as mini-buses and MMT. With majority (44.1%) of Frequent users earning less than GHC200 a month, it is not surprising that only few of them patronised taxis.
Chart 3: Frequency of mini-bus use
1.7 5.0 2.98.322.5
2.9
63.350.0
32.4
26.7 15.0
5.9
7.5
52.9
0
20
40
60
80
100
Non-users Occasional users
Frequent users
Per
cent
Everyday 3-6 days a week1-2 days a week 1-2 times a monthFor some years now Not Applicable
55.0 65.0 55.9
10.015.0
17.6
28.317.5 23.5
2.56.7 2.9
0.0
20.0
40.0
60.0
80.0
100.0
Non-users Occasional users
Frequent users
Per
cent
Everyday 3-6 days a week1-2 days a week 1-2 times a monthFor some years now Not Applicable
Chart 2: Frequency of Taxi use
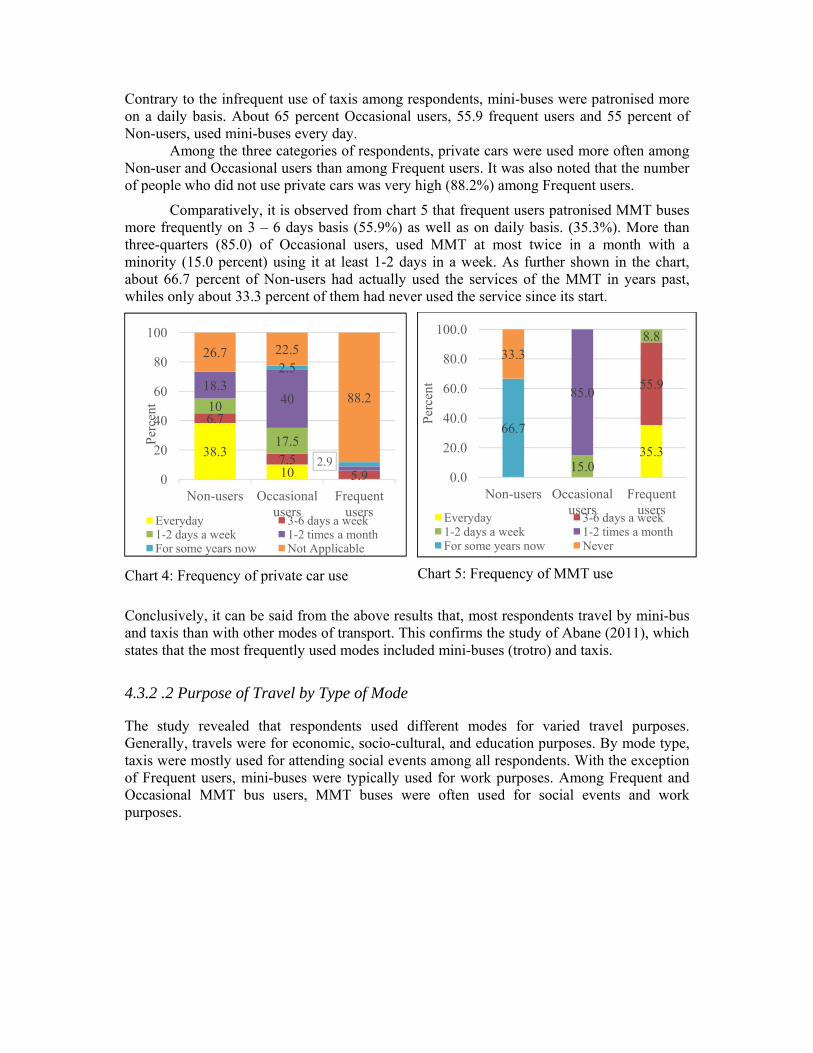
L l f S i D li f P bli T d M d Ch i i A Gh 29
Contrary to the infrequent use of taxis among respondents, mini-buses were patronised more on a daily basis. About 65 percent Occasional users, 55.9 frequent users and 55 percent of Non-users, used mini-buses every day.
Among the three categories of respondents, private cars were used more often among Non-user and Occasional users than among Frequent users. It was also noted that the number of people who did not use private cars was very high (88.2%) among Frequent users.
Comparatively, it is observed from chart 5 that frequent users patronised MMT buses more frequently on 3 – 6 days basis (55.9%) as well as on daily basis. (35.3%). More than three-quarters (85.0) of Occasional users, used MMT at most twice in a month with a minority (15.0 percent) using it at least 1-2 days in a week. As further shown in the chart, about 66.7 percent of Non-users had actually used the services of the MMT in years past, whiles only about 33.3 percent of them had never used the service since its start.
Chart 5: Frequency of MMT use
Conclusively, it can be said from the above results that, most respondents travel by mini-bus and taxis than with other modes of transport. This confirms the study of Abane (2011), which states that the most frequently used modes included mini-buses (trotro) and taxis.
4.3.2 .2 Purpose of Travel by Type of Mode
The study revealed that respondents used different modes for varied travel purposes. Generally, travels were for economic, socio-cultural, and education purposes. By mode type, taxis were mostly used for attending social events among all respondents. With the exception of Frequent users, mini-buses were typically used for work purposes. Among Frequent and Occasional MMT bus users, MMT buses were often used for social events and work purposes.
35.3
55.9
15.0
8.8
85.0
66.7
33.3
0.0
20.0
40.0
60.0
80.0
100.0
Non-users Occasional users
Frequent users
Per
cent
Everyday 3-6 days a week1-2 days a week 1-2 times a monthFor some years now Never
38.3
10
6.7
7.55.9
10
17.5
18.340
2.9
2.526.7 22.5
88.2
0
20
40
60
80
100
Non-users Occasional users
Frequent users
Per
cent
Everyday 3-6 days a week1-2 days a week 1-2 times a monthFor some years now Not Applicable
Chart 4: Frequency of private car use

Level of Service Delivery of Public Transport and Mode Choice in Accra, Ghana 30
Chart 6: Purpose of travel by taxi
From the chart 6 above, majority (88.3%) of Non-users used taxis for social events whiles about 68.3 percent of them used it for work purposes. The least purpose for taxi use was for schooling (11.7%). It is also observed that taxis are not used for leisure purposes among Non-user respondents.
Among Occasional users, a little more than half (54.1%) representing 37.7 percent of all purposes for taxi use, used taxi for social events. It was seconded by taxi for family and friend visitation, whiles only about 5.4 percent of respondents used taxis for leisure purposes. The observation for taxi use is similar among Frequent users as well. About 58.8 percent of them used taxis for social purposes, followed by 47.1 percent who employed taxis for purposes of visiting family and friends. Although the least purpose (3.3%), about 5.9 percent of Frequent users used taxis for leisure.
4.3.2 .3 Purpose of Mini-bus use Contrary to the use of taxis, mini-buses are typically used for economic purposes (work/office or for marketing/shopping). Chart 7, indicates that whereas 63.0 percent of Non-users used mini-buses for work or office reasons, about 51.9 percent used it for marketing or shopping purposes.
Of all the purposes mini-buses were used for, work purposes were highest (47.6%) among Occasional users. More a quarter (30.0%) also used it for social events whiles it was used a few times (1.6%) for leisure purposes by about 2.5 percent of Occasional users.
Most Frequent user respondents (54.5% and 51.5%) used mini-bus for visitation of family and friends and social events respectively. This is closely followed by about 42.4% of them that used the mode for work/office purposes. Though not a very popular travel purpose among respondents, about 6.1 percent of Frequent users used mini-buses for leisure purposes.
Chart 7: Purpose of Travel by mini-bus
0 20 40 60 80 100
Work
School
Visit family and friends
Social events
Trading/shopping
Leisure
PercentFrequent users occasional users Non-users
0 20 40 60 80
Work School
Visit family and friendsSocial events
Trading/shoppingLeisure
PercentFrequent users occasional users Non-users
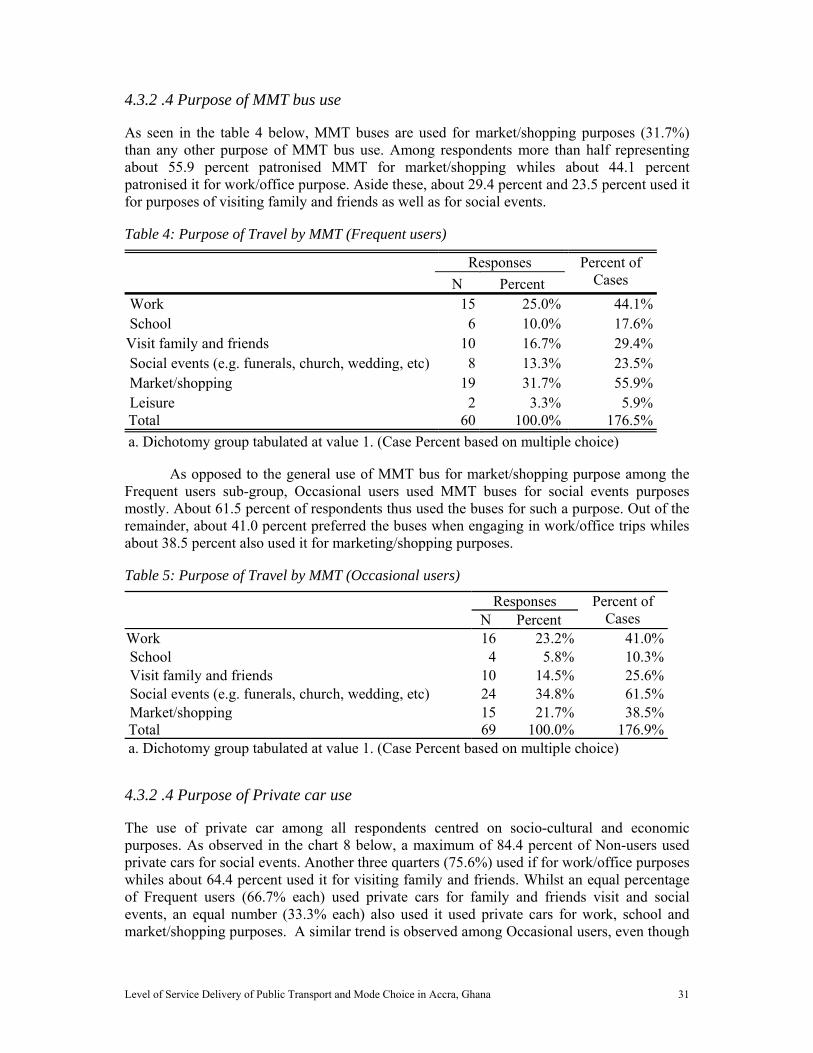
Level of Service Delivery of Public Transport and Mode Choice in Accra, Ghana 31
4.3.2 .4 Purpose of MMT bus use
As seen in the table 4 below, MMT buses are used for market/shopping purposes (31.7%) than any other purpose of MMT bus use. Among respondents more than half representing about 55.9 percent patronised MMT for market/shopping whiles about 44.1 percent patronised it for work/office purpose. Aside these, about 29.4 percent and 23.5 percent used it for purposes of visiting family and friends as well as for social events.
Table 4: Purpose of Travel by MMT (Frequent users)
Responses Percent of Cases N Percent
Work 15 25.0% 44.1% School 6 10.0% 17.6% Visit family and friends 10 16.7% 29.4% Social events (e.g. funerals, church, wedding, etc) 8 13.3% 23.5% Market/shopping 19 31.7% 55.9% Leisure 2 3.3% 5.9% Total 60 100.0% 176.5%
a. Dichotomy group tabulated at value 1. (Case Percent based on multiple choice)
As opposed to the general use of MMT bus for market/shopping purpose among the Frequent users sub-group, Occasional users used MMT buses for social events purposes mostly. About 61.5 percent of respondents thus used the buses for such a purpose. Out of the remainder, about 41.0 percent preferred the buses when engaging in work/office trips whiles about 38.5 percent also used it for marketing/shopping purposes.
Table 5: Purpose of Travel by MMT (Occasional users)
Responses Percent of Cases N Percent
Work 16 23.2% 41.0%School 4 5.8% 10.3%Visit family and friends 10 14.5% 25.6%Social events (e.g. funerals, church, wedding, etc) 24 34.8% 61.5%Market/shopping 15 21.7% 38.5%Total 69 100.0% 176.9%a. Dichotomy group tabulated at value 1. (Case Percent based on multiple choice)
4.3.2 .4 Purpose of Private car use
The use of private car among all respondents centred on socio-cultural and economic purposes. As observed in the chart 8 below, a maximum of 84.4 percent of Non-users used private cars for social events. Another three quarters (75.6%) used if for work/office purposes whiles about 64.4 percent used it for visiting family and friends. Whilst an equal percentage of Frequent users (66.7% each) used private cars for family and friends visit and social events, an equal number (33.3% each) also used it used private cars for work, school and market/shopping purposes. A similar trend is observed among Occasional users, even though
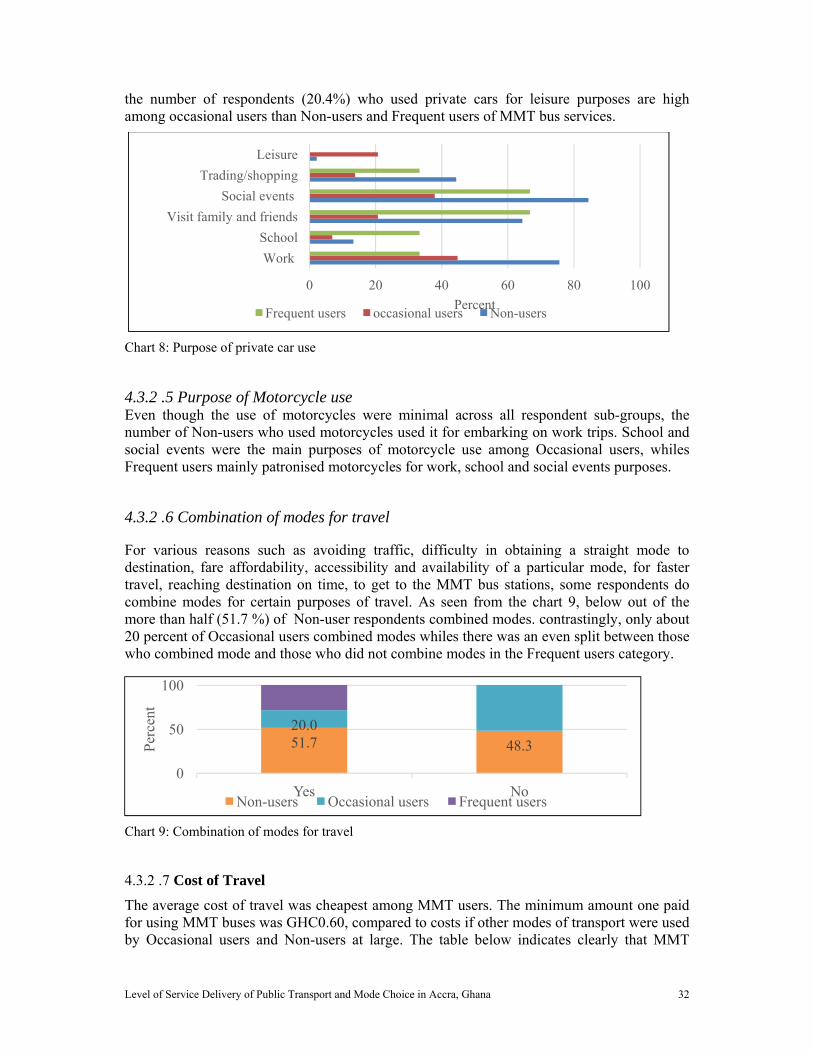
Level of Service Delivery of Public Transport and Mode Choice in Accra, Ghana 32
the number of respondents (20.4%) who used private cars for leisure purposes are high among occasional users than Non-users and Frequent users of MMT bus services.
Chart 8: Purpose of private car use
4.3.2 .5 Purpose of Motorcycle use Even though the use of motorcycles were minimal across all respondent sub-groups, the number of Non-users who used motorcycles used it for embarking on work trips. School and social events were the main purposes of motorcycle use among Occasional users, whiles Frequent users mainly patronised motorcycles for work, school and social events purposes.
4.3.2 .6 Combination of modes for travel
For various reasons such as avoiding traffic, difficulty in obtaining a straight mode to destination, fare affordability, accessibility and availability of a particular mode, for faster travel, reaching destination on time, to get to the MMT bus stations, some respondents do combine modes for certain purposes of travel. As seen from the chart 9, below out of the more than half (51.7 %) of Non-user respondents combined modes. contrastingly, only about 20 percent of Occasional users combined modes whiles there was an even split between those who combined mode and those who did not combine modes in the Frequent users category.
Chart 9: Combination of modes for travel
4.3.2 .7 Cost of Travel
The average cost of travel was cheapest among MMT users. The minimum amount one paid for using MMT buses was GHC0.60, compared to costs if other modes of transport were used by Occasional users and Non-users at large. The table below indicates clearly that MMT
0 20 40 60 80 100
Work
School
Visit family and friends
Social events
Trading/shopping
Leisure
PercentFrequent users occasional users Non-users
51.7 48.320.0
0
50
100
Yes No
Per
cent
Non-users Occasional users Frequent users
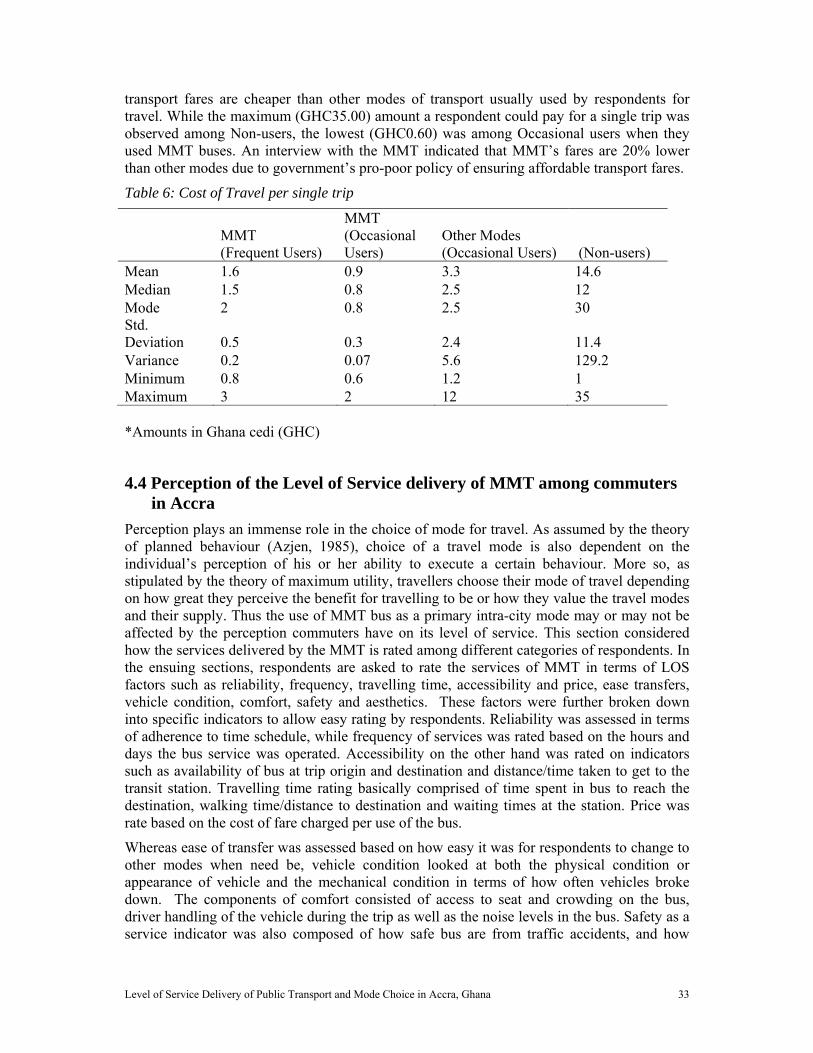
Level of Service Delivery of Public Transport and Mode Choice in Accra, Ghana 33
transport fares are cheaper than other modes of transport usually used by respondents for travel. While the maximum (GHC35.00) amount a respondent could pay for a single trip was observed among Non-users, the lowest (GHC0.60) was among Occasional users when they used MMT buses. An interview with the MMT indicated that MMT’s fares are 20% lower than other modes due to government’s pro-poor policy of ensuring affordable transport fares.
Table 6: Cost of Travel per single trip
MMT (Frequent Users)
MMT (Occasional Users)
Other Modes (Occasional Users) (Non-users)
Mean 1.6 0.9 3.3 14.6 Median 1.5 0.8 2.5 12 Mode 2 0.8 2.5 30 Std. Deviation 0.5 0.3 2.4 11.4 Variance 0.2 0.07 5.6 129.2 Minimum 0.8 0.6 1.2 1 Maximum 3 2 12 35 *Amounts in Ghana cedi (GHC)
4.4 Perception of the Level of Service delivery of MMT among commuters in Accra
Perception plays an immense role in the choice of mode for travel. As assumed by the theory of planned behaviour (Azjen, 1985), choice of a travel mode is also dependent on the individual’s perception of his or her ability to execute a certain behaviour. More so, as stipulated by the theory of maximum utility, travellers choose their mode of travel depending on how great they perceive the benefit for travelling to be or how they value the travel modes and their supply. Thus the use of MMT bus as a primary intra-city mode may or may not be affected by the perception commuters have on its level of service. This section considered how the services delivered by the MMT is rated among different categories of respondents. In the ensuing sections, respondents are asked to rate the services of MMT in terms of LOS factors such as reliability, frequency, travelling time, accessibility and price, ease transfers, vehicle condition, comfort, safety and aesthetics. These factors were further broken down into specific indicators to allow easy rating by respondents. Reliability was assessed in terms of adherence to time schedule, while frequency of services was rated based on the hours and days the bus service was operated. Accessibility on the other hand was rated on indicators such as availability of bus at trip origin and destination and distance/time taken to get to the transit station. Travelling time rating basically comprised of time spent in bus to reach the destination, walking time/distance to destination and waiting times at the station. Price was rate based on the cost of fare charged per use of the bus.
Whereas ease of transfer was assessed based on how easy it was for respondents to change to other modes when need be, vehicle condition looked at both the physical condition or appearance of vehicle and the mechanical condition in terms of how often vehicles broke down. The components of comfort consisted of access to seat and crowding on the bus, driver handling of the vehicle during the trip as well as the noise levels in the bus. Safety as a service indicator was also composed of how safe bus are from traffic accidents, and how
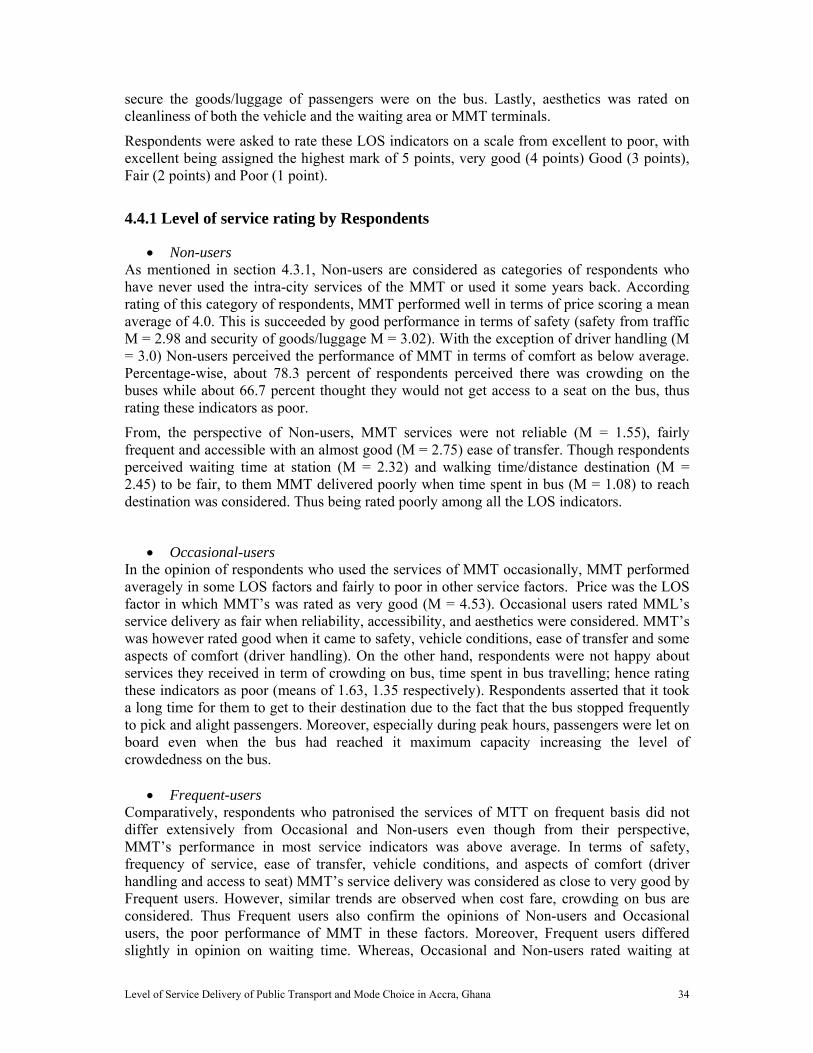
Level of Service Delivery of Public Transport and Mode Choice in Accra, Ghana 34
secure the goods/luggage of passengers were on the bus. Lastly, aesthetics was rated on cleanliness of both the vehicle and the waiting area or MMT terminals.
Respondents were asked to rate these LOS indicators on a scale from excellent to poor, with excellent being assigned the highest mark of 5 points, very good (4 points) Good (3 points), Fair (2 points) and Poor (1 point).
4.4.1 Level of service rating by Respondents
Non-users As mentioned in section 4.3.1, Non-users are considered as categories of respondents who have never used the intra-city services of the MMT or used it some years back. According rating of this category of respondents, MMT performed well in terms of price scoring a mean average of 4.0. This is succeeded by good performance in terms of safety (safety from traffic M = 2.98 and security of goods/luggage M = 3.02). With the exception of driver handling (M = 3.0) Non-users perceived the performance of MMT in terms of comfort as below average. Percentage-wise, about 78.3 percent of respondents perceived there was crowding on the buses while about 66.7 percent thought they would not get access to a seat on the bus, thus rating these indicators as poor.
From, the perspective of Non-users, MMT services were not reliable (M = 1.55), fairly frequent and accessible with an almost good (M = 2.75) ease of transfer. Though respondents perceived waiting time at station (M = 2.32) and walking time/distance destination (M = 2.45) to be fair, to them MMT delivered poorly when time spent in bus (M = 1.08) to reach destination was considered. Thus being rated poorly among all the LOS indicators.
Occasional-users In the opinion of respondents who used the services of MMT occasionally, MMT performed averagely in some LOS factors and fairly to poor in other service factors. Price was the LOS factor in which MMT’s was rated as very good (M = 4.53). Occasional users rated MML’s service delivery as fair when reliability, accessibility, and aesthetics were considered. MMT’s was however rated good when it came to safety, vehicle conditions, ease of transfer and some aspects of comfort (driver handling). On the other hand, respondents were not happy about services they received in term of crowding on bus, time spent in bus travelling; hence rating these indicators as poor (means of 1.63, 1.35 respectively). Respondents asserted that it took a long time for them to get to their destination due to the fact that the bus stopped frequently to pick and alight passengers. Moreover, especially during peak hours, passengers were let on board even when the bus had reached it maximum capacity increasing the level of crowdedness on the bus.
Frequent-users Comparatively, respondents who patronised the services of MTT on frequent basis did not differ extensively from Occasional and Non-users even though from their perspective, MMT’s performance in most service indicators was above average. In terms of safety, frequency of service, ease of transfer, vehicle conditions, and aspects of comfort (driver handling and access to seat) MMT’s service delivery was considered as close to very good by Frequent users. However, similar trends are observed when cost fare, crowding on bus are considered. Thus Frequent users also confirm the opinions of Non-users and Occasional users, the poor performance of MMT in these factors. Moreover, Frequent users differed slightly in opinion on waiting time. Whereas, Occasional and Non-users rated waiting at
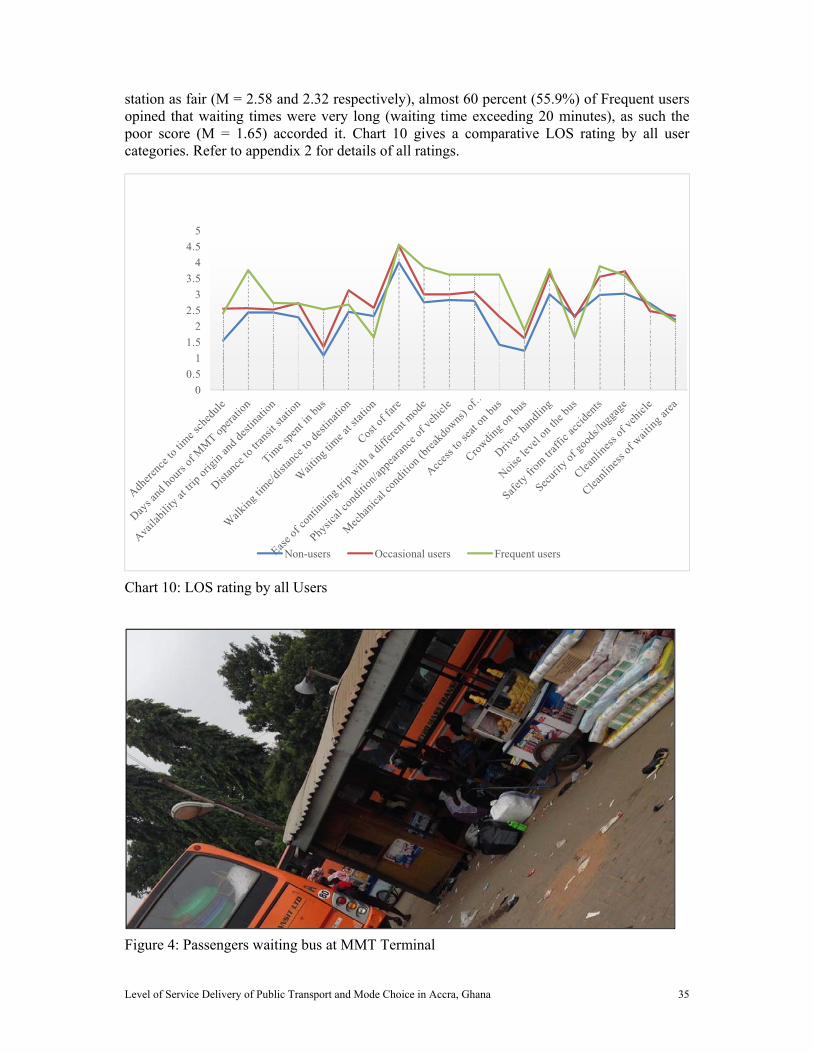
Level of Service Delivery of Public Transport and Mode Choice in Accra, Ghana 35
station as fair (M = 2.58 and 2.32 respectively), almost 60 percent (55.9%) of Frequent users opined that waiting times were very long (waiting time exceeding 20 minutes), as such the poor score (M = 1.65) accorded it. Chart 10 gives a comparative LOS rating by all user categories. Refer to appendix 2 for details of all ratings.
Chart 10: LOS rating by all Users
Figure 4: Passengers waiting bus at MMT Terminal
0
0.5
1
1.5
2
2.5
3
3.5
4
4.5
5
Non-users Occasional users Frequent users
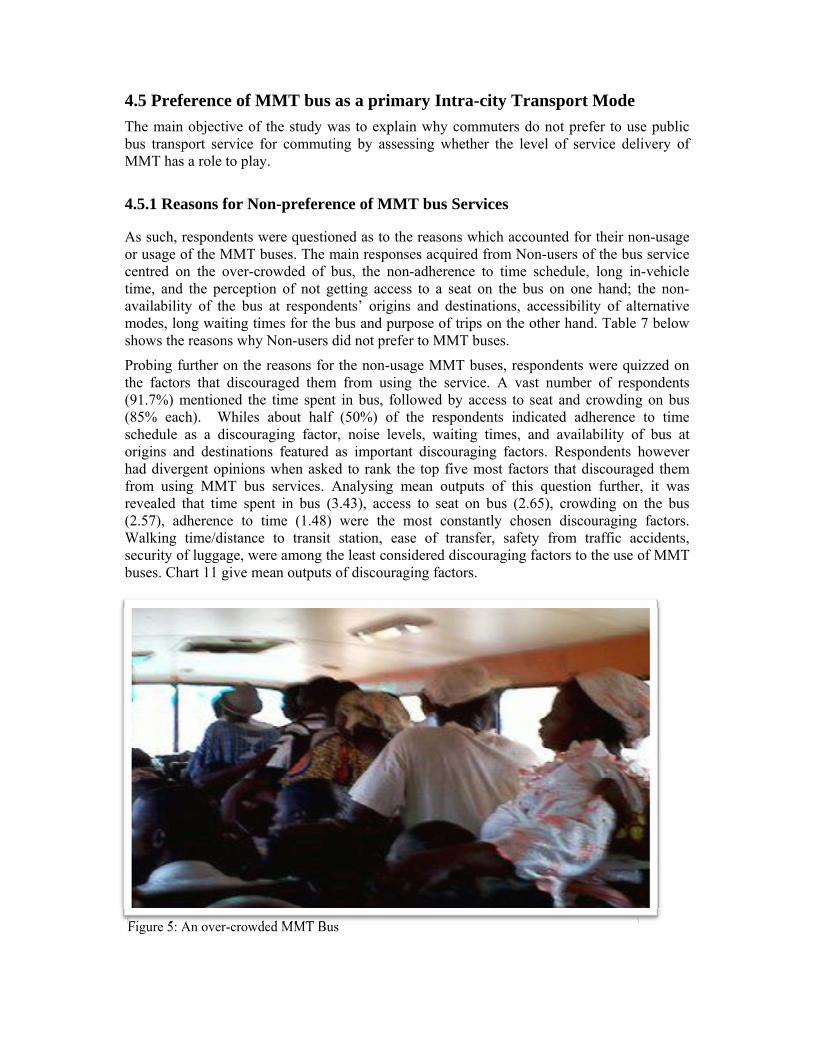
L l f S i D li f P bli T d M d Ch i i A Gh 36
4.5 Preference of MMT bus as a primary Intra-city Transport Mode
The main objective of the study was to explain why commuters do not prefer to use public bus transport service for commuting by assessing whether the level of service delivery of MMT has a role to play.
4.5.1 Reasons for Non-preference of MMT bus Services
As such, respondents were questioned as to the reasons which accounted for their non-usage or usage of the MMT buses. The main responses acquired from Non-users of the bus service centred on the over-crowded of bus, the non-adherence to time schedule, long in-vehicle time, and the perception of not getting access to a seat on the bus on one hand; the non-availability of the bus at respondents’ origins and destinations, accessibility of alternative modes, long waiting times for the bus and purpose of trips on the other hand. Table 7 below shows the reasons why Non-users did not prefer to MMT buses.
Probing further on the reasons for the non-usage MMT buses, respondents were quizzed on the factors that discouraged them from using the service. A vast number of respondents (91.7%) mentioned the time spent in bus, followed by access to seat and crowding on bus (85% each). Whiles about half (50%) of the respondents indicated adherence to time schedule as a discouraging factor, noise levels, waiting times, and availability of bus at origins and destinations featured as important discouraging factors. Respondents however had divergent opinions when asked to rank the top five most factors that discouraged them from using MMT bus services. Analysing mean outputs of this question further, it was revealed that time spent in bus (3.43), access to seat on bus (2.65), crowding on the bus (2.57), adherence to time (1.48) were the most constantly chosen discouraging factors. Walking time/distance to transit station, ease of transfer, safety from traffic accidents, security of luggage, were among the least considered discouraging factors to the use of MMT buses. Chart 11 give mean outputs of discouraging factors.
Figure 5: An over-crowded MMT Bus

Level of Service Delivery of Public Transport and Mode Choice in Accra, Ghana 37
Table 7: Reasons for non-use of MMT
Reasons
Responses Percent of Cases N Percent
Non-availability at origin and destination 42 9.3% 70.0%
Purpose of trip not allowing usage 33 7.3% 55.0%
Expensive transport fare 1 0.2% 1.7%
Longer time spent to reach destination 54 12.0% 90.0%
Long distance to destination 32 7.1% 53.3%
Accessibility of alternative modes 38 8.4% 63.3%
None-adhere to schedule 54 12.0% 90.0%
Long waiting time for bus 37 8.2% 61.7%
Have to use many other modes if i use it 8 1.8% 13.3%
Over-crowdedness 55 12.2% 91.7%
Will not get access to a seat 50 11.1% 83.3%
Buses do not physically appeal to me 1 0.2% 1.7%
Lot of noise on bus 16 3.5% 26.7%
Drivers do not handle bus well during trip 5 1.1% 8.3%
Fear of being involved in traffic accidents 3 0.7% 5.0%
Buses are not clean 17 3.8% 28.3%
Waiting area/station are not clean 4 0.9% 6.7%
Buses are too big 1 0.2% 1.7%Total 451 100.0% 751.7%
The underlining objective of measuring LOS by transit providers as outlined by most researchers (for instance, Beira˜o and Cabral, 2005; Eboli and Mazzula, 2012) to improve the service quality attributions considered important to customers and to attract further users, especially non-users. In spite of reasons given for not using MMT as seen in table 7, there was a general consensus among Non-user respondents to shift to the use of MMT, if factors which discouraged them from patronising the services were improved. In addition to this the research further questioned them to identify the top five factors Non-users would consider most important in their use of MMT. The study revealed that of all the LOS factors being assessed, in-vehicle time (time spent in bus travelling), access to seats, adherence to time schedules, level of crowdedness on the bus and price topped the list of most important factors considered by Non-users. Chart 12, shows the mean outputs of ranking of most important factors. Appendix 3 gives details of all discouraging factors by respondent category.

Level of Service Delivery of Public Transport and Mode Choice in Accra, Ghana 38
Chart 11: Discouraging factors for MMT use
Chart 12: Most Important LOS Factors of Non-users
1.480.33
0.880.17
03.43
0.880.07
2.570.07
0.40.280.27
2.650.32
0.820.25
0.03
0 1 2 3 4
Adherence to time scheduleHours and Days of operation
Waiting time at stationWalking time/distance to transit station
Walking time/distance to destination
Time spent in Bus travellingAvailability of bus at origins and destinations
Ease of TransferCrowding on bus
Safety from traffic accidents
Mechanical Condition of vehicleCleanliness of Vehicle
Cleanliness of Waiting areaAccess to seat on bus
Driver handling of vehicle
Noise level on busPhysical Condition/appearance of vehicle
Security of goods/luggage
Mean Score
Aherence to time schedule ,
1.7
Time spent in bus travelling , 3.2
[CATEGORY NAME] [VALUE]
Mechanical Condition of Vehicle , 0.8
Access to seat , 2.7
Crowding on bus , 2.4
Aherence to time schedule Hours and days of operation Availability at origin and destinationDistance to transit station Time spent in bus travelling Walking Distance/time to destionation walking distance to station Waiting time at station Cost of fare Ease of transfer Physical condtion of vehicles Mechanical Condition of Vehicle Access to seat Crowding on bus Driver handling of busLevel of noise on bus Safety from traffic accidents Security of goods/luggagea Cleanliness of Vehicle Cleanliness of waitin area

L l f S i D li f P bli T d M d Ch i i A Gh 39
4.5.2 Reasons for use of MMT bus Services
This study also sought to find out the factors which influenced the use of MMT from its users. It was revealed that a huge number (79.4%) of Frequent users strongly agreed that they patronised services of MMT due to affordability of fare whiles another 73.5 percent also strongly agreed that the purpose of their trips contributed to their patronage. As indicated in section 4.3.2.4, most users (55.9%) patronised MMT for trading/shopping purposes. Due to their large capacities and space for luggage as well as the strategic locations of most MMT terminals to major marketing centres, it is not surprising that it is patronised mostly by traders and market women. For most Occasional users, MMT use was largely owed to its affordability as well as its availability at their origins and destinations as shown by the charts below.
Chart 14: Reasons for MMT use by Occasional users
In spite of the factors that influenced user (both frequent and occasional), certain factors also served as discouraging factors to their preference of the MMT buses. Among the total of 34 frequent respondents, 16 respondents (47.1%) had issues with the service delivery of MMT. Out of this 16 respondents, fifteen people (93.6%), were displeased about waiting times at the
0
20
40
60
80Trip Purpose
Availability
Affordability
Less Time
Short distance to station
Inadequate alternatives
Strongly Agree Agree Neither Agree nor DisagreeDisagree Strongly Disagree
Chart 13: Reasons for MMT use by Frequent users
0
20
40
60
80Purpose of Trip
Availability
Affordability
Less time
Short distance to stop
Inadequacy of alternative modes
Strongly Agree Agree Neither Agree nor DisagreeDisagree Strongly Disagree

Level of Service Delivery of Public Transport and Mode Choice in Accra, Ghana 40
stations, hence identifying it as a discouraging factor. In all, about 81.3 percent, 75.0 percent, 68.8 percent chose time spent in bus, crowding on bus, and noise levels on bus respectively as part of the top five discouraging factors to the use of MMT bus, even though they still patronised it. Occasional user respondents also disclosed a similar problem. A vast number (94.9%) of them settled on time spent in bus as a major issue when it came to discouraging factors. In addition to this, crowding on bus (76.9%), access to seat (69.2%), cleanliness of waiting areas (51.3%), noise levels on bus (48.7), waiting time at stations (35.9) and cleanliness of vehicles were among the topmost discouraging factors identified by Occasional users.
Chart 15: Discouraging Factors - Frequent users
Chart 16: Discouraging Factors - Occasional users
3.2 3.3
4.7
3.3 3.2
4.23.7
3.3
4.4
3.2 3.2 3.43.7
3.4
4.2
3.3 3.3 3.3
0.00.51.01.52.02.53.03.54.04.55.0
Waiting time at station, 1.1
Time in bus, [VALUE]
Availability, [VALUE]
Crowding, [VALUE]
Access to seat , 2.2
Noise Level, [VALUE]
Cleanliness of Vehicle , 0.9 Cleanliness
of waiting area , 1.4
Adherence to time schedule
Hours and Days of operation
Waiting time at station
Walking time/distance to transit station
Walking time/distance to destination
Time spent in Bus travelling
Availability of bus at origins and destinationsEase of Transfer
Crowding on bus
Safety from traffic accidents
Physical condition/appearance of vehicle
Mechanical Condition of vehicle
Access to seat
Driver handling of bus

Level of Service Delivery of Public Transport and Mode Choice in Accra, Ghana 41
4.5.3 Perception of MMT’s LOS and Mode Choice
Some transport literature notes that the existence of taste variation in a population leads to dissimilar evaluation of characteristics and level of services which may lead to different choice behaviour (Quentin and Hong, 2005). Tyrinopoulos and Antoniou (2013) found in a study that female respondents have a lower preference towards car than male respondents, while respondents between the ages of 35 and 44 showed a higher preference for car. Redman et al, (2013) also agree that the relative importance of quality attributes in affecting Public Transport demand is to a large extent dependent on user demographics, personal situations and previous experiences with public transport services.
Based on these observations, the following hypotheses were formulated and tested to observe if significant differences existed in the perception rating of MMT among the three groups of respondents (Frequent users, Occasional users and Non-users) and their choice of MMT.
1. There is no difference in the perception of the LOS of MMT among Frequent users, Occasional users and Non-users
2. There is no difference in the perception of males and females in their choice of MMT 3. Age has no influence on the perception and choice of MMT 4. Average monthly income has no effect on the perception and choice of MMT
The test results from a one-way ANOVA, indicated that there is significant difference in how in how Frequent, Occasional and Non-users perceived the level of service of the MMT (reliability, frequency, in-vehicle time, waiting time, cost of fare, seat access, crowding, safety) (F(2,133) = 14.707, 38.683, 45.388, 14.346, 10.529, 61.056, 7.700 and 17.346, respectively, p < 0.05) There was however no significant difference among respondents in how they perceived accessibility (in terms of availability of bus at origins and destinations) p = 0.288); aesthetics (cleanliness vehicles and waiting areas) (p = 0.425, 0.653 respectively).
A Tukey post-hoc test revealed for instance significant differences existed between Frequent users (M = 2.5, SD = 1.3, p = 0.000) and Non-users (M = 1.6, SD = 0.9, p = 0.000) as well as between Occasional users (M = 2.6, SD = 0.9, p = 0.000) and Non-users (M = 1.6, SD = 0.9, p = 0.000) in rating of reliability but no statistically significant differences between Frequent users and Occasional users (p = 0.824). The table below gives details of ANOVA results and appendix 4 gives of Tukey post-hoc test.

Level of Service Delivery of Public Transport and Mode Choice in Accra, Ghana 42
Table 8: ANOVA results of Respondents Perception of MMT's LOS
ANOVA LOS Variables LOS indicators Sum of
Squares df Mean
Square F Sig.
Reliability Adherence to time schedule
Between Groups
29.410 2 14.705 14.707 .000
Within Groups
130.985 131 1.000
Total 160.396 133
Accessibility
Days and hours of operation
Between Groups
41.710 2 20.855 38.683 .000
Within Groups
70.626 131 .539
Total 112.336 133 Availability at trip origin and destination
Between Groups
1.283 2 .642 1.258 .288
Within Groups
99.433 131 .749
Total 97.098 133 Distance to transit station
Between Groups
6.216 2 3.108 5.013 .008
Within Groups
81.217 131 .620
Total 87.433 133
Travelling Time
In-vehicle time Between Groups
47.227 2 23.613 45.388 .000
Within Groups
68.154 131 .520
Total 115.381 133 Walking time/distance to destination
Between Groups
10.983 2 5.492 8.497 .000
Within Groups
84.666 131 .646
Total 95.649 133 Waiting time at station
Between Groups
16.761 2 8.380 14.346 .000
Within Groups
76.523 131 .584
Total 93.284 133
Price
Cost of fare Between Groups
9.702 2 4.851 10.529 .000
Within Groups
60.357 131 .461
Total 70.060 133 Ease of Transfer Ease of
continuing trip with a different mode
Between Groups
27.023 2 13.511 28.773 .000
Within Groups
61.515 131 .470
Total 88.537 133
Vehicle Conditions
Physical condition/appearance of vehicle
Between Groups
14.241 2 7.120 15.288 .000
Within Groups
61.013 131 .466
Total 75.254 133 Mechanical condition of vehicles
Between Groups
14.521 2 7.260 14.323 .000
Within Groups
66.404 131 .507

Level of Service Delivery of Public Transport and Mode Choice in Accra, Ghana 43
Total 80.925 133
Comfort
Access to seat on bus
Between Groups
105.345 2 52.673 61.056 .000
Within Groups
113.013 131 .863
Total 218.358 133 Crowding on bus Between
Groups 9.832 2 4.916 7.700 .001
Within Groups
83.638 131 .638
Total 93.470 133 Driver handling Between
Groups 17.136 2 8.568 13.176 .000
Within Groups
84.533 130 .650
Total 101.669 132 Noise level on the bus
Between Groups
11.233 2 5.616 11.665 .000
Within Groups
63.073 131 .481
Total 74.306 133
Safety
Safety from traffic accidents
Between Groups
19.177 2 9.588 17.346 .000
Within Groups
72.413 131 .553
Total 91.590 133 Security of goods/luggage
Between Groups
14.150 2 7.075 10.391 .000
Within Groups
89.194 131 .681
Total 103.343 133
Aesthetics
Cleanliness of vehicle
Between Groups
1.420 2 .710 .862 .425
Within Groups
107.923 131 .824
Total 109.343 133 Cleanliness of waiting area
Between Groups
.644 2 .322 .428 .653
Within Groups
98.640 131 .753
Total 99.284 133
An independent-samples t-test was conducted to compare the differences in perception of males and females on the LOS delivery of MMT. The test revealed that there was no significant difference between males and females on the all LOS indicators except for scores between males (M = 2.32, SD = 0.96) and females (M = 2.32, SD = 0.96); t(132) = -2.66, p = 0.009) on availability of buses at trip origins and destinations. Refer to details in appendix 5.
For effects on whether there is significant difference in age categories in perception of MMT’s LOS, a one-way ANOVA was conducted. The results revealed insignificant differences in age for most LOS indicators (p > 0.05). Significant differences were however were observed in LOS factors such as Frequency (F(2,133) = 3.493, p = 0.033); travelling time [time in bus (F(2,133) = 3.302, p = 0.040); walking time/distance to destination (F(2,133) = 4.673, p = 0.011); waiting time at station (F(2,133) = 7.855, p = 0.001)] and ease of transfer (F(2,133) = 5.770, p = 0.004) respectively. A Tukey post-hoc test showed significant differences existed for instance between age category 18-25 (M = 2.5, SD = 0.9, p

Level of Service Delivery of Public Transport and Mode Choice in Accra, Ghana 44
= 0.043) and age category 40-59 (M = 3.2, SD = 0.9, p = 0.043) as well as between age group 26-39 (M = 2.6, SD = 0.8, p = 0.012) and age group 40-59 (M = 3.2, SD = 0.9, p = 0.012) in rating of walking time/distance to destination. Details give on appendix 6.
Lastly, a one-way ANOVA test revealed difference in the perception of various income groups on LOS factors such frequency (days and hours of operation (F(5,133) = 3.439, p = 0.006), travelling time (time spent in bus (F(5,133) = 4.872, p = 0.000, walking time/distance to destination (F(5,133) = 3.463, p = 0.000 and waiting time (F(5,133) = 8.482, p = 0.000) and well as comfort (access to seat (F(5,133) = 4.508, p = 0.015) and aesthetics (cleanliness of vehicles (F(5,133) = 2.578, p = 0.029 ). Using seat access as an example, A Tukey post-hoc test showed significant differences existed for instance between respondents who earned less than GHC200 (M = 3.0, SD = 1.5, p = 0.010) and those who earned above GHC800 (M = 1.8, SD = 1.2, p = 0.010). Details attached in appendix 7.
Level of Service Delivery of Public Transport and Mode Choice in Accra, Ghana 45
Chapter 5: Conclusions and recommendations
5.1 Introduction
This chapter outlines the main findings and conclusions derived from the field study along the lines of the research objective, main research question and sub-research questions. The chapter then ends with recommendations for policy decisions.
It was the objective of this study to explain why commuters in Accra do not prefer to use public bus for commuting. By this the study sought to answer a main research question of how commuter’s perception affected their choice or preference for Metro Mass Transit (MMT), the only formal bus service run in the city. Specifically, the study sought to answer questions on the travel characteristics of commuters in Accra, their perception of the LOS of MMT, among different user categories of frequent users, occasional and non-users of the bus service. Most importantly, the study sought reasons from non-users to their non-usages to make recommendations for service improvement in public transportation the city of Accra.
5.2 Analysis of the Data
To ascertain the reliability of indicators used on the Likert scale to establish LOS related indicators, Cronbach’s alpha test was conducted on the data to establish that values gotten were enough to measure the level of service ratings of the respondents. An alpha (α) coefficient of 0.819 (19 items) was arrived at. This demonstrates that the indicators used were sufficient to measure the level of service ratings, since the alpha coefficient is greater than 0.7. This makes the data internally reliable. A one-way ANOVA and independent samples t test were mostly employed in establishing significant relationships across the data sets.
5.3 Travel by Public Transport
Findings from study indicate that respondents used multiple modes for commuting. The major modes of transport usually for commuting by respondents included taxis, mini-buses (trotro), MMT), motorcycles as well as personal or private cars. Respondents were unanimous on accessibility of transport which weighed heavily on their decision to select one mode over the other. It was realised from the study that mini-buses and taxis respectively were the most frequently used public transport modes. This gives credence to the study by Abane (2011) on travel behaviour in Ghana that trotros (mini-buses) and taxis are the preferred modes of travel.
As recognised in literature (Racca and Ratledge 2004; Ortuzar and Willumsen, 2011), characteristics of a trip in terms of purpose, that is whether for work, recreation, school, shopping et cetera has influence on mode choice. The study showed that commuters used varied modes of public transport for numerous travel purposes. Commuting for work (including trading), educational purposes as well as socio-cultural purposes were the drivers for their daily encounter with transport systems. Commuters who frequented the MMT, mostly used it for trading/shopping purposes. Interview with such commuters who were mostly market women indicated that, the spacious nature of the buses gave them enough room for their goods/luggage.
Respondents highly favoured speed of a public transport system in their mode choice and this was given credence to their perceived preference to minibuses relative to other modes including the MMT. Whereas most bus systems in most parts of the developed world owe

Level of Service Delivery of Public Transport and Mode Choice in Accra, Ghana 46
their frequent services to dedicated bus lanes, such conditions does not exist in many developing countries such as Ghana. The research showed that the MMT in Accra, as in other parts of the country do not have bus lanes to deliver efficient services. Commuters assert that whiles mini-buses which are smaller in size, are able to manoeuvre their way in traffic, the size of the MMT buses which have higher capacities than the mini-buses prevent them from doing so. Thus, the preference of other modes of public transport over the MMT.
The study also reveals a finding that the MMT offers the lowest and stable fare owing to the fact that the government absorbs the cost of fare for use of the MMT buses, hence accounting for the 20% low fares charged. In spite of this, it accounts for a low modal share among the commuting public. It has been established by Balcombe et al (2006) that “fares and patronage of a public transport system are inversely related”. But the findings contrast the position advanced by Balcombe et al (2006). However, an interview with an official from the MMT, reveals that the current fleet size (as at the time of study (231) of the company was inadequate to compete with other modes of public transport especially mini-buses which has the highest modal share. The situation is worsened by the fact that mechanical breakdowns resulting mostly from bad road nature also hinders the operations of the MMT. It is therefore partly not surprising that their lower fares are not commensurate with high patronage due to accessibility.
5.4 Perception of Level of Service of Metro Mass Transit
Due to the losing attractiveness of public transport services, Racca and Ratledge, (2004), points out that, a particular level of service of transit is necessary to have people choose to use transit over a car when they have the choice. In addition to this, Eboli and Mazzula, (2012), emphasize that assessing level of service of transit is a way of ensuring continuous improvement of delivered transit services as well as focusing transit agencies on their strategic goals.
Level of service, otherwise known as the quality of service from the consumer’s perceptive as argued by Ali, (2010) is generally difficult to define exhaustively due to the different emphasis placed on various components of the concept by different people and different urban regions. Based on reviewed literature, this study measured level of service based on components which includes reliability, frequency, accessibility, travelling time, ease of transfer, price, vehicle condition, safety, comfort and aesthetics. These 10 variables were however broken down to cover a total of 19 indicators on which the MMT’s level of service was measured.
On a Likert scale of excellent to poor, commuters assessed the level of service of MMT based on how they perceived it. This assessment from three categories of commuters (frequent users of MMT, occasional users and non-users of MMT) revealed that, MMT performed close to excellent in terms of price charged. As has been indicated already, MMT’s fares are 20% lower and confirmed by a travel cost analysis in this study, it is relatively cheaper to travel by MMT than other modes of transport in Accra. All respondents in this study, generally agreed that MMT’s services were on the average when it comes to driver handling, safety from traffic accidents, ease of transfer, security of good/luggage, physical and mechanical conditions of vehicles and seat access.
In about eight of the indicators covering aspects of reliability (adherence to time schedule), frequency (hours and days of operation), accessibility (availability of bus at trip origins and destinations, walking time/distance to transit station), travelling time (time spent in bus, walking time/distance to destination), aesthetics (cleanliness of vehicle, and waiting areas),
Level of Service Delivery of Public Transport and Mode Choice in Accra, Ghana 47
commuters perception was on the lower note, scoring MMT as fair, that is below average. Its poorest performance was recorded in terms of the level of crowding on buses, waiting times and noise levels.
Quentin and Hong, (2005) note that the existence of taste variation in a population leads to dissimilar evaluation of characteristics and level of services. From the perspective of MMT as a service provider, however, differences exist in how it perceives its level of service delivery. Though there is a consensus between commuters and the MMT when price is taken into consideration, thus good to excellent; the MMT perceives that with the exception of cleanliness of waiting area, which it perceives to fair due to the fact that it often shares with other commercial vehicles and thus do not have total control over; its performance ranges from good to very good for all the remaining indicators. This notwithstanding, Eboli and Mazzula, (2012), iterating the view of many researchers, posit that the customer’s point of view is considered most relevant for evaluating transit performance. This is because customers opinions allows the perceived performances of a given transit service to be analysed based on what they expect from the service and their perceptions of what they receive from the service.
Delving deeper into the perception of the various categories of respondents interviewed for this study, it is observed that non-users of MMT, perceive the services of MMT to unreliable, fairly frequent and accessible in addition to being perceived as having a longer in-vehicle time. However some non-users are of the view that MMT performs well when safety from traffic accidents, security of goods/luggage and driver handling are considered. The perception of users who used MMT occasionally, are similar to non-users, adding on that, crowding on bus made the service poor. On the other hand, frequenters of MMT, concurred with non-users and occasional users on poor performance of MMT in crowding and cost respectively. Considerable differences however, existed in how the frequent users rated MMT’s service delivery on most indicators. To this category of respondents, MMT scored above average to very good on indicators such as safety, frequency, ease of transfer. Vehicle conditions, driver handling and access to seat. Differences were also pronounced when waiting time an important component of travelling time was considered. Whereas frequents users considered it as poor expressing long waiting times for bus, occasional and frequent user rather perceived it to be fair. This largely attributed to the frequent users have more contact with the service than the other categories.
Supported further with a one-way ANOVA test, it can be said that the differences in the perception of users, contributed to their level of use of MMT, thus frequently, occasionally or not at all. Refer to table 8 for details.
5.4 Perceived Level of Service and Patronage of Public Transport - Reasons for Metro Mass Transit Non-usage
Several studies (Redman et al, 2013; Polat, 2012; Glerum et al, 2011, de Jong and van de Riet’s, 2008; Beirão and Cabral, 2007; etc) confirm the effects of level of service or quality of service has on choice of mode and consequently patronage of public transport.
Beirão and Cabral, (2007) points out that “asking non-users their perceptions’ about public transport is important in understanding the reasons for non-use; how they would feel if they had to use public transport; and also what would make them switch to alternative modes”. The main objective of this study was to explain the reasons why commuters do not prefer to use MMT for their daily commuting compared to other public transport modes. The study reveal basically that, service indicators such as reliability, frequency, comfort (access to seat,

Level of Service Delivery of Public Transport and Mode Choice in Accra, Ghana 48
crowding, noise levels), accessibility (availability of buses), travelling time (long in-vehicle and waiting times) reflected in the discouraging factors for MMT use, thus explaining why commuters do not prefer to MMT. Hence reflecting in its low modal share as a public transport system in Accra. These findings therefore falls in line with what has been established by literature. For instance, Tyrinopoulos and Antoniou (2013) found in a study that crowding, followed by service unreliability were key discouraging factors for public transit use. Redman et al, (2013) also observe that reliability is a key quality attribute in addition to attributes such as frequency, fare prices, and speed of public transport service, which can attract car users. Furthermore, Beirão, and Cabral’s, (2007) also confirm that if the public transport service is unreliable, has a low frequency or lack of comfort, people are likely to shift to using cars because they do not perceive public transport as a viable alternative to them. Lastly, Polat (2012) add that the longer journey times turns to be, the increase in the tendency for the search of alternative transport modes increases as it is shorter for some transport modes than it is for others.
The inability of MMT to meet the level of service expected by commuters, as revealed by the study can also be partly attributed to the price of fare being charged as well as running on routes deemed unattractive by other public transport modes in support of government’s pro-poor policies. Though the MMT’s patronage is highly anchored on the fares charged, these low fares renders it incapable of making profitable gains. This in turn has effects on its ability for example to increase its fleet size improving availability, repair mechanical faults, and improve level of service delivered and so on.
5.5 Recommendations and Conclusion
Even though the MMT perceives to performing well from its perspective, it is recommended that, it considers the perception of commuters on the desired level of service to be delivered to improve upon their services. This is because this study reveals that commuters, especially occasional and non-users unanimously agreed to shifting and increasing their frequency of MMT use if factors that discouraged their usage were improved. With this revelation in mind, MMT should thus firstly improve on its travel time especially in-vehicle time and waiting time at stations. Subsequently, comfort on buses (in terms of seat access, crowding and noise level) should be improved to make the MMT more attractive to commuters. Also, commuters consider reliability and accessibility of MMT’s service as important to its choice as a primary intra-city mode. MMT should thus improve on these service levels. Lastly improving on the cleanliness of its vehicles and waiting areas would add to attracting more customers to MMT use.
Conclusively, to achieve the objective of promoting mass transport in Accra will demand a shift from the use of unsustainable modes such as mini-buses and taxis to the use of efficient systems such as high capacity buses like MMT. This will reduce the traffic congestion and inefficient use of road space, contributing eventually to ensuring sustainable transportation in the city of Accra. To achieve this however, the MMT needs to take to improve its level of service taking into account commuters desired level of service. One way of achieving this can be through a review of MMT’s pricing system, as fares are said to be fundamental to the operation of public transport, forming a major source of income to operation. Even though Balcombe et al. (2004) proves that fares have an inverse relationship with patronage, this study has proved otherwise. Hence increasing MMT fares to correspond to improved service delivery would go a long way to attracting customers and eventually increasing its modal share.

Level of Service Delivery of Public Transport and Mode Choice in Accra, Ghana 49
5.6 Recommendations for further studies
For future studies, it is recommended that a search be conducted in the willingness of commuters to pay for improved level of service delivery by the MMT.
In future it is also recommended that advanced econometric modelling techniques such as choice modelling should be used in behavioural studies as this.

Level of Service Delivery of Public Transport and Mode Choice in Accra, Ghana 50
Bibliography
Abreha, D. A., 2007. Analysing Public Transport Performance Using Efficiency Measures and Spatial Analysis: The case of Addis Ababa, Ethiopia. MSc. Enschede, The Netherlands: International Institute for Geo-information Science and Earth Observation.
Ali, A. N., 2010. An assessment of the quality of intra-urban bus services in the city of Enugu, Enugu state, Nigeria. Theoretical and Empirical Researches in Urban Management, 6 (15), pp. 74-91. Available at: http://core.kmi.open.ac.uk/download/pdf/6452036.pdf. [Accessed 24/5/2014].
Amos, P., 2004. Public and Private Sector Roles in the Supply of Transport Infrastructure and Services. ITPI, 3 (2), pp. 55-61. Available at: www.itpi.org.in/pdfs/07_07.pdf [Accessed 23/04/2014].
Anable, J., 2005. ‘Complacent car addicts’ or ‘aspiring environmentalists’? Identifying travel behaviour segments using attitude theory. Transport Policy, 12 (1), pp. 65-78. Available at: http://www.sciencedirect.com/science/article/pii/S0967070X0400054X [Accessed 18/5/2014].
Anin, E. K., Annan, J. and Otchere, A. F., 2013. Evaluating the Role of Mass Transit and its Effect on Fuel Efficiency in the Kumasi Metropolis, Ghana. International Journal of Business and Social Research (IJBSR), 3, No. 3 pp. 107-116. Available at: http://thejournalofbusiness.org/index.php/site/article/viewFile/60/59 [Accessed 12/04/2014].
As (van), C. and Joubert van H. S. 1990. Traffic Flow Theory. SARB Chair in Transportation Engineering, Department of Civil Engineering, University of Pretoria, 3rd Edition (0869798006, 9780869798003), pp. 1-362. Available at: http://www.ocs.polito.it/biblioteca/mobilita/UrbanPublicTransportModes.pdf [Accessed 23/04/2014].
Babbie, E. ed., 1990. Survey Research Methods. 2nd. Belmont, CA: Wadsworth Publishing. Balcombe, R., Mackett, R., Paulley, N., Preston, J., et al., 2004. The demand for public
transport: a practical guide. TRL593), Transportation Research Laboratory. Available at: http://www.demandforpublictransport.co.uk/TRL593.pdf [Accessed 8/5/2014].
Berhan, E., Beshah, B. and Kitaw, D. 2013. Performance Analysis on Public Bus Transport of the City of Addis Ababa. International Journal of Computer Information Systems and Industrial Management Applications, 5 (2150-7988), pp. 722-728. Available at: http://www.mirlabs.org/ijcisim/regular_papers_2013/Paper151.pdf .
Carruthers, R., 2005. Affordability of Urban Public Transport. International Conference Series on Competition and Ownership in Land Transport, (Report No. 9), Available at: thredbo9-workshopA-Carruthers-Mitric.pdf [Accessed 21/04/2014].
Cervero, R., 2013. Transport Infrastructure and the Environment: Sustainable Mobility and Urbanism. Working Paper 2013-03), UNIVERSITY OF CALIFORNIA: Berkeley Institute of Urban and Regional Development. Available at: http://iurd.berkeley.edu/publications/wp/2013-03.pdf [Accessed 27/04/2014].
Cooper, R. D. and Schindler, S. P. eds., 2014. BUSINESS RESEARCH METHODS. 12th. New York, USA.: McGraw-Hill/Irwin.
Currie, G. and Wallis, I. 2008. Effective ways to grow urban bus markets – a synthesis of evidence. Journal of Transport Geography, 16 pp. 419-429. Available at: http://www.sciencedirect.com/science/article/pii/S0966692308000306 [Accessed 04/05/2014].
Davidov, E., 2004. Travel Mode Choice as a Rational Choice – Different Aspects. Doktorgrades (Dr. rer. soc.). Tel-Aviv-Jaffa, Israel: Universitätsbibliothek Giessen.
De Leeuw, E. D. and Hox, J. J. 2011. Internet surveys as part of a mixed mode design. Social and Behavioral Research and the Internet: Advances in Applied Methods and Research
Level of Service Delivery of Public Transport and Mode Choice in Accra, Ghana 51
Strategies.Taylor & Francis Group, New York, pp. 45-76. Available at: http://joophox.net/papers/SurveyHandbookCRC.pdf [Accessed 18/5/2014].
Eboli, L. and Mazzulla, G. 2012. Performance indicators for an objective measure of public transport service quality. European Transport \ Trasporti Europei, Paper n° 3 (51), pp. 1-21. Available at: http://www.openstarts.units.it/dspace/bitstream/10077/6119/1/ET_2012_51_3%20-%20Eboli%20e%20 [Accessed 21/04/2014].
European Committee for Standardization, 2002. Transportation - Logistics and Services - Public passenger transport - Service quality definition, targeting and measurement. Available at: http://www.transportbenchmarks.eu/groups/documents/MEETING2-EN13816.pdf [Accessed 2/05/2014].
European Road Transport Research Advisory Council, 2011. European Roadmap: European Bus System of the Future. Available at: http://www.egvi.eu/uploads/Modules/Publications/european_bus_system_of_the_future.pdf [Accessed 27/04/2014].
Gable, G. G., 1994. Integrating case study and survey research methods: an example in information systems. European Journal of Information Systems, 3 (2), pp. 112-126. Available at: http://eprints.qut.edu.au/5853/1/5853.pdf [Accessed 18/5/2014].
Gebeyehu, M. and Takano, S. 2007. Diagnostic evaluation of public transportation mode choice in Addis Ababa. Journal of Public Transportation, 10 (4), pp. 27-50. Available at: http://www.nctr.usf.edu/jpt/pdf/JPT%2010-4%20Gebeyehu.pdf [Accessed 15/5/2014].
Glerum, A., Atasoy, B., Monticone, A. and Bierlaire, M., eds., 2011. Adjectives qualifying individuals’ perceptions impacting on transport mode preferences, [Second International Choice Modelling Conference, Leeds].
Gwilliam, K., 2003. Urban transport in developing countries. Transport Reviews: A Transnational Transdisciplinary Journal, 23 (2), pp. 197-216. Available at: http://dx.doi.org/10.1080/01441640309893 [Accessed 21/04/2014].
Habib, K. M. N., Kattan, L. and Islam, M. 2011. Model of personal attitudes towards transit service quality. Journal of Advanced Transportation, 45 (4), pp. 271-285. Available at: http://onlinelibrary.wiley.com/doi/10.1002/atr.106/full .
Hensher, D. A., 2007. Sustainable public transport systems: Moving towards a value for money and network-based approach and away from blind commitment. Transport Policy, 14 pp. 98-102. Available at: http://www.sciencedirect.com/science/article/pii/S0967070X06000801 [Accessed 20/04/2014].
IBIS Transport Consultants Ltd. 2005. Public Private Infrastructure Advisory Facility. Study of urban public transport conditions in Accra, Ghana. Available at: http://www.ppiaf.org/sites/ppiaf.org/files/documents/toolkits/UrbanBusToolkit/assets/CaseStudies/full_case/Accra.doc. [Accessed 24/04/2014].
Johnson, B., 2001. Toward a new classification of nonexperimental quantitative research. Educational Researcher, 30 (2), pp. 3-13. Available at: http://edr.sagepub.com/content/30/2/3.short [Accessed 18/5/2014].
Kanafani, A. and Wang, R. 2010. Measuring multimodal transport level of service. University of California Transportation Center, Available at: http://www.uctc.net/research/papers/UCTC-FR-2010-26.pdf [Accessed 22/05/2014].
Kumar, A. and Barrett, F. 2008. Stuck in Traffic: Urban Transport in Africa. Africa Infrastructure Country Diagnostic, World Bank, pp. 1-85. Available at: http://www4.worldbank.org/afr/ssatp/resources/Stuck-in-Traffic.pdf .
Kumar, A., Kwakye E. A. and Girma, Z. 2004. What Works in Private Provision of Bus Transport Services—Case Study of Accra and Addis Ababa. CODATU, pp. 1-13. Available at: http://www.codatu.org/wp-content/uploads/What-works-in-private-

Level of Service Delivery of Public Transport and Mode Choice in Accra, Ghana 52
provision-of-bus-transport-services-case-study-of-Accra-and-Addis-Ababa-A.-KUMAR-E.A.-KWAKYE-Z.-GIRMA.pdf. [Accessed 18/04/2014].
Litman, T., 2014. Well Measured: Developing Indicators for Sustainable and Livable Transport Planning. Victoria Transport Policy Institute, pp. 1-99. Available at: http://www.vtpi.org/wellmeas.pdf [Accessed 4/05/2014].
Luthra, A., 2006. Para Transit System in Medium Sized Cities: Problem or Panacea. ITPI JOURNAL, 3 (2), pp. 55-61. Available at: http://www.itpi.org.in/pdfs/07_07.pdf [Accessed 23/04/2014].
Maxwell, J. A. ed., 2012. Qualitative Research Design: An Interactive Approach: An Interactive Approach. 3rd. London, United Kingdom: Sage.
Mazzulla, G. and Eboli, L. 2006. A Service Quality experimental measure for public transport. European Transport \ Trasporti Europei, 34 pp. 42-53. Available at: http://www.openstarts.units.it/dspace/bitstream/10077/5928/1/Mazzulla_Eboli_ET34.pdf [Accessed 02/05/2014].
Mazzulla, G. and Eboli, L. 2007. Service Quality Attributes Affecting Customer Satisfaction for Bus Transit. Journal of Public Transportation, 10 (3), pp. 21-34. Available at: http://131.247.19.1/jpt/pdf/JPT%2010-3%20Eboli.pdf [Accessed 02/05/2014].
McGoey, K. E., Cowan, R. J., Rumrill, P. P. and LaVogue, C. 2010. Understanding the psychometric properties of reliability and validity in assessment. Work: A Journal of Prevention, Assessment and Rehabilitation, 36 (1), pp. 105-111.
Meakin, R., 2004. Sustainable Sourcebook for Policy-makers in Developing Cities. Module 3c: Bus Regulation and Planning. GTZ, Division 44: Environment and Infrastructure, Sector Project "Transport Policy Advice", pp. 1-44. Available at: www.sutp.org/component/phocadownload/category/39-3c?download=56:3c-brp-en
Ministry of Transport, Ghana. 2011. 3rd DRAFT Sector Medium-Term Development Plan (SMTDP): 2012 - 2014 submitted to the National Development Planning Commission. http://www.ndpc.gov.gh/GPRS/Sector%20Plans%202012/Min%20of%20Transport%20-%20SMTDP.docx. [ Accessed 16/05/2014].
Munzilah, M. R., Wijeyeseker, D. C. and Karim, A. T. A. 2013. Bus Operation, Quality Service and the Role of Bus Provider and Driver. Procedia Engineering, 53 pp. 167-178. Available at: www.sciencedirect.com/science/article/pii/S1877705813001410 [Accessed 01/05/2014].
Nkurunziza, A., Zuidgeest, M., Brussel, M. and Van Maarseveen, M. 2012. Modeling commuter preferences for the proposed bus rapid transit in Dar-es-Salaam. Journal of Public Transportation, 15 (2), pp. 95-116. Available at: http://www.nctr.usf.edu/wp-content/uploads/2012/07/JPT15.2Nkurunziza.pdf [Accessed 19/05/2014].
Okoye, V., Sands, J., and Debrah, C. A., 2010. The Accra Pilot Bus-Rapid Transit Project: Transport-Land Use Research Study. Millennium Cities Initiative and Accra Metropolitan Assembly. Available at: http://victoriaokoye.files.wordpress.com/2010/02/mci_urbantransport_finaldraft.pdf [Accessed 12/04/2014].
Olsson, A. L., 2003. Factors that influence choice of travel mode in major urban areas. The attractiveness of Park & Ride. Stockholm: Royal Institute of Technology.
Ort´uzar, J. D. and Willumsen, L. G. eds., 2011. MODELLING TRANSPORT. 4th. West Sussex, United Kingdom: Wiley and Sons, Ltd.
Páez, A., Scott, D. M. and Morency, C. 2012. Measuring accessibility: positive and normative implementations of various accessibility indicators. Journal of Transport Geography, 25 pp. 141-153. Available at: http://www.sciencedirect.com/science/article/pii/S0966692312000798 [Accessed 20/04/2014].

Level of Service Delivery of Public Transport and Mode Choice in Accra, Ghana 53
Phanikumar, C. and Maitra, B. 2006. Valuing urban bus attributes: an experience in Kolkata. Journal of Public Transportation, 9 (2), pp. 69-87. Available at: http://131.247.19.1/jpt/pdf/JPT%209-2%20Maitra.pdf [Accessed 08/05/2014].
Pinsonneault, A. and Kraemer, K. L. 1993. Survey research methodology in management information systems: an assessment. Journal of Management Information Systems, pp. 75-105. Available at: http://www.crito.uci.edu/research-archives/pdf/urb-022.pdf [Accessed 19/5/2014].
Quentin, K. and Hong, K. 2005. Effect of attribute perceptions on mode choice behavior in a transit market. Journal of the Eastern Asia Society for Transportation Studies, 6 pp. 1740-1750. Available at: http://www.easts.info/on-line/journal_06/1740.pdf .
Racca, D. P. and Ratledge, E. C., 2004. Project Report for" Factors That Affect and/or Can Alter Mode Choice". Center for Applied Demography & Survey Research. Available at: http://128.175.63.72/projects/DOCUMENTS/transitmodel.pdf [Accessed 8/5/2014].
Redman, L., Friman, M., Gärling, T. and Hartig, T. 2013. Quality attributes of public transport that attract car users: A research review. Transport Policy, 25 pp. 119-127. Available at: http://www.sciencedirect.com/science/article/pii/S0967070X12001692 [Accessed 12/05/2014].
Rodrigue, J., 2013. The Geography of Transport Systems. Routledge, (3rd Edition), pp. 1-416. Available at: https://people.hofstra.edu/geotrans/eng/ch6en/conc6en/ch6c3en.html [Accessed 25/03/2014].
Salifu, M., ed., 2004. Transport deregulation and sustainability of the urban bus transit initiative in Ghana, [CODATU XI: world congress: Towards more attractive urban transportation].
State of Florida Department of Transportation (Fdot), 2013 Quality/Level of Service Handbook. 2013. Available at: http://www.dot.state.fl.us/planning/systems/programs/SM/los/pdfs/2013%20QLOS%20Handbook.pdf .
Straits, B. C. and Singleton, R. A. J. eds., 2011. Social Research. Approaches and Fundamentals. 5th. Oxford, New York: Oxford University Press.
Takyi, H., Poku, K. and Anin, K. E. 2013. An Assessment of Traffic Congestion and Its Effect on Productivity in Urban Ghana. International Journal of Business and Social Science, 4 (3), pp. 225-234. Available at: http://www.ijbssnet.com/journals/Vol_4_No_3_March_2013/25.pdf [Accessed 24/04/2014].
Transport Research Board, Highway Capacity Manual. 2000. Available at: http://sjnavarro.files.wordpress.com/2008/08/highway_capacital_manual.pdf .
Tyrinopoulos, Y. and Antoniou, C. 2013. Factors affecting modal choice in urban mobility. European Transport Research Review, 5 (1), pp. 27-39. Available at: http://download.springer.com/static/pdf/381/art%253A10.1007%252Fs12544-012-0088-3.pdf?auth66=1409909391_4215cc3dede71e7e3ca9e0d6527b3afb&ext=.pdf [Accessed 08/5/2014].
Wright, L. and Fjellstrom, K. 2005. Sustainable Transport: A Sourcebook for Policy-makers in Developing Cities. Module 3a: Mass Transit Options. GTZ, Division 44: WAter, Energy, Transport, pp. 1-30. Available at: www2.gtz.de/dokumente/bib/05-0515.pdf [ Accessed 23/04/2014 .[

Level of Service Delivery of Public Transport and Mode Choice in Accra, Ghana 54
Appendix 1: Frequently used Modes of Transport
Modes usually used for Travel by Non-users Responses Percent of
Cases N Percent
Taxi 60 37.3% 100.0%
Mini-bus 56 34.8% 93.3%
Private Car 44 27.3% 73.3%
Motorcycle 1 0.6% 1.7%
Total 161 100.0% 268.3%
a. Dichotomy group tabulated at value (yes). Modes usually used for Travel by Occasional users
Responses Percent of Cases
N Percent
Taxi 37 24.8% 92.5%
Mini-bus 40 26.8% 100.0%
Private Car 31 20.8% 77.5%
Motorcycle 1 0.7% 2.5%
MMT 40 26.8% 100.0% Total 149 100.0% 372.5%
a. Dichotomy group tabulated at value 1(yes).
Modes usually used for Travel by Frequent users Modes of travel
Responses Percent of Cases
N Percent
Taxi 15 16.9% 44.1%
Mini-bus 32 36.0% 94.1%
Private Car 4 4.5% 11.8%
Motorcycle 4 4.5% 11.8%
MMT 34 38.2% 100.0% Total 89 100.0% 261.8%
a. Dichotomy group tabulated at value 1 (yes).

Level of Service Delivery of Public Transport and Mode Choice in Accra, Ghana 55
Appendix 2: Perception of LOS by User group
Perception of Level of service rating by Non-users
Valid Percent
LOS Factors
Service Attributes Mean Score
Excellent Very good
Good Fair Poor
Reliability - Adherence to time schedule 1.55 1.7 1.7 10.0 23.3 63.3
Frequency - Days and hours of MMT operation 2.43 0.0 1.7 41.7 55.0 1.7
Accessibility
- Availability at trip origin and destination
2.43 0.0 0.0 45.0 53.3 1.7
- Distance to transit station 2.28 0.0 0.0 31.7 65.0 3.3
Travelling time - Time spent in bus 1.08 1.7 0.0 0.0 1.7 96.7
- Walking time/distance to destination 2.45 0.0 6.7 35.0 55.0 3.3
Waiting time at station 2.32 0.0 1.7 31.7 63.3 3.3
Price - Cost of fare 4.0 16.7 66.7 16.7 0.0 0.0
Ease of Transfer - Ease of continuing trip with a different mode
2.75 0.0 3.3 70.0 25.0 1.7
Vehicle Conditions
- Physical condition/appearance of vehicle
2.82 0.0 3.3 78.3 15.0 3.3
- Mechanical condition (breakdowns) of vehicles
2.8 0.0 6.7 68.3 23.3 1.7
Comfort
Access to seat on bus 1.42 0.0 0.0 8.3 25.0 66.7
Crowding on bus 1.23 0.0 0.0 1.7 20.0 78.3
Driver handling 3.0 3.3 21.7 48.3 25.0 1.7
Noise level on the bus 2.33 0.0 1.7 35.0 58.3 5.0
Safety Safety from traffic accidents 2.98 1.7 11.7 70.0 16.7 0.0
Security of goods/luggage 3.02 3.3 8.3 76.7 10.0 1.7
Aesthetics Cleanliness of vehicle 2.72 3.3 0.0 66.7 25.0 5.0
Cleanliness of waiting area 2.2 0.0 0.0 33.3 53.3 13.3
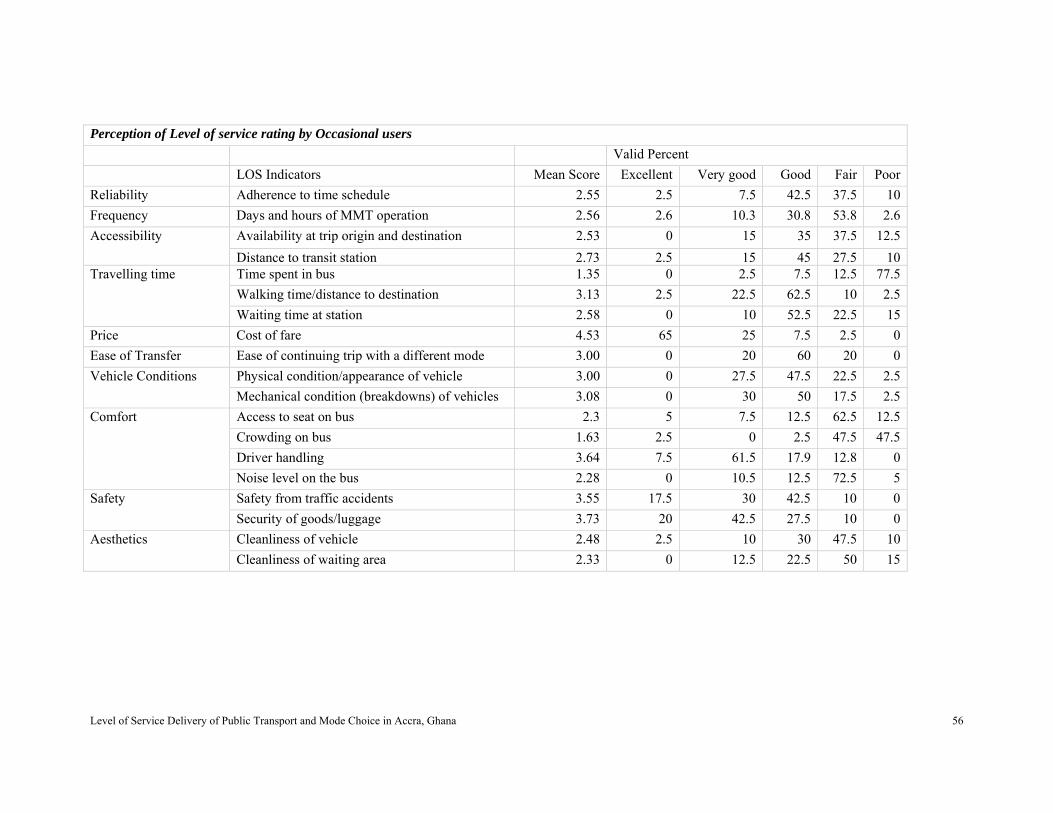
Level of Service Delivery of Public Transport and Mode Choice in Accra, Ghana 56
Perception of Level of service rating by Occasional users
Valid Percent
LOS Indicators Mean Score Excellent Very good Good Fair Poor
Reliability Adherence to time schedule 2.55 2.5 7.5 42.5 37.5 10
Frequency Days and hours of MMT operation 2.56 2.6 10.3 30.8 53.8 2.6
Accessibility Availability at trip origin and destination 2.53 0 15 35 37.5 12.5
Distance to transit station 2.73 2.5 15 45 27.5 10Travelling time Time spent in bus 1.35 0 2.5 7.5 12.5 77.5
Walking time/distance to destination 3.13 2.5 22.5 62.5 10 2.5
Waiting time at station 2.58 0 10 52.5 22.5 15
Price Cost of fare 4.53 65 25 7.5 2.5 0
Ease of Transfer Ease of continuing trip with a different mode 3.00 0 20 60 20 0
Vehicle Conditions Physical condition/appearance of vehicle 3.00 0 27.5 47.5 22.5 2.5
Mechanical condition (breakdowns) of vehicles 3.08 0 30 50 17.5 2.5
Comfort Access to seat on bus 2.3 5 7.5 12.5 62.5 12.5
Crowding on bus 1.63 2.5 0 2.5 47.5 47.5
Driver handling 3.64 7.5 61.5 17.9 12.8 0
Noise level on the bus 2.28 0 10.5 12.5 72.5 5
Safety Safety from traffic accidents 3.55 17.5 30 42.5 10 0
Security of goods/luggage 3.73 20 42.5 27.5 10 0
Aesthetics Cleanliness of vehicle 2.48 2.5 10 30 47.5 10
Cleanliness of waiting area 2.33 0 12.5 22.5 50 15

Level of Service Delivery of Public Transport and Mode Choice in Accra, Ghana 57
Perception of Level of service rating by Frequent users LOS Indicators Mean Scores Excellent Very
good Good Fair Poor
Reliability Adherence to time schedule 2.41 5.9 17.6 23.5 17.6 35.3
Frequency Days and hours of MMT operation 3.76 23.5 35.3 35.3 5.9 0
Availability at trip origin and destination 2.73 5.9 20.6 32.4 17.6 20.6
Accessibility Distance to transit station 2.71 0 17.6 52.9 11.8 17.6
Travelling time Time spent in bus 2.53 5.9 2.9 41.2 38.2 11.8
Walking time/distance to destination 2.68 2.9 14.7 50 11.8 20.6
Waiting time at station 1.65 2.9 0 11.8 29.4 55.9
Price Cost of fare 4.56 70.6 14.7 14.7 0 0
Ease of Transfer Ease of continuing trip with a different mode 3.85 26.5 38.2 32.4 0 2.9
Vehicle Conditions Physical condition/appearance of vehicle 3.62 14.7 35.3 47.1 2.9 0
Mechanical condition (breakdowns) of vehicles
3.62 11.8 47.1 35.3 2.9 2.9
Comfort Access to seat on bus 3.62 32.4 20.6 32.4 5.9 8.8
Crowding on bus 1.88 2.9 11.8 11.8 17.6 55.9
Driver handling 3.79 11.8 61.8 23.5 0 2.9
Noise level on the bus 1.65 0 2.9 11.8 32.4 52.9
Safety Safety from traffic accidents 3.88 20.6 50 26.5 2.9 0
Security of goods/luggage 3.59 14.7 47.1 26.5 5.9 5.9
Aesthetics Cleanliness of vehicle 2.65 2.9 23.5 32.4 17.6 23.5
Cleanliness of waiting area 2.15 0 17.6 17.6 23.5 38.2
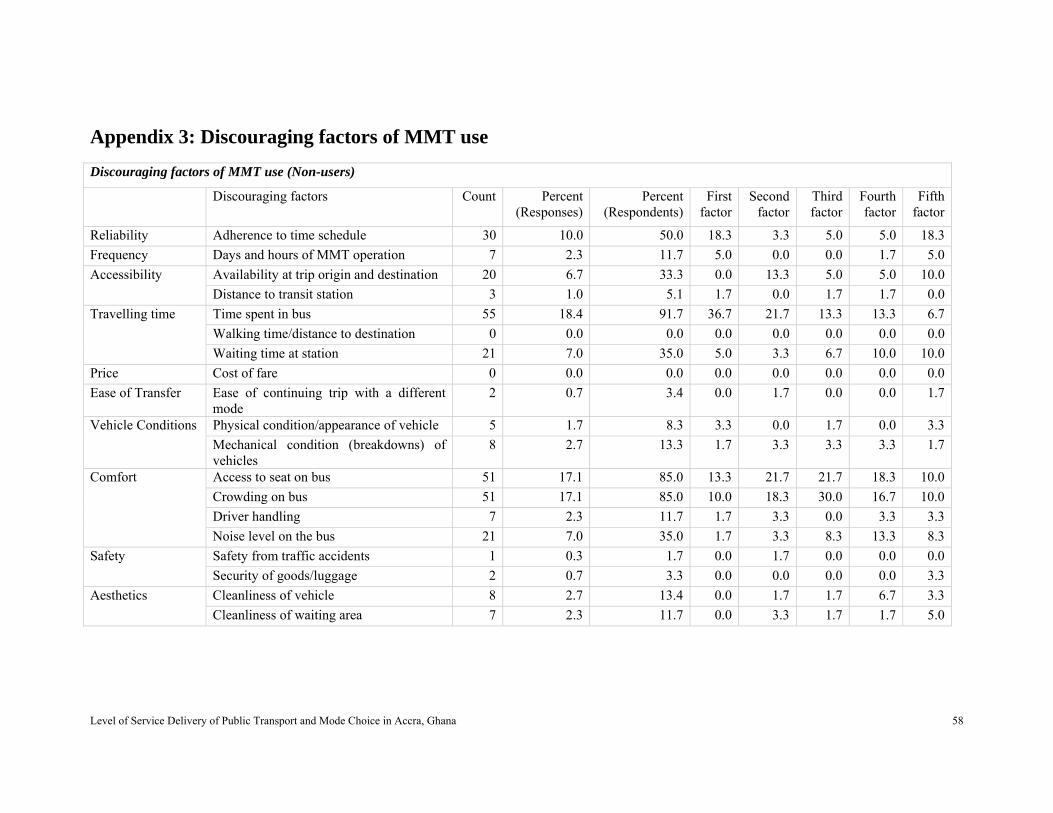
Level of Service Delivery of Public Transport and Mode Choice in Accra, Ghana 58
Appendix 3: Discouraging factors of MMT use
Discouraging factors of MMT use (Non-users)
Discouraging factors Count Percent (Responses)
Percent (Respondents)
First factor
Second factor
Third factor
Fourth factor
Fifth factor
Reliability Adherence to time schedule 30 10.0 50.0 18.3 3.3 5.0 5.0 18.3
Frequency Days and hours of MMT operation 7 2.3 11.7 5.0 0.0 0.0 1.7 5.0
Accessibility Availability at trip origin and destination 20 6.7 33.3 0.0 13.3 5.0 5.0 10.0
Distance to transit station 3 1.0 5.1 1.7 0.0 1.7 1.7 0.0
Travelling time Time spent in bus 55 18.4 91.7 36.7 21.7 13.3 13.3 6.7
Walking time/distance to destination 0 0.0 0.0 0.0 0.0 0.0 0.0 0.0
Waiting time at station 21 7.0 35.0 5.0 3.3 6.7 10.0 10.0
Price Cost of fare 0 0.0 0.0 0.0 0.0 0.0 0.0 0.0
Ease of Transfer Ease of continuing trip with a different mode
2 0.7 3.4 0.0 1.7 0.0 0.0 1.7
Vehicle Conditions Physical condition/appearance of vehicle 5 1.7 8.3 3.3 0.0 1.7 0.0 3.3
Mechanical condition (breakdowns) of vehicles
8 2.7 13.3 1.7 3.3 3.3 3.3 1.7
Comfort Access to seat on bus 51 17.1 85.0 13.3 21.7 21.7 18.3 10.0
Crowding on bus 51 17.1 85.0 10.0 18.3 30.0 16.7 10.0
Driver handling 7 2.3 11.7 1.7 3.3 0.0 3.3 3.3
Noise level on the bus 21 7.0 35.0 1.7 3.3 8.3 13.3 8.3
Safety Safety from traffic accidents 1 0.3 1.7 0.0 1.7 0.0 0.0 0.0
Security of goods/luggage 2 0.7 3.3 0.0 0.0 0.0 0.0 3.3
Aesthetics Cleanliness of vehicle 8 2.7 13.4 0.0 1.7 1.7 6.7 3.3
Cleanliness of waiting area 7 2.3 11.7 0.0 3.3 1.7 1.7 5.0
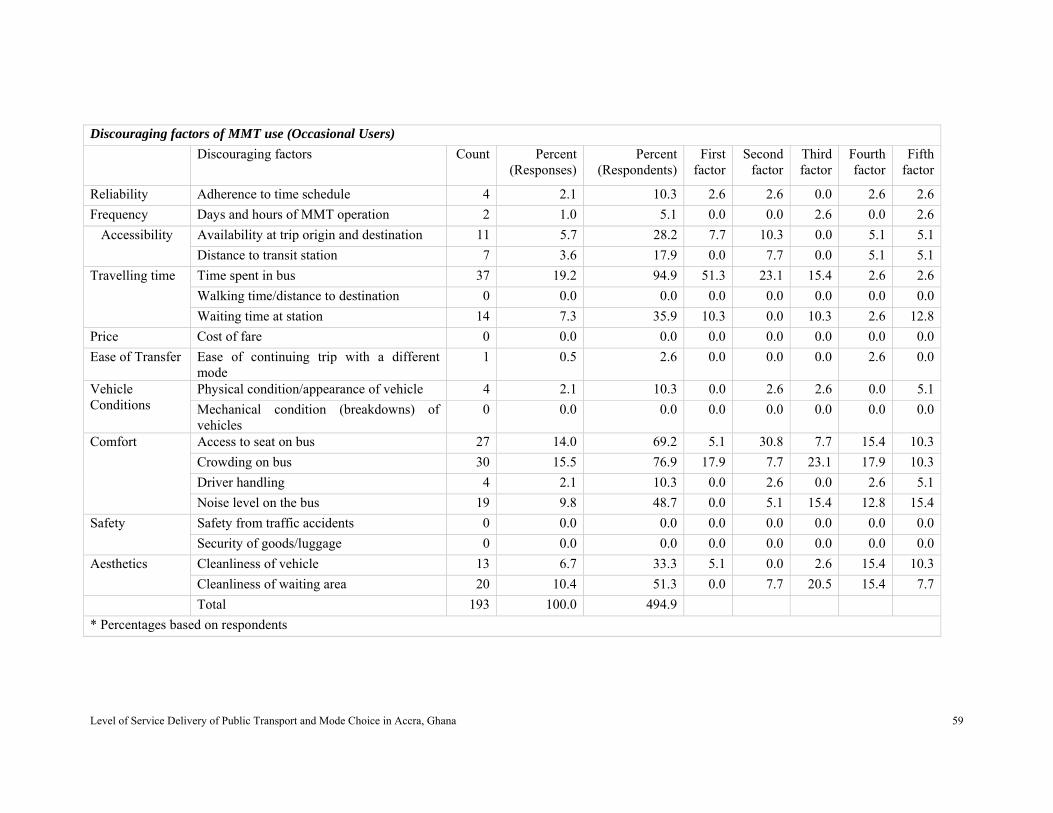
Level of Service Delivery of Public Transport and Mode Choice in Accra, Ghana 59
Discouraging factors of MMT use (Occasional Users)
Discouraging factors Count Percent (Responses)
Percent (Respondents)
First factor
Second factor
Third factor
Fourth factor
Fifth factor
Reliability Adherence to time schedule 4 2.1 10.3 2.6 2.6 0.0 2.6 2.6
Frequency Days and hours of MMT operation 2 1.0 5.1 0.0 0.0 2.6 0.0 2.6
Accessibility Availability at trip origin and destination 11 5.7 28.2 7.7 10.3 0.0 5.1 5.1
Distance to transit station 7 3.6 17.9 0.0 7.7 0.0 5.1 5.1
Travelling time Time spent in bus 37 19.2 94.9 51.3 23.1 15.4 2.6 2.6
Walking time/distance to destination 0 0.0 0.0 0.0 0.0 0.0 0.0 0.0
Waiting time at station 14 7.3 35.9 10.3 0.0 10.3 2.6 12.8
Price Cost of fare 0 0.0 0.0 0.0 0.0 0.0 0.0 0.0
Ease of Transfer Ease of continuing trip with a different mode
1 0.5 2.6 0.0 0.0 0.0 2.6 0.0
Vehicle Conditions
Physical condition/appearance of vehicle 4 2.1 10.3 0.0 2.6 2.6 0.0 5.1
Mechanical condition (breakdowns) of vehicles
0 0.0 0.0 0.0 0.0 0.0 0.0 0.0
Comfort Access to seat on bus 27 14.0 69.2 5.1 30.8 7.7 15.4 10.3
Crowding on bus 30 15.5 76.9 17.9 7.7 23.1 17.9 10.3
Driver handling 4 2.1 10.3 0.0 2.6 0.0 2.6 5.1
Noise level on the bus 19 9.8 48.7 0.0 5.1 15.4 12.8 15.4
Safety Safety from traffic accidents 0 0.0 0.0 0.0 0.0 0.0 0.0 0.0
Security of goods/luggage 0 0.0 0.0 0.0 0.0 0.0 0.0 0.0
Aesthetics Cleanliness of vehicle 13 6.7 33.3 5.1 0.0 2.6 15.4 10.3
Cleanliness of waiting area 20 10.4 51.3 0.0 7.7 20.5 15.4 7.7
Total 193 100.0 494.9
* Percentages based on respondents
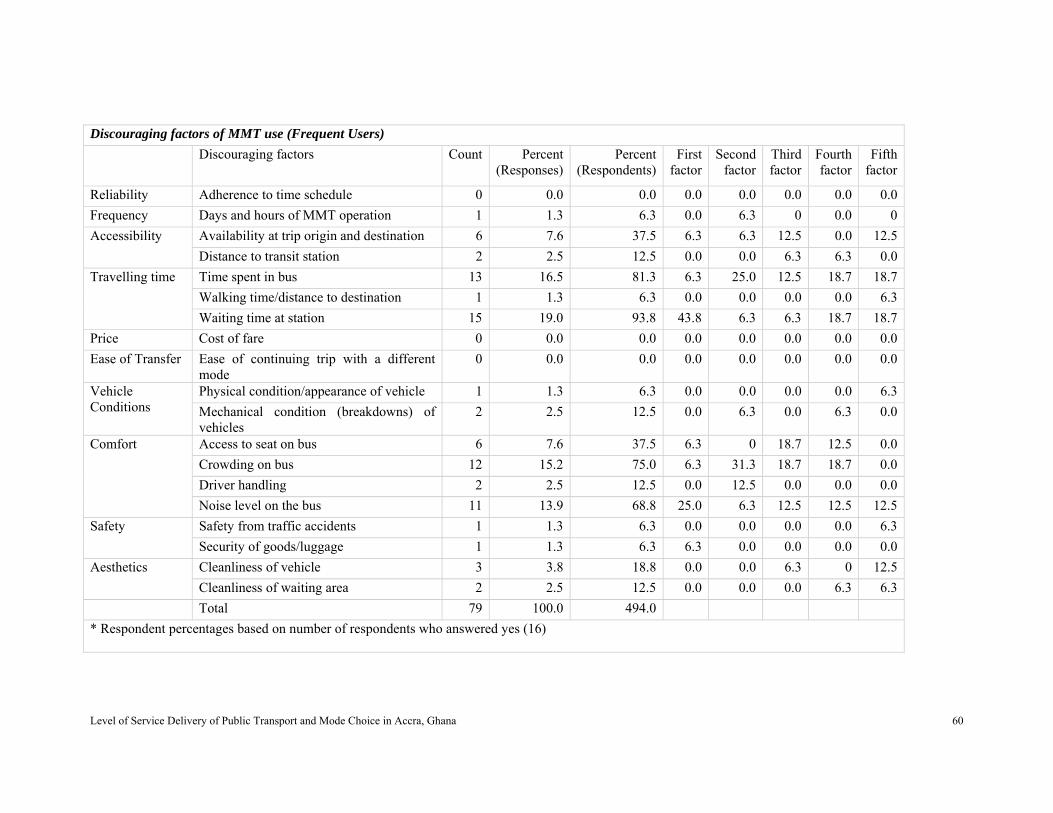
Level of Service Delivery of Public Transport and Mode Choice in Accra, Ghana 60
Discouraging factors of MMT use (Frequent Users)
Discouraging factors Count Percent (Responses)
Percent (Respondents)
First factor
Second factor
Third factor
Fourth factor
Fifth factor
Reliability Adherence to time schedule 0 0.0 0.0 0.0 0.0 0.0 0.0 0.0
Frequency Days and hours of MMT operation 1 1.3 6.3 0.0 6.3 0 0.0 0
Accessibility Availability at trip origin and destination 6 7.6 37.5 6.3 6.3 12.5 0.0 12.5
Distance to transit station 2 2.5 12.5 0.0 0.0 6.3 6.3 0.0
Travelling time Time spent in bus 13 16.5 81.3 6.3 25.0 12.5 18.7 18.7
Walking time/distance to destination 1 1.3 6.3 0.0 0.0 0.0 0.0 6.3
Waiting time at station 15 19.0 93.8 43.8 6.3 6.3 18.7 18.7
Price Cost of fare 0 0.0 0.0 0.0 0.0 0.0 0.0 0.0
Ease of Transfer Ease of continuing trip with a different mode
0 0.0 0.0 0.0 0.0 0.0 0.0 0.0
Vehicle Conditions
Physical condition/appearance of vehicle 1 1.3 6.3 0.0 0.0 0.0 0.0 6.3
Mechanical condition (breakdowns) of vehicles
2 2.5 12.5 0.0 6.3 0.0 6.3 0.0
Comfort Access to seat on bus 6 7.6 37.5 6.3 0 18.7 12.5 0.0
Crowding on bus 12 15.2 75.0 6.3 31.3 18.7 18.7 0.0
Driver handling 2 2.5 12.5 0.0 12.5 0.0 0.0 0.0
Noise level on the bus 11 13.9 68.8 25.0 6.3 12.5 12.5 12.5
Safety Safety from traffic accidents 1 1.3 6.3 0.0 0.0 0.0 0.0 6.3
Security of goods/luggage 1 1.3 6.3 6.3 0.0 0.0 0.0 0.0
Aesthetics Cleanliness of vehicle 3 3.8 18.8 0.0 0.0 6.3 0 12.5
Cleanliness of waiting area 2 2.5 12.5 0.0 0.0 0.0 6.3 6.3
Total 79 100.0 494.0
* Respondent percentages based on number of respondents who answered yes (16)

Level of Service Delivery of Public Transport and Mode Choice in Accra, Ghana 61
Appendix 4: Post Hoc Tests (Respondent Category) Multiple Comparisons
Tukey HSD Dependent Variable (I) Group category of
Respondent (J) Group category of Respondent
Mean Difference (I-J)
Std. Error
Sig. 95% Confidence Interval Lower Bound Upper Bound
Adherence to time schedule
Frequent user Occasional user -.13824 .23325 .824 -.6912 .4147Non-user .86176* .21465 .000 .3529 1.3706
Occasional user Frequent user .13824 .23325 .824 -.4147 .6912 Non-user 1.00000* .20411 .000 .5161 1.4839
Non-user Frequent user -.86176* .21465 .000 -1.3706 -.3529 Occasional user -1.00000* .20411 .000 -1.4839 -.5161
Days and hours of operation
Frequent user Occasional user 1.18971* .17127 .000 .7837 1.5957 Non-user 1.33137* .15761 .000 .9577 1.7050
Occasional user Frequent user -1.18971* .17127 .000 -1.5957 -.7837 Non-user .14167 .14988 .613 -.2136 .4970
Non-user Frequent user -1.33137* .15761 .000 -1.7050 -.9577 Occasional user -.14167 .14988 .613 -.4970 .2136
Availability at trip origin and destination
Frequent user Occasional user .20227 .20130 .575 -.2750 .6795 Non-user .29394 .18551 .256 -.1459 .7338
Occasional user Frequent user -.20227 .20130 .575 -.6795 .2750 Non-user .09167 .17473 .859 -.3226 .5059
Non-user Frequent user -.29394 .18551 .256 -.7338 .1459 Occasional user -.09167 .17473 .859 -.5059 .3226
Distance to transit station Frequent user Occasional user -.01912 .18367 .994 -.4545 .4163 Non-user .42255* .16902 .036 .0219 .8232
Occasional user Frequent user .01912 .18367 .994 -.4163 .4545 Non-user .44167* .16072 .019 .0606 .8227
Non-user Frequent user -.42255* .16902 .036 -.8232 -.0219 Occasional user -.44167* .16072 .019 -.8227 -.0606
Time spent in bus Frequent user Occasional user 1.17941* .16825 .000 .7805 1.5783 Non-user 1.44608* .15483 .000 1.0790 1.8131
Occasional user Frequent user -1.17941* .16825 .000 -1.5783 -.7805 Non-user .26667 .14723 .170 -.0824 .6157
Non-user Frequent user -1.44608* .15483 .000 -1.8131 -1.0790 Occasional user -.26667 .14723 .170 -.6157 .0824
Walking time/distance to destination
Frequent user Occasional user -.44853* .18753 .047 -.8931 -.0040Non-user .22647 .17257 .391 -.1826 .6356
Occasional user Frequent user .44853* .18753 .047 .0040 .8931 Non-user .67500* .16410 .000 .2860 1.0640
Non-user Frequent user -.22647 .17257 .391 -.6356 .1826

Level of Service Delivery of Public Transport and Mode Choice in Accra, Ghana 62
Occasional user -.67500* .16410 .000 -1.0640 -.2860 Waiting time at station Frequent user Occasional user -.92794* .17828 .000 -1.3506 -.5053
Non-user -.66961* .16406 .000 -1.0585 -.2807 Occasional user Frequent user .92794* .17828 .000 .5053 1.3506
Non-user .25833 .15601 .226 -.1115 .6282 Non-user Frequent user .66961* .16406 .000 .2807 1.0585
Occasional user -.25833 .15601 .226 -.6282 .1115 Cost of fare Frequent user Occasional user .03382 .15833 .975 -.3415 .4092
Non-user .55882* .14571 .001 .2134 .9042 Occasional user Frequent user -.03382 .15833 .975 -.4092 .3415
Non-user .52500* .13856 .001 .1965 .8535 Non-user Frequent user -.55882* .14571 .001 -.9042 -.2134
Occasional user -.52500* .13856 .001 -.8535 -.1965 Ease of continuing trip with a different mode
Frequent user Occasional user .85294* .15985 .000 .4740 1.2319 Non-user 1.10294* .14710 .000 .7542 1.4517
Occasional user Frequent user -.85294* .15985 .000 -1.2319 -.4740 Non-user .25000 .13988 .178 -.0816 .5816
Non-user Frequent user -1.10294* .14710 .000 -1.4517 -.7542 Occasional user -.25000 .13988 .178 -.5816 .0816
Physical condition/appearance of vehicle
Frequent user Occasional user .61765* .15919 .000 .2403 .9950 Non-user .80098* .14650 .000 .4537 1.1483
Occasional user Frequent user -.61765* .15919 .000 -.9950 -.2403 Non-user .18333 .13931 .389 -.1469 .5136
Non-user Frequent user -.80098* .14650 .000 -1.1483 -.4537 Occasional user -.18333 .13931 .389 -.5136 .1469
Mechanical condition (breakdowns) of vehicles
Frequent user Occasional user .54265* .16608 .004 .1489 .9364 Non-user .81765* .15283 .000 .4553 1.1800
Occasional user Frequent user -.54265* .16608 .004 -.9364 -.1489 Non-user .27500 .14533 .145 -.0695 .6195
Non-user Frequent user -.81765* .15283 .000 -1.1800 -.4553 Occasional user -.27500 .14533 .145 -.6195 .0695
Access to seat on bus Frequent user Occasional user 1.31765* .21666 .000 .8040 1.8313 Non-user 2.20098* .19938 .000 1.7283 2.6736
Occasional user Frequent user -1.31765* .21666 .000 -1.8313 -.8040 Non-user .88333* .18959 .000 .4339 1.3328
Non-user Frequent user -2.20098* .19938 .000 -2.6736 -1.7283 Occasional user -.88333* .18959 .000 -1.3328 -.4339
Crowding on bus Frequent user Occasional user .25735 .18639 .354 -.1845 .6992Non-user .64902* .17152 .001 .2424 1.0556
Occasional user Frequent user -.25735 .18639 .354 -.6992 .1845 Non-user .39167* .16310 .046 .0050 .7783
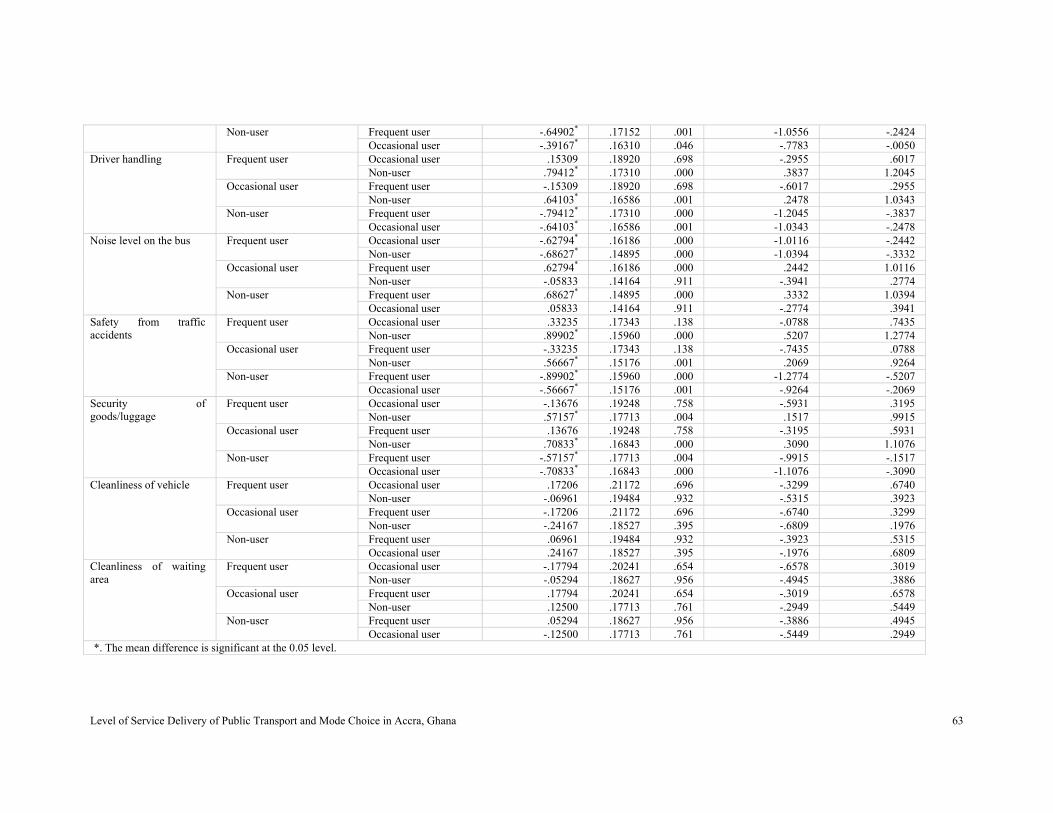
Level of Service Delivery of Public Transport and Mode Choice in Accra, Ghana 63
Non-user Frequent user -.64902* .17152 .001 -1.0556 -.2424 Occasional user -.39167* .16310 .046 -.7783 -.0050
Driver handling Frequent user Occasional user .15309 .18920 .698 -.2955 .6017 Non-user .79412* .17310 .000 .3837 1.2045
Occasional user Frequent user -.15309 .18920 .698 -.6017 .2955 Non-user .64103* .16586 .001 .2478 1.0343
Non-user Frequent user -.79412* .17310 .000 -1.2045 -.3837 Occasional user -.64103* .16586 .001 -1.0343 -.2478
Noise level on the bus Frequent user Occasional user -.62794* .16186 .000 -1.0116 -.2442 Non-user -.68627* .14895 .000 -1.0394 -.3332
Occasional user Frequent user .62794* .16186 .000 .2442 1.0116 Non-user -.05833 .14164 .911 -.3941 .2774
Non-user Frequent user .68627* .14895 .000 .3332 1.0394 Occasional user .05833 .14164 .911 -.2774 .3941
Safety from traffic accidents
Frequent user Occasional user .33235 .17343 .138 -.0788 .7435 Non-user .89902* .15960 .000 .5207 1.2774
Occasional user Frequent user -.33235 .17343 .138 -.7435 .0788 Non-user .56667* .15176 .001 .2069 .9264
Non-user Frequent user -.89902* .15960 .000 -1.2774 -.5207 Occasional user -.56667* .15176 .001 -.9264 -.2069
Security of goods/luggage
Frequent user Occasional user -.13676 .19248 .758 -.5931 .3195Non-user .57157* .17713 .004 .1517 .9915
Occasional user Frequent user .13676 .19248 .758 -.3195 .5931 Non-user .70833* .16843 .000 .3090 1.1076
Non-user Frequent user -.57157* .17713 .004 -.9915 -.1517 Occasional user -.70833* .16843 .000 -1.1076 -.3090
Cleanliness of vehicle Frequent user Occasional user .17206 .21172 .696 -.3299 .6740 Non-user -.06961 .19484 .932 -.5315 .3923
Occasional user Frequent user -.17206 .21172 .696 -.6740 .3299 Non-user -.24167 .18527 .395 -.6809 .1976
Non-user Frequent user .06961 .19484 .932 -.3923 .5315Occasional user .24167 .18527 .395 -.1976 .6809
Cleanliness of waiting area
Frequent user Occasional user -.17794 .20241 .654 -.6578 .3019 Non-user -.05294 .18627 .956 -.4945 .3886
Occasional user Frequent user .17794 .20241 .654 -.3019 .6578 Non-user .12500 .17713 .761 -.2949 .5449
Non-user Frequent user .05294 .18627 .956 -.3886 .4945 Occasional user -.12500 .17713 .761 -.5449 .2949
*. The mean difference is significant at the 0.05 level.

Level of Service Delivery of Public Transport and Mode Choice in Accra, Ghana 64
Appendix 5: Independent Samples Test (Gender) Independent Samples Test
Levene's Test for Equality of
Variances
t-test for Equality of Means
F Sig. t df Sig. (2-tailed)
Mean Difference
Std. Error Difference
95% Confidence Interval of the
Difference Lower Upper
Adherence to time schedule
Equal variances assumed .864 .354 -.392 132 .696 -.07463 .19034 -.45114 .30189 Equal variances not assumed -.392 130.643 .696 -.07463 .19034 -.45118 .30192
Days and hours of operation
Equal variances assumed 3.958 .049 -1.415 132 .159 -.22388 .15819 -.53680 .08904 Equal variances not assumed -1.415 131.054 .159 -.22388 .15819 -.53682 .08906
Availability at trip origin and destination
Equal variances assumed 4.246 .041 -2.656 132 .009 -.38806 .14610 -.67706 -.09906 Equal variances not assumed -2.656 121.903 .009 -.38806 .14610 -.67728 -.09884
Distance to transit station
Equal variances assumed .715 .399 .425 132 .672 .05970 .14052 -.21826 .33766 Equal variances not assumed .425 130.230 .672 .05970 .14052 -.21829 .33769
Time spent in bus Equal variances assumed 1.038 .310 .092 132 .927 .01493 .16153 -.30459 .33444 Equal variances not assumed .092 128.884 .927 .01493 .16153 -.30466 .33451
Walking time/distance to destination
Equal variances assumed .102 .750 .101 132 .919 .01493 .14707 -.27599 .30584 Equal variances not assumed .101 131.997 .919 .01493 .14707 -.27599 .30584
Waiting time at station Equal variances assumed .099 .753 .824 132 .411 .11940 .14487 -.16716 .40597 Equal variances not assumed .824 131.524 .411 .11940 .14487 -.16717 .40598
Cost of fare Equal variances assumed .284 .595 -1.192 132 .235 -.14925 .12520 -.39691 .09840 Equal variances not assumed -1.192 131.887 .235 -.14925 .12520 -.39691 .09840
Ease of continuing trip with a different mode
Equal variances assumed 1.541 .217 -.846 132 .399 -.11940 .14112 -.39855 .15974 Equal variances not assumed -.846 131.908 .399 -.11940 .14112 -.39855 .15974
Physical condition/appearance of vehicle
Equal variances assumed 1.531 .218 .688 132 .493 .08955 .13022 -.16804 .34714 Equal variances not assumed .688 128.208 .493 .08955 .13022 -.16811 .34721
Mechanical condition (breakdowns) of vehicles
Equal variances assumed .028 .867 .221 132 .826 .02985 .13525 -.23770 .29740 Equal variances not assumed .221 131.997 .826 .02985 .13525 -.23770 .29740
Access to seat on bus Equal variances assumed 2.969 .087 -.943 132 .347 -.20896 .22147 -.64705 .22914Equal variances not assumed -.943 130.738 .347 -.20896 .22147 -.64708 .22917
Crowding on bus Equal variances assumed 4.444 .037 -.927 132 .356 -.13433 .14492 -.42099 .15233 Equal variances not assumed -.927 121.193 .356 -.13433 .14492 -.42122 .15257

Level of Service Delivery of Public Transport and Mode Choice in Accra, Ghana 65
Driver handling Equal variances assumed 2.400 .124 .553 131 .581 .08435 .15261 -.21754 .38624 Equal variances not assumed .554 127.337 .581 .08435 .15239 -.21720 .38590
Noise level on the bus Equal variances assumed 1.978 .162 -.576 132 .565 -.07463 .12947 -.33072 .18147 Equal variances not assumed -.576 129.830 .565 -.07463 .12947 -.33076 .18151
Safety from traffic accidents
Equal variances assumed .022 .882 -1.570 132 .119 -.22388 .14259 -.50594 .05818 Equal variances not assumed -1.570 131.682 .119 -.22388 .14259 -.50595 .05819
Security of goods/luggage
Equal variances assumed .065 .799 -.587 132 .559 -.08955 .15267 -.39156 .21245 Equal variances not assumed -.587 131.481 .559 -.08955 .15267 -.39157 .21246
Cleanliness of vehicle Equal variances assumed .000 .992 .952 132 .343 .14925 .15671 -.16074 .45924 Equal variances not assumed .952 131.380 .343 .14925 .15671 -.16075 .45926
Cleanliness of waiting area
Equal variances assumed 1.900 .170 -.598 132 .551 -.08955 .14964 -.38555 .20645 Equal variances not assumed -.598 130.299 .551 -.08955 .14964 -.38559 .20648
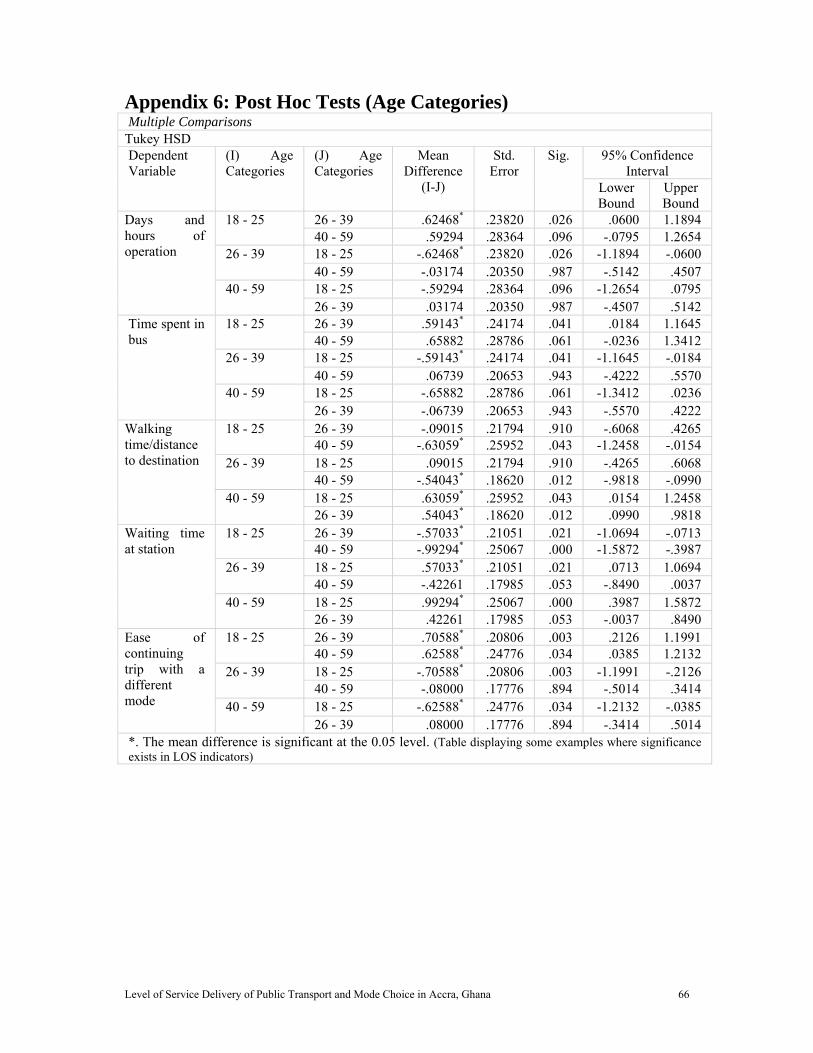
Level of Service Delivery of Public Transport and Mode Choice in Accra, Ghana 66
Appendix 6: Post Hoc Tests (Age Categories) Multiple Comparisons
Tukey HSD Dependent Variable
(I) Age Categories
(J) Age Categories
Mean Difference
(I-J)
Std. Error
Sig. 95% Confidence Interval
Lower Bound
Upper Bound
Days and hours of operation
18 - 25 26 - 39 .62468* .23820 .026 .0600 1.1894 40 - 59 .59294 .28364 .096 -.0795 1.2654
26 - 39 18 - 25 -.62468* .23820 .026 -1.1894 -.0600 40 - 59 -.03174 .20350 .987 -.5142 .4507
40 - 59 18 - 25 -.59294 .28364 .096 -1.2654 .0795 26 - 39 .03174 .20350 .987 -.4507 .5142
Time spent in bus
18 - 25 26 - 39 .59143* .24174 .041 .0184 1.1645 40 - 59 .65882 .28786 .061 -.0236 1.3412
26 - 39 18 - 25 -.59143* .24174 .041 -1.1645 -.0184 40 - 59 .06739 .20653 .943 -.4222 .5570
40 - 59 18 - 25 -.65882 .28786 .061 -1.3412 .0236 26 - 39 -.06739 .20653 .943 -.5570 .4222
Walking time/distance to destination
18 - 25 26 - 39 -.09015 .21794 .910 -.6068 .4265 40 - 59 -.63059* .25952 .043 -1.2458 -.0154
26 - 39 18 - 25 .09015 .21794 .910 -.4265 .6068 40 - 59 -.54043* .18620 .012 -.9818 -.0990
40 - 59 18 - 25 .63059* .25952 .043 .0154 1.2458 26 - 39 .54043* .18620 .012 .0990 .9818
Waiting time at station
18 - 25 26 - 39 -.57033* .21051 .021 -1.0694 -.0713 40 - 59 -.99294* .25067 .000 -1.5872 -.3987
26 - 39 18 - 25 .57033* .21051 .021 .0713 1.0694 40 - 59 -.42261 .17985 .053 -.8490 .0037
40 - 59 18 - 25 .99294* .25067 .000 .3987 1.5872 26 - 39 .42261 .17985 .053 -.0037 .8490
Ease of continuing trip with a different mode
18 - 25 26 - 39 .70588* .20806 .003 .2126 1.1991 40 - 59 .62588* .24776 .034 .0385 1.2132
26 - 39 18 - 25 -.70588* .20806 .003 -1.1991 -.2126 40 - 59 -.08000 .17776 .894 -.5014 .3414
40 - 59 18 - 25 -.62588* .24776 .034 -1.2132 -.0385 26 - 39 .08000 .17776 .894 -.3414 .5014
*. The mean difference is significant at the 0.05 level. (Table displaying some examples where significance exists in LOS indicators)
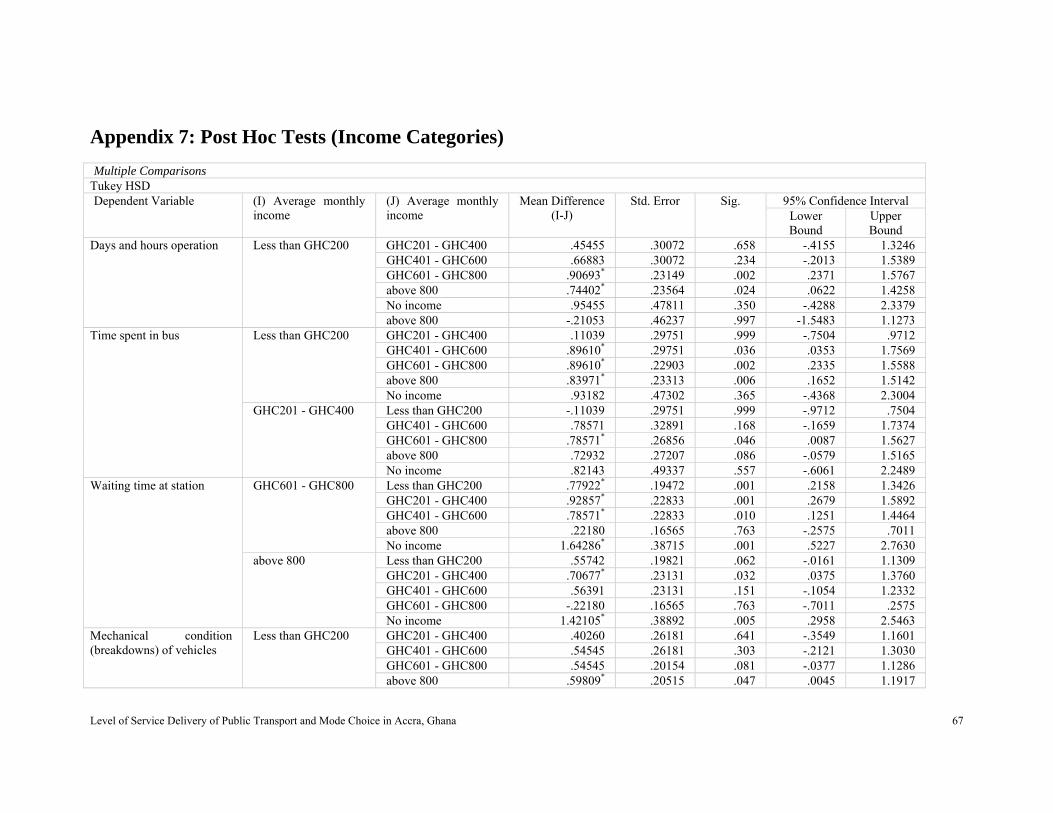
Level of Service Delivery of Public Transport and Mode Choice in Accra, Ghana 67
Appendix 7: Post Hoc Tests (Income Categories)
Multiple Comparisons Tukey HSD Dependent Variable (I) Average monthly
income (J) Average monthly income
Mean Difference (I-J)
Std. Error Sig. 95% Confidence Interval Lower Bound
Upper Bound
Days and hours operation Less than GHC200 GHC201 - GHC400 .45455 .30072 .658 -.4155 1.3246 GHC401 - GHC600 .66883 .30072 .234 -.2013 1.5389 GHC601 - GHC800 .90693* .23149 .002 .2371 1.5767 above 800 .74402* .23564 .024 .0622 1.4258 No income .95455 .47811 .350 -.4288 2.3379 above 800 -.21053 .46237 .997 -1.5483 1.1273
Time spent in bus Less than GHC200 GHC201 - GHC400 .11039 .29751 .999 -.7504 .9712 GHC401 - GHC600 .89610* .29751 .036 .0353 1.7569 GHC601 - GHC800 .89610* .22903 .002 .2335 1.5588 above 800 .83971* .23313 .006 .1652 1.5142 No income .93182 .47302 .365 -.4368 2.3004
GHC201 - GHC400 Less than GHC200 -.11039 .29751 .999 -.9712 .7504 GHC401 - GHC600 .78571 .32891 .168 -.1659 1.7374 GHC601 - GHC800 .78571* .26856 .046 .0087 1.5627 above 800 .72932 .27207 .086 -.0579 1.5165 No income .82143 .49337 .557 -.6061 2.2489
Waiting time at station GHC601 - GHC800 Less than GHC200 .77922* .19472 .001 .2158 1.3426 GHC201 - GHC400 .92857* .22833 .001 .2679 1.5892 GHC401 - GHC600 .78571* .22833 .010 .1251 1.4464 above 800 .22180 .16565 .763 -.2575 .7011 No income 1.64286* .38715 .001 .5227 2.7630
above 800 Less than GHC200 .55742 .19821 .062 -.0161 1.1309 GHC201 - GHC400 .70677* .23131 .032 .0375 1.3760 GHC401 - GHC600 .56391 .23131 .151 -.1054 1.2332 GHC601 - GHC800 -.22180 .16565 .763 -.7011 .2575 No income 1.42105* .38892 .005 .2958 2.5463
Mechanical condition (breakdowns) of vehicles
Less than GHC200 GHC201 - GHC400 .40260 .26181 .641 -.3549 1.1601 GHC401 - GHC600 .54545 .26181 .303 -.2121 1.3030 GHC601 - GHC800 .54545 .20154 .081 -.0377 1.1286 above 800 .59809* .20515 .047 .0045 1.1917
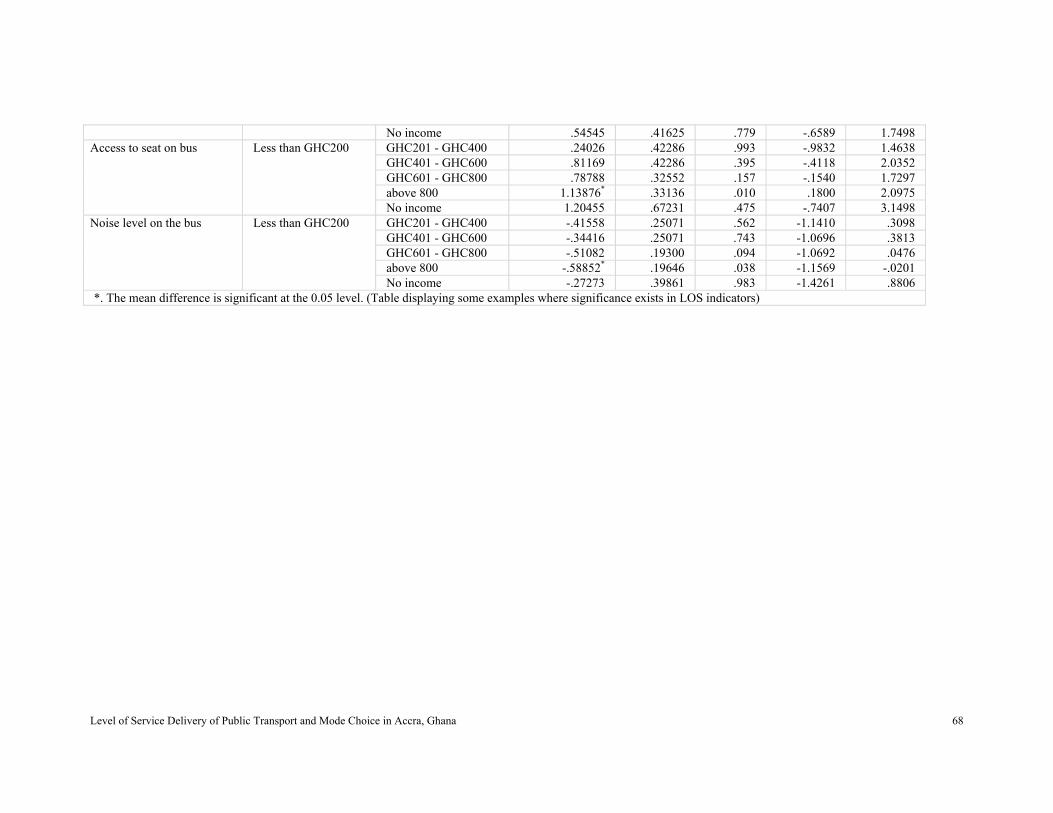
Level of Service Delivery of Public Transport and Mode Choice in Accra, Ghana 68
No income .54545 .41625 .779 -.6589 1.7498 Access to seat on bus Less than GHC200 GHC201 - GHC400 .24026 .42286 .993 -.9832 1.4638
GHC401 - GHC600 .81169 .42286 .395 -.4118 2.0352 GHC601 - GHC800 .78788 .32552 .157 -.1540 1.7297 above 800 1.13876* .33136 .010 .1800 2.0975 No income 1.20455 .67231 .475 -.7407 3.1498
Noise level on the bus
Less than GHC200 GHC201 - GHC400 -.41558 .25071 .562 -1.1410 .3098 GHC401 - GHC600 -.34416 .25071 .743 -1.0696 .3813 GHC601 - GHC800 -.51082 .19300 .094 -1.0692 .0476 above 800 -.58852* .19646 .038 -1.1569 -.0201 No income -.27273 .39861 .983 -1.4261 .8806
*. The mean difference is significant at the 0.05 level. (Table displaying some examples where significance exists in LOS indicators)
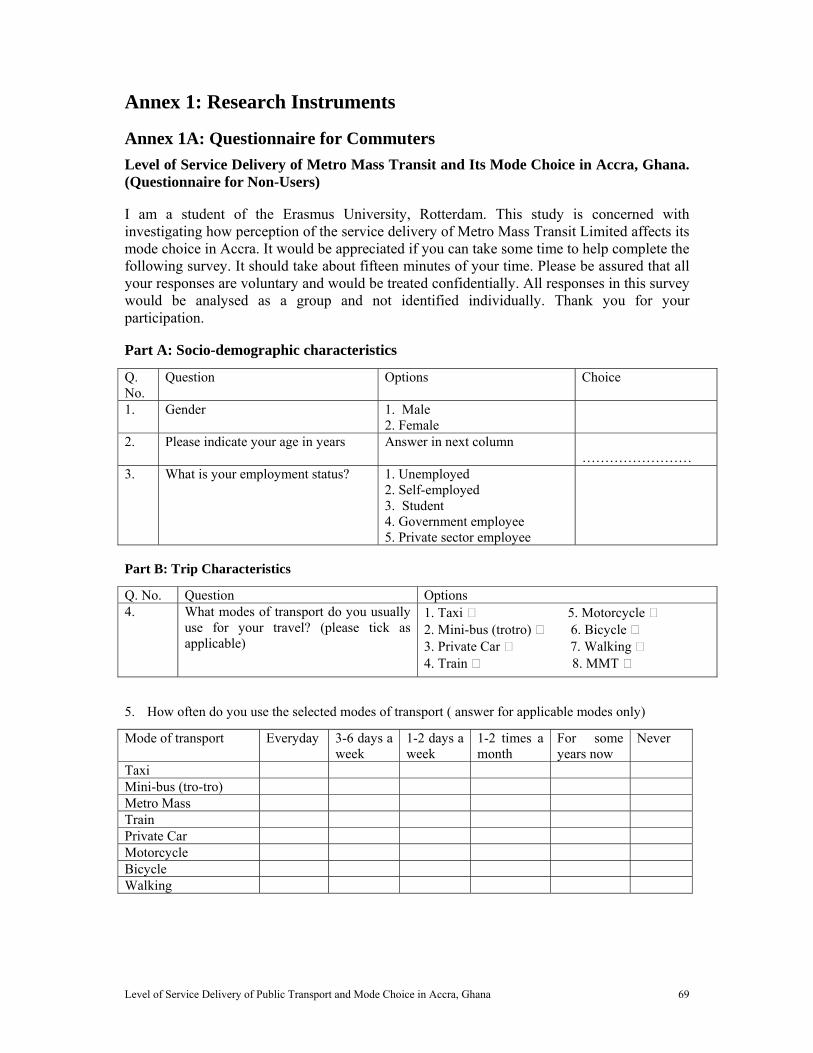
Level of Service Delivery of Public Transport and Mode Choice in Accra, Ghana 69
Annex 1: Research Instruments
Annex 1A: Questionnaire for Commuters
Level of Service Delivery of Metro Mass Transit and Its Mode Choice in Accra, Ghana. (Questionnaire for Non-Users)
I am a student of the Erasmus University, Rotterdam. This study is concerned with investigating how perception of the service delivery of Metro Mass Transit Limited affects its mode choice in Accra. It would be appreciated if you can take some time to help complete the following survey. It should take about fifteen minutes of your time. Please be assured that all your responses are voluntary and would be treated confidentially. All responses in this survey would be analysed as a group and not identified individually. Thank you for your participation.
Part A: Socio-demographic characteristics
Q. No.
Question Options Choice
1. Gender 1. Male 2. Female
2. Please indicate your age in years Answer in next column ……………………
3. What is your employment status?
1. Unemployed 2. Self-employed 3. Student 4. Government employee 5. Private sector employee
Part B: Trip Characteristics
Q. No. Question Options 4. What modes of transport do you usually
use for your travel? (please tick as applicable)
1. Taxi 5. Motorcycle 2. Mini-bus (trotro) 6. Bicycle 3. Private Car 7. Walking 4. Train 8. MMT
5. How often do you use the selected modes of transport ( answer for applicable modes only)
Mode of transport Everyday 3-6 days a week
1-2 days a week
1-2 times a month
For some years now
Never
Taxi Mini-bus (tro-tro) Metro Mass Train Private Car Motorcycle Bicycle Walking

Level of Service Delivery of Public Transport and Mode Choice in Accra, Ghana 70
6. Please fill in the table below for your 3 most frequently used modes in question above
Mode of transport
Purpose of mode use Work/ Office
School Visit family & friends
Social events (e.g. funeral, church, wedding, etc)
Trading/ shopping
Leisure
Taxi Mini-bus (tro-tro) Metro Mass Train Private Car Motorcycle Bicycle Walking 7. Do you combine modes for any of the purpose of travel indicated in the table above?
1. Yes 2. No
8. If yes which combination of modes do you use?
Purpose of mode use
Mode of transport Taxi Mini-bus
(tro-tro) Train Private
Car Motorcycle Bicycle Walking
Work/ Office
School Visit family & friends
Social events (e.g. funeral, church, wedding, etc)
Trading/ shopping
Leisure
9. Why do you combine modes?
………………………………………………………………………………………………………………………………………………………………………………………………………………………………………………………………………………………………………………………………………………………………..............................................................................................
Part C: Perception of level of service delivery of MMT
Q. No.
Question Options Choice
10. How much do you spend daily transportation for a single trip?
Answer in next column …………...
11. Please indicate your monthly income range
1. Less than GHC200 2. GHC201 – GHC400 3. GHC401 – GHC600 4. GHC601 – GHC800 5. Above GHC800 6. Not applicable
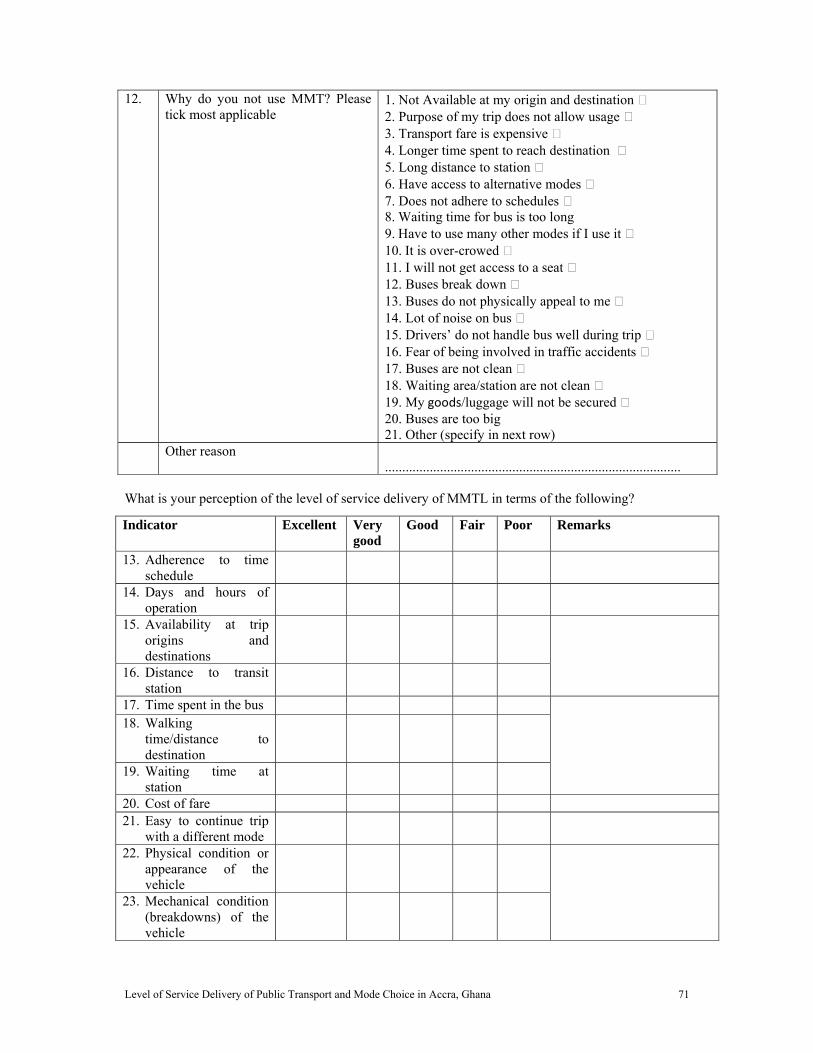
Level of Service Delivery of Public Transport and Mode Choice in Accra, Ghana 71
12. Why do you not use MMT? Please tick most applicable
1. Not Available at my origin and destination 2. Purpose of my trip does not allow usage 3. Transport fare is expensive 4. Longer time spent to reach destination 5. Long distance to station 6. Have access to alternative modes 7. Does not adhere to schedules 8. Waiting time for bus is too long 9. Have to use many other modes if I use it 10. It is over-crowed 11. I will not get access to a seat 12. Buses break down 13. Buses do not physically appeal to me 14. Lot of noise on bus 15. Drivers’ do not handle bus well during trip 16. Fear of being involved in traffic accidents 17. Buses are not clean 18. Waiting area/station are not clean 19. My goods/luggage will not be secured 20. Buses are too big 21. Other (specify in next row)
Other reason ......................................................................................
What is your perception of the level of service delivery of MMTL in terms of the following?
Indicator Excellent Very good
Good Fair Poor Remarks
13. Adherence to time schedule
14. Days and hours of operation
15. Availability at trip origins and destinations
16. Distance to transit station
17. Time spent in the bus 18. Walking
time/distance to destination
19. Waiting time at station
20. Cost of fare 21. Easy to continue trip
with a different mode
22. Physical condition or appearance of the vehicle
23. Mechanical condition (breakdowns) of the vehicle

Level of Service Delivery of Public Transport and Mode Choice in Accra, Ghana 72
What is your perception on the following quality attributes of the services delivered by MMTL?
Indicator Excellent Very good
Good Fair Poor Remarks
24. Access to seat on the bus 25. Crowding on the bus 26. Driver handling 27. Noise level on the bus? 28. Safety from traffic
accidents
29. Security of goods/luggage 30. Cleanliness of vehicle 31. Cleanliness of waiting
area/station
32. Given the list of factors below, please rank the TOP FIVE items that would be most important to you if you were to use MMT? Please rank from 1-5. (5) being highest priority.
[ ] Adherence to time schedule [ ] Access to seat on the bus [ ] Days and hours of operation [ ] Crowding on the bus [ ] Availability at trip origins and destinations [ ] Driver handling [ ] Distance to transit station [ ] Noise level [ ] Time spent in the bus [ ] Safety from traffic accidents [ ] Walking time/distance to destination [ ] Cleanliness of vehicle [ ] Walking time/distance to station [ ] Cleanliness of waiting area [ ] Waiting time at station [ ] Security of goods/luggage [ ] Cost of fare [ ] Physical condition of the vehicle [ ] Easy to continue trip with a different mode [ ] Mechanical condition (breakdowns) of the vehicle
33. Which of the following factors are the TOP FIVE factors that discourage your use of MMT? Please rank from 1-5. Highest priority being 5.
Adherence to time schedule Mechanical condition of the vehicle How long MMT operates (time duration) Cleanliness of vehicle Waiting time at station Cleanliness of waiting area/station Walking time/distance to station Access to seat Walking time/distance to destination Driver handling Time spent in the bus travelling Noise levels Availability of bus at the station Physical condition of vehicle How easy it is to continue trip with a different mode Goods/luggage Crowding Security from theft Security of goods/luggage Safety from traffic accidents
34. Would you use MMT if the factors you selected in the above question were improved?
1. Yes 2. No 35. If no, explain why?
……………………………………………………………………………………………………………………………………………………………………………………………………………… ………………………………………………………………………………………………………………………………………………………………………………………………………………………………………………………………………………..........................................................

Level of Service Delivery of Public Transport and Mode Choice in Accra, Ghana 73
Level of Service Delivery of Metro Mass Transit and Its Mode Choice in Accra, Ghana. (Questionnaire for Occasional Users)
I am a student of the Erasmus University, Rotterdam. This study is concerned with investigating how perception of the service delivery of Metro Mass Transit Limited affects its mode choice in Accra. It would be appreciated if you can take some time to help complete the following survey. It should take about fifteen minutes of your time. Please be assured that all your responses are voluntary and would be treated confidentially. All responses in this survey would be analysed as a group and not identified individually. Thank you for your participation.
Part A: Socio-demographic characteristics
Q. No.
Question Options Choice
1. Gender 1. Male 2. Female
2. Please indicate your age in years Answer in next column ………………
3. What is your employment status?
1. Unemployed 2. Self-employed 3. Student 4. Government employee 5. Private sector employee
Part B: Trip Characteristics
Q. No. Question Options 4. What modes of transport do you
usually use for your travel? (please tick as applicable)
1. Taxi 5. Motorcycle 2. Mini-bus (trotro) 6. Bicycle 3. Private Car 7. Walking 4. Train 8. MMT
5. How often do you use the selected modes of transport ( answer for applicable modes only)
Mode of transport Everyday 3-6 days a week
1-2 days a week
1-2 times a month
For some years now
Never
Taxi Mini-bus (tro-tro) Metro Mass Train Private Car Motorcycle Bicycle Walking
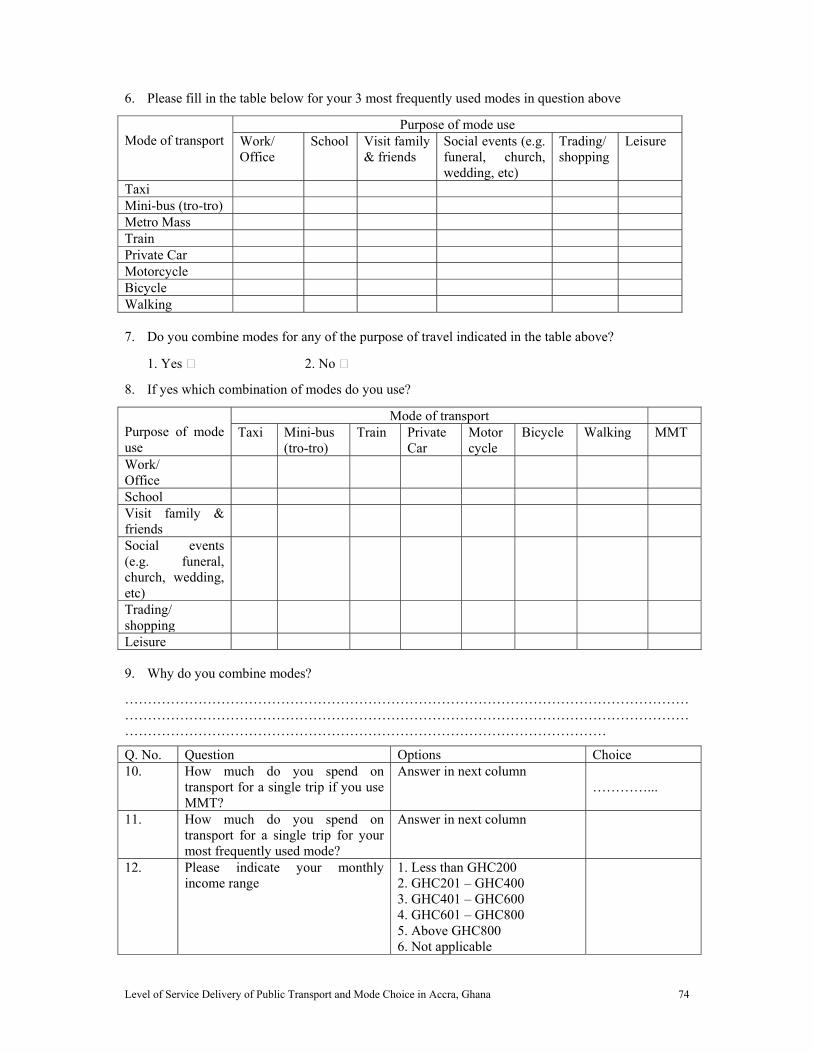
Level of Service Delivery of Public Transport and Mode Choice in Accra, Ghana 74
6. Please fill in the table below for your 3 most frequently used modes in question above
Mode of transport
Purpose of mode use Work/ Office
School Visit family & friends
Social events (e.g. funeral, church, wedding, etc)
Trading/ shopping
Leisure
Taxi Mini-bus (tro-tro) Metro Mass Train Private Car Motorcycle Bicycle Walking 7. Do you combine modes for any of the purpose of travel indicated in the table above?
1. Yes 2. No
8. If yes which combination of modes do you use?
Purpose of mode use
Mode of transport Taxi Mini-bus
(tro-tro) Train Private
Car Motorcycle
Bicycle Walking MMT
Work/ Office
School Visit family & friends
Social events (e.g. funeral, church, wedding, etc)
Trading/ shopping
Leisure
9. Why do you combine modes?
………………………………………………………………………………………………………………………………………………………………………………………………………………………………………………………………………………………………………………………
Q. No. Question Options Choice 10. How much do you spend on
transport for a single trip if you use MMT?
Answer in next column …………...
11. How much do you spend on transport for a single trip for your most frequently used mode?
Answer in next column
12. Please indicate your monthly income range
1. Less than GHC200 2. GHC201 – GHC400 3. GHC401 – GHC600 4. GHC601 – GHC800 5. Above GHC800 6. Not applicable
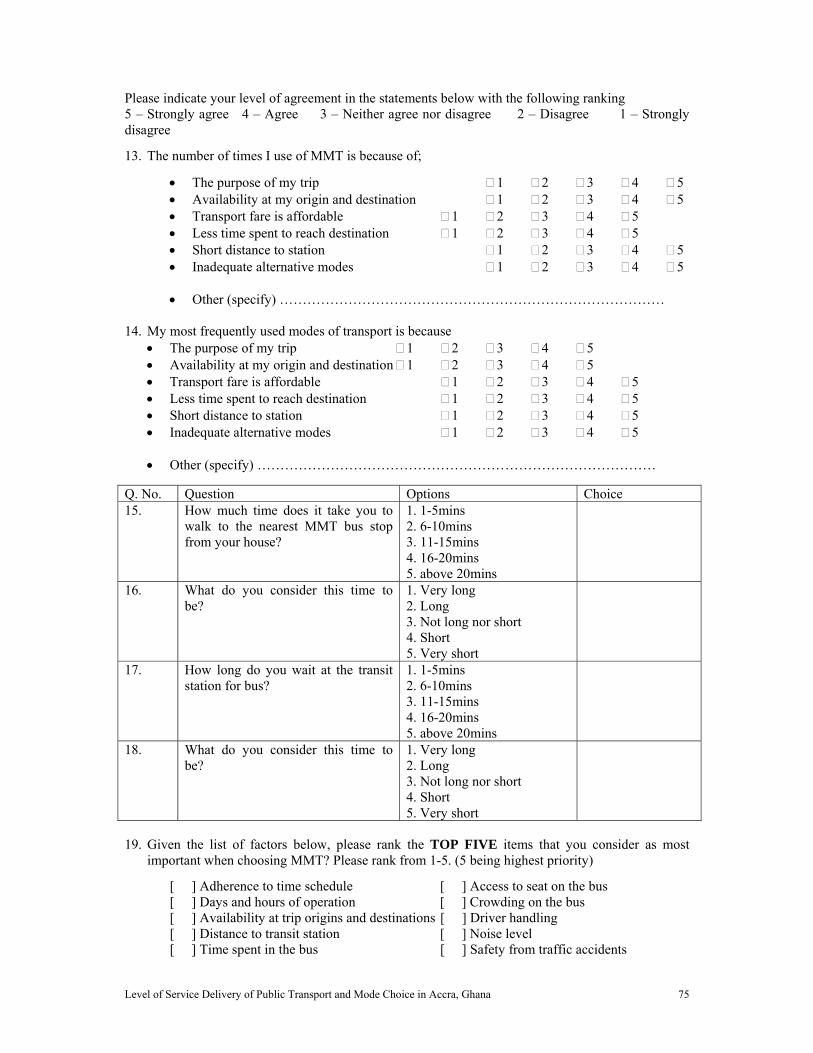
Level of Service Delivery of Public Transport and Mode Choice in Accra, Ghana 75
Please indicate your level of agreement in the statements below with the following ranking 5 – Strongly agree 4 – Agree 3 – Neither agree nor disagree 2 – Disagree 1 – Strongly disagree
13. The number of times I use of MMT is because of;
The purpose of my trip 1 2 3 4 5 Availability at my origin and destination 1 2 3 4 5 Transport fare is affordable 1 2 3 4 5 Less time spent to reach destination 1 2 3 4 5 Short distance to station 1 2 3 4 5 Inadequate alternative modes 1 2 3 4 5
Other (specify) …………………………………………………………………………
14. My most frequently used modes of transport is because
The purpose of my trip 1 2 3 4 5 Availability at my origin and destination 1 2 3 4 5 Transport fare is affordable 1 2 3 4 5 Less time spent to reach destination 1 2 3 4 5 Short distance to station 1 2 3 4 5 Inadequate alternative modes 1 2 3 4 5
Other (specify) ……………………………………………………………………………
Q. No. Question Options Choice 15. How much time does it take you to
walk to the nearest MMT bus stop from your house?
1. 1-5mins 2. 6-10mins 3. 11-15mins 4. 16-20mins 5. above 20mins
16. What do you consider this time to be?
1. Very long 2. Long 3. Not long nor short 4. Short 5. Very short
17. How long do you wait at the transit station for bus?
1. 1-5mins 2. 6-10mins 3. 11-15mins 4. 16-20mins 5. above 20mins
18. What do you consider this time to be?
1. Very long 2. Long 3. Not long nor short 4. Short 5. Very short
19. Given the list of factors below, please rank the TOP FIVE items that you consider as most important when choosing MMT? Please rank from 1-5. (5 being highest priority)
[ ] Adherence to time schedule [ ] Access to seat on the bus [ ] Days and hours of operation [ ] Crowding on the bus [ ] Availability at trip origins and destinations [ ] Driver handling [ ] Distance to transit station [ ] Noise level [ ] Time spent in the bus [ ] Safety from traffic accidents
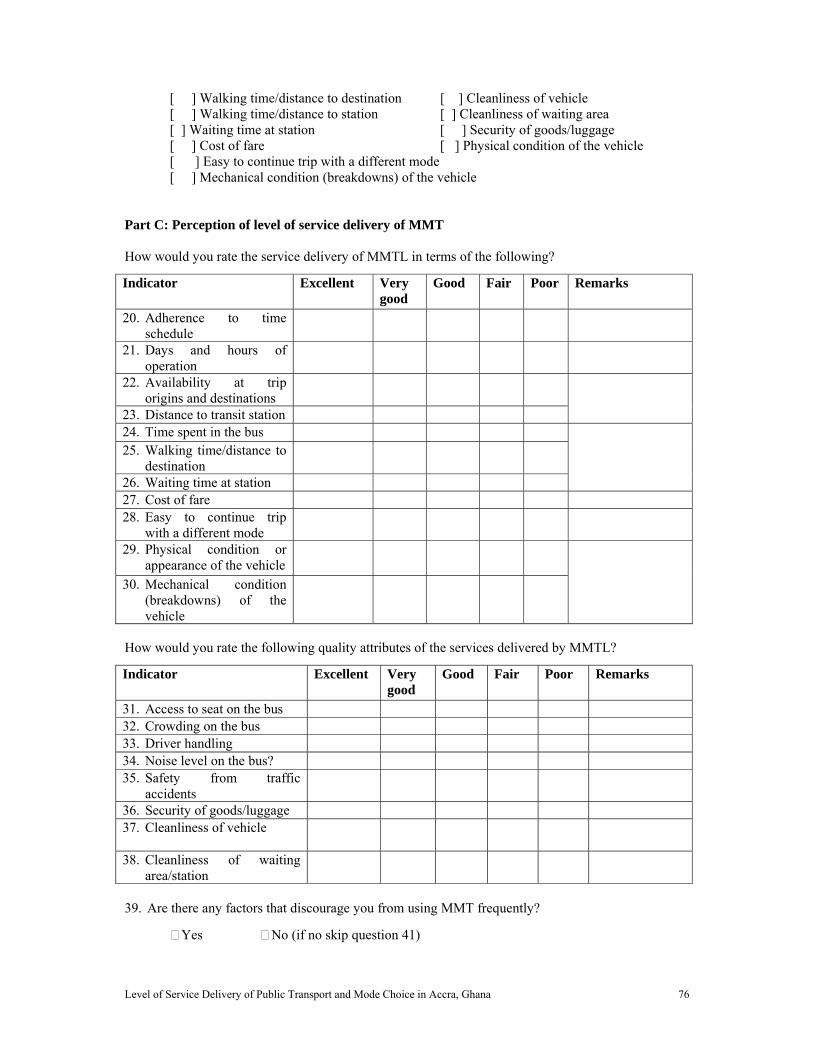
Level of Service Delivery of Public Transport and Mode Choice in Accra, Ghana 76
[ ] Walking time/distance to destination [ ] Cleanliness of vehicle [ ] Walking time/distance to station [ ] Cleanliness of waiting area [ ] Waiting time at station [ ] Security of goods/luggage [ ] Cost of fare [ ] Physical condition of the vehicle [ ] Easy to continue trip with a different mode [ ] Mechanical condition (breakdowns) of the vehicle
Part C: Perception of level of service delivery of MMT
How would you rate the service delivery of MMTL in terms of the following?
Indicator Excellent Very good
Good Fair Poor Remarks
20. Adherence to time schedule
21. Days and hours of operation
22. Availability at trip origins and destinations
23. Distance to transit station 24. Time spent in the bus 25. Walking time/distance to
destination
26. Waiting time at station 27. Cost of fare 28. Easy to continue trip
with a different mode
29. Physical condition or appearance of the vehicle
30. Mechanical condition (breakdowns) of the vehicle
How would you rate the following quality attributes of the services delivered by MMTL?
Indicator Excellent Very good
Good Fair Poor Remarks
31. Access to seat on the bus 32. Crowding on the bus 33. Driver handling 34. Noise level on the bus? 35. Safety from traffic
accidents
36. Security of goods/luggage 37. Cleanliness of vehicle
38. Cleanliness of waiting
area/station
39. Are there any factors that discourage you from using MMT frequently?
Yes No (if no skip question 41)

Level of Service Delivery of Public Transport and Mode Choice in Accra, Ghana 77
40. If yes which of the following factors are the TOP FIVE factors that discourage your use of MMT? Please rank from 1-5. Highest priority being 5.
Adherence to time schedule Mechanical condition of the vehicle How long MMT operates (time duration) Cleanliness of vehicle Waiting time at station Cleanliness of waiting area/station Walking time/distance to station Walking time/distance to destination Access to seat Driver handling Time spent in the bus travelling Noise levels Availability of bus at the station Physical condition of vehicle How easy it is to continue trip with a different mode Goods/luggage Crowding Size of bus Safety from traffic accidents Security from theft Security of goods/luggage
41. Would the number of times you use MMT increase if the factors you selected in the above
question were improved? Yes No
42. If no, explain why?
………………………………………………………………………………………………………………………………………………………………………………………………

Level of Service Delivery of Public Transport and Mode Choice in Accra, Ghana 78
Level of Service Delivery of Metro Mass Transit and Its Mode Choice in Accra, Ghana. (Questionnaire for Frequent Users)
I am a student of the Erasmus University, Rotterdam. This study is concerned with investigating how perception of the service delivery of Metro Mass Transit Limited affects its mode choice in Accra. It would be appreciated if you can take some time to help complete the following survey. It should take about fifteen minutes of your time. Please be assured that all your responses are voluntary and would be treated confidentially. All responses in this survey would be analysed as a group and not identified individually. Thank you for your participation.
Part A: Socio-demographic characteristics
Q. No.
Question Options Choice
1. Gender 1. Male 2. Female
2. Please indicate your age in years Answer in next column …………… 3. What is your employment status?
1. Unemployed 2. Self-employed 3. Student 4. Government employee 5. Private sector employee
Part B: Trip Characteristics
Q. No. Question Options 4. What modes of transport do you usually
use for your travel? (please tick as applicable)
1. Taxi 5. Motorcycle 2. Mini-bus (trotro) 6. Bicycle 3. Private Car 7. Walking 4. Train 8. MMT
5. How often do you use the selected modes of transport ( answer for applicable modes only)
Mode of transport Everyday 3-6 days a week
1-2 days a week
1-2 times a month
For some years now
Never
Taxi Mini-bus (tro-tro) Metro Mass Train Private Car Motorcycle Bicycle Walking

Level of Service Delivery of Public Transport and Mode Choice in Accra, Ghana 79
6. Please fill in the table below for your 3 most frequently used modes in question above
Mode of transport
Purpose of mode use Work/ Office
School Visit family & friends
Social events (e.g. funeral, church, wedding, etc)
Trading/ shopping
Leisure
Taxi Mini-bus (tro-tro) Metro Mass Train Private Car Motorcycle Bicycle Walking 7. Do you combine modes for any of the purpose of travel indicated in the table above?
1. Yes 2. No
8. If yes which combination of modes do you use?
Purpose of mode use
Mode of transport Taxi Mini-bus
(tro-tro) Train Private
Car Motorcycle
Bicycle Walking MMT
Work/ Office
School Visit family & friends
Social events (e.g. funeral, church, wedding, etc)
Trading/ shopping
Leisure
9. Why do you combine modes?
………………………………………………………………………………………………………………………………………………………………………………………………………………………………………………………………………………………………………………………
Q. No. Question Options Choice 10. How much do you spend on
transport for a single trip if you use MMT?
Answer in next column …………...
11. Please indicate your monthly income range
1. Less than GHC200 2. GHC201 – GHC400 3. GHC401 – GHC600 4. GHC601 – GHC800 5. Above GHC800
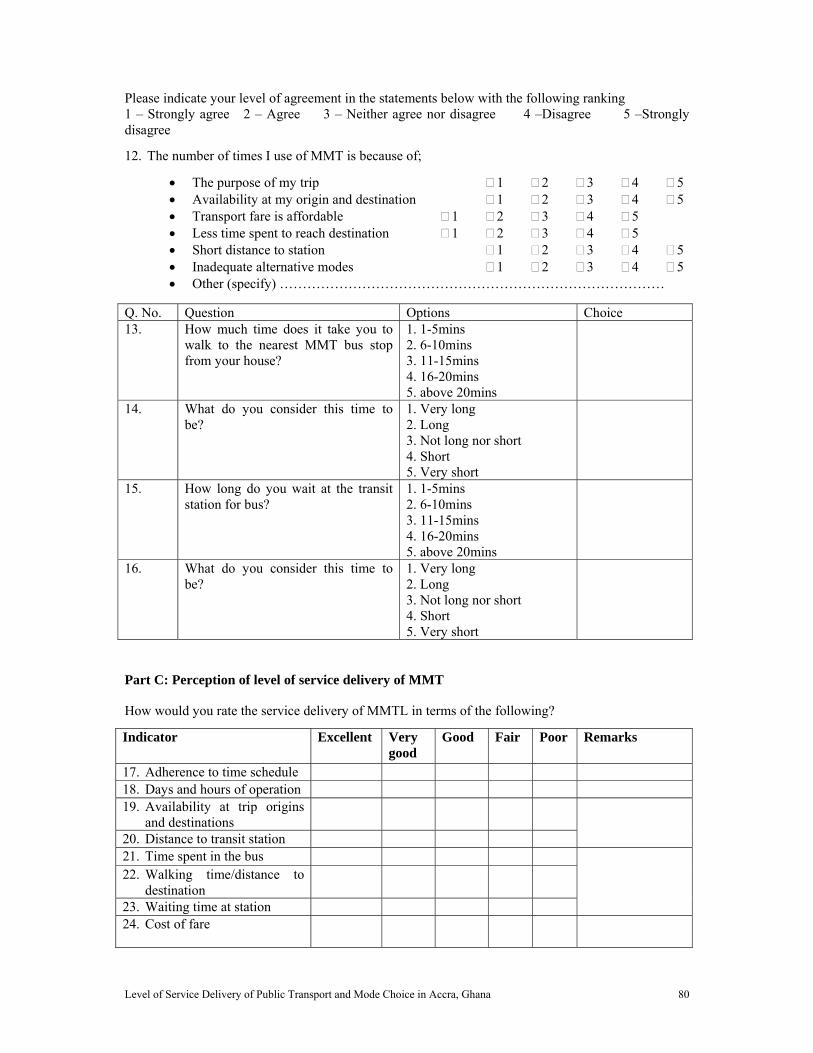
Level of Service Delivery of Public Transport and Mode Choice in Accra, Ghana 80
Please indicate your level of agreement in the statements below with the following ranking 1 – Strongly agree 2 – Agree 3 – Neither agree nor disagree 4 –Disagree 5 –Strongly disagree
12. The number of times I use of MMT is because of;
The purpose of my trip 1 2 3 4 5 Availability at my origin and destination 1 2 3 4 5 Transport fare is affordable 1 2 3 4 5 Less time spent to reach destination 1 2 3 4 5 Short distance to station 1 2 3 4 5 Inadequate alternative modes 1 2 3 4 5 Other (specify) …………………………………………………………………………
Q. No. Question Options Choice 13. How much time does it take you to
walk to the nearest MMT bus stop from your house?
1. 1-5mins 2. 6-10mins 3. 11-15mins 4. 16-20mins 5. above 20mins
14. What do you consider this time to be?
1. Very long 2. Long 3. Not long nor short 4. Short 5. Very short
15. How long do you wait at the transit station for bus?
1. 1-5mins 2. 6-10mins 3. 11-15mins 4. 16-20mins 5. above 20mins
16. What do you consider this time to be?
1. Very long 2. Long 3. Not long nor short 4. Short 5. Very short
Part C: Perception of level of service delivery of MMT
How would you rate the service delivery of MMTL in terms of the following?
Indicator Excellent Very good
Good Fair Poor Remarks
17. Adherence to time schedule 18. Days and hours of operation 19. Availability at trip origins
and destinations
20. Distance to transit station 21. Time spent in the bus 22. Walking time/distance to
destination
23. Waiting time at station 24. Cost of fare

Level of Service Delivery of Public Transport and Mode Choice in Accra, Ghana 81
25. Easy to continue trip with a different mode
26. Physical condition or appearance of the vehicle
27. Mechanical condition (breakdowns) of the vehicle
How would you rate the following quality attributes of the services delivered by MMTL?
Indicator Excellent Very good
Good Fair Poor Remarks
28. Access to seat on the bus 29. Crowding on the bus 30. Driver handling 31. Noise level on the bus? 32. Safety from traffic
accidents
33. Security of goods/luggage 34. Cleanliness of vehicle 35. Cleanliness of waiting
area/station
36. Are there any factors that discourage your use of MMT?
Yes No (if no skip question 38)
37. Which of the following factors are the TOP FIVE factors that discourage your use of MMT? Please rank from 1-5. Highest priority being 5.
Adherence to time schedule Mechanical condition of the vehicle How long MMT operates (time duration) Cleanliness of vehicle Waiting time at station Cleanliness of waiting area/station Walking time/distance to station Access to seat Walking time/distance to destination Driver handling Time spent in the bus travelling Noise levels Availability of bus at the station Physical condition of vehicle How easy it is to continue trip with a different mode Goods/luggage Crowding Security from theft Security of goods/luggage Safety from traffic accidents
38. What do you suggest should be done to improve the services provided by MMTL?
……………………………………………………………………………………………………………………………………………………………………………………………………………………………………………………………………………………………………………………………………………………………………………………………………………………………………………………………………………………………………………..

Level of Service Delivery of Public Transport and Mode Choice in Accra, Ghana 82
Level of Service Delivery of Metro Mass Transit and Its Mode Choice in Accra, Ghana. (Semi-structured Questionnaire for Frequent Users)
I am a student of the Erasmus University, Rotterdam. This study is concerned with investigating how perception of the service delivery of Metro Mass Transit Limited affects its mode choice in Accra. It would be appreciated if you can take some time to help complete the following survey. It should take about fifteen minutes of your time. Please be assured that all your responses are voluntary and would be treated confidentially. All responses in this survey would be analysed as a group and not identified individually. Thank you for your participation.
Part A: Socio-demographic characteristics Q. No.
Question Options Choice
36. Gender 1. Male 2. Female
37. Please indicate your age in years Answer in next column ………………..
38. What is your employment status?
1. Unemployed 2. Self-employed 3. Student 4. Government employee 5. Private sector employee
39. Please indicate your monthly income range
1. Less than GHC200 2. GHC201 – GHC400 3. GHC401 – GHC600 4. GHC601 – GHC800 5. Above GHC800 6. Not applicable
Part B: Trip Characteristics Q. No. Question Options Choice 40. How often do you use Metro
Mass? 1. Everyday 2. 3-6 days a week 3. 1-2 days a week
41. Which other modes of transport do you use apart from Metro Mass? Please tick as applicable
1. Taxi 4. Train 2. Mini-bus (trotro) 6. Bicycle 3. Private Car 7. Walking 5. Motorcycle
42. For what purposes do you use Metro Mass?
……………………………………………………………..
43. For what purposes do you use Taxi? (if applicable)
…………………………………………………………
44. For what purposes do you use mini bus? (if applicable)
………………………………………………………
45. For what purposes do you use private car? (if applicable)
…………………………………………………………..
46. For what purposes do you use train? (if applicable)
……………………………………………………………
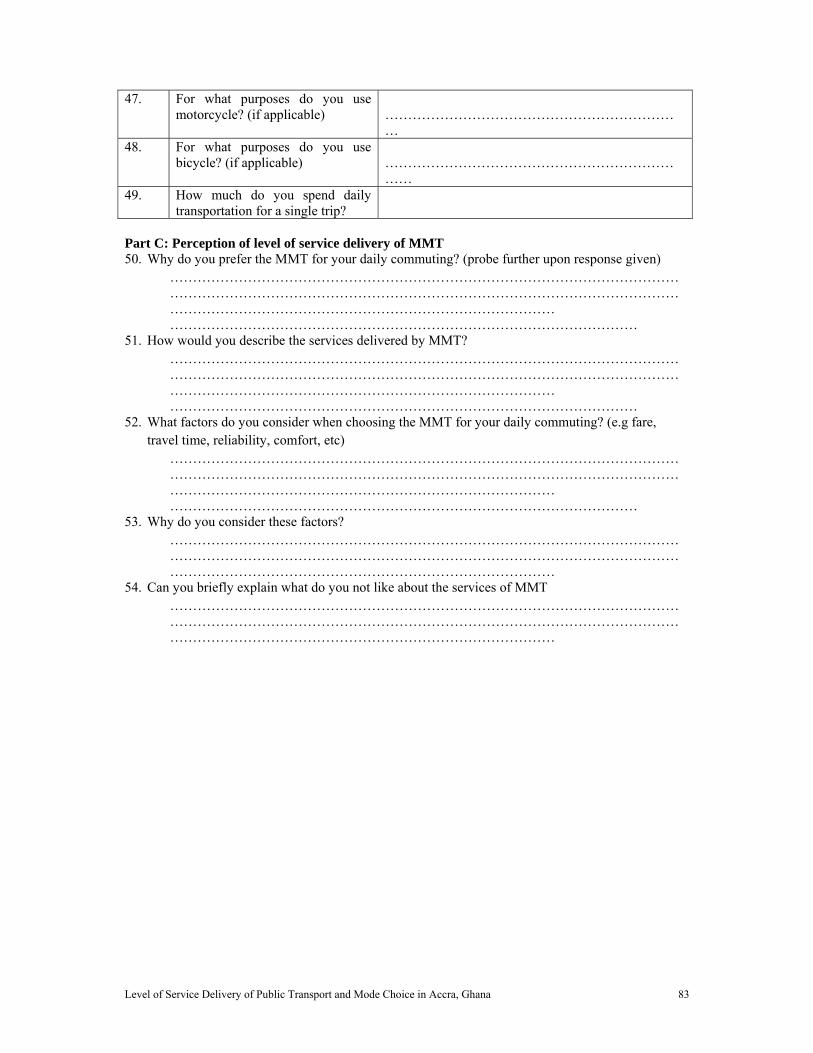
Level of Service Delivery of Public Transport and Mode Choice in Accra, Ghana 83
47. For what purposes do you use motorcycle? (if applicable)
…………………………………………………………
48. For what purposes do you use bicycle? (if applicable)
……………………………………………………………
49. How much do you spend daily transportation for a single trip?
Part C: Perception of level of service delivery of MMT 50. Why do you prefer the MMT for your daily commuting? (probe further upon response given)
……………………………………………………………………………………………………………………………………………………………………………………………………………………………………………………………………………… …………………………………………………………………………………………
51. How would you describe the services delivered by MMT? ……………………………………………………………………………………………………………………………………………………………………………………………………………………………………………………………………………… …………………………………………………………………………………………
52. What factors do you consider when choosing the MMT for your daily commuting? (e.g fare, travel time, reliability, comfort, etc)
……………………………………………………………………………………………………………………………………………………………………………………………………………………………………………………………………………… …………………………………………………………………………………………
53. Why do you consider these factors? ………………………………………………………………………………………………………………………………………………………………………………………………………………………………………………………………………………
54. Can you briefly explain what do you not like about the services of MMT ………………………………………………………………………………………………………………………………………………………………………………………………………………………………………………………………………………

Level of Service Delivery of Public Transport and Mode Choice in Accra, Ghana 84
Annex 1B: Interview Guide for Mero Mass Transit Limited
Level of Service Delivery of Metro Mass Transit and Its Mode Choice in Accra, Ghana.
I am a student of the Erasmus University, Rotterdam. This study is concerned with investigating how perception of the service delivery of Metro Mass Transit Limited affects its mode choice in Accra. It would be appreciated if you can take some time to help complete the following survey. It should take about fifteen minutes of your time. Please be assured that all your responses are voluntary and would be treated confidentially. All responses in this survey would be analysed as a group and not identified individually. Thank you for your participation.
1. How would describe the patronage of the Intra-city service in Accra? 2. What factors encourage the use of MMT by commuters? 3. What factors do you think discourage people from using MMT? 4. How do you think the company can improve services to reduce the discouraging
factors of using MMT buses? 5. What challenges does the company face in service delivery? 6. Why do you think these challenges mentioned exist?
7. How would you rate the service delivery of MMTL in terms of the following?
Attribute Indicator Excellent Very good
Good Fair Poor Remarks
Reliability Adherence to time schedule
Frequency Days and hours of operation
Accessibility
Availability at trip origins and destinations
Distance to transit station
Travelling time
Time spent in the bus
Walking time/distance to destination
Walking time/distance to station
Waiting time at station
Price Cost of fare Ease of transfers
Easy to continue trip with a different mode
Vehicle conditions
Physical condition or appearance of the vehicle
Mechanical condition (breakdowns) of
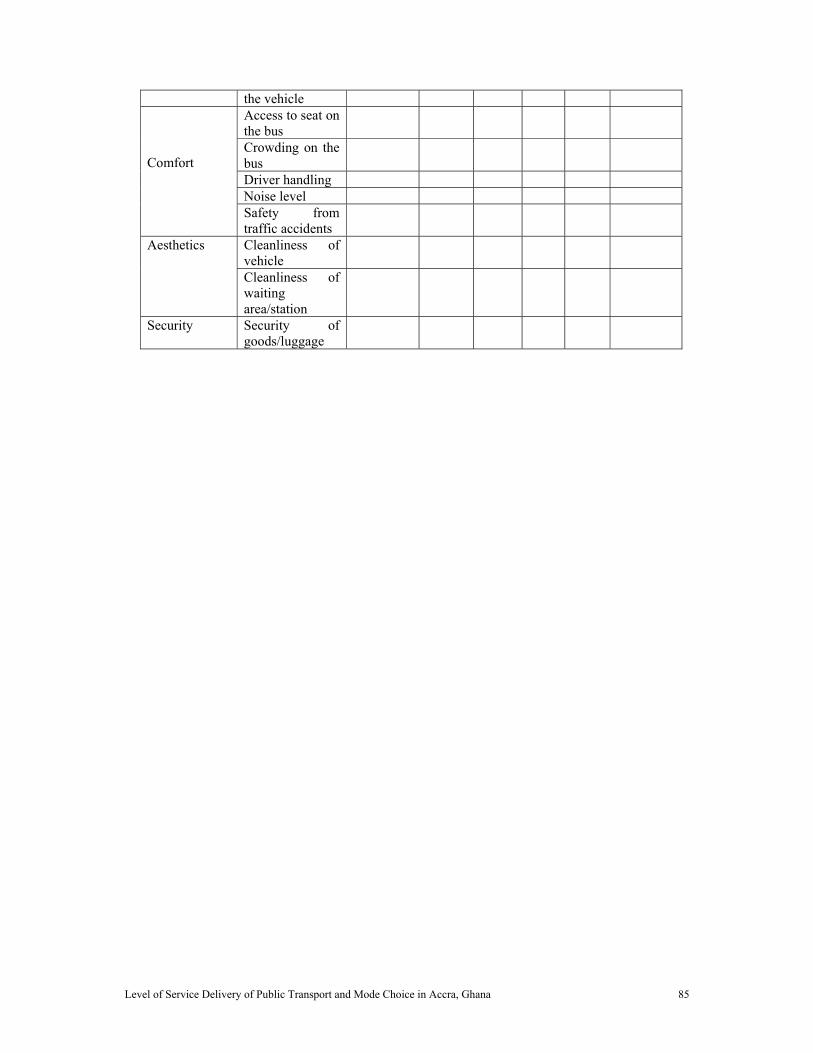
Level of Service Delivery of Public Transport and Mode Choice in Accra, Ghana 85
the vehicle Comfort
Access to seat on the bus
Crowding on the bus
Driver handling Noise level Safety from traffic accidents
Aesthetics Cleanliness of vehicle
Cleanliness of waiting area/station
Security Security of goods/luggage