
LEVEL - DTIC
87
LEVEL SAFFDL-TR-77-60LEL BIRD IMPACT FORCES AND PRESSURES ON RIGID AND COMPLIANT TARGETS LJ UNIVERSITY OF DA YTON 4 ESk A RC'h INSTITUTE 300 COL L EGE PAR• K A VENUE DA YTON, 01110 45469 MAY 1978 rno=jv 4UNO J1DDCu TECNINCAL REPORiT AFFDL.'R-7 7-60 Fina Rcport for Pet iod April 1976 - December 1976 •.E Approved for public releas. disttibution unliitied. AIR FORCE I LIGHT DYNAMICS LABORATORY "AAIR FORCE WRIGHT AERONAUTICAL LiABORATORIES AIR FORCE SYSTEMS COMMAND WRIGHT-PATTERSON AIR FORCE BASE, 0110 4543 3
Transcript of LEVEL - DTIC

LEVELSAFFDL-TR-77-60LEL
BIRD IMPACT FORCES AND PRESSURESON RIGID AND COMPLIANT TARGETS
LJ UNIVERSITY OF DA YTON4 ESk A RC'h INSTITUTE300 COL L EGE PAR• K A VENUEDA YTON, 01110 45469
MAY 1978 rno=jv4UNO J1DDCu
TECNINCAL REPORiT AFFDL.'R-7 7-60Fina Rcport for Pet iod April 1976 - December 1976 •.E
Approved for public releas. disttibution unliitied.
AIR FORCE I LIGHT DYNAMICS LABORATORY
"AAIR FORCE WRIGHT AERONAUTICAL LiABORATORIESAIR FORCE SYSTEMS COMMANDWRIGHT-PATTERSON AIR FORCE BASE, 0110 4543 3

NOTICE
When Government drawings, specifications, or other data are used forany purpose other than in connection with a definitely related Governmentprocurement operation, the United States Government thereby incurs noresponsibility nor any obligation whatsoever; and the fact that thegovernment may have formulated, furnished, or in any way supplied the saiddrawings, specifications, or other data, is not to be regarded by implica-tion or otherwise dS in any manner licensinrg ''.e holder or any other personpr corporation, or conveying any rights or permission to manufacture, use,or sell any patented inventib6n that may in any way be related thereto.
This report has been reviewed by the Information Office (10) and isreleasable to the National Technical Information Service (NTIS). At NTIS,it will be available to the general public, including foreign nations.
This technical report has been reviewed and is approved for publication.
RICHARD L. PETERSON, Project ManagerImproved Wit~dshield Protection ADPOVehicie Equipment DivisionAir Force 2dIght Dynamics Laboratory
FOR THE COMMANDER
ROBERT r. WITTHAN, Program Manager AMBROSE B. NUTTImproved Windshield Protection ADPO DirectorVehicle Equipment Division Vehicle Equipment DivisionAir Force Flight Dynamics Laboratory Air Force Flight Dynamics Laboratory
Copies Of this rPpozt should not be returned unless return is required byGecurlty cons'darations, contractual obligations, or notice on a specificdocument.A 0,0e t I'ORC..G780/ 2 O.,bav 197. - ISO

UNCLASSIFIED V LSECURITY CLASSIFICATION OF THIS PAGE (WMlen Dfaet lnthod
READ INSTRUCTIONSEPORT DOCUMENTATION PAGE BEFORE COMPLETING F~ORM
R 77-6_ _ _ __-
CONROLN OFIC NAM AND" TADDERODESSRE
IS. E C AS IIFI C A T I N UMBER(.)DI
AMEP MANDll ADDRES 1OV PROliL T TS
BiDatn Omllrt 14)43 Workir Uninr ~vttr~oIpatt N~o . 223.
14ch MOITRING~ AGN Eon in? lnA AOESil .'d d':w iptIo oft tea or1igOfie 5 o ut TY ZLS.~ (n.1 thio vr ll~t-
I to wih I t~h' SO'. P~r.1~p..d romt hi daa. Brd mpNCLA01r u'ronwr 'i
m~~~'anur~~~~'IS .FCL Ih I~j~~ ev.'n Wa Aon t1 NonI~ f fu ~~sn. Te fipt~>~ . t h Init a 1 hoc phae I whkh ~r(~?I.'ly SCHEDrnULE a.
16-te DITIBTO STTEMFNT lo"!It~: may. horacuatd ft Iu'o ltrtla on
Dk'dt-trial for nw. t a public tht ioia¶in ~th enprcn pr.
I, u 1473 DITtONO 5TYEAINTe. i * IIOS ollto 1 1 4tlot t Affý .fUII~~uft&Tvl 600fIAI~ PY41PAEeten .. #~d
NOV/6

UNCLASSIFIEDSECURITY CLASSIFICATION OF THIS PAGE(W'hen Data Entered)
20. ABSTRACT (continued)
provided a good material model for the prediction of impact pressures. Thesecond process is the impact shock decay phase. During this phase radialrelease waves propagate from the edges of the bird towards the center of impact.These radial release waves accelerate the bird material radially and attenuatethe shock. The third impact process is a steady flow condition which followsthe shock decay. During this phase the bird behaves like a jet flowing steadilyonto the target. The final impact process is the termination and this occurswhen the end of the bird reaches the target. Each of these processes wasexamined analytically and experimentally. Birds ranging in size from 60g to4 kg were investigated. Impact angles of 900, 450, and 250 were employed.
Impact velocities typical of aircraft/bird encounters (50 to over 300 m/s) werechosen. Birds were found to behave as a fluid during impact. All the importantfeatures of the impact process were successfully analyzed.
The effects of target compliance on bird loading were also investigated.Target compliance was divided into two classes, locally rigid and locallydeforming. A computational scheme designed to properly couple the loading tothe response for locally rigid targets was devised. An exploratory experimentalstudy of locally deforming targets was undertaken. Some important features oflocally deforming response were identified.
ACCESSION lotNTIS W'-c &.:t1on000 U• •Sut'on {"
#11D•T........ . .,, . .(.......
UNCLASS•IFID
SECufITV CLASSIFrICATION Of THIS P&Ot(flGV 0D60 £.nIfd)
p!" ,, • -I - '. .'"- 'a.. .. . .. . .

FOREWORD
The effort reported herein was conducted in the Impact Physics Group
under the direction of the Aerospace Mechanics Division of the University
of Dayton Research Institute, Dayton, Ohio, under Contract F33615-76-C-3103,
for the Air Force Flight Dynamics Laboratory, Wright-Patterson Air Force
Base, Ohio. Air Force administrative direction and technical support was
provided by Mr. Richard L. Peterson, AFFDL/FEW, the Air Force Project
Mdnager. The experimental portion of the work was conducted at the Impact
Mechanics facilities of the Air Force Materials Laboratory, Wright-
Patterson Air Force Base, Ohio. The large bird testing was performed at
Arnold Engineering Development Center, Arnold Air Force Station, Tennessee.
The work described herein was conducted during the period from
May 1976 to December 1976. The principal investigator was Dr. John P. Barber,
Head, Impact Physics Group of the Applied Physics Division of the University
of Dayton Research Institute. Project supervision and techniical assistance
was provided through the Aerospace Mechanics Division of the University of
Dayton Research Institute with Mr. Dale H. Whitford, Supervisor, Mr. George
J. Roth, Leader, Structural Analysis Group, Blaine S. West, Project
Engineýr.
In addition to tho:ie listed above, the authors wish to acknowledge the
following persons who mado significant contributions to this work,
Dr. David L. Quam/UJDRI, D'r. Louis 1. Boehman/UDRI, Mrs. Sue C. (alUnor/UDMPI.
The active support of the Air Force Matcvials Laboratory on this
project is gratefully acknowledged. The completu ;ooperation of Dr. Ted
Nicholas, AFML/LLN, and full use of the AFML Impact Mechanics Facility were
required to successfully complete this project.
iii
TABLE OF CONTENTS
SECTION PAGE
I INTRODUCTION 1
1.1 Background 1
1.2 The Bird Impact Loading Program 2
II THE TOTAL FORCE IN BIRD IMPACTS 5
2.1 Experimental Techniques 5
2.2 Theoretical Considerations 12
2.3 Experimental Results 15
2.4 Summary 19
III BIRD IMPACT PRESSURES 20
3.1 Experimental Techniques 20
3.2 Theoretical Considerations 23
3.3 Experimental Results 40
3.4 Summary 46
IV EFFECTS OF TARGET COMPLIANCE ON BIRD LOADING 49
4.1 Locally Rigid Windshield Response 50
4.2 Locally Deforming Response 56
V CONCLUSIONS AND RECOMMELDATIONS 70
5.1 Concius ions 70
5.2 Recomwnoidat ions
APPENDIX A
RE1LR1.NCIS
V

LIST OF ILLUSTRATIONS
FIGURE PAGE
1. The breech end of the compressed air driven launcher. 6
2. Typical sabots for bird launching. 7
3. The sabot stripper assembly. 8
4. An x-radiograph of a bird in flight. 9
5. The Hopkinson bar. 10
6. Oblique Hopkinson bar configurations (a) tilted 11(b) sliced.
7. A typical Hopkinson bar strain record. 12
8. Motion of a bird before and after impact. 13
9. Oblique impact effective bird length. 14
10. Nondimensionalized impulse versus impact velocity 15for birds tested.
11. Normalized impact duration versus impact velocity. 16
12. Peak force versus impact velocity. 17
13. Nondimensional rise time versus impact velocity. 18
14. Generalized bird impact force-time profile. 19
15. The AFML/UDRI prezssure plate. 22
16. The ALDC pressure plate and target area. 22
17. A typical bird impact pressure record. 23
18. The phases of bird impact (a) ioitial impact 2S(b) impact decay (c) steady flow (d) termination.
19. The shock pressure for birds6 (gelatin with 2610 percent porosity.)
20. An oblique impact. 27
21. The v;triation of bird impact pressure with impact 27angle. (Gelatin with 10 percent porosity.)
22. Shock and release in a bird impact. 28
23. Zhock release time versus impact velocity for birds 29(Gelatin with 10 percent porosity.)
24. Variation of critical length with impact velocity 31for birds (Gelatin with 10 percent porosity.)
25. Steady state velocity'. 33
vi

LIST OF ILLUSTRATIONS (cont'd)
FIGURE PAGE
26. Normal impact pressure distribution for birds 33(Gelatin with 10 percent porosity.)
27. Oblique impact. 34
28. Oblique impact potential. flow model. 36
29. Pressure coefficient (2P/pv 2 )versus nondimensional 39radius along the major axis of the impact foroblique impacts.
30. Initial impact (Hugoniot) pressures versus impact 41velocity for normal impact.
31. Initial impact (Hugonict) pressures versus impact 42velocity for 450 impacts.
32. Steady flow pressures versus impact velocity at 43center of impact for 900 normal impacts.
33. Steady flow nondimensional pressure distribution 44
for nornkil impacts.
34. Steady flow nondimensional pr,,ssure distribution 45
ilong the malor axis for oblique impact.
35, Steady flow nondimousional pressure distribution 4553long the minor, axis for oblique impact.
36. Nondimen:;;ion4a duration versus impact vwlocity for 47
normal impacts.
37. Locally rigid windshield respo)nse. 49
3u. Locally dforming wind.-0hield r.rponsii. 50
39. The goomettry of a locally rigid impact. 51
40. Nondimo.nkional impact area versus nondimensi.'nal 53consumid length.
41. A locally defo~ming target. 57
42. A Hopkinson tube. so
43. The Hopkinson tube in place. 59
44. Nondimonslonal impulse transfer versus impact 61velocity for normal impact.
45. Nondimensional impact duration versus impact 62velocity for normal impact.
46. Nondimensional peak force versus impact velocity 63for normal impact.
vii

LIST OF ILLUSTRATIONS (cont'd)
FPiCURE PAGE
47. Nond~mensional rise time versus impact velocity 64for normal impact.
48. Rise time divided by the time to peak displacement 64versus impact velocity for normal impact.
49. Impulse transfer versus impact momentum for 65450 imnpacts.
50. Nondimensionalized pulse duration versus impact 66velocity for 450 impacts.
51. Nondimensionalized peak force versus impact velocity 67for 450 imjkict..
52. Non•.dlimensiondal rise time versus impact velocity 68
for 450 impacts.
53. Riso time divided by time to peak displacemwrt 68v--rsus velPkity for 450 impact, s.
viii

SECTION I
INTRODUCTION
Birds and aircraft occupy the same air space and collisions between
the two are inevitable. As aircraft speeds have increased, the severity
and importance of bird/aircraft impact have also increased. As a result,
efforts have been made to reduce the probability of collision by
controlling the movement of birds and by changing the flight paths of
aircraft. These actions can and have reduced the probability of collision
but have not eliminated it. Therefore, the Air Force has initiated programs
designed to increase birdstrike resistance of aircraft and aircraft
components. This report describes a program which was conducted to
establish the loads which birds exert on aircraft transparencies in
collisions. The loads as derived in this program were to be used as input
for the structural analysis computer code of windshield response to bird
impact.
1.1 BACKGROUND
Studies of the hazards presented by bird impact on transparencies date
back to the early 1940's. Since that time the potential damage resulting
from bird/aircraft collisions has greatly increased. This is principally
the result of increased aircraft speeds which results in both increased
energy densities and impulsive forces during the impact process. The
problem has been further aggravated by the introduction of low altitude,
high speed penetration, mission profiles. These flight profiles place the
aircraft in areas of high bird density at speeds approaching or exceeding
the speed of sound. Birdstrikes under these conditions increase the
probability of serious aircraft damage. Such damage may result in an
aborted mission or loss of aircraft.
Since 1966 the U.S. Air Force has lost at least twelve aircraft worth
over $76 million due to bird impacts on transparent enclosures. These
losses include a T-37B with one fatality, three T-38s with two fatalities,
two F-100s with one fatality, and six F-lila with two fatalities. rn
1

addition to the $76 million loss in airframes, an estimated $20 million has
been spent in repair costs during the period 1966 through 1972. Further,
the role of bird impacts in aircraft losses in Southeast Asia is not fully
known.
Numerous efforts are currently underway to make U.S. Air Force air-
craft windshield systems more resistant to bird impacts. In addition, a
number of advanced development programs are being conducted to examine
existing windshield materials and birdstrike resistance windshield system
concepts. It has become apparent from these studies that the technological
base developed during the 1940s, 50s, and early 60s for birdstrike resis-
tance is not adequate. Current improved designs are principally arrived at
with an inefficient and expensive build and test process.
The design of birdstrike resistant transparencies requires a better
and more detailed knowledge of the response of windshields and support
structures to bird impact. The Air Force has initiated an extensive pro-
gram which is designed to apply modern structural analysis techniques to
wiodshield response. With such tools proven and placed at the designers
disposal, the process of obtaining bir.1strike resistant transparency
denigus should become much more efficient.
One of the most important inputs to a structur4. analysis code is the
loading. The loading is particularly important in the analysis of triannient
l0'V1onsje :such a,-- occur.s in bird imp•,ct. To,! program described in this
report was" dtv;igned to suppovt tho .tructural anrilysit taskn by providing,
experimontally obtained and quantified loading input data.
1.2 .1-l: BIRD IMPACT LOADING PROQRAM
The offort to meas,;ur. and characterize the loads erartdl by birds
during impact was begun in January 1974. This work was Jointly sponsored
by the Air rorc Hatverials laboratory and the Air orce rlight Dynamics
Laboratory. The early work was r"portd by Barber, et al. [ In that
phas, of tho ;rogran the basic experim'tneal techniques required to obtain
valid bird impact pr'essure data were developed. Bird launching techniques
were establishcd and te.sted. A technique employing quartz piezoelectric
transducers were- developed for measuring the lmpact pressures. These
transducers we-e exteiasively tested and calibrated to assure the validity
of the results. A preliminary series of birh impact tests were run with
two bird sizes, 50 and 120 grams, investigated. Impacts at norml incidence
2

were conducted at velocities ranging from < 50 m/s to 1300 m/s. The basic
nonsteady fluid dynamic behavior of birds in impact was identified. The
basic characteristics of the pressure records were also identified and
preliminary data reduction, analysis, and correlation were conducted.
The preliminary work reported in Reference 1 established the technique
for measuring pressures and pointed to the need for direct measurements of
the total impact force. Accordingly, the next phase of the program
involved implementation of the Hopkinson bar technique to obtain tctal
force measurements. In addition, the impact pressure measurements were
extended to oblique impacts. Data was obtained at both 450 and 250 impact
obliquity. This work was reported in detail by Peterson and Barber[2]
This report describes the successful development of the Hopkinson bar
technique for total force measurements and reports the first series of
total force results for normal impact. Bird impact pressure data at 450
and 250 was also presented. The reduction and analysis of the pressure
data was significantly improved over the first report. The identification
of a steady flow regime during the impact significantly improved the inter-
pretation of the results. Spatial distribution of the steady flow pressures
was documented.
Peterson and Barber[2] reported the first attempts to quantitatively
reduce and analyze the bird pressure data obtained for large birds at
Arnold Engineering Development Center (AEDC)[3]. This data had many
puzzling characteristics which were quite unlike the AFML/UDRI data.
Attempts to reduce and compare the AEDC data to the AFML/UDRI data were
largely unsuccessful due to the fundamentally different nature of the
pressure records. For example, with few exceptions, no steady pressure
regime could be identified on the AEDC records. Some apparently valid
measurements of total impulse and average pressures were obtained and
these were consistent with the AFML/UDRI results and with the emerging
physical picture of the impact process.
The current effort was designed to extend the work reported in
Reference 2. The Hopkinson bar total force measurements were extended to
oblique impacts at 450 and 250, and to larger birds (600 g). '&ne data base
for total force measurements now covers a range of parameters as follows:
bird masses ranging from 60 g to 600 g; impact velocities from t 100 M/s to
Co0 m/s; and impact obliquities of 900, 450, and 2S5. A careful analysis
3

of this body of data was conducted and the results are documented in this
report.
In the current effort, measurements of impact pressures were extended
to larger birds (600 g) in an effort to establish the size scaling laws of
the impact process. In addition, the AEDC pressure data was once again
reviewed in an attempt to determine the origin of the apparent descrepancies.
The results of this effort are reported in Section III of this report.
All of the testing conducted in this program as described to this
point were conducted on rigid targets. However, aircraft windshields are
not rigid. The compliance of aircraft transparencies varies from almost
rigid to extremely flexible. If this entire range of aircraft transparency
compliances must be accommodated by analytic techniques then the effects
of target motion on impact loading must be known. Therefore, in the
current investigation on a preliminary study of the effects of target
compliance on bird loading was undertaken. The results are reported in
Section IV.
It was recognized early in the program that bird loading data was not
completely satisfactory as input into structural response codes. It isnPecessary to reduce that data or characterize it in a form which is more
n readily amenable to code input. In short, an analytic model of the bird
Simpact process is required. Under the current program the task of
e'tablishing a reliable and verified analytic bird model was begun. This
modeoi is described in a separate report by Ito, et al 4.
This report describes the output of the entire bird loading program
and cortalns substantial portions of the work reported in References 1
and 2. The resuits of all phases of the program are integrated to provide
a single, coherent report.
'
4i
4 1

SECTION II
THE fOTAL FORCE IN BIRD IMPACTS
The total force which a bird exe;,ts dt impact is a very important
parameter. In many cases, the response of ar impacted structure can be
adequately analyzed if the total impact force and its variation with time
are known. In fact, a further simplification is often possible. If the
natural period of th innacted structure is long compared with the duration
ol" the impact, the i,,.pazt may be considered to be an impulsive event. The
only parameter required to adequately analyze the response is the impulse.
Thus, if the variation of the total force with time is known (and the
impulse, which is simply the integral of the force with time) a wide range
of impact structural response problems may be analyzed. Many aircraft
windshield bird collisions fall into this category. Accordingly, an
extensive experimental program was undertaken to measure the total force
exerted by birds at impact. This program was designed to yield information
on the forces that birds excrt and the manner in which those forces vary
with time during impact. The results were cast in a form suitable for use
with structural analysis programs.
This section contains a description of the experimental techniques
used to measure the forces, some theoretical considerations of the forces
and impulses delivered by birds at impact, and finally describes the
experimental results.
2.1 EXPERIMENTAL TECHNIQUES
In order to study the forces exert-d by birds at impact, birds must
first be launched to ve.oelties of inteest. A suitably instrumented
target muat then be constructed and measurements of the forces obtained.
A compressed air launching technique was developed and a Hopkinson bar was
adapted to obtain measurements of the impact force and its variation with
time.
"2.1.1] The Launchur
For experimental Investigations of bird impact, a launch technique
is necessary which: (a) can launch birds of the required mass.at the
S • '• • :• •" ':'• :•' '• •" " :"........... .: ............. . .. .. ; .. . .•' -= ..... . 2 • • •' ;'::'" - '- ' ' ' - ".... .

required velocities; (b) launches the birds with a controlled orientation
(preferably with zero pitch and yaw); (c) does not break-up the bird or
severely distort it prior to impact. A launch technique was developed with
which birds of up to 700 g could be launched to velocities up to 300 m/s.
The launch tube was an 88.9 mm ID, 3.66 m long steel tube. Driving
pressure was supplied by compressed air which was stored in a 0.32 m3 steel
tank. The mdximum driving pressure available was 2.1 MN/m 2 (300 psi). The
compresscd air tank was ccnnectcd to the breech of the gun with a 10 cm ID
flexible ho-:e and quick disconnect coupler. Gas was valved to the launch
tube breech through a quick acting butterfly valve. The breech end of the
gun, together with the flexible coupler and the gas storage tank, ar• shown
in Figure 1.
The birds wcr: pltcd in a 3abot (carrier) for ldunching. The
sabot was an 88.9 mm OD balsa wood cylinder. Balsa wood was employed
because it is lightweight, strong, and relatively inexpensive. A suitable
cavity was machined in the frront of the sabot to accept the bird which was to
be launched. A 38 mm cavity accommodated birds of about 60 g mass, while
the maximum size bird lauuchable in this facility (600 g) required a 76 mml
diameter cavity. A photograph of typical Sabots is shown ill Figure 2.
A.:
GUN BREECH
ligurve .. The' hmeech et%6 of tho comprt'esed air, drive~n launcher.

Figure 2. Typical sabot,- for bird launching.
Phese sabots proved completely' 4atisfackory for launching birds over the
rdnge of s~les and velocitios used in th~is study.
As the sabot represents a sighificant fraction nf the launch mass,
it must be stripped froir the bird before the bird impacts tha target. Ac-
cordingOly, a ýiabot ýtiipper section was attached to the muzzle of the
launcher. The sabot ,itipper tube con,-.Led of an 88.9 ID steel tube with
a seriets of longitudinal slits cut in,-o it. Compression rings were placed
around the outaido of the tube and ID of the tube was progressively redciued.
Whe•n the launch package entered the sabot stripper tube, the sabot was pro-
gresaively decelerated and finally stopped by the tube tap,,r. The bird,
howeve~r, raleziued from the nabot pockqt and continuri1 froe of the sabot to
the target. Vide slots wsre cut in the muvsle of the launuh tube to facil-
itate rapid release of the driving pressure and reduce the forces required
to decelerate and stop the sabot. A photograph of the sabot stripper
assembly Is shown it rigure 3. In orvier to stop the high velocity .ax~ge
bird nabots an extension to the stipper tube is required. The tube could
be extended from its standard length of 3,05 in to a total length of 4.38 mn.
The sabot stripper functioned satisfactorily over the entire range of masses
and velocities which were used in this program.
1 7
Ai-
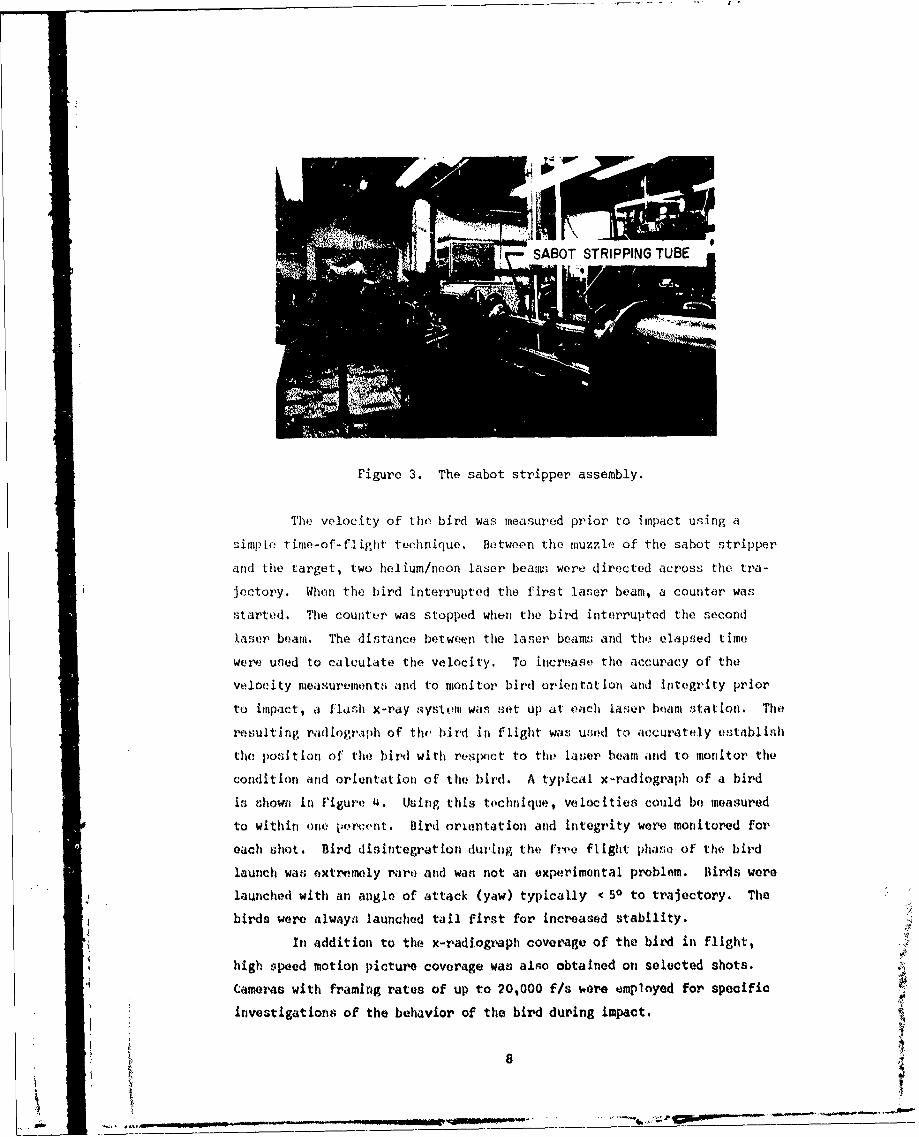
Figure 3. The sabot stripper assembly.
The velocity of the bird was measured prior to impact using a
sirn1pto time-of-flight technique. Between the muzzle of the sabot stripper
arid the target, two helium/neon laser beams were directed across the tra-
Jectory. When the bird interrupted the first laser beam, a counter was
started. Thlt- counter was stopped when the bird interrupted the second
laser beam. The distance botwpezi the laser beam,; and tho elapsed time
wez4- uned to calculate thlt velocity. To increase the accuracy of thlt
velocity meanurviment.s and to mtonitor bird orientation anid Integrity prior
to impact, a flanh x-ray system was ,;et up at each laser boani ,tatiorl. The
re~sulting radiograph of thc bird !n flight wasý used t"' accurately establish
the posit ion of: thlt)bird with respoct to the laser beam arid to monitor the
condition and orientat ion of the bird. A typical x-radiograph of a bird
Is shown in figure 4. Using this technique, velocities could be measured
to within o.ne lic-roont. Bird orien~tation anid integrity were monitored for,
each shot. Bird disintegration duving the frr-e flight phase of the bird
launch was extremely raro anid was not an experimental problem. Birds were
* launched with an angle of attack (yaw) typically <50 to trajectory. The
birds were alwayns launched tail first for increased stability.
In addition to the x-radiogr'aph coverage of the bird in flight,
high speed motion picture coverage was alno obtained oni selected shots.
Cameras with framing rates of up to 20,000 f/s ý,ero employed for specific
investigationg of the behavior of the bird during impact. -

Figure 4. An x-radiograph of a bird in flight.
2.1.2 The Hopkinson Bar
Hopkinson bars have been used over the last fifty years for
measuring force-time histories of impulsive events. The basic concept for
which a Hopkinson bar operates is that a force rapidly applied to the end
of a homogeneous bar of elastic material will generate a stress wave that
propagates along the bar at constant (near sonic) velocity. The stress
wave can be detected at any point along the bar by placing a strain gage
on the bar surface and monitoring the output. The strain-time history is
related to the instantaneous force applied to the end of the bar through
the Young's modulus of the bar material and the cross-sectional area of the,
bar. The force is simply equal to the product of the strain, the modulus,
and the cross-sectional area.
The Hopkinson bar principle was applied to determine the force-time
history of a bird striking a rigid target. The birds were launched against
the end of a long aluminum bar on which strain gages were mounted approxi-
mately ten diameters from the impact end. The resulting strain pulse in
the bar was recorded and related to the force exerted by the impact. The
bar must be sufficiently long to ensure that the entire stress pulse from
the impact is recorded before a refleeted wave from the free end of the bar
can propagate back to the strain gage. Two separate bars were used in this
investigation. For small birds (60 g) a 7.62 cm diameter, 3.66 m long
aluminum bar was employed. Two strain gages were mounted on opposite sides
of the bar, 76 cm from the impact end. For medium size birds (600 g) a
4 9
1. . .'m , ,"= : II "." ..

12.70 cm diameter bar, 4.83 m long with gages 1.25 m from the impacted end
was used. The two gages were connected in opposite sides of a Wheatstone
strain gage bridge for two purposes. This technique adds the output of the
gages, thus doubling the sensitivity of the system. Any bending of the rod
produces compression in one gage and tension in the other. These signals
subtract and the bending signal is rejected. The signals were recorded
with an oscilloscope.
The bar was located on the range by suspending it from the ceiling.
Any perturbations to the strain signals which might be introduced by rigidly
mounting the bar on the range were thus avoided. A photograph of the
Hopkinson bar in place is shown in Figure 5.
Neglecting friction, an impacting bird can only exert forces which
are normal to the impacted surface. For a normal impact on a Hopkinson bar,
the impact force produces a planar strain wave which travels normal to the
bar axis. The force as derived from the strain measurements is, therefore,
exactly equal to the force exerted on the end of the bar. In oblique impact
the situation is somewhat different.
S.2'
......
Figure 5. The Hopkinson bar.
10-g

A Hopkinson bar may be employed to investigate oblique impacts in
one of two different modes. These modes are illustrated in Figure 6. In
the tilted configuration the axis of the bar is tilted with respect to the
trajectory of the bird. The impact forces are exerted normal to the surface
of the end of the bar. As the end of the bar is perpendicular to the axis
of the bar, the resulting strain wave propagates up the bar. The force
derived from the strain measurements is exactly equal to the force exerted
on the end of the bar.
When a sliced Hopkinson bar is employed to investigate oblique
impacts, the force exerted by the impact is not directed along the axis of
the bar. Only the component of the force which is parallel to the axis of
the bar is detected by the strain gages. Both tilted and sliced bars were
used in this study. The results from both configurations agree when they
are appropriately reduced and analyzed.
TITED
SLICED
Figure 6. Oblique Hopkinson bar configurations (a) tilted (b) sliced.
S...-• ., • • . , . "r....I ..r T • •...•"' • •l .l•• • n - - ,•-• ••

A typical strain-time record is shown in Figure 7. The initial
strain signal and the first two reflected signals are clearly visible. Only
the primary strain signal was of interest.
SWITCH STRAIN REFLECTEDCLOSURE SIGNAL STRAIN
SIGNAL
Figure 7. A typical Hopkinson bar strain record.
2.2 THEORETICAL CONSIDERATIONS
It is informative to consider some simple, theoretical results con-
cerning impulse transfer, impact durations, and average forces in bird
impacts. Knowledge of these qualities assists in the reduction and inter-
pretation of experimental data.
2.2.1 Momentum Transfer
Assuming that a bird is essentially a fluid body, the motion of the
bird before and after impact is illustrated in Figure 8. Tho. initial momen-
tum of the bird along trajactory is simply my, where m is the mass of the
bird and v is the initial impact velocity of the bird. The momentum of the
bird along trajectory after impact is zero as the bird has only radial
velocity. Therefore, the momentum transferred to the target during the
impact is simply equal to my. This simple picture may be easily extended
to oblique impacts by noting that only the component of momentum normal to
the impact surface is transferred to the target durtng the impact. There-
fore, the momentum transfer, or impulse, I, is given by
Smv sinO, (1)
12

BEFORE IMPACT AFTER IMPACT
Vr
V 4V7
Figure 8. Motion of a bird before and after impact.
where 0 is the angle between trajectory and the surface of the target.
Equation (1) is an expression for the momentum transfer or impulse imparted
to a target during impact if the bird were a fluid body and the target were
completely rigid.
2.2.2 Impact Duration
If the bird is assumed to be a fluid body, the Impact begins when
the leading edge of the bird first touches the target. The impacýt con-
tinues until the trailing edge reaches the target and there Is no furt"(11
bird material flowing onto the target. If the bird does not decelerate
during impact, then this "tsquash-up time". T., is given by
/S (2)
where L is the length of the bird. In an oblique impact the situation is
different an illustrated in Figure 9. The sffectiv leti,.th of the bird is
now somewhat longer than the "straight" length of the bird, w. If the bird
were a right circular cylinder, as illustrated in oigure 9, the effective
length, La, would be given by
Leff Z + wdtanu0 (3)
13
-D - *. I -i • m|IlI•m.HS emi~

ioff keff
Figure 9. Oblique impact effective bird length.
where d is the diameter of the bird. A real bird is more nearly an oblate
spheroid, in which case the effective length is less than that given by
Equation (3). However, when the straight length is replaced by the effec-
tive length in Equation (2), a reasonable estimate of thzý pulse duration
for an oblique impact is obtained.
2.2.3 Average Impact Force
Continuing the consideration of a fluid bird impact, both the momen-
tumn transfer and the duration have now been defined. With thse two
quantities it is posaible to calculate the average impact force. Vie
average force is given by the momentum transfer, Equation (1j,. divided by
the duration
F avg mV2 (sin 0) tff (4)
The three quantities derived in this section, impulse, impact dura-
tion, and average impact force, are logical parameters with which to compare
measured values and with which measured values can be nondimensiooalizod,:
or scaled, for presentation.
2.3 EXPERIMENTAL RESULTS
Impact experiments on flopkinson bars were conducted over a wide range
of bird impact .parameters. Bird mass was varied from 60 go to 600 q. Impact
velocity was varied from 50 m/s to 300 m/s. Threp imp-act angles wore
investiqated-, 90 (normal), 45o, and 250. strain-tioo records were obtained
for each impact. The strain-tima,-records were converted to forco-tiJme:
I4
V ~ m•m•m, •• •|•••• .,.m'm •'''"-'•M•••t'

records and from these records peak force, impact duration, and the rise
time (time to reach peak force) were measured. In addition, the records
were digitized and numerically integrated to provide data on momentum
transfer or impulse. Details of the results are presented in the following
sections.
2.3.1 Momentum Transfer
The momentum transfer or impulse which is determined by integrating
the force-time records is compared to the momentum transfer as calculated
in Section 2.2, Equation (1). The results are displayed in Figure 10.
Figure 10 clearly demonstrates that Equation (1) contains all the essential
characteristics of the momentum transfer. The equation properly scales for
bird size, impact velocity, and impact angle. Birds appear to behave
essentially as a fluid body. There is no evidence that birQa bounce at any
velocity (which would imply an impulse greater than the expected momentum
transfer).
ESi,2
S1.a0tL 0
1.0 0
0. 0_q O0 £ o:~
g.8 i 60g 0 Ao 0 0
I & •a- 9o0180 - 450
00 50 100 150 200 250 300 350
"IMPACT VELOCITY (mis)
Figure 10. Nondimenslonalized impulse versus impact velocity for birds
tested.
• •!ii"}1$

2.3.2 Impact Duration
Impact durations were measured for most of the tests made. The
impact duration was nondimensionalized to the "squash-up" time as given by
Equations (2) and (3), and the results are displayed in Figure 11. From
Figure 11 it is apparent that Equations (2) and (3) adequately describe the
impact duration over a wide range of impact parameters. These expressions
proper.ly account for bird dimensions and impact velocities. The impact
duration appears to scale linearly with size. The oblique impact results
show a tendency for the measured duration to be less than the predicted
"squash-up" time. This is due to the expression used to calculate the
effective "squash-up" time, Equation (3) , which assumes a right circular
cylindrical shape. As birds are oblate spheroids, the effective length and"squash-up" time will be somewhat less than this value.
2.3.3 Peak Impact Force
The peak force recorded during each impact was evaluated and
normalized to tht average force as calculated f-om Equation (4). The
resiults ar* displayed In Figure 12. There is considerable scattMr in the
1.4
1.0
4W 600a~ 6095Z & o
4 0 10f I I 45"1*•
0 2504 . 0
0 50 100 15o 200 250 300 380IMPACT Vi.OCITY (m/s)
figure 11. Nomalized impact duration ver'sua Impact velocity.
_ _ _ _i i#ia

3.2
I" 0
E 2.8
L.96
U*U0 2.44
0Ls,
0~042.0 O o
0
z (900W 01.60 0 00Z60°0 60,• cIJ 4 0 0z ERDS DRA
A & -9001.2 a 0 -45 0
0 - 25°1
00 50 t00 150 200 250 300 350
IMPACT VELOCITY (m/0)
ftigu ve 12 . P oak fo mft v qvsu , IMPa t ~ lo~tit li
data 'v•4 thin probahky rop'nts Nial vartiation In the fortte eertd by
blr4ln 4t 4u4ct. The variation could be dude to bilt •dhae bir'd wtotalpropities, and bird oriontation at iswact. The data appv~arg to fall from
a valuo of about 2 (e.g., the peak force Is twice the average force) at100 h/n to a value of about 1.6 at 300 m/s. Thetv deo• not appear to be atfy
sigififcant difference botween the 60 g birHst and the 600 g birds. Theaverage force, as dtermined from Equation (4), apears to be a good not-
dimensioialiing parameter. A value of 2.0 leads to a nimple "triangular"force-time dintribution, in consistent within the data oaettet, and repre-
sents a good "average" value.
2.3.4 Imýpact Rise' TimeThe inqact rise time vas taken to be the tie fr*m the beginning of
impact until peak force vans feaahed. 1hs value was measured for all impacts
17

and normalized to the "squash-up" time as derived from Equations (2) and
(3). The results are displayed in Figure 13. There is a great deal of
scatter in the data. This scatter is once again attributed to real varia-
tion in bird impacts. There do not appear to be any significant trends in
the data. The oblique impact cases produce slightly lower values of rise
time. However, the enormous scatter makes any firm conclusion questionable.
The "squash-up" time appe-ars to be a reasonable nondimensionalizing quantity
for the rise time. Although the scatter in the data is great, a reasonable
average value to use ,r thA nondimensional rise time is 0.2.
2.4 SUMMARY
The experimental results displayed in Section 2.3 clearly show that
the nondimensionalizing quantities derived in Section 2.2 are valid quan-
tidies with which to describe the forces generated by birds at impact. A
generalized force-time bird impact profile is displayed in Figure 14. This
generalized profile is consistent with the data and properly accounts for
bird mass, bird size, impact velocity, and impact obliquity,
.8600g 60g
BI1RDS B31RDS45*
.6 25
W
1 _j
0 & 0 .0?
W 50I00 0 O 00 50 a& 00 )0:
0 J
50 100 150 200 250 .300 350
IMPACT VELOOTY (rol)
Figuaro 13. Nondiniensional rise tinma versus impact velocity.
18 --

c 2.0
LL>LE
0
~j1.0
Z
w
z 00 Q~2 OA 0.6 0.8 1.0
N0NDIMENSI0NAL TIME, *s 4of
Figure 14. Generalized bird impact force-time profile.
4o
1219Ig

SECTION III
BIRD IMPACT PRESSURES
To fully understand and analyze some aspects of windshield response
to bird impact it is necessary to have more detailed knowledge of the
impact loading process. In particular, the spatial distribution of the
impact forces must be known. An experimental program was, therefore,
undertaken to measure the spatial and temporal distribution of the pressures
exerted on a rigid target during a bird impact. Pressure data was collected
for a wide range of impact parameters. Bird masses ranging from 60 g to
over 4 kg were employed. Velocities ranging from <100 to n, 300 m/s were
investigated. Impact obliquities of 900, 450, and 250 were studies. The
data was collected, reduced, and analyzed, and is presented in this section.
3.1 EXPERIMENTAL TECHNIQUESMost of the experimental work reported in this section was conducted
at the AFML/UDRI facili.ties at Wright-Patterson Air Force Base. For bird
"sizes of over 1 kg the testing was conducted at Arnold Engineering Develop-
ment Center (AEDC) in Tullahoma, Tennessee.
3.1.1 Bird Launching
The AFML/UDRI bird launching facility, described in Section 2.1,
was also employed for the pressure testing. The launch technique, velocity,
measuret -nt, and bird observation techniques were identical to those used
fi•' the to*al force measurements.
The .'ýC facility employs very similar techniques for,' launching
birds. They used a compressed gas launch technique and place the birds in
a balsa wood sabot. The sabot is stripped from the bird in a converging
tube stripper. The AEDC facility is an outdoor facility. The most signi-
ficantly different feature between the AEDC facility and the AFML/UDRI
facility is the very long free flight of the bird from the sabot stripper
muzzle to the target at AEDC. To prevent the birds from being unacceptably
,, altered by the high aerodynamic forces during free flight, the birds are
placed in light nylon bags. The long free flight of the bird also k20
-. 4. ..,

introduces uncontrollable pitch and yaw in bird orientation at the target.
The presence of pitch and yaw at impact has proved extremely difficult
to account for in data analysis. The effect of bagging the birds is
unknown, but is assumed to have negligible effect on impact pressures. The
AEDC facility is described in much greater detail in Reference 3.
3.1.2 Pressure Measurement
The measurement of impact pressures presents a number of diffi-
culties. The impact shock pressures can be extremely high (several
hundred MN/m 2 ). The pressure sensing device must be capable of measuring
and withstanding these high pressures. The duration of the impact is
relatively short (hundredths of ps) and there could be important transient
pressure excursions. The pressure sensing and recording system must,
therefore, have adequate bandwidth to detect and record important pressure
transients.
A commercially available piezoelectric quartz pressure transducer
was selected as the basic sensing device. These transducers employ a
compact impedance converter physically located in the coaxial line close
to the crystal. Since these transducers are not designed for impact
testing, considerable experimentation and calibration was necessary to
verify their operation. A calibration method for the transducers was
developed to verify the applicability of the manufacturer's calibration data
to the unidirectional axil loads anticipatedilJ. A device was fabricated
to enable the unidirectional axial loads similar to bird/plate impact loads
to be applied to the transducer. Measurements were taken to determine the
response of the transducers. It was concluded that the transducers pro-
vided reliable, accurate, pressure data over the range of pressures and
frequencies expected. The transducers have a specified pressure range of
0 to 700 MN/m 2 , and a specified bandwidth from 0 to 100 kHz. The trans-
ducers were mounted in a heavy steel plate. They were mounted such that
the sensing surface of the transducers was flush with the surface of the
plate. Birds were then impacted on the plate in such a manner that the
jI • transducers were directly struck by the bird. A photograph of the AFML/
UDRI pressure plate is displayed in Figure 15. Up to eight transducers
were mounted in this plate. The pressure signals were recorded on both
oscilloscopes and an TN tape recorder.
- I2
• • 21

-'k PRESSURE TRANSDUCER PLATEi '
B 'STA INLESS ST EE LTARGET TANK
Figure 15. The AFML/UDRI pressure plate.
A photograph of the AEDC pressure plate and target area is dis-
played in Figure 16. This target plate was 76 cm square and 10 cm thick.
Up to 29 pressure transducers could be mounted in the plate. The pressure
signals were recorded on FM tape recorders.
MTIPPER TUBE
tARETPLATE
.... ....
, •.Figure 16. The AEDC pressure plate and target aroa.
I 22~'K
v
.A4

4
The data from both facilities was collected at UDRI where it was
reduced and analyzed. A typical pressure trace from the UDRI facility is
displayed in Figure 17.
3.2 THEORETICAL CONSIDERATIONS
In order to facilitate reduction and analysis of the large body of
data collected, a theoretical description of bird impact was undertaken.
This analysis was not intended to provide a rigorous description of bird
impact, but rather to provide theoretical guidance to the experiments and
data reduction process. A parallel effort discussed in detail by Ito,
et al treats in greater detail the more rigorous problem of analytical
modeling.
To develop a theoretical description of the impacts, the physical
phenomena which control the process must be identified or postulated. The
impact of a bird on a rigid plate was assumed to be a nonsteady fluid dynamic
process. The entire impact may then be divided into four phases. The
first phase is the initial impact phase in which very high shock pressures
are generated between the bird and the target. The release of this shocked
material results in a decaying pressure. The pressure dncays until the
third phase of the impact is reached. During this phase the bird flows
Shot No. 6049; Chicken mass 0.475 kg; Velocity 253 m/s;Horizontal scale 200 vs/cm; Upper trace 12.7 mm off-center with 15.1 MN/m 2 /cm vertical scale; Lower traceon center with 56.1 MN/m 2 /cm vertical scale.
Figure 17. A typical bird impact pressure record.
23

steadily onto the plate. This part of the process might be regarded as jet
flow. The final phase of the impact occurs as the trailing end of the bird
approaches the plate and the pressures once again fall to zero. These
various phases are illustrated in Figure 18 and are described in some
detail in the following paragraphs.
3.2.1 Initial Impact Phase
When a bird impacts a target plate, the particles at the front
surface of the projectile (bird) are instantaneously brought to rest
relative to the target face and a shock propagates into the bird as shown
in Figure 18. As the shock wave propagates into the bird it brings the
bird material behind the shock to rest. The pressure in the shock
compressed region is initially very high and is uniform across the impact
area. The edge of the projectile is a free surface and the material near
the edge is subjected to a very high stress gradient. This stress gradient
causes the material to accelerate radially outward and a release wave is
formed. The arrival of this release wave at the center of the bird marks
the end of the initial impact and the beginning of the decay process.
3.2.1.1 Normal Impact
For the normal impact of a cylinder on a rigid plate, the flow
across a shock can be considered one-dimensional, adiabatic, and irrever-
sible. The pressure behind the shock may then be derived from the shock
relation as
P = PVsV ,v(5)
where p is the density of the bird, v5 is the shock velocity, and v is the
impact velocity. The shock pressure, therefore, depends not only on the
impact velocity, but also on the shock velocity (which is, in general, a
function of the impact velocity) and the bird density.
The density of both small birds (60 g) and medium birds (600 g)
was measured. The birds were accurately weighed, then immersed in water to
determine the displaced volume. Detergent was added to the water to faci-
litate total wetting of the bird and elimination of bubbles trapped in the
feathers. The density of the birds (chickens) was found to be 0.95
±0.02 g/cm3 . There was no significant difference between the density of
the 60 g birds and the density of the 600 g birds.
24
!p

vs RELEASE
(b) SHOCK
STAGNATIONPOINT
4('
4
Figure 18. The phases of bird impact (a) initial impact (b) impact decay(c) steady flow (d) termination.
25
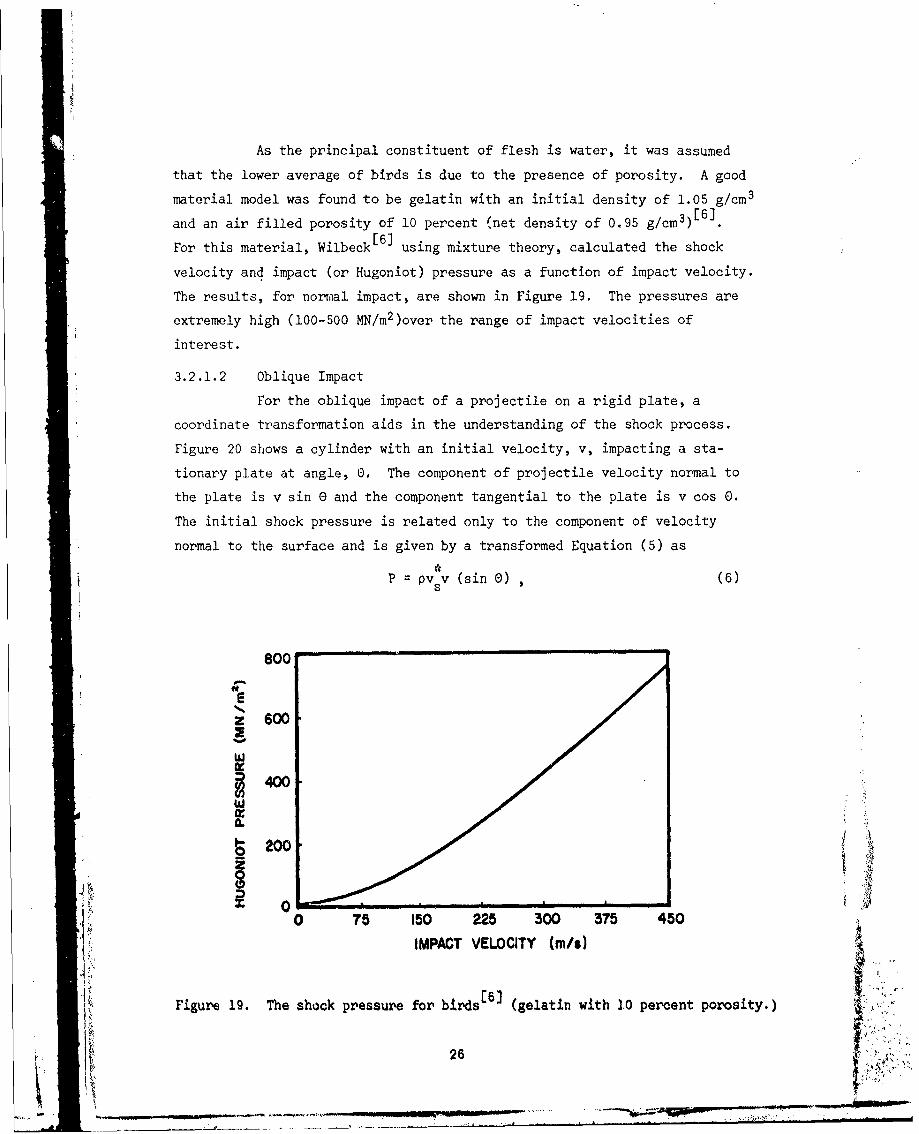
As the principal constituent of flesh is water, it was assumed
that the lower average of birds is due to the presence of porosity. A good
material model was found to be gelatin with an initial density of 1.05 g/cm3
and an air filled porosity of 10 percent (net density of 0.95 g/cm3 )[6].
For this material, Wilbeck [6] using mixture theory, calculated the shock
velocity and impact (or Hugoniot) pressure as a function of impact velocity.
The results, for noriial impact, are shown in Figure 19. The pressures are
extremely high (100-500 MN/m 2 )over the range of impact velocities of
interest.
3.2.1.2 Oblique Impact
For the oblique impact of a projectile on a rigid plate, a
coordinate transformation aids in the understanding of the shock process.
Figure 20 shows a cylinder with an initial velocity, v, impacting a sta-
tionary plate at angle, 0. The component of projectile velocity normal to
the plate is v sin G and the component tangential to the plate is v cos 0.
The initial shock pressure is related only to the component of velocity
normal to the surface and is given by a transformed Equation (5) as
P pv v (sin 0) , (6)
Boo
z 6001
w
II
200z
00 75 150 225 300 375 450
IMPACT VELOCITY (mWs)
Figure 19. The shock pressure for birds[6 (gelatin with 10 percent porosity.)
26
.__ _ _ _w_ L

V coSO
Figure 20. An oblique impact.
where v is the shock velocity corresponding to an impact velocity of
v sin 0. Because the shock velocity is a relatively strong function of the
impact (normal) velocity, the shock pressure does not vary exactly as sin 0.
The shock pressures for gelatin with 10 percent porosity at 450 and 250 were
determined by Wilbeck[6 1 and are shown in Figure 21.
3.2.2 Impact Pressure Decay
At initial impact a shock begins to propagate into the projectile
and radial release waves propagate in towards the center from the free
surface edges of the bird as shown in Figure 18 (b). The problem can no
longer be considered to be one-dimensional in nature. For the normal impact
of a cylinder, the problem is two-dimensional and axi-symmetric.
Figure 22 shows the release regime for impact of a cylinder with an
original length to diameter ratio of 2. Figure 22 (b) illustrates the
projectile Just after impact. The pressure at point B is given by Equation
(5). Figure 22 (c) shows when the release waves have converged at point B,
the center of impact. Tho pressure on the target at the C nter of impact
now begins to decay. Figure 22 (d) shows when the release waves have con-
verged at the center of the shock, and a region of fully shocked materialno longer exists. The curvature of the shock is due to the release process,
which has weakened the shock more at the edges than at the center.
The duration of the full shock pressure, Equation (5), at the
center of impact is given by the time that it takes thQ initial release
27'
! •~

300 900
Z 250 450
~200-w
0. 25*
100.
50
0
0 50 100 150 200 250 300IMPACT VELOCITY (m/s)
Figure 21. The variation of bird impact pressure with impact angle. (Gela-tin with 10 percent porosity).
U*
C
(a) (b) B A
a A
(a) 2 A (d) A
F'igure 22. Shock and release in a bird impact.
28
-'. ,

wave to reach the center. The release wave is a fan of weak expansion
waves and can be considered isentropic. Thus, the velocity of the initial
re]ease wave is equal to the speed of sound in the shocked material, c
The expression for the time necessary for the release wave to reach the
center of impact is
tr = a/cr, (7)
where a is the initial radius of the cylinder. Wilbeck[6 has calculated
cr for gelatin with 10 percent porosity as a function of the impact velo-
city. Using these value5 he calculated the initial release time using
Equation (7). Figure 23 shows the relationship between t and the impactr
velocity, v, for cylindrical projectiles of various radii.
Another important time is the time at which the release wave front
converges at the center of the shock wave. Since the wave speed in the
fully shocked medium is always greater than the shock speed, the release
wave will interact with progressively more of the shock as the impact con-
tinues, Figure 22 (d) shows the condition in which the release wave front
has just converged on point C, the center of the shock, After this time,
the pressure in the region behind the shock will rapidly decay and the
20F[
1 L
3 M1I0
50 0 tO0 150 200 250 300ViPACT VELOOTY (m/*)
Figure 23, Shock release time veo-su, impact velocity for birds (gelatinwith 10 percent porosity).
29
t- N

shock will be weakened. This time, t , may be derived from geometric con-
siderations. In order for the release wave starting at point A to intersect
the shock at point C, it must travel a radial distance, a, and an axial
distance equal to the axial distance traveled by the shock. At the time of
intersection, the shock has propagated a distance
xs -= (vs - v) tc
where (v - v) is the velocity of the shock relative to the target, There-s
fore, the release waves have traveled a distance
x= (x 2 + a2)I1/2.r s
The release wave travel time, to, is given by
tc x r /C r*
By substituting and rearranging we obtain
tatc 1Clv---vy)/2.r S
'rom Equation (8) an expression can be derived for the critical
projectile length, I c which is the length for which the radial release
wave wi,.. just intersect the shock axis, (point C), as the shock reaches the
end of the projectile
t VStc (9)
2ombining Equations (8) and (9) and nondimensionalizing to the bird diameter
we obtain
*+(Lid) .1/2(C 2 ( - (v -v) 2 )r
30Si,-.
: +

For a projectile with an kid > (£id) 0 , the shock will be severely weakened
by the release waves prior to reaching the projectile end and the reflection
will be greatly reduced or eliminated.
Wilbeck [6] calculated (£/d)c for gelatin with 10 percent porosity
and Figure 24 shows a plot of the results. For a projectile of sufficient
length, steady flow should be set up after several reflections of the
radial release waves. A projectile with a length somewhat greater than t.c
should undergo complete shock decay to steady flow. As birds have an £/d
of about 2 to 3, a steady flow region is expected to exist. A longer
steady flow regime is expected at low velocities than at high velocities.
The details of pressure variation with time during the decay pro-
cess are extremely difficult to predict. In addition to the geometrical
complexities, complete shock release material prope-rties for the bird must
be known. These are not currently available and would probably be difficult
to obtain. Finite difference modelling of the process as rcported by Ito,
et al.•] is the most promising overall approach to properly modelling the
decay process.
Oblique impact effect:s further complicate the detailF of the
rIease process. Howvver, the decay times, as calculated for toimal impacts,
will be nearly the stame.
0.4
zW Q2
-J
00 50 too 150 200 250 300
IMPACT VELOCITY (m/s)
'iigae 24. Variation of critical lengtht with itact velocity for birds(Gelatin with 10 perent porosity).
31

3.2.3 Steady Flow
As the radial pressures decrease during the shock pressure decay,
shear stresses develop in the projectile material. If the shear strength
of the material is sufficient to withstand these shear stresses, the radial
motion of the projectile will be restricted. If, however, the shear stresses
in the projectile are greater than the shear strength of the material, the
material will "flow". The shear strength of birds is so low that the
pressures generated are usually sufficient to cause flow. The bird can be
considered to behave as a fluid. After several reflections of the release
waves, a condition of steady flow is established and steady pressure and
velocity fields are established.
3.2.3.1 Normal Impact
During the release phase, the shock .:. weakened by the release
waves. For a subsonic impact, the shock wave will be ultimately eliminated
by the release. In a supersonic impact the shock wave will not disappear.
The shock propagation velocity will decrease until it becomes equal to the
impact vtlocity (a standing shock). Behind this standing shock, the flow
will be subsonic and will follow steady flow streamlines. The velocity and
pressure fields in the fluid will be quite different for the two cases.
The prEsence of porosity in birds results in a very low sonic velocity
(40 m/s for gelatin with 10 percent porosity). Bird impacts are., therefore,
most probably supersonic.
Using potential flow tbeory, Wilbeck[6] calculated the steady
flow pressure for a supersonic bird impact at normal incidence.. The results
are displayed in Figure 25. He found that the pressure at the center of
impact (the stagnation pressure) could be approxim;ately given by the
expression
P PoV2'
20
where p is the density of the material with zero po ,uoy. This implies
that the steady flow pressure at the center of impact is almost independent.
of porosity. The decrease in density due to porosity is apparently offset
by the incrase in ccmpressibility.S•Wilbeck[6 also calculated tlie radial distributioil of. pressure
for a normal supersonic impact. The results for gelatin with 10 percent
32I ___-.-..___

40
6Ez2- 30
Wa::D
0: 20
1-
0 50 100 150 200 250 500IMPACT VELOCITY (m/s)
Figure 25. Steady state velocity.
! ~are shown in Figure 26. Tihe pr'essure Is nondimensionalized by dividing by
S~the steady flow pressure for, an incompressible fluid, 1/ pv2, and the radial
42
distance from the center, rj iv• nondimensionalized by dividing by the
r~adius of the projectile, a,
0.8
40.4
U))
00
0 50 o 005 ILO 20 20
NNIMENSAC RADOITS (m/a)
sFigurw 26i ioreal impact pressure idstnribton fo a birid (boyatin bithy
dista10 pohcent pori•osity), dli
S•, ~~33 •..
raisofteprjcila

The equation which describes this distribution is
P/P = exp (- 8(r/a) 2 ) , (12)
where Ps is the stagnation pressure and a = 2P s/pv2 . From Equation (11) it
is apparent that ý 1v p /p where po = 1.05 g/cm3 .
3.2.3.2 Oblique Impact
Figure 27 shows the steady flow of an oblique impact of a
cylinder of fluid on a rigid plate. From momentum considerations it can be
seen that the majority of fluid will flow "downstream" on the obtuse side
of the impact. The staignation point shifts "upstream" to the acute side of
the center of impact. As long as a stagnation point exists, the full stag-
nation pressure will occur as given by Equation (11). The maximum pressure
generated during steady flow will, therefore, be independent of the angle of
impact. However, the distribution of pressure over the surface will. be
greatly dependent on the impact angle.
Sc-MAJOR AXIS
! ~MINOR AXIS
-l&ue 27, Oblique impact.
34-
W.c

The distribution of pressure in an oblique cylindrical impact is
difficult to analyze as it is a three-dimensional fluid dynamic problem.
A number of authors have treated the two-dimensional case of the oblique[7,8,911 [10]
impact of a sheet[' . Taylor also did some experimental investi-
gations of flow in an oblique cylindrical jet. However, no satisfactory
description of oblique jet pressures was found in the literature. Thus,
an analytic investigation of oblique jet flow was undertaken as a part of
this program.
Three-dimensional potential flow theory was used to develop a
model for predicting the pressure distribution produced by the steady flow
of a cylindrical jet impacting on a flat plate. It was assumed that the
pressure distribution, as calculated for this fluid dynamic problem, would
provide a reasonable description of the steady flow portion of a bird
impact. Assumptions were made that the flow could be treated as iLcompres-sible and irrotational. These assumptions are supported by the fact that
(1) the steady state pr-'essures measured in the experiments are small in
comparison to the pressures required to produce significant density changes
in water and, (2) the time over which the steady flow exists is small in
comparison to the time required to establish strong vorticity in the flow.
It should be noted that the steady flow portion of a bird impact is ideally
suited.for modelling by potential flow theory because there is no entrain-
ment of surrounding fluid.
The model was based on superposition of two elementary solutions
to the Laplace equation
which is the governing equation for steady, incompressible, irrotational
flow. The two elenmentary solutions used were; (1) the uniform flow of a
fluid in a round duct and, (2) the uniform distribution of planar sources
over an elliptical area. The coordinate system used to model the flow is
shown in rigure 28. Let (0, n, 4) represent the coordinates of the loca-
"tion of a point source in the y-z plane. The velocity components induced
by this source are given by
4
35:
"
3•i. . "'•5

V
Ly
UNIFORM DISTRIBUTION OF SOURCES
00X
%% %
"" U. (UNIFORM FLOW)
"4 (UAz2 +(y sin8)2
Ua,cose
SECTION A-A
Figure 28. Oblique impact potential flow model.
U x 3/241 = [xV + (y-0)1 + (Z-04 3/2
(X-0 ]3/2W x + (y-n) - (z-0)' )
41
'where q Is the strength of the source. The velocity field induced by auniform surface distribution of sources- in the y-z plane of strength
q" per unit area is given
36I44

i T
_ qX, , ,)2 2 dindý ,21/
(vXY,) q1 -n) dndý (17)v (xyz) - 2 (y_n)2 + (z_ )213/ 2
1 1
• q,, r% •2 ((z- ) drldw (x,yz) x2 + (y-n) 2 +3/2
SI1 1
C [x2 + (y-n)2 + (z-t;)2]3/
Integration of the above three equations over the elliptical area bounded
by
y2 (Lsin e) 2
11 ~aT
('the projection of the jet on the plane) cannot be carried out in closed
form. They can be integrated over rectangular areas, however. Therefore,
the procedure used was to approximate the elliptical source area by square
sources and then sum the solutions of all the squares. The velocity field
induced by the uniform distribution of sources over a rectangular element
whose comers are located at (n ,1 4), (n I, 2), (n ,2 2), and (2 ,• ) in the
y-z plane is given by the following expressions (page 12 of Reference 12);
4u (xyz) t tan 2 2 + tan ( (( C (Y T (. ( -
2 4
"37

-,(xy,) =- r4 + (- 2 Z)] [r 2 + -,)
w(Xsy,)z) = .~.in~j [ 4 r3 + - )1+ (n+ -y)] r +0
w ( x ,y , z ) = f o a n y p oi n t o n t re
where r1 = x2 + (Y-nl)2 + (Z-l) r r2 = (Y-n22 +
2 (
r, = x2 + (,-n2)2 + (z.-C2) anda r4 x • +(_nl) + (z._•2)
These equations exhibit a characteristic which permits a relatively simple
approach to the solution as follows;
u(O,y,z) = q" for any point on the rectangular surface area
and
u (O,y,z) = 0 for any point not on the rectangular surface area.
In order that the y-z plane represent a surfaoe across which no mass flows,
that is, a flat plate, the round jet flow and the flow due to the sources
on all the square elements (whosc sum approximates the elliptical area)
must be superimposed such that iý is zerc, or y-z plane. This condition is
satisfied by setting thN strength of the surface distribution, q", over
each square element equal to
qtI =2 U. sin .
With the surface -'ource strength per unit area so chosen, the U-component
of velocity is identically zero over the entire y-z plane at x = 0. The
V-component of velocity of the superimposed flow in the y-z plane at x 0
over the elliptical area ij given by
V® sinGe Vk (0,y,z),V (O,y,z) U. cosO+ 2 . k
2w k
38

where the summation is taken over each of the square areas comprising the
elliptical area. The W-component of velocity of the superimposed flow in
the y-z plane at x = 0 is given by
U sin 0W (Osyz) -c 27r W k (O,y,z)
k
The pressure on the plate over the elliptical area is then given by
Bernoulli's equation,
p (O,y,z) = p + I C { [V (O,y,z)]2 + EW (O,y,z)]2}.2
Since p. is atmospheric pressure, Bernoulli's equation can be written in
terms of a pressure coefficient (equivalent to the nondimensionalized
pressure) cp, as
P-P. 1 JV2 W (17)c p 1 -U2 "U (17)
122
A computer program was written to calculate the pressure coefficient. A
listing is contained in Appendix A. Figure 29 shows the variation of the
pressure coefficient calculated along the major axis of the elliptical
impact area and plotted as a function of r, the projection of y in the y-z
plane at x = 0 onto a plane perpendicular to the axis of the jet, (i.e.
r = y sin 0). The pressure coefficient at any .->lnt on the surface can be
readily calculated. Since the model does not contain the vorticity which
undoubtedly occurs, it does not reliably predict coefficients near the
boundary of the jet (y = a/sin 0). However, over the central portion of
the jet the predictions should be reasonably accurate.
3.2.4 Flow Termination
During impact, bird material is "turned" near the target surface.
As the fluid nears the target surface the velocity decreases and the local
pressure increases. During steady flow a preshure field is set up in the
K39
"" I....

1.00
0.0 0.750750
zi 0.060C,,-,
C,.,
,7 " 4 5 0
w -0250
-0
0.8 -0.4 0 04 08NONDIMENSIONAL RADIUS
S-Q22
Figue 2. Prssue coffiient (2P/pv ) versus nondimensional radiusalong the major axis of the impact for oblique impacts.
fluid. As the end of the projectile enters this pressure field, the field
is disrupted due to the intrusion of a free surface (the end of the bird).
Steady flow no longer exists and the pressures at the impact surface
decrease. The pressure decrease continues until the end of the projectile
reaches the surface of the plate. At this time the impact event is ended.
The total duration of the impact is given by the expression T I/vo as
was found in Section II for impact forces.
3.3 EXPERIMENTAL RESULTS
Over sixty bird impact pressure data shots with 60 g birds and over
fifty shots with 600 g birds were obtained at the AFML/UDRI facility.
SNormal (900), 450, and 250 impacts were obtained. Over seventy impacts
were made with birds on the pressure plate at the AEDC facility. These
birds ranged in mass from approximately 1 kog to approximately 4 kg. Of
these latter shots, approximately ten provided useful quantitative
40
: decase.T hepesredces cniusunffh edo h poetl

information. A lack of control over bird orientation at impact precluded
meaningful interpretation of the remaining data shots.
All the data was collected together at the AFML/UDRI facility where it
was reduced and analyzed. Measurements of peak pressure, steady flow
pressure, and pulse duration were obtained from the records. The results
of these measurements, together with comparisons to the theoretical results
derived in Section 3.2, are presented in the following sections.
3.3.1 Initial Impact Pressures
In Section 3.2.1 it was pointed out that the highest pressures
generated during the impact should occur during the initial stages of the
impact. The pressure should rise to the impact, or Hugoniot, pressure.
This pressure was calculated by Wilbeck[6] using a bird model consisting of
gelatin with 10 percent porosity and is shown in Figure 30. The initial
impact pressures agree very well with the calculated pressure for large
birds (i.e., 4 kg). However, the results for small birds show significant
departures from predictior. The discrepancy appears to increase withdecreasing bird size.
300
US250
200
C. 0 EXPERIMENTAL
1 0 DATA0- 4.OkgO- 2Dkg
z 5 0 4- 1.0kg050 -05kg
SN- 0.lkg
00 100 200 300
IMPACT VELOCITY (m/s)
Figure 30. Initial impact (Hugoniot) pressures versus impact velocity forI normal impact.
41
...... .

As pointed out in Section 3.2.1, the duration of the shock pressure
is directly proportional to the bird diameter or radius. Therefore, larger
birds produce high pressures for longer duration than do small birds. The
limited bandwidth of the transducers (100 kHz) results in a significant
attenuation of the measured signal. for the short pulse durations which
might be expected for small birds. It is, therefore, not entirely
surprising that the full shock pressure is not detected in small bird impacts.
However, the full shock pressure almc,•.-t certainly occiurs, although the
duration is extremely short.
For oblique impacts, the shock pressure expected is that which
corresponds to the normal component of impact velocity. The experimentally
measured results and theoretical predictions are shown in Figure 31.
Again, the results for large birds show good agreement with the prediction.
The duration of the impact pressure was so short for small birds that
reliable measurements of peak pressure could not be made. It is notable
that at very low angles the impact pressure approaches the steady flow
pressure and no impact spike would be expected. For 250 impacts, the
impact pressure spike was much less pronounced than for 900 impacts. No
reliable measurements of impact pressure were obtained at 250.
250
z 200-
S150
50 00-2kg
40 6-4kg
00 100 200 300*1
IMPACT VELOCITY (m4)
Figure 31. Initial impact (Hugoniot) pressures versus impact velocity:for450 impacts.
42- A.
3.3.2 Impact Pressure Decay
As was pointed out in Section 3.2.2, it is not possible to calculate
the details of the decay process unless the shock release properties of the
bird material are known. As those properties are not known, the decay
process cannot be calculated. Howe-ver, the time taken for the release
waves to completely overtake the shock front can be calculated. From
these considerat'ons, a critical length was found. For birds shorter than
this critical length the shock pressure decay process never reaches
steady flow value. For birds longer than this critical length steady flow
must be established. Therefore, the critical length provides at least a
first order approximation of the time at which the decaying shock pressures
should reach the steady flow values. As several reflections of the
release wave are probably required to establish steady flow, a precise
value for this time cannot be determined. For birds striking end-on (that
is the axis of the bild is parallel to trajectory) the length to diameter
ratio varies from approximately two to approxJmatuly thz'ee. The results
of Section 3.2.2 indicate that this should permit establishment of the
steady flow process. Observation of a large number of bird impact pressure
records Indicate that for normal impact steady flow is generally estab-
lished within half the impact duration.
For side-on impacts, the effective length to diameter ratio of a
bird is about 0,3 to 0.4. This is less than the critical bird length
derived in Section 3.2.2, and steady flow would not be expected to o:,r.
A number of impacts at the AEDC facility were determined to have st~r Ui%
side-on. For these cases no steady pressure region was observed Mn. t.h<o
pressure records.
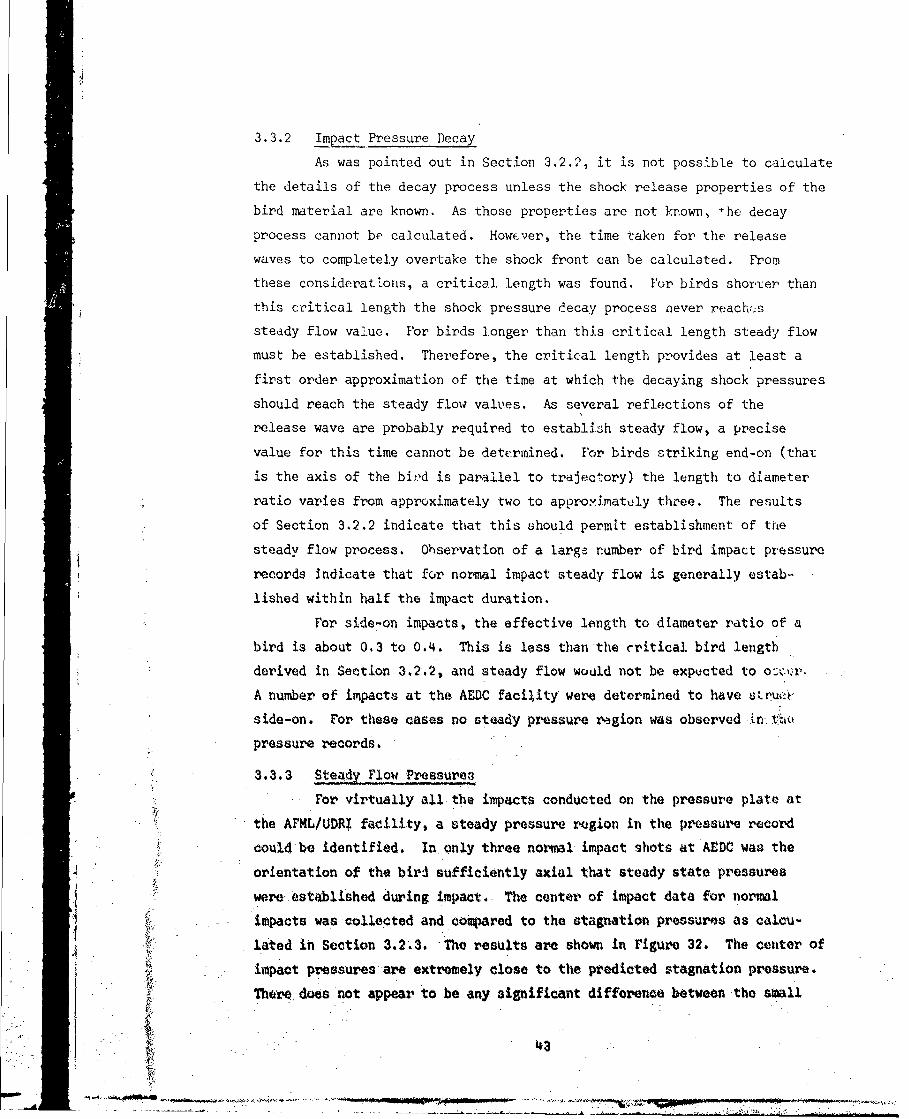
3.3.3 Steady Flow -Prssures
For virtually all the impacts conducted on the pressure plate at
the AFML/UDRI facility, a steady pressure region in the pressure record
could be identified. In only three normal impact shots at AEDC was the
4 orientation of the bird sufficiently axial that steady state pressures
ware established during impact, The center of impact data for normalS• •~mpacts was colie~cted and corawaeal to the stagnation prossures as calou-
lated in Section 3.2.3. The results are shown in rigure 32. The center of
impact pressures are extremely close to the predicted stagnation prossure.
Th o. does not appear to be any sigific:nt difference between the small
t43
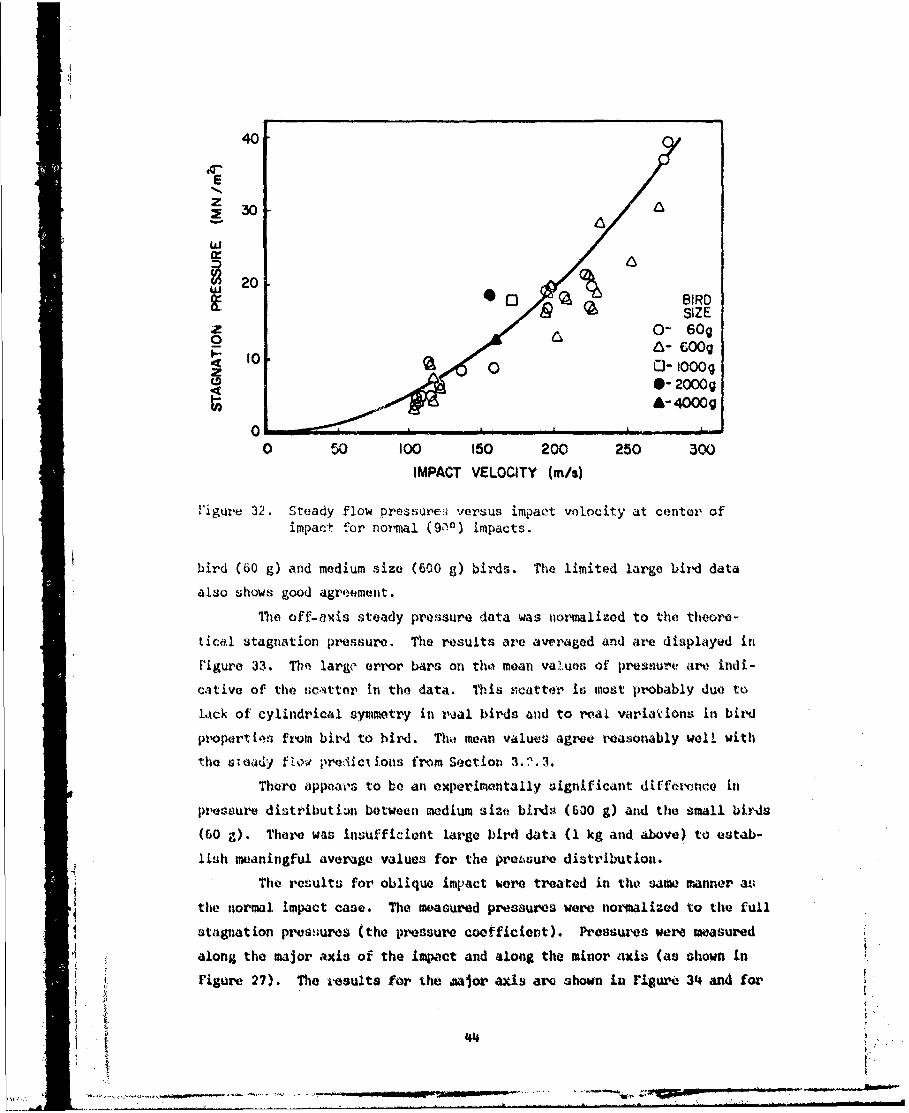
40
E
Z30
WCJ
S20
BIRD
SIZEz 0- 60g0 6- GOOQ. O 10 0-OOOg
2
CD0- 2000gA-4000g
0 U -...
0 50 100 150 200 250 300
IMPACT VELOCITY (m/s)
"rigure 32. Steady flow pressure:' versus impact volocity at center ofimpact for normal (9,o) impacts.
bird (60 g) and medium size (600 g) birds. The limited large bird data
also shows good agreement.
The off-axis steady pressure data was normalized to the theore-
tical stagnation pressure. The results are averaged and are displayed In
Figure 33. Th" large error bars on the mean values of pressure are idi-
cative of the scatter in the data. This scatter, is most probably due to
lack of cylindrical symmetry in real birds and to real variadions in bird
propertios from bird to bird. Th. mean values atgree reasonably wel! with
the steady ftow pre'ict ionts from Section 3. '. 3.
There appevos to be an experimentally significant diffe tInc in
pxressure distributizn between medium size birds (630 g) and the small birds
(60 g). There was insufficient large bird dat.A (U kg and above) to estab-
lish meaningful average values for the prebsure distribution.
The results for oblique impact were treated in the same manner as
the normal impact case. The moasured pressures were norimalized to tile full
stagnation pressmues (the pressure coefficient). Pressures were measured
along the major axis of the Iaqet and along the minor, axis (as shown inrigure 27). The results for the aaior ax"s are shown in rfigure 34 and fe" or
i44

1.0 FT0 BIRDI0 L2 BIRD)
a04
Q2
0'o 0.4 08 1.2 I.C 2D
NONrOIMENStONAL RADIUS , 09o
rigua'o 33. Steaidy flow nondimensioinal p onsurt* ditszilbUtion for rw1inma1
1.0 -456
a.
0
.0 .4IO 2 L
Fiur 3. Sed lw101itiin. rrueda-bto ln hmao xsfrOb*u. mat
I4
the minor axis in Figure 35. Also shown on the figures are the theore-
tically predicted distribution (pressure coefficients) as described in
Section 3.2.3.2. The agreement between the predictions and the measured
values is very good over the central portions of the flow. Near the edges
(nondimensional radius of one) the agreement is not so good. The potential
flow solution does not adequately model the vorticity effects at the edges.
However, the leading edge effects are probably of secondary importance in
structural modelling and the potential flow model described in Section
3.2.3.2 should provide an extremely good prediction of the steady flow
regime of bird impact. Further work on the theoretical model should be
conducted to incorporate vorticity and compressibility effects.
There are very significant differences ;n the pressure distribution
for the two angles. At 450 the full stagnation pressure is reached, while
at 250 the maximum pressure for both cases occurs very close to the edge
of the bird (nondimensional radius of one). The theoretical results
(Figure 26) shod that very little obliquity (750) moves the stagnation
point almost out to the edge. The pressure falls almost linearly from the
stagnation point down to zero on the obtuse (or downstream) side of the
impact. The scatter in the data is large, but there appear to be no signi-
ficant ieasured diffferences between 60 g and 600 g bird distributions.
The scattr is probably due to the effects of lack of cylindrical symmetry
in the impact, small variations in bird orientation, and variations in bird
properties.
3.3.4 Flow Termination
The impact pressure should return to zro when the end of the bird
reaches the plate. The duration of the pressure record should thus be
giver, by the "squash-up" time, £/v. This is only true at the cetiter of
impact for normal impacts. The duration off-center and for oblique impacts
can differ from the "squa .a-up" time depending on the exact geometry of the
bird and the location of the transducer. The durationf" of impact pressure
records were read for a number of normal impacts and the results are dis-
played in Figure 36. The impact duration is very close to the "squanh-up"
time and in agreement with the resuits found from Hopkinson bar testing as
reported in Section II.
*46I•

1.0600g 60g"BIRDS BIRDS
-4 0 I 450S08 o * 250
'JI
0
z0.2
~~ML
0 n-o 0.4 0,8 12 16 2D 2.4
NONDIMENSIONAL RADIUS, r/o
Figure 35. Steady flow nondimensional pressure distribution along theminor axis for oblique impact.
00z
0%
6-6oog BIROS
0- 60g SIRaS
0 0100 150 am0 250 300
IMPACT VELOCITY (mls)
Figure 36. Nondimensional duration versus impact velocity for normalimpacts.
47
-#now,

3.4 SUMMARY
In summary, the pressure measurements indicate that birds act as a
fluid during impact. The pressure records consist of an initial high
pressure associated with the one-dimensional impact shock stress in the
bird. This pressure decays by radial release of the high shock pressures.
A steady flow regime is established providing the bird length to diameter
ratio exceeds a value of approximately one. The steady pressures finally
decay to zero when the end of the bird reaches the plate.
The important features of bird impact pressures can be modeled,
assuming the bird has material properties described by gelatin with approxi-
mately 10 percent porosity. The impact pressures can be calculated using
the Hugoniot relation (P = pvsV) for a mixture, together with the shock
properties of gelatin. In oblique impact only the normal component of
impact velocity contributes to the shock pressure. Calculations of the
shock release process indicate that steady flow will be established if the
length to diameter ratio of the bird (in the direction of impact) exceeds
approximately one. Steady flow pressurees and pressure distributions can
be calculated using potential flow modelling. A detailed compressible
modeel for normal impact was developed by Wilbeckr 6 ]. The more difficult
oblique impact case was successfully analyzed using an incompressible model.
Many of the phybical features of bird impact reported here were[41~incorporated in the numerical model of Ito, et al] However, Ito, et al.,
use water properties for tht, bird model. The resý;ult is that shock
pre•suras are to' high and the decay procesa probably differs from real
birda (which appear to h4ve .iignificant porosity). The steody flow regime
is relatively insensitive to porosity and Ito's model should provide poodresults. The moel rported by Ito, ot al.,Jh~uld We exp|anded to inclu4e
the oblique ikao•t case as descrLbed in this report,
4.8
S... . [ _8

SECTION IV
EFrECTS OF TARGET COMPLIANCE ON BIRD LOADING
The experimental and analytical investigations reported in the
previous sections of this report were concerned with bird impact onto rigid
targets. The targets were not significantly moved or deformed during the
impacts. This greatly facilitated the measurement and analysis of bird
impact loads and such tests provided valuable insight into the bird loading
process. However, aircraft transparencies are not rigid structures under
bird loading. The transparency can move and deform significantly during a
bird impact. It is, therefore, necessary to consider the effect that
windshield response, or compliance, has on the impact loading process.
An aircraft transparency may, in general, respond to impact in two
distinctly different modes which are termed locally rigid and locally
deforming. In the locally rigid case the windshield does not significantly
deform in the local area of impact. The process is illustrated in Figure 37.
!1owever, the windshield does translate and rotate during impact (i.e., the
relative impact velocity and impact angle change during the impact process).
This can result in significant changes in the impulse Imparted to the
windshield, the duration of the forces, the magnitude and direction of the
force, and magnitude of the pressures exorted on the windshield.
BEFORE IMPACT DURING IMPACT
: I
q, ..•Figure 37.. Locally rigid windshield response.
~Aoj-K..

In the locally deforming case, the local region of impact undergoes
significant deformation including local changes in angle and shape. This
case is illustrated in Figure 38. The windshield forms a "pocket" around
the bird. This "pocketing" behavior results in greatly increased local
loading and local deformation. The phenomena displays unstable behavior;
the impact force produces local deformation and the local deformation
results in higher impact forces. In addition, this "pocketing" results in
greatly increased momentum transfer to the windshield. This increased
romentum transfer poses a threat to the structural integrity of the wind-
shield.
The remainder of this section treats in some detail the effects-of
both locally rigid and locally deforming windshield response.
4.1 iOCALLY RIGID WINDSHIELD RESPONSE
Ir. a locally rigid impact the impact velocity, impact angle, and
location of impact may all change during the impact. The geometry of a
locally rigid impact is defined in Figure 39. The bird is assumed to be a
liquid and the center of mass is not deflected from trajectory during the
impact. At some time after impact, the target surface has attained a
velocity, vp, and has displaced a distance, x, normal to the original
target surface. The center of impact has displaced a distance, y, in the
plane of the undeformed surface. The surface has rotated from its initial
angle, 0,, to a new angle, 0. The effects of these changes on various
loading paramoters will not be investigated.
BIRD WINSHELD
rigure 38. Locally deforming windshield response.
f !sS• .50
- .-. . .. .

UNDEFORMED
SURFFACE
..IMPACT Y UFC
rPROJECTION
8/
Figure 39. The geometry of a locally rigid impact.
4.1.1 The Impulse
The impulse imparted to a rigid target during impact is given by
Iquatiou (1):
I =my sin 0.
Thie impulse transferred to a locally rigid target can be roadily deduced
fr~om Equat ion (1) by noting that the impulse is simply equal to the normal
compotent of incoming momentum. In addition, it should b• noted, that the
impulse transfer dependa only an the relative velocity between the bird and
the target. Therefore, Equation (1) may be rewritten for a locally rigid
target as follows:
I m (V sin 0 - V ) (13)
where v is the plate velocity, or target velocity, normal to its surface.
As Ixoth v and 0 may vary during the impact, Equation (13) is only increinen-p
tally tv'ue. To evaluate the imp)ulae in a particular situation, Equation
(13) must be expressed in differential form and integrated over the duration
of the impact. The impulse cannot be specified "a priori" in a locally
rigid Impact.
4.1.i The Ipuls
Theimpls imatdt- rgdtre durig imact s gien

4.1.2 The Impact Duration
In Section II it was shown that a bird behaves essentially as a
fluid body during impact. The impact duration is thus given by the
"t'squash-up" time, i.e., the time it takes for the bird to travel its own
length. The duration may be thought of as the time it takes the bird to
be "consumed" by the target. In a locally rigid impact, the length of bird,
s, which is consumed in time, t, is given by the integral equation
ts .(v - v /sin 0) dt. (14)0o p
Equation (14) is most easily understood by noting that v - vp/sin 0 is
simply the relative velocity between the bird and the target along the tra-
jectory. For locally rigid impacts the concept of nondimensional time as
developed in Section II must be modified. From Equation (14) it is apparent
that the "squash-up" time is simply the time at which the length of bird
consumed is equal to the total length of bird available. This quantity can-
not be specified prior to the impact. A more significant measure of the
progress of a locally rigid impact is the nondimensional length, s/i,
which is given by
s/z = vt/z - f (vp/ sin 0) dt (15)
When the plate velocity, vp, is 0, this expression reduces to the nondimen-
sional time as described in Section II. In a locally rigid impact,
Equation (15) indisates the fraction of the bird that has been consumed at
time, t, during the impact.
4.1.3 The Impact Force
With some modification, the rigid plate total force results from
4 Section II may be applied to the locally rigid case. If the impact of the
bird is considered to be a steady fluid flow process, then the instantaneous
force exerted during the impact may be written as
F pAv2 sin , (16)
5252
S| ~~~~~~~II |i11ilIl!I IIII11111fl. .. ....

where A is the cross-sectional area of the bird at any time during the
impact. This assumption neglects the non-steady features of the impact,
but can be adapted to include them empirically. Equaticn (16) applies to
the rigid target impact case and may be related to the average force of
Equation (4) in Section II by noting that p A = m/Zeff. Using this
approach, the veriation of force with time during the impact may be regarded
as the variation of the cross-sectional area of the bird, A, with time
during the impact. The generalized bird impact force-time profile shown
in Figure 14 may then be considered as the generalized nondimensional
impact area variation with time during the impact. In a previous section
it was noted that the nondimensional time is better represented as a non-
dimensional length in locally rigid impacts. Therefore, Figure 14 can be
applied to the locally rigid impact case by recasting it as shown in
Figure 40. It should be noted that Figure 40 is not intended to imply that
the real variation of bird impact area with consumed length is given by
this figure, but rather that the loading process can be empirically des-
cribed in this manner. The nonsteady effects of impact, as well as the
variations of area, are treated simply as variations of area.
Equation (16) applies to a rigid target and must be modified to pro-
perly account for locally rigid target effects. Equation (16) simply
equates the force to the momentum flux incident on the target surface. The
momentum flux incident on a locally rigid target surface may be derived by
considering Figure 39. The relative velocity of impact normal to the target
A_ 20
0 Q2 LO
Figure 40. Nondimensional impact area versus nondimensional consumed length.I..'. 53
"- -'OW

surface is (v sin 0)- v . Therefore, the momentum flux at the surface isp
given by [(v sin 0) - v p2. This momentum flux acts on an area which is
the area of the bird projected on the target surface, or, A/sin 0. There-
fore, the momentum transfer rate, or instantaneous force, exerted on the
target is given by
F A [( v sin 0) - v ] 2 /sin 0. (17)p
This equation describes the force exerted on a locally rigid target during
the impact. The area of the bird, A, is considered to be a function of
the nondimensional consumed length as shown in Figure 40. During a calcu-
lation, the nondimensional consumed length must be continually evaluated
using Equation (15). The nondimensional area (and, therefore, the actual
area, A,) may then be derived using Figure 40. The area is then substituted
into Equation (.17) to provide the remaining unknown necessary to calculate
the impact force.
The direction at which the force is applied changes continuously
during the impact. However, it is always normal to the target surface and
this may be readily determined during the calculation.
The location of the application of the force also changes during
the impact and this can be a significant effect. As shown in Figure 39,
when the target surface deflects a distance, x, the point of impact trans-
lates a distance, y. If the rotation of the target can be neglected, then-
y = x cot 0.
If the target also rotates and 0 changes, then the position of impact must
be computed by projecting the trajectory onto the surface of the target.
In general, the position of impact will be a complicated function of dis-
placement, x, and angle, 0.
4 4.1.4 tmpact Pressure
Impact pressures are modified by locally rigid target response in
a manner quite similar to that of impact forces. The magnitude, direction,
distribution, and location of the impact pressures are all modified by the
displacement and rotation of the target surface. Each phase of the impact Iprocess, as described in Section III, Is modified by the response of the
target.
54I54 I-

4.1.4.1 Shock Pressures
The initial shock pressure generated by the bird at impact is
related to the shock properties of the bird and the target. The results
reported in Section III were all conducted on steel targets. The impedence
of steel is much much higher than that of birds. Therefore, the shock
pressures reported were insensitive to the exact properties of the target.
For typical windshield materials, the shock properties of the windshield
can have a significant effect on the peak pressures exerted. A simple
correction may be made as follows[13].
PVs VPh 1 + (Pv s/Vs
where v is the shock velocity in the bird, p and c are the density ands
sound speed in the bird and Pt and vs are the density and shock speed in
the target. The pressure, Ph is the •ugoniot impact pressure which occurs
early in the impact. As can be seen from Equation (19), as the shock impe-
dance (pvs) of the target approaches that of the bird, the peak pressure
approaches one-half the pressure produced by impact on a rigid target.
For example, for velocities studied the shook pressure of a bird on poly-
carbonate is approximately 0.6 to 0.7 of the rigid target impact value.
Equation (19) may be applied to oblique impacts by substitut i ng the initial
normal component of velocity, v sin 0, for the velocity, v, and by using a
shock velocity corresponding to the normal component of velocity. The
target will undergo negligible gross motion during this initial stage of
impact so that no further correction to peak pressure is required.
4.1.4.2 The Decay Process
The decay of the peak shock pressures during the impact will be
accelerated in a locally rigid impact case. The motion of the target will
provide additional release to the high pressure material. The details of
the decay process cannot be specified independently of target motion.
Realistic modeling of this process would have to be done using a finiteLa4)difference formulation of the problem as outlined by Ito, et albI
4.1.•..3 The Steady Flow Regime
fctinIn the steady flow regime of the impact, the pressures are a
function of the impact velocity and the impact angle. The formulation
55
-momI

outlined in Section III can be applied to the locally rigid target case by
simply substituting the relative velocity, v - v /sin 0, for the impactpvelocity, v. The distribution of pressure at any time during the impact
must be calculated using the impact angle at that time. The duration of the
impact must be scaled as described in Section 4.1.3, using the nondimen-
sional consumed length rather than the nondimensional impact time.
4.1.4.4 The Termination
The pressure terminates when the nondimensional consumed length
reaches one. This follows directly from the rigid impact case outlined in
Section III and corresponds to the time at which the end of the bird reaches
the target.
4.1.4.5 Direction and Location of Impact Pressures
The impact pressures are always applied normal to the target
surface. As the target rotates during an impact, the direction of applica-
tion of the pressures also changes. The location of the center of impact
changes as described in Section 4.1.3 for the impact force. During compu-
tation provision must be made for the impact pressures to be relocated and.
redirected during the calculation.
4.1.5 Summary
For a Locally rigid impact the rigid target loading models, as
described in Section II and III, must be modified to account for the varia-
tion of the relative velocity, and location of the impact during the
loading process. Providing the target remains rigid in the area of impact,
all the important effects of target motion can be modelled as described in
the preceding section.
4.2 LOCALLY DEFORMING RESPONSE
The case in which the target undergoes substantial local deformation
during impact is considerably more difficult to analyze than the locally
rigid case. Some features of the locally deforming case are illustrated in
Figure 41. In contrast: to the locally rigid case, there is gross local
deformation in the region of impact. The impact anglo and relative impact
velocity is a strong function of position within the impact area. The flow
of the bird on the target is a strong function of the exact deformation of
the target. Because of this very close coupling between the loading and
the response, it is probably not possible to specify the loading and
56

BIRD•
TARGET
Figure 41. A locally deforming target.
calculate the response. The two processes (i.e., loading and response) are
so mutually dependent that they must both be treated simultaneously in a
realistic way. Such an analysis is beyond the scope of this program.
However, an exploratory study of the effects of local deformation was
undertaken and the results are described in this section.
4.2.1 Local Deformation Effects
The presence of local deformation during an impact would be ex-
pected to have an effect on momentum transfer, force, duration, and the rise
time of the force. Local deformation would also affect pressures. How-
ever, pressures would be extremely difficult to calculate and even viore
difficult to measure. Attention was, therefore, restricted to impulse,
force durations= and rise times.
Local deformation, such as that depicted in Figure 41, results in
bird material be'.ng thrown out of the impact area ax higher angle than would
occur had the target remained locally rigid. Therefore, the impulse
transferred to thi target will be greater than that which would be trans-
ferred to a locally "igid target. In addition, the direction of
application of the total force is now more difficult to determine. How-
ever, it is unlikely to be normal to the original undeformed target svrface.
As the pocketing phenomena becomes more pronounced the momentum transfer
direction will approach the original bird trajectory.z5
' i 57
S•. . .. . . .. ". . . ;•. . . . .. . .. . . .. . . .. . . •. . .. . . .. . . . ... . .... . . .. . . . . . . | l~ l l . . . . .' " .. .m - - = =: - - :' / [ I I m . ... .. . .. . . .

As the angle through which the biri is deflected by the local
deformation increases, the forces exerted during impact might also be
expected to increase. The force is a function of the average angle through
which the bird is turned. As this angle increases during the .mpact, peak
force might be expected to occur later in the impact on deformable targets
than on rigid targets. Therefore, the rise time should increase. Theý
target effectively displaces during the impact and the duration of the
loading should also increase.
In summary, when compared with the rigid target loading, local
deformation should increase impact forces, increase impulse transfer,
increase duration, and delay the rise to peak force. To investigate some
of thes-e effects, an experimental program was undertaken.
4.2.2 Experimental Techniques
The experimental investigation of locally deforming target pheno-
menon is very difficult. The large elastic and plastic deformations
associated with target response preclude the use of conventional instru-
mentation techniques such as strain gaging and pressure tvansducer
measurements. Measurements of deformation and displacement which can bemade are of limited use in Invesitigating the loading effects of inter•%st
in this study. It was, therefore, decided to investigate the use of a
flopkirsion bar technique to obtain locally deforumng target loading informa-
tion. The technique employtid is illuutr.t.ed in Figure 42. The principle
of operation is identical to that drmc-ibed in Sec.tion 2.1. [lowveor, z'at§wr
than using a ba1r to sense the impact forcie, a tube is em6ployed. A flexible
targvt is mounted on the tube as shown in Figure 42. The target plate is
impacted centrally and permitt.d to deform during the impact. The loads
transmdtted via the plate to the end of the tube are transmitted down the
tuWe as a strain pulve. The strain is monitored with strain gages anid
rqcordcd on an oscilloscope. Using the known cross-sectbnal arda of the
tube and the modulus of the tube matoerial, the. ntra n.rtiww cords cAn be
convertod to force-time records. Using these i-C.¢rd., 'a rnen'. &f
•I impule, peak force, duration, and rise tOme wcr.. oh-,ir, A photCcrauh
4 of t•he t~bq installed on the range is O,,i in ý'%gurc
¶14 1

Figure 42. A Hiopkinson tube.
Figure 43. The IHopkinsoo tube in place.
The tube eMployed hald a 15.24 cm OD~ and a j~2.7 MM wall thickfiezu.It was madie of aluninum and VaS '4.8t7 m long. Strain gages wdri pl.aced at
locatlowý 76 cm and 152 cm from the impacted end. One end was cut off
per'pendi~cular to the tube axis and maed for norvial imp-acts, the other end
va~s cut at ~450 to the tub* axi and was employed for oblique impacts.

Three types of target disks were employed in the test&'. A 127 mm
thick steel plate was mounted on the tube to check the tube function. The
steel plate acted as a rigid target. The data derived from shots on the
steel plate were compared with shots on the Hopkinson bar. Two thicknesses
of polycarbonate disk were tested. A highly flexible 6.35 mm thick poly-
carbonate disk produced very deep pocketing. A 12.7 min thick polycarbonate
disk provided intermediate flexibili.ty.
Bird launching was conducted with the same facilities as described
in Section 2.1. Due zo the small size of the tube only small birds (60 g)
were employed. To remove some uncertainty and ambiguity from the results,
a synthetic bird material (gelatin - 30 percent phenolic microballoon)
was used instead of real birds.
The displacement of the target disk was measured using a streak
camera aligned across trajectory. Slots were cut in opposite sides of the
Hopkinson tube to provide an unobstructed view of the rear surface of the
target disk as shown in Figure 43. The dynamic displacement of the target
disk during the impact was then recorded.
4.2.3 Experimental Results
A total of 63 shots were obtained on the Hopkinson tube. Of these,
14 were conducted against rigid target disks to test the tube operation.
These tests demonstrated that the tube behaved as a conventional Hopkinson
bar. Twenty-seven impacts were conducted against 6.35 mm thick polycarbonate
disks and twenty-two against 12.7 mm thick polycarbonate disks. Strain data
was recorded and converted to force data. Impulse transfer, pulse duraticn,
poak forces, and rise times were measured. Streak records of disk motion
were obtained and measurements of displacement and times were obtained.
Both 900 (normal) impacts and 450 impacts were conducted.
4.2,3.1 Normal Impact Results
Normal impacts were conducted on both 6.35 mm thick and 12.70 mm
poly'arbonate eis.ks. The nondimensionalized impulse transfer i. shown in
Figure 44. Both the 6.35 mm thick and 12.70 mm thick polycarbollate plate
results are shown. The 12.70 mm thick results Illustrate the expected
behavior. The nondimensional impulse transfer increased from the rigid
plate value of 1.0 to a value of approximately 1.1. This implies that as
the plate deforms, bird material is thrown back along trajectory and tho
resultant impulse transfer Is greater than the incomihg momentum.
60
................

ES 1.5
-J
-J 0oo~
6 -12.7 mm.5 -6.4mm
00 50 100 150 200 250 300
IMPACT VELOCITY (m/s)
Figure 44. Nondimensional impulse transfer versus impact velocity fornormal impact.
The 6.35 mm thick disk results display quite surprising behavior.
The deformation of these thin disks was much greater than that for thethicker disks and the impulse augmentation might have been expected to be
significantly greater than that recorded for the higher velocity tests.At high velocities the measured impulse transferred appeared to be exactlyequal to the incominrg momentum. The large deformation and pocketing of the
pl-4te "caught" the bird and prevented any radial flow, even at the highestvelocities. The bird was recovered from these tests intacti An impact on
a rigid plate at the same velocity would have completely disintegrated the
bird.
ror normal impact on a flexible plate, such as rolycarbonate, theiapact phenomena appeared to be extremely velocity sensitive. At low velo-
city where deformation is negligible the plate behaves essentially as arigid plate and the nondimensional impulse transfer is approxifttely one.
As the velocity increases, plate deformation becomes important, bird* i material is thrown back along trajectory and the impulse transfer is aug-
mwnted. As velocity is increased further and pocketing becomes more
A. ronounced, the bird is "caught" and impulse transfer once again returns..
06

to simply the impact momentum. If impact velocities were i.ncreased, per-
foration would occur and momentum transfer would drop.
The nondimensionalized duration for both 6.35 mm thick and 12.70 mm
thick plates is displayea in Figure 45. There appears to be no significant
difference between the thin and thick plates. At low velocity the nondimen-
sional pulse duration is very close to one, the value for a rigid plate.
However, as velocity increases, the pulse duration increases to a value of
over two. The deformation of the plate has lengthened the time of applica-
tion of the force by a factor of over two.
The peak force was measured and nondimensionalized as described in
Section II. The results are displayed in Figure 46. At low velocities the
nondimensionalized peak force is approximately 2.5 for both the thin and
thick plates. This value is slightly higher than the rigid plate results
recorded in Section II. However, the rigid plate results also displayed a
trend to higher values at low velocities. At high velocities rigid plate
results indicated a nondimensional peak force of approximately 2.0. The
flexible plate results displayed in Figure 46 show a marked drop in the non-
dimensionalized peak force at high velocities. The thin plate values dropped
to approximately 0.9 at 250 m/s while the thick plato results dropped to
approximately 1.4 at 250 m/s. These values are significantly below those for
rigid plates,
The rise time of the peak force was also measured and nondimen-
sionalizod as described in Section II and the results are displayed in
Figure 47. At low velocities 1the rise time is close to that reported for
rigid plates (i.e., 10.2). As the velocity is increased an abrupt increase
in the rise time occurs at %250 m/s for thin plates and at I275 m/s for the
thick plates. Values of the nondimensionalized rise time at high velocities
exceed one. The defornation of the target disk, therefore, delays the gen-
oration of the peak force and lowers its magnitude.
"As the displacement was obviously affecting the generation of the
peak force, a comparison of the rise time of the force to the time to peak
displacement was made. The results are shown in rigure 48. The thin plate
results .,tow that at the higher velocities the rise time begins to increase.
Pvaumabiv at sufficiently high velocities peak force will occur at maximum
displacement and the rise time will be equal to the time to peak displacement.
!Sý The thicker plate results do not display this trend even at the highest velo-
cities tested. This is consistent with the lower deflections obtained with
the thick plates.
! 62

2A °o
' 2.0
0'~0oo oa 1.2
-J20
• .8 6 -12 7 mmzw 0-64mm2
z 0 0 50 100 150 200 250 300
VELOCITY (m/%)
Figure 45. Nondimensional impact duration versus impact velocity fornormal impact.
63.0
x 2.0oo o
a, 12.TamM 001. 0 I~- 6.4m o o (cbS0 0
a.0 04 ,! :. 0 50 too 150 200 250 .0D
i. • i,,•,IMPACT VELOCITY W/O)
Figure 46. Nondimensional peak force versus impact velocity for normalimpact.
63

14
0
1.2
..( • -12.7mm-. 00 -6.4mm
S1.0 0 0
0 0
t--i
Ir .6
S. o
2
z06
0 50 100 150 200 250 300
IMPACT VELOCITY (W/s)
rigure 47. Nond meolsional rise time versus impact velocity for normal impact.
'i- .66 - 12.7 mm
; 0 - 6.4mm0 0LlIll 00 0.00
.4i
00S.2 0 0 0
0 50 tOo 150 200 250 00
IMPACT VELOCITY (W/i)
Figure 48. Rise time divided by the time to peak displacument ver'sus impactV velocity for notmal itact.
V. 64
= 'ON

4.2.3.2 Oblique Impact Results
Nine oblique impacts were conducted against the 6.35 mm thick
polycarbonate disks using a sliced Hopkinson tube. The strain-time records
were converted to force-time records and integrated to provide the impulse
transfer. The results are shown in Figure 49. There is considerable
scatter in the data which is most probably due to high order strain propa-
gation modes excited in the tube by the highly oblique impact. However,
the trends are quite clear and somewhat surprising. For high impact veloci-
ties the impulse transfer appears to be equal to the entire impact momentum
of the projectile. This is a factor of two higher than what would be
expected for a rigid target impact at 450. At lower velocities there does
appear• to be a trend towards the rigid plate results as might be expected.
240
20 0
0
16
12&
RIGID PLATE8RESULTSe • 0
0• ~4
-!~S00 4 9 12 .16 20 24
': .•: -MOMENTUM (N )
Figure 49. Impulse transfer versus impact momentum for 450 impacts.
S. g65

Two mechanisms could be responsible for this remarkable impulse
augmentation. The first mechanism might be that which was observed for the
normal impacts, i.e., deep pocketing of the target which results in","catching" of the bird. A second mechanism could arise from deformation of
the target. This would result in bird material flowing off the target
surface perpendicular, to the original trajectory.
Measurements of pulse duration were made and nondimensionalized
as described in Section II. The results are displayed in Figure 50. As
might be expected, at low velocities the nondimensionalized pulse duration
is very close to the rigid plate value of one. However, at high velocities
the nondimensionalized pulse duration increases to a value of over two at
275 m/s. The oblique impact records are very similar to that displayed
for normal impacts and shows that target deformation significantly lengthens
the duration of the impact.
Measurements of peak force were obtained and normalized as des-
cribed in Section II. The results are displayed in Figure 51. Again, at
low velocities the nondimensionalized peak force is very close to the rigid
plate value of two. As the velocity increases the nondimensionalized peak
force drops to a value of about 0.9 at 275 m/s. The oblique impact results
are very similar to the normal impact results and illustrate that the target
deformation reduces peak force exerted on the target.
The rise time of the peak force was measured and nondlmenslonalized
as described in Section II. The results are plotted in Figure 52.
I'igure 52 shows that even at low velocities, the nondimonsionallzed rise
time is well above that for rigid plates (0.6 as compared to 0.2). As the
imj.act vwloeity Ig Increased the nondimensionalized rise time is not so
abrupt as was observed for the normal impacts. However, it reaches values
which are quite similar (1.2 at 275 m/s).
The displacement of the target disk was measured and the rise time
of the peak force compared to the time required to reach maximum displace-
mant. The results are displayed in Figure 53. The oblique impact results
in Pigure 53 show a much stronger correlation than the normal impact results
did. Even at low velocities the rise time appears to be identical to the
time to peak displacement. This implies that the deformation of the target
is the controlling factor in the generation of the peak force.Iii.
b6
Awn_ ....................... ---"

24
o002.0
0
000
1 .20
-J 000* o
54z
0 50 100 150 200 250 300
IMPACT VELOCITY (m/o)
Figure 50. Nondimonsionalized pulse duration versus impact velocity for440 impacts.
! 14
0-2.0 0
E
1.6
00
Cb
I .40
0 50 1O 00 ISO 200 250 300
IMPACT VELOCITY (mWs)figure 51. HondimensionalLzed peak force ver'sus 1"pact velocity for 450• ~impacts.
67

1.4.
SL2Uj 1.4
0 00• Lo o °
0 01 -0 0z .80
z 0
a .6 0
00
5
01
0 s0 o00 150 200 250 300
IMPACT VELOCITY (W/s)
rigure 5?. Noncimensional rise time versus impact velocity for 45c impacts.
1.0
wa 0.8
0.6
000 50 100 150 200 250 300
IMPACT VELOCITY W/Os
riIgure 53. Rise tmdvedby time to peak displacement versus Impact, ~volocity for 4•50 linnets.
68

4.2.4 Summary
This series of exploratory experiments on locally deforming targets
has demonstrated a number of very important features of this impact situa-
tion. Impulse transfer can be very significantly increased by local
deformation of the target. This is especially true in oblique impacts where
local deformation can result in the transfer of the entire impact momentum.
The duration of the application of the impact force is significantly
increased by local target deformation. Local target deformation produces
a marked decline in the nondimensionalized peak force and a significant
increase in the rise time. The impact forces are, therefore, spread out
in time and reduced in magnitude by local target deformation.
:~ .1G

SECTION V
CONCLUSIONS AND RECOMMENDATIONS
From the extensive study of bird loading discussed in this report, a
number of conclusions regarding bird loading and a series of recommendations
for further work have been identified.
5.1 CONCLUSIONS
From the experimental and analytical investigations conducted in this
program a number of conclusions may be stated.
1. Birds behave as a fluid during impact. This is fundamentally the
most significant conclusion of the investigation. The identification of
the basic fluid dynamic character of the bird impact process provides great
insight into the loading phenomena.
2. There are four distinct regimes of fluid flow during a bird impact.
The first phase is the initial impact in which very high shock or Hugoniot
prossures arv generated. The second phaue involves the docay of those very
high shock pressures domwn to steady fluid dynamic flow pressures. The
third phase Is the phase In which the bird material flows szteadily onto the
target and equivalent jot flow is ,qstabllshed. The fourth and last phatoe
involves termination of the impact process and tho return of the impact
forcti and pressures to zaro.
3. The total force exerted by a bird at Impoct may be chdractvrivted
In terms of the notnal coaonent of impact momentum, the duration of the
impact, and the averatge forcer exerted during the impact. Thoiue quantities
may be used to nondimensionalizf the important total force parameters of
peak force, duration, and rise time. The niondiuwmnaionalizatiotu derived in
this sntudy successfully scale the imugct fotres and account for bird size,
impact velocity, and impact angle.
4. The fluid behavior of a bird during impct can be explained in
tevmus of a roughly right circular cylindrical body composed of gelatin with
a ton pervent air poronsity. This material model and geometry successfully
predicts impact pressure!s, characteristic impact pressure decay times,
Iteady f low pr,'nttP•ures, a ped PIs-fsure durat iones.
70

5. Bird orientation at impact can have important effects on the
loading. Angle of attack (projectile yaw) effectively lowers the length-
to-diameter ratio of the bird and can affect the impact pressure decay
process and the steady flow regime.
6. Target compliance has very significant and important effects on
impact loads. A computational scheme to account for locally rigid target
effects has been derived. Exploratory experiments on locally deforming
targets have demonstrated that local deformation has very important effects
on impact momentum transfer, impact loads, and impact durations.
5.2 RECOMMENDATIONS
From this work a number of recommendations for future work have been
identified.
1. Large bird (1 kg and above) impact data is extremely limited.
As the current standard Air Force qualification bird size is 1.8 kg for
windshields, the data base should be extended to include larger bird sizes.
Although bird scaling laws were identified and investigated in the current
study, extension of the data base to 4 kg birds would greatly increase
confidence in these scaling laws.
2. The inadvertent introduction of angle of attack into the AEDC
pressure data has identified orientation as a possibly very important
impact parameter. Angle of attack can increase peak and average forces
by a factor of at least two while reducing durations by about the same
factor. Whereas axial impacts almost always produce a regime of steady
flow, side-on impacts rarely produce steady flow. The effects of orien-
tatlon at impact should be more carefully and systematically investigated.
An attempt should be made to determine under what conditions axial impacts
are the most severe and under which conditions side-on impacts are the most
severe. If side-on impacts are the most severe, under any impact conditions
of interest to transparency design, then impact loads in the side-on orien-
tation should be investigated and characterized in a similar manner to that
reported here for axial impacts.
W.S"
71

3. The development of a standard Air Force substitute bird for use
in development and possibly qualification testing should be pursued. The
current investigation has shown wide variation in every parameter of impact
loading that was measured for real birds. These variations are undoubtedly
due to real variations in bird material properties, bird structure, and bird
geometry. These variations are beyond the control of the experimenter or
test engineer. The demonstrated variations can be very large and represent
an unacceptable and uncontrollable test variation. In contrast to real
birds, the substitute bird materials that were briefly examined in this
program displayed highly repeatable loading. This repeatability offers
very significant advantages in the development and qualification of trans.-
parencies. Fur-lher work is required to mrore carefully investigate and
document the properties of candidate substitute bird materials surh as
gelatin with ten perc••t air porosity. The effects of substitute bird
geometry also require investigat ion.
14. A careful substitute validation program should be undertaken.
Measturemenlts of impact loadt; provide detailetd knowledge of the impact
process' and accurate quantitative guidancu in the formiulatlon of a suitable
siub-.;titute bird miterial and geome.try. Howeier, a careful program of
s ub:stitute bird validation would bh rvqulrýe(d 1-1 esure genleral accoptalnce
by tfhu dc'slgn, developient, and quid ift.iution -oiwnunity. A serel. of
Comparlc.-- tent-ts betweN- roii birds -nd substitute birds should b1 cor-
d,4ted fun ropresentative airc•raft zompotints. The damage inflict•d should
ho quintiftintd and con1wa-4 1 :Such a comp4ari-sonl would be es.ential to wfAllUtv
gqenlal acceptatwc, of a auWstitute. bird.
S. The explori4toty wtork •Mndertakeit in this lvuestigation on compliant
taregers hould be et.etded. The formulation of the effects of locally rigid
targets on impact loading tihould be Implem•nted and systematically inves-
tigated. The schenaw should be modeled amnlytically and empiloyed to predict
the tipact respoi e of a sitple structure roepr•tntative of a tranuparency.
The oený;itivity of the response of the structure to the details of tile
loading poesS.- should be invostigat*d. In addition, the predictions of the
analysis should be comred to experlmentally derived values. If discre-
pancies occur, the source of those disrrepancics should be ide"'tifiod. If
the aource is the loading model, thle loading model should be appropriately
modified to eliminate the discrepalcy.
72i t "
Ii
6. The locally deforming target investigation should be greatly extended.
A detailed analysis of the Hopkinson tube specimen should be undertaken.
This analysis should be used to investigate in greater detail the behavior
of the target during impact. The range of phenomena whi h occur, during
local deformation should be investigated more extensively. The process of
"pocketing" and the impact conditions over which it occurs should be
investigated and carefully documented. The very difficult task of
characterizing the local deformation and "pocketing" phenomena should be
beglin. The task of characterization must be complemented by an effort to
reduce the characterization to useable design data and methods.
7. The theoretical analysis of oblique impact pressure distribution
should he extended to include vorticity and compressibility.
373
APPENDIX A
LISTING OF OBLIQUE JET FLOWPRESSURE DISTRIBUTION PROGRAM
74

2 REM BIlHMAVE 2/20/77 BIRD IMPACT PROBLEM4 RL-4 STEADY FLOW OF A ROWD JET IMPACTI.'4G G04 AVJ6 RF2I OB3LIQUE PLATE,8 READ P,NJ10 Plop12 PRIVJT "NJOe OF SOURCES.o; P14 PRINPT "NOo, OF SOURCES ON~ ZOO ARE**.'J18 DIN X(7O).Y(70)*Z(70)20 DIM R(70)#S(7O),,H(7O)
23 Out124 FOR lot TO PI26 READ)YIC)HI28 S(1)=YCI)30 NEXT I32 PRI-4T "ANGLE OF PLATE CDEG3)8"134 IN4PUT Al36 AlwA1157.295842 T1.TAV4CA1)70 Sla-SIVJAI)72 UGx-SI75 VE-COSCAI)82 PRIN4T flX-DISTAfJCE IS")83 INPUT XI
65 PRI\JT90 PR!')? "I"* 11"."Y"s "YSINCA)*#"Zoo"95 PRINT?'" .JeW.e~u~.C.100 FOR Iftl TO P1105 SCI)MYCI)IS1110 N4EXT 1125 35S1(2o.*3s14159)130 FOR lei TO V4135 IF J21-2 714LE 150140 VtuSCI)145 Zl.O.150 WinO.155 Visof160 vivo0.165 FOR Jo 1 TO PI166 114.14(J)/2.167 43.14,4/SI170 B91S(3)-H3175 B9.5(4)4143180 CI-ZCJ)-H4185 CPNg(,J)+H4190 D~wX1**2.(yI-B1)**24CZ1.C1)4*2195 D~mSQR(D1)200 D2wX14m.2.Y1-92.'e2+CZ1-CI,**2905 D2.SQR(D2)210 D3vX 1 *2+ (Y 1-89) **2+(Z I-CO) **2115 D3nSQR(D3)920 D4.X1**2+(Y1-831)*.a,(ZUC2)**9225 D4nSOR( 04)230 IF X10.9 THLX 260235 U2wAT')( (Z I-Cg) (Y 1-132) *C X I D3)240 On -AN4((Z I-C I).Y 1-B2) ICX I *D2)245 U4u -ATV (t ZI C2 Y 1-8 1 )(X I* D4) )250 U5.AT?4((ZI-CI,.*tY1=81)/(XI*D0))255 U1-Ul*S5*iU2*U3sU4'U5)
*260 IF AHS(Z(Jfl.O- THEN 335
75

265 D5=X1**a+tY1-B1)**9+(Z1*Cl)**2270 D5=SQR(D5)275 D6*Xl**2+(YI-B2)**g+tZ1*C1 )**2280 D6-SQRtD6)255 D7uK1I**2+4(Yl-B2,**2*'Z I c2)**e290 D7wSQR(D?)295 D8.Xl**2+(Y1-B1)**B+(Z1+C2)**2300 D8mSQRtD6)305 IF X1=-0. THEN 335310 tJ2=ATN~t~1+C2)*tYl-B2,/tX1*D7))315 U3=-ATN4(tZ I C I)*(Y I-B2)/A(Xl*D6))320 U4-T(Z+g*kI8)%ID~
330 UI=U1-S5*(.U24U3.U4+U5,335 V2=D3+(CgZ1.b)340 V3-r'4+(C2-Zlj345 U4nD1*,C1-Z1)350 V5nD24(C1-Z I)355 Vint) + S5*LO at V2*V4)/( V3*V5))360 IF ABSCZ(J))a0. THEN4 390365 U~wV7+t-C2-Zl;370 V3uDB't-C2-Z1)375 V4uID5+C-C1-ZIJ380 V5uP16+ (-c I-Z I385 VI-V1-S5*L00L tU2*.4)/(V3*V5))390 V2-D1+t.B1-Y~I395 W3-D3+(Bg-Y1)400 W4uD4+(81-Y1J405 WVSPSI(B8-Y1)410 WlaWIeS5*L0Gt i.W2*W3.i/(W4*W5))415 IF ABSCZCJ).*uO. THEN 445420 W2=D5i(B1-Y1,425 W3nD7e(B2-Y~I430 VWuEn6.'.B1-Y~I435 W5= D6-rB2-Y Ij440 WluV1-S5*L0G((,12*W3.#/(W4*W5.#.445 NEXT J450 Y9*Y1.Si455 R2=Zl**2+(AY1*XI/T1 *~S1 ,*2460 IF R2o1. THEN 480465 IF XI.0. THLM 475470 UluUlIU6475 VluVl+V6480 OlaU1..S4V1**g2.W1s2485 Q=SQRQ1..490 IF Mots~ IHE 505495 P5=1*-Ql500 COTO 510505 p~solo-a510 PRI1JT ZXIDYIDygazl515 PRINT UI#Vt.V~l&Q&P5580 PRINT525 NkJCT I530 PRINT "COORDINATES AT WHICH F~LOW IS NE&VEiN'l535 INPUT X1.YI.Z1S40 oJOn J2,r545 Nul550 COTO 130
76

'700 DATA 50.11702 DATA .8,0*i.2704 DATA .6,0.a.2
706 DATA .4#0**.2708 DATA .20.*..2~710 DATA 0*#0***2712 VATA -.2&O...2714 DATA -*A#0.,.2716 DATA -9O,0.Dt2718 DATA -*8.0...2720 DATA .95,0...1722 DATA -#95*0*#*1724 DATA *8**2**2726 DATA *6.*2**2'798 DATA .A..2..2730 DATA *,2p-2**732 DATA .0,.2sog734 DATA -*2,9*2,.2736 VATA -94#*2.po2735. DATA -.6*.2,.2740 DATA -08*09#02742 DATA *5..4*og744 DATA *6**4**2746 DATA .4*.4&og748 DATA .2**4**2750 DATA 0.,.4*#2752 DATA -*g2..4*,#754 DATA -*4,.4**2756 DATA -*6**4**2755 DATA -*8..A..2760 DATA #*,6#.6..762 DATA 9**.6*e2764 DATA 92,.6..2766 DATA 0...6*9.2768 DATA .2..*6*o2770 DATA -.4*o6s*2772 I)ATA -o6o*6#*g774 DATA *4po8**2776 DATA *2oo8o*2778 VATA 0.e.8ee2760 DATA -*2#o5*oS752 DATA -*.4#8&oB764 VATA *95**1..1786 DATA -o95.lsol788 DATA #75,.55,.1790 DATA -*75*o.55.1792 DATA *55*975*o1794 DATA -.55#975*o1796 DATA Oe..95&eI796 DATA *1*995#.1600 DATA -*.1095001
77

REFERENCES
1. Barber, John P., Taylor, H. R., and Wilbeck, James S., "Characteriza-tion of Bird Impacts on a Rigid Plate: Part I", AFFDL-TR-75-5,January 1975.
2. Peterson, R. L., and Barber, John P., "Bird Impact Forces in AircraftWindshield Design", AFFDL-TR-75-150, March 1976.
3. Sanders, E. J., The AEDC Bird Impact Test Facility, Air Force MaterialsLaboratory Report No. AFML-TR-73-126, pp 493-514, June 1973.
4. Ito, M. Y., Carpenter, G.E., and Perry, F.W., "Bird Impact LoadingModel for Aircraft Windshield Design", CRT-3090-1, California Researchand Technology, Incorporated, December 1976.
5. Kinslow, R., "High Velocity Impact Phenomena", Academic Press, NewYork 1970.
6. Wilbeck, J. S., "Soft Body Impact", Ph.D. Dissertation, Texas A&MUniversity, May 1977, (to be published as AFML-TR-77-134).
7. Taylor, G. I., "Oblique Impact of a Jet on a Plane Surface", Pro-ceedings of the Royal Society, Vol. 260-A, pp 96-100, 1966.
8. Milne and Thompson, Theoretical Hydrodynamics, Fourth Edition,Chapter 11, pp 283-310, Macmillan 1960.
9. Schlicting, Boundary Layer Theory, Sixth Edition, Chapter 5, pp 76-104,McGraw-Hill 1968.
10. Taylor, G. I., "Formation of Thin Flat Sheets of Water", Proceedingsof the Royal Society, Vol. 259-A, pp 1-17, 1960.
11. Karamcheti, K., "Principles of Idal-Fluid Aerodynamics", John Wiley& Sons, New York 1966.
12. Kellogg, 0. D., "Foundations of Potential Theory", Dover, Incorporated,New York 1953.
.1
78*U.S.Government Pylntlng Office' 1978- 757-040/146


![LEVEL INVENTORY DOCUMENT ,DENTFICATION … · DOCUMENT ,DENTFICATION DISTRIBUTION STATEMENT ACCESSION FOR NTIS Uric GRAMITAB gD T IC DTIC TAB UNANNOUNCED ] ... Engineering Test …](https://static.fdocuments.in/doc/165x107/5b2492a47f8b9a9e208b4654/level-inventory-document-dentfication-document-dentfication-distribution-statement.jpg)


