LEVEL CROSSING REMOVAL PROJECTlevelcrossings.vic.gov.au/__data/assets/pdf_file/0009/...This report...
27
LEVEL CROSSING REMOVAL PROJECT CAULFIELD TO DANDENONG AIR QUALITY ASSESSMENT Document number P03‐029‐CTD‐REP‐XEN‐0001 Revision number D Date 12/09/2016
Transcript of LEVEL CROSSING REMOVAL PROJECTlevelcrossings.vic.gov.au/__data/assets/pdf_file/0009/...This report...
LEVEL CROSSING REMOVAL PROJECT
CAULFIELD TO DANDENONG
AIR QUALITY ASSESSMENT
Document number P03‐029‐CTD‐REP‐XEN‐0001
Revision number D
Date 12/09/2016

Level Crossing Removal Project Caulfield to Dandenong
Air Quality Assessment | P03‐029‐CTD‐REP‐XEN‐0001 | Revision No. D Page ii
TERMS AND DEFINITIONS
Term Definition
LXRA Level Crossing Removal Authority
D&C Design and Construction
CTD Level Crossing Removal Project Caulfield to Dandenong Alliance, incorporating Lendlease, CPB, WSP | Parsons Brinckerhoff, Aurecon, Metro Trains Melbourne and the Level Crossing Removal Authority
MTM Metro Trains Melbourne
O&M Operations and Maintenance
Level Crossing Removal Project Caulfield to Dandenong
Air Quality Assessment | P03‐029‐CTD‐REP‐XEN‐0001 | Revision No. D Page 3
TABLE OF CONTENTS
AIR QUALITY ASSESSMENT 4
Executive summary ....................................................................................................................................... 4
1 INTRODUCTION ............................................................................................................................. 6
1.1 Project Description ................................................................................................................................. 6 1.2 Scope of Assessment .............................................................................................................................. 7
2 Criteria .......................................................................................................................................... 8
3 Existing environment ..................................................................................................................... 8
3.1 Background air quality ............................................................................................................................ 8 3.2 Meteorology ........................................................................................................................................... 9
4 Emissions ..................................................................................................................................... 10
4.1 Emissions inventory .............................................................................................................................. 10 4.2 Train Volumes ....................................................................................................................................... 10 4.3 Emissions modelling ............................................................................................................................. 10
5 Assessment ................................................................................................................................. 11
5.1 Rail pollutant dispersion ....................................................................................................................... 11 5.2 Ground level concentration contours .................................................................................................. 11
6 Conclusion ................................................................................................................................... 12
7 References ................................................................................................................................... 12
APPENDICES 13
8 APPENDICES LIST ......................................................................................................................... 13
List of Appendices Appendix A. Rail Pollutant Dispersion Appendix B. NO2 Ground Level Contours Appendix C. pm10 Ground Level Contours Appendix D. PM 2.5 Ground Level Contours
Figures Figure 1 Extent of Level Crossing Removal Project on Pakenham‐Cranbourne Corridor ....................................................... 7 Figure 2 TAPM Wind Roses ......................................................................................................................................................... 9 Figure 3 Location of Cross‐Section for Rail Pollutant Dispersion .............................................................................................. 11
Tables Table 1 SEPP AQM Air Quality Criteria ........................................................................................................................................ 8 Table 2 Background Concentrations ........................................................................................................................................... 8 Table 3 Emission Factors ........................................................................................................................................................... 10 Table 4 Train Volumes ............................................................................................................................................................... 10
Level Crossing Removal Project Caulfield to Dandenong
Air Quality Assessment | P03‐029‐CTD‐REP‐XEN‐0001 | Revision No. D Page 4
AIR QUALITY ASSESSMENT
EXECUTIVE SUMMARY This report has been prepared to assess air quality for the proposed design of the Caulfield to Dandenong Level Crossing Removal Project. As part of the redevelopment of the rail corridor, air quality and emmissions are required to comply with the Victorian State Environment Protection Policy (Air Quality Management), 2001 (SEPP AQM). This report was generated using the section of rail alignment that extends from Carnegie Station to Murrumbeena Station and crosses Murrumbeena Road as its sample. The rail corridor in this area is adjacent to densely populated residential areas and is deemed to contain the most sensitive receptors with the potential for adverse air quality impacts for the entire project area.
An air quality assessment consisting of three scenarios were compared:
At Grade – The existing level crossings are not removed and the rail remains at grade
Rail Under – The level crossings are removed and the rail goes under the roads by means of cuttings
Rail Over – The level crossing are removed and the rail goes above the roads by means of elevated bridge structures
The key pollutants with the highest potential for non‐compliance with the criteria (State Environment Protection Policy (Air Quality Management), 2001) were identified as:
Nitrogen dioxide, NO2
Particulate matter with an equivalent aerodynamic diameter less than 10 microns, PM10
Particulate matter with an equivalent aerodynamic diameter less than 2.5 microns, PM2.5
Applicable air quality criteria was established using the State Environment Protection Policy (Air Quality Management), 2001 (SEPP AQM) which references the National Environment Protection (Ambient Air Quality) Measure 2003 (NEPM AAQ).
Background pollutant concentrations are critical in the assessment process as this criteria assesses the total pollutant emissions from the rail as well as background pollutant concentrations. Background concentrations of the assessed pollutants were obtained from the nearest Environment Protection Authority (Victoria) air quality monitoring station to the railway alignment, located in Brighton.
The Air Pollution Model (TAPM), a CSIRO developed prognostic meteorological and air dispersion model, was used to develop the hourly meteorological data for the project area. The meteorological data was then incorporated into the CAL3QHCR air dispersion model which is a specialised air dispersion model for line sources such as roads and rail.
As a worst‐case assumption for this assessment, V/Line VLocity trains, which are predominantly two‐car sets consisting of diesel locomotives, are assumed to constitute all the trains travelling in an hour. The engine utilised by the trains is the Cummins QSK 19R diesel engine and pollutant emission factors were computed based on emissions data from the engine manufacturer and the railway line speed of 80 km/h. The train volumes for the modelled railway section were obtained from a study conducted by VicRoads (VicRoads, 2012). It is worth noting that the majority of trains operating on this line do not use diesel engines and will therefore not produce pollutant emissions associated with diesel engines. The trains are mainly Metro Trains Melbourne (MTM) electrified trains that do not produce significant pollutant emissions.
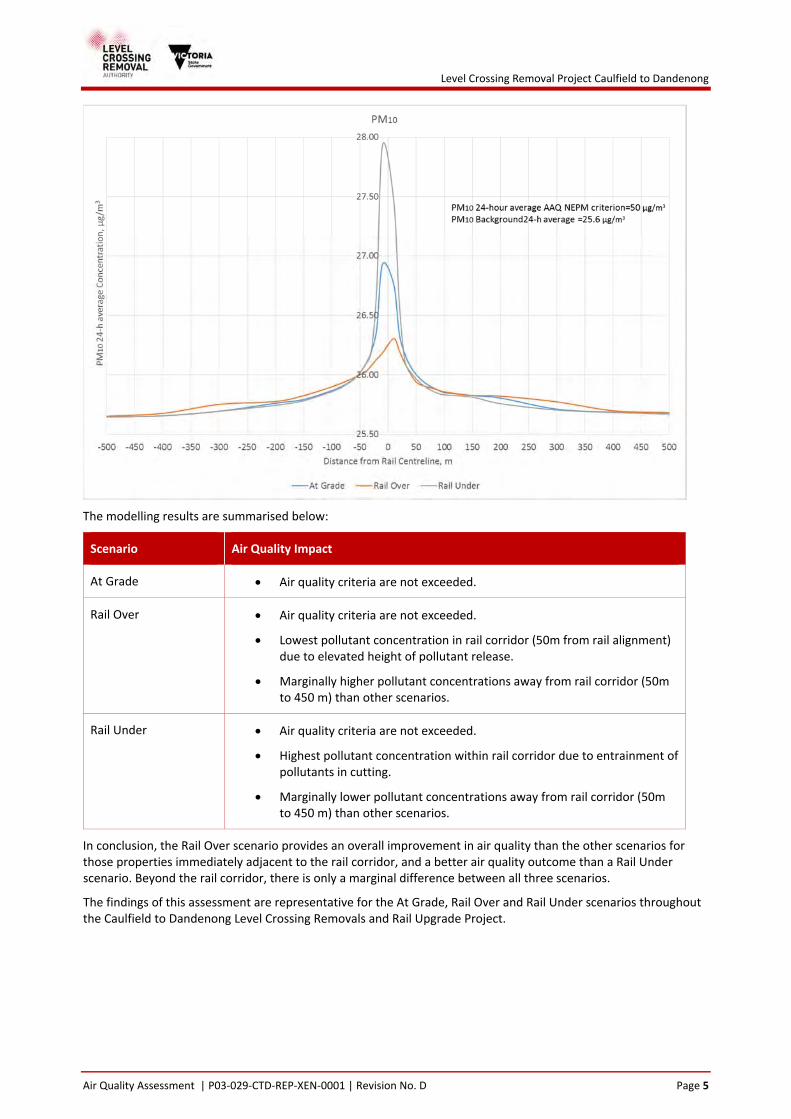
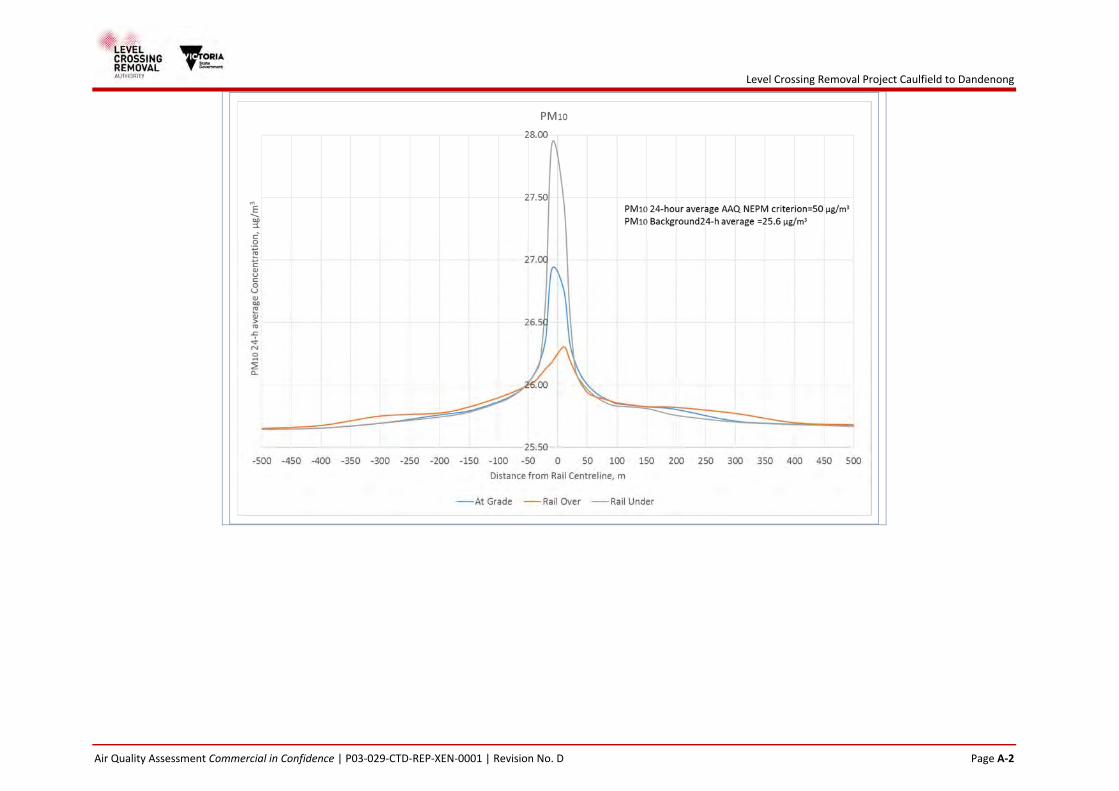
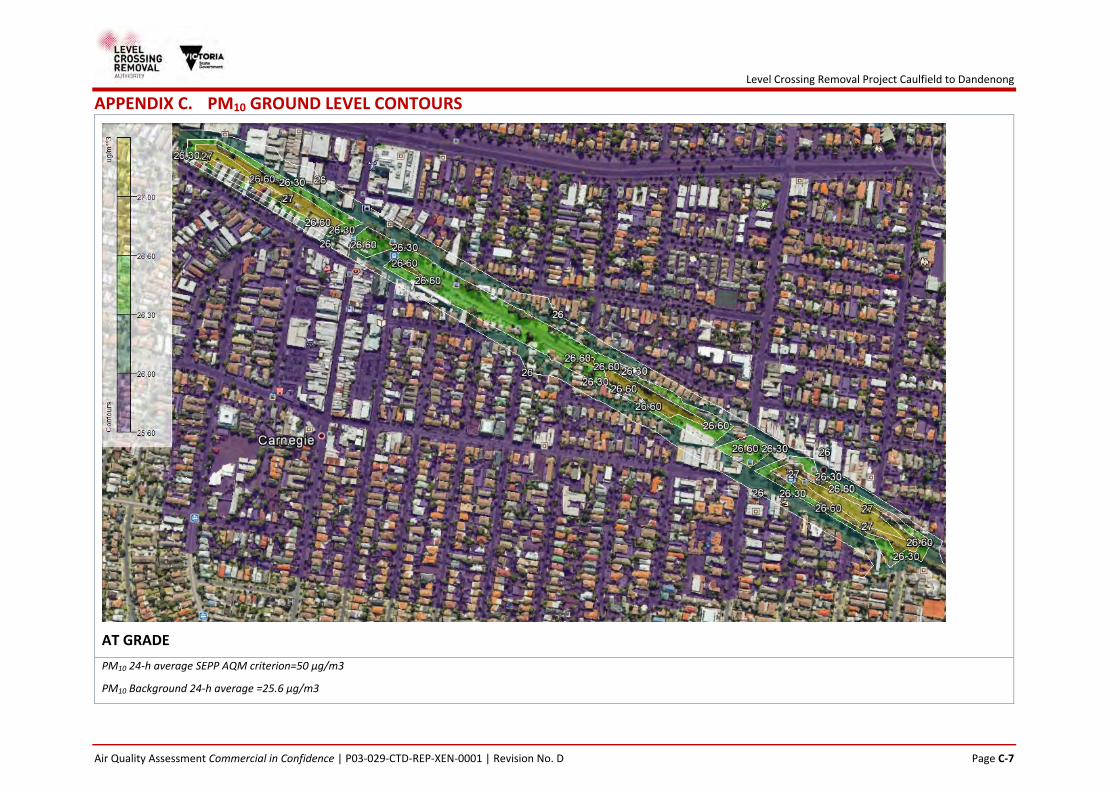
The modelling results for all three pollutants exhibit the same trend and the modelling results for PM10 is shown below and is representative of the modelled pollutants.
Level Crossing Removal Project Caulfield to Dandenong
Air Quality Assessment | P03‐029‐CTD‐REP‐XEN‐0001 | Revision No. D Page 5
The modelling results are summarised below:
Scenario Air Quality Impact
At Grade Air quality criteria are not exceeded.
Rail Over Air quality criteria are not exceeded.
Lowest pollutant concentration in rail corridor (50m from rail alignment) due to elevated height of pollutant release.
Marginally higher pollutant concentrations away from rail corridor (50m to 450 m) than other scenarios.
Rail Under Air quality criteria are not exceeded.
Highest pollutant concentration within rail corridor due to entrainment of pollutants in cutting.
Marginally lower pollutant concentrations away from rail corridor (50m to 450 m) than other scenarios.
In conclusion, the Rail Over scenario provides an overall improvement in air quality than the other scenarios for those properties immediately adjacent to the rail corridor, and a better air quality outcome than a Rail Under scenario. Beyond the rail corridor, there is only a marginal difference between all three scenarios.
The findings of this assessment are representative for the At Grade, Rail Over and Rail Under scenarios throughout the Caulfield to Dandenong Level Crossing Removals and Rail Upgrade Project.
Level Crossing Removal Project Caulfield to Dandenong
Air Quality Assessment | P03‐029‐CTD‐REP‐XEN‐0001 | Revision No. D Page 6
1 INTRODUCTION
1.1 Project Description
The Caulfield to Dandenong Level Crossing Removal Project (the Project) was established to remove nine of Melbourne’s most congested level crossings along the Caulfield to Dandenong corridor and completely rebuild five stations on Melbourne’s busiest rail line by late 2018.
Additionally, the Project will also allow for the lengthening of existing station platforms as well as new signalling and power systems to support new longer High Capacity Metro Trains affording a 42% capacity increase, equivalent to an extra 20,000 passengers a day.
The Level Crossing Removal Authority (LXRA) has identified the following Project Objectives:
Maintain an acceptable level of service for road and rail users during delivery.
Improve the reliability and efficiency of the transport network to improve productivity.
Align with community and stakeholder expectations.
Provide early engagement with stakeholders to take them on the journey.
Promote appropriate land utilisation around rail corridors to facilitate value capture development rights opportunities.
Provide better connected, more vibrant activity centres and improved urban amenity for all users.
Create safer communities.
Victoria’s Level Crossing Removal Authority (LXRA) has awarded the Project to the Caulfield to Dandenong Alliance (CTD), consisting of Lendlease, CPB, Aurecon, WSP | Parsons Brinckerhoff, Metro Trains Melbourne and LXRA.
The major elements of the project include:
Three sections of elevated structure to carry the rail over the existing level crossings of Grange Rd, Koornang Rd, Murrumbeena Rd, Poath Rd, Clayton Rd, Centre Rd, Corrigan Rd, Heatherton Rd and Chandler Rd.
Removal of the level crossing infrastructure and refinement of the existing road alignments.
Five reconstructed stations at Carnegie, Murrumbeena, Hughesdale, Clayton and Noble Park.
Extended platforms at other stations along the line.
New rail systems and signalling along the greater alignment stretching from the City‐Loop to Pakenham and Cranbourne.
A linear park beneath the elevated structures and a shared user path running along the full length of the alignment.
Level Crossing Removal Project Caulfield to Dandenong
Air Quality Assessment | P03‐029‐CTD‐REP‐XEN‐0001 | Revision No. D Page 7
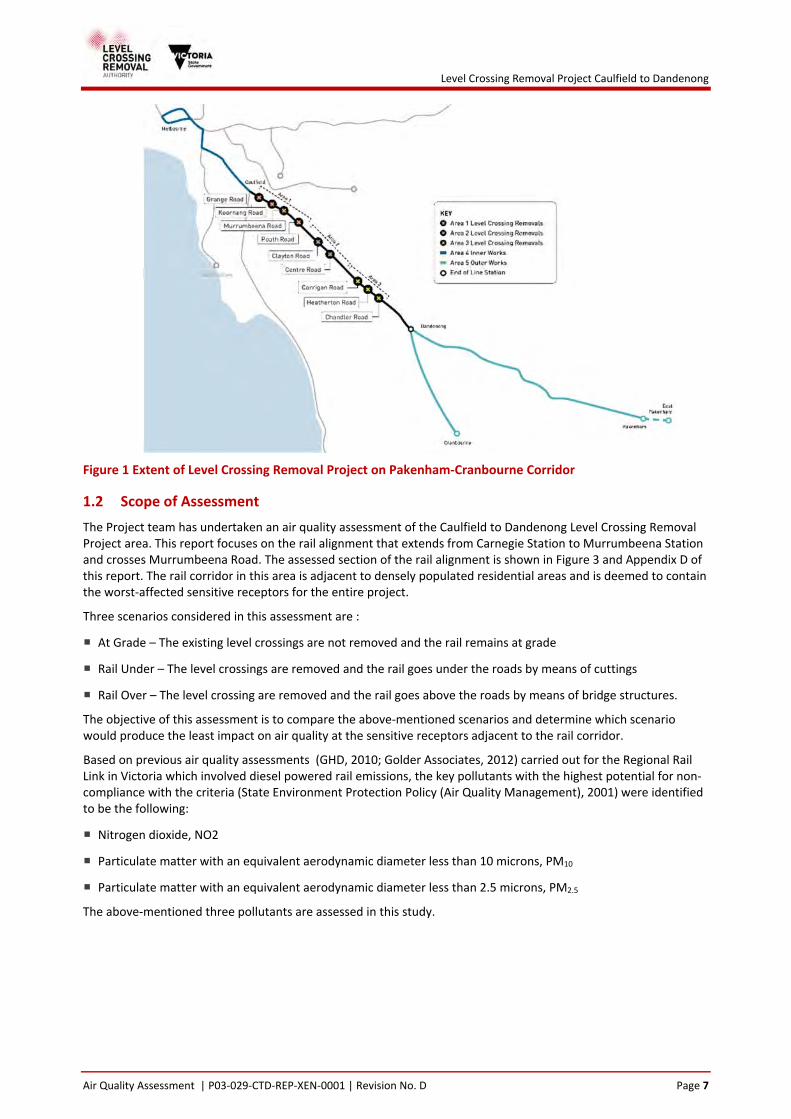
Figure 1 Extent of Level Crossing Removal Project on Pakenham‐Cranbourne Corridor
1.2 Scope of Assessment
The Project team has undertaken an air quality assessment of the Caulfield to Dandenong Level Crossing Removal Project area. This report focuses on the rail alignment that extends from Carnegie Station to Murrumbeena Station and crosses Murrumbeena Road. The assessed section of the rail alignment is shown in Figure 3 and Appendix D of this report. The rail corridor in this area is adjacent to densely populated residential areas and is deemed to contain the worst‐affected sensitive receptors for the entire project.
Three scenarios considered in this assessment are :
At Grade – The existing level crossings are not removed and the rail remains at grade
Rail Under – The level crossings are removed and the rail goes under the roads by means of cuttings
Rail Over – The level crossing are removed and the rail goes above the roads by means of bridge structures.
The objective of this assessment is to compare the above‐mentioned scenarios and determine which scenario would produce the least impact on air quality at the sensitive receptors adjacent to the rail corridor.
Based on previous air quality assessments (GHD, 2010; Golder Associates, 2012) carried out for the Regional Rail Link in Victoria which involved diesel powered rail emissions, the key pollutants with the highest potential for non‐compliance with the criteria (State Environment Protection Policy (Air Quality Management), 2001) were identified to be the following:
Nitrogen dioxide, NO2
Particulate matter with an equivalent aerodynamic diameter less than 10 microns, PM10
Particulate matter with an equivalent aerodynamic diameter less than 2.5 microns, PM2.5
The above‐mentioned three pollutants are assessed in this study.
Level Crossing Removal Project Caulfield to Dandenong
Air Quality Assessment | P03‐029‐CTD‐REP‐XEN‐0001 | Revision No. D Page 8
2 CRITERIA Applicable air quality criteria is obtained from the State Environment Protection Policy (Air Quality Management), 2001 (SEPP AQM) which references the National Environment Protection (Ambient Air Quality) Measure 2003 (NEPM AAQ) and is detailed in Table 1.
Table 1 SEPP AQM Air Quality Criteria
Pollutant Unit Averaging period AAQ NEPM Criteria Maximum allowable exceedances
PM10 µg/m3 24 hour 50 5 days a year
PM2.5 µg/m3 24 hour 25 ‐
NO2 µg/m3 1 hour 2261 1 day a year
Note: Concentrations are converted from ppm to µg/m3 and are presented at 25 ⁰C and 1 atm.
3 EXISTING ENVIRONMENT
3.1 Background air quality
Background ground level concentrations are critical in the assessment process as the AAQ NEPM (National Environment Protection (Ambient Air Quality) Measure, 2003) criteria is cumulative and includes both the emissions from the rail as well as background concentrations in the air shed.
Background ground level concentrations of the assessed pollutants were obtained from the nearest EPA Victoria air quality monitoring station to the railway alignment which is located in Brighton. The monitoring station is approximately 5km south‐east of the project area. The background concentrations were obtained from EPA Victoria’s 2014 air monitoring report (EPA Victoria, 2015) and are detailed in Table 2.
Table 2 Background Concentrations
Pollutant Unit Averaging period
Concentration Percentile AAQ NEPM Criteria
PM10 µg/m3 24 hour 25.6 90th 50
PM2.5 µg/m3 24 hour 13.21 90th 25
NO2 µg/m3 1 hour 472 75th 2262
Notes:
1. The Brighton air monitoring station does not monitor PM2.5. The ratio of PM10/PM2.5 for 24 hour 90th percentile concentrations in 2014 was calculated from EPA Victoria’s Alphington station and was determined to be 1.94. This value was applied to the PM10 concentration from Brighton.
2. Concentrations are converted from ppm to µg/m3 and are presented at 25 ºC and 1 atm.
The State Environment Protection Policy (Air Quality Management), 2001 states that the 70th percentile should be used for hourly averaged pollutants and the average should be used for 24‐hour averaged pollutants in the absence
Level Crossing Removal Project Caulfield to Dandenong
Air Quality Assessment | P03‐029‐CTD‐REP‐XEN‐0001 | Revision No. D Page 9
of site‐specific air pollutant monitoring. The percentiles selected in Table 2 are deemed to exclude outliers and limit uncertainties in the assessment process.
3.2 Meteorology
The Air Pollution Model (TAPM), a CSIRO developed prognostic meteorological and air dispersion model, was used to develop the hourly meteorological data for the project area. The TAPM model produces meteorological data, upper air information and temperature profiles for the simulation period in three dimensions for all the grid points across the domain. The gridded meteorological data generated by TAPM is calculated from the synoptic information determined from the six hour interval Limited Area Prediction System (LAPS). This final meteorological data is representative of the local topography, land use, surface roughness and temperature effects at the assessed rail alignment. The meteorological data is then incorporated into the CAL3QHCR air dispersion model which is discussed in Section 4.4.
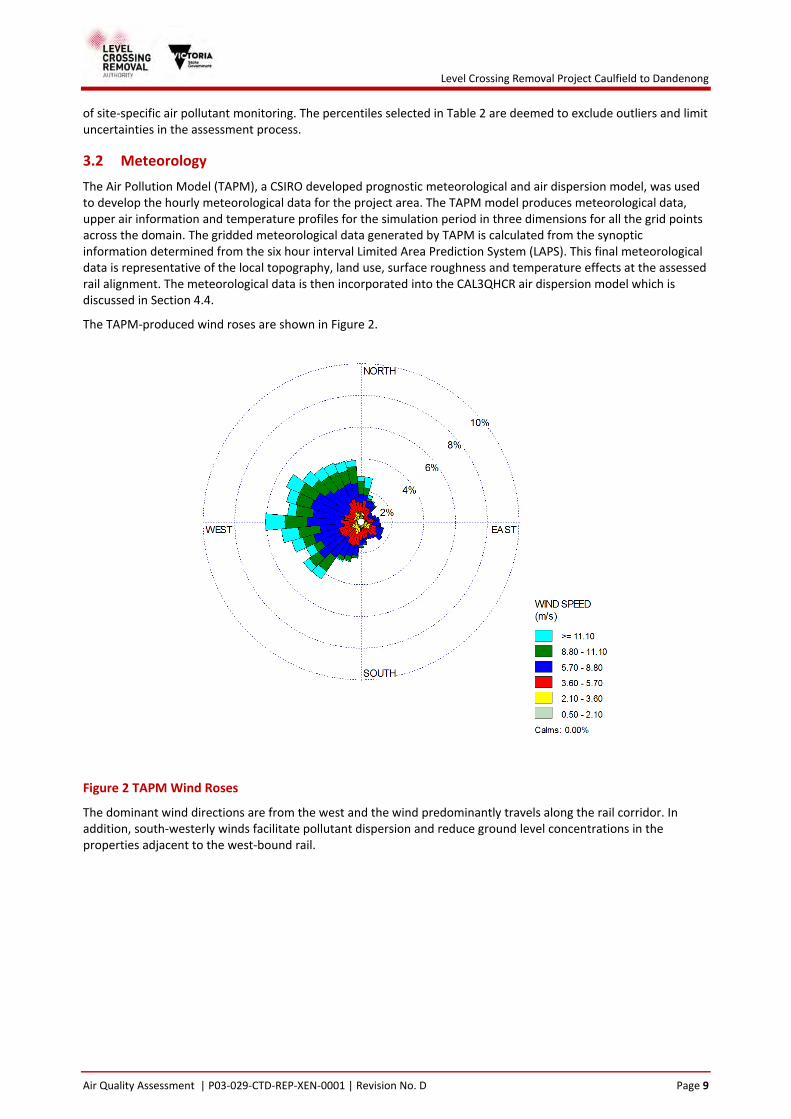
The TAPM‐produced wind roses are shown in Figure 2.
Figure 2 TAPM Wind Roses
The dominant wind directions are from the west and the wind predominantly travels along the rail corridor. In addition, south‐westerly winds facilitate pollutant dispersion and reduce ground level concentrations in the properties adjacent to the west‐bound rail.
Level Crossing Removal Project Caulfield to Dandenong
Air Quality Assessment | P03‐029‐CTD‐REP‐XEN‐0001 | Revision No. D Page 10
4 EMISSIONS
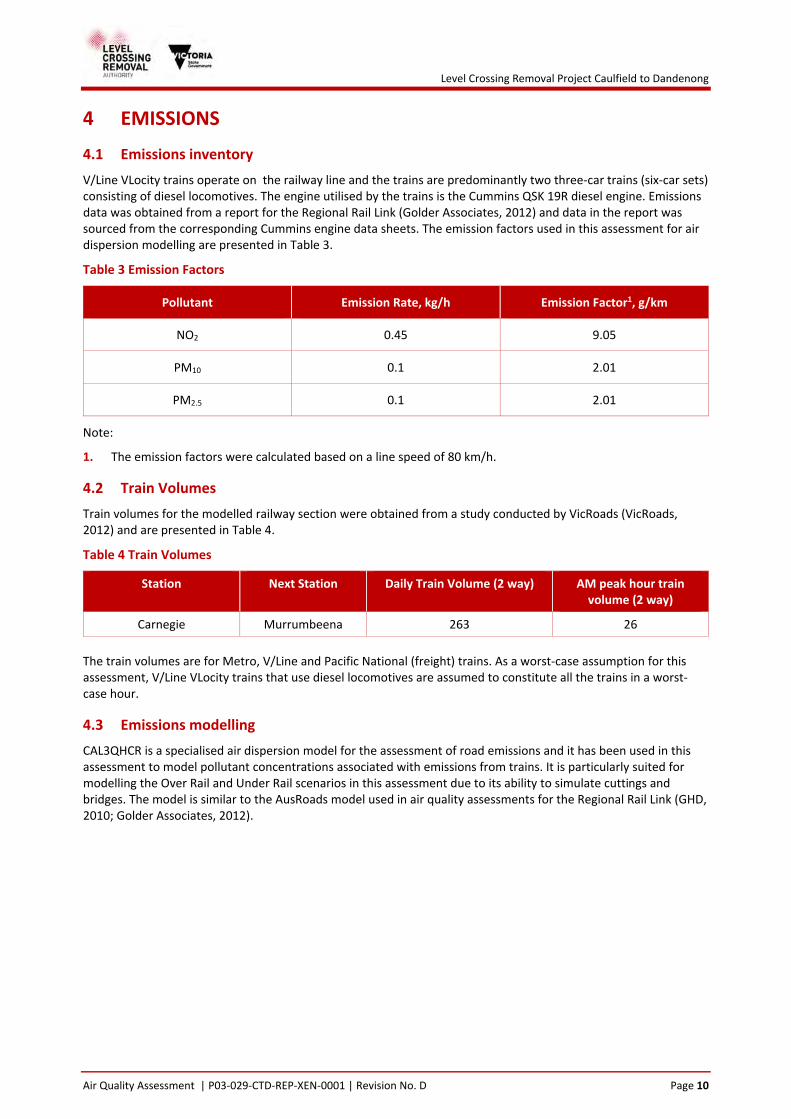
4.1 Emissions inventory
V/Line VLocity trains operate on the railway line and the trains are predominantly two three‐car trains (six‐car sets) consisting of diesel locomotives. The engine utilised by the trains is the Cummins QSK 19R diesel engine. Emissions data was obtained from a report for the Regional Rail Link (Golder Associates, 2012) and data in the report was sourced from the corresponding Cummins engine data sheets. The emission factors used in this assessment for air dispersion modelling are presented in Table 3.
Table 3 Emission Factors
Pollutant Emission Rate, kg/h Emission Factor1, g/km
NO2 0.45 9.05
PM10 0.1 2.01
PM2.5 0.1 2.01
Note:
1. The emission factors were calculated based on a line speed of 80 km/h.
4.2 Train Volumes
Train volumes for the modelled railway section were obtained from a study conducted by VicRoads (VicRoads, 2012) and are presented in Table 4.
Table 4 Train Volumes
Station Next Station Daily Train Volume (2 way) AM peak hour train volume (2 way)
Carnegie Murrumbeena 263 26
The train volumes are for Metro, V/Line and Pacific National (freight) trains. As a worst‐case assumption for this assessment, V/Line VLocity trains that use diesel locomotives are assumed to constitute all the trains in a worst‐case hour.
4.3 Emissions modelling
CAL3QHCR is a specialised air dispersion model for the assessment of road emissions and it has been used in this assessment to model pollutant concentrations associated with emissions from trains. It is particularly suited for modelling the Over Rail and Under Rail scenarios in this assessment due to its ability to simulate cuttings and bridges. The model is similar to the AusRoads model used in air quality assessments for the Regional Rail Link (GHD, 2010; Golder Associates, 2012).
Level Crossing Removal Project Caulfield to Dandenong
Air Quality Assessment | P03‐029‐CTD‐REP‐XEN‐0001 | Revision No. D Page 11
5 ASSESSMENT
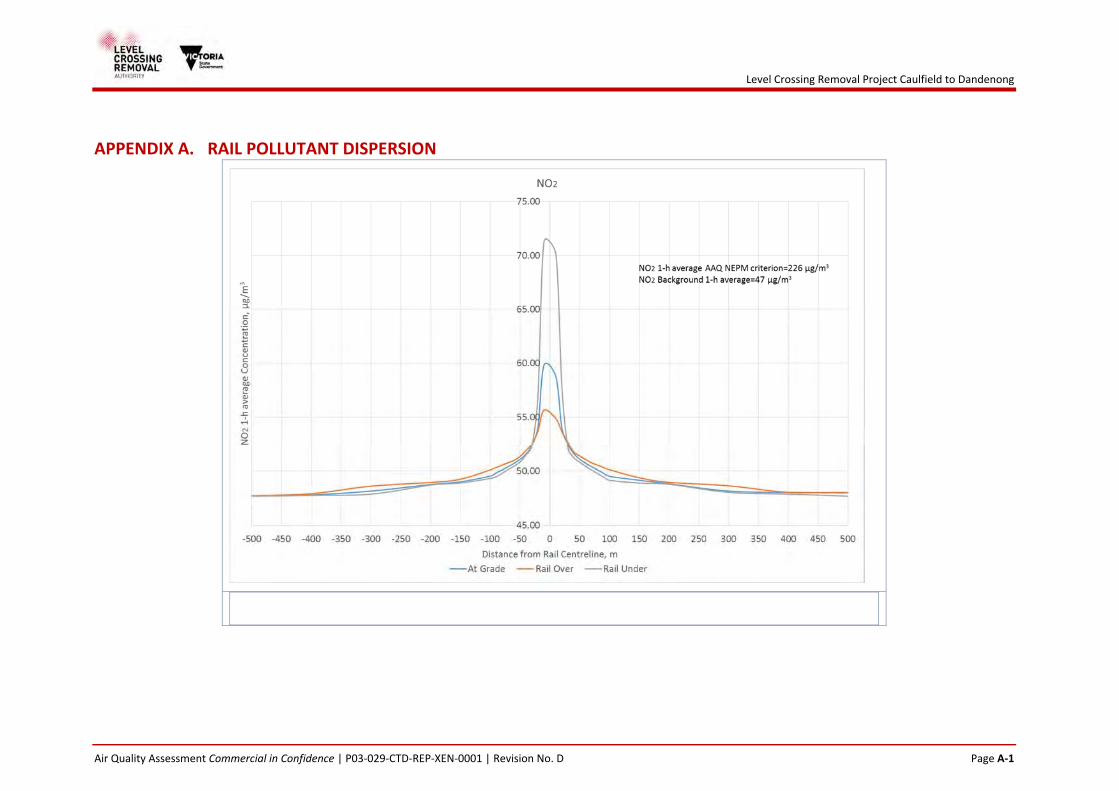
5.1 Rail pollutant dispersion
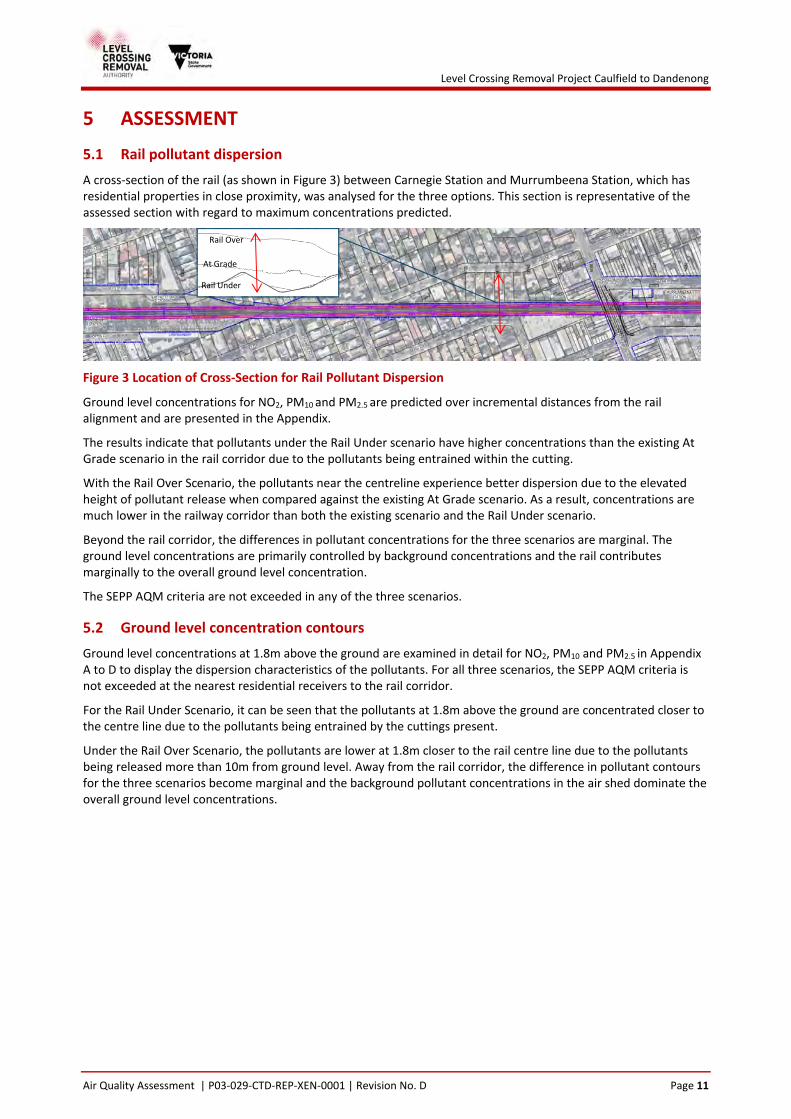
A cross‐section of the rail (as shown in Figure 3) between Carnegie Station and Murrumbeena Station, which has residential properties in close proximity, was analysed for the three options. This section is representative of the assessed section with regard to maximum concentrations predicted.
Figure 3 Location of Cross‐Section for Rail Pollutant Dispersion
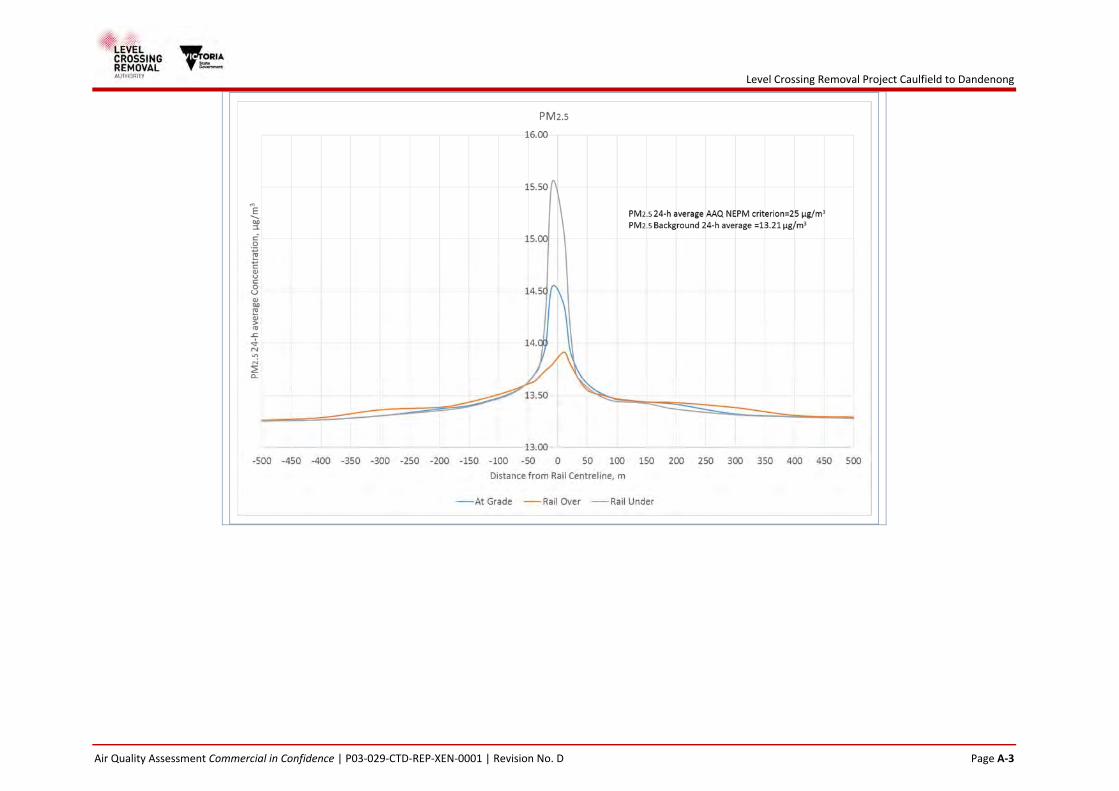
Ground level concentrations for NO2, PM10 and PM2.5 are predicted over incremental distances from the rail alignment and are presented in the Appendix.
The results indicate that pollutants under the Rail Under scenario have higher concentrations than the existing At Grade scenario in the rail corridor due to the pollutants being entrained within the cutting.
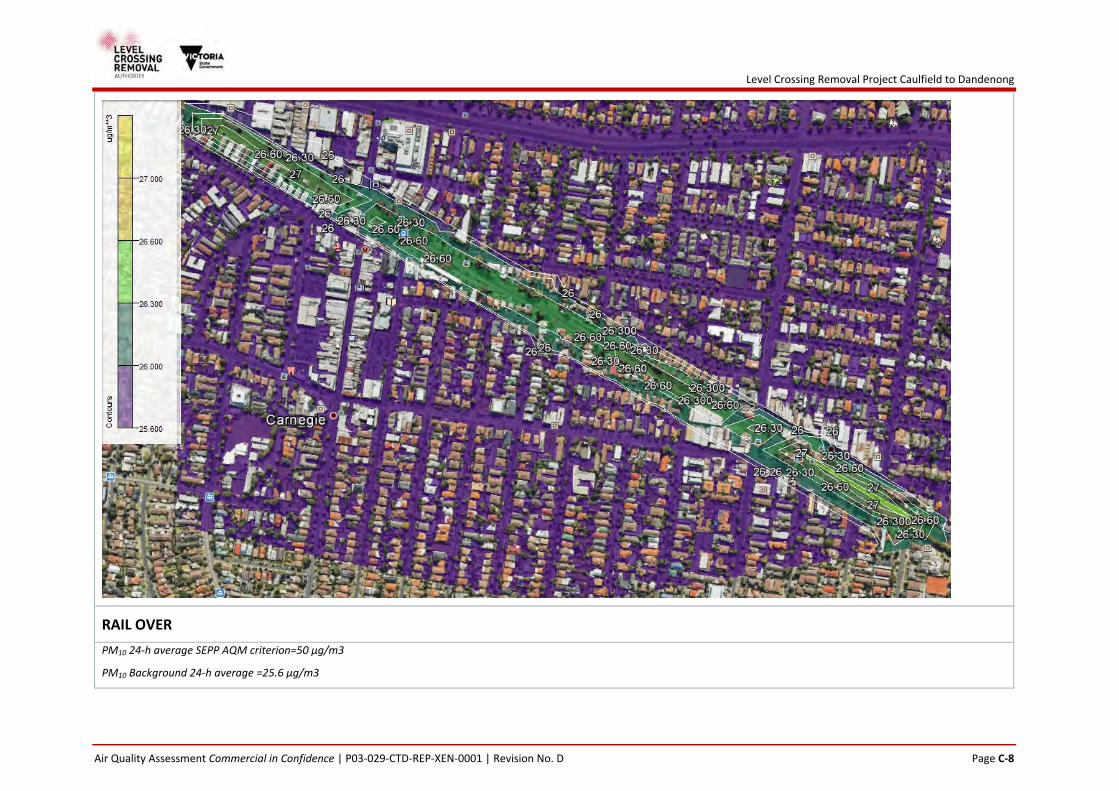
With the Rail Over Scenario, the pollutants near the centreline experience better dispersion due to the elevated height of pollutant release when compared against the existing At Grade scenario. As a result, concentrations are much lower in the railway corridor than both the existing scenario and the Rail Under scenario.
Beyond the rail corridor, the differences in pollutant concentrations for the three scenarios are marginal. The ground level concentrations are primarily controlled by background concentrations and the rail contributes marginally to the overall ground level concentration.
The SEPP AQM criteria are not exceeded in any of the three scenarios.
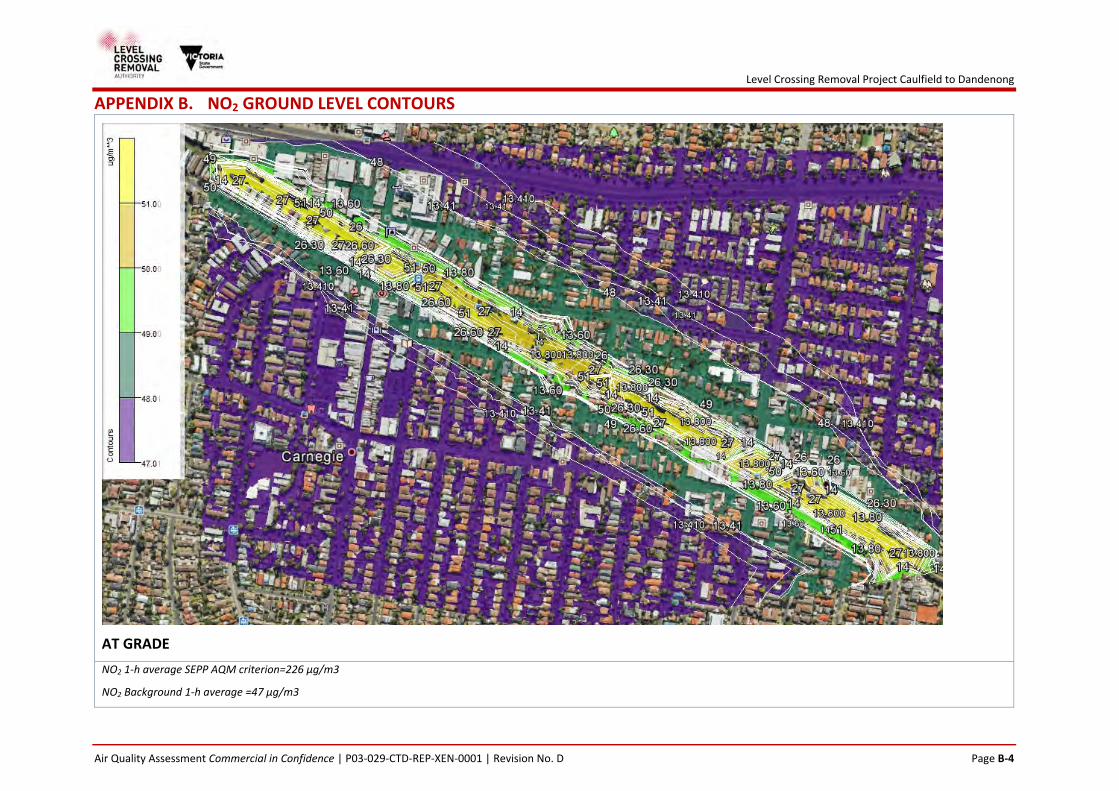
5.2 Ground level concentration contours
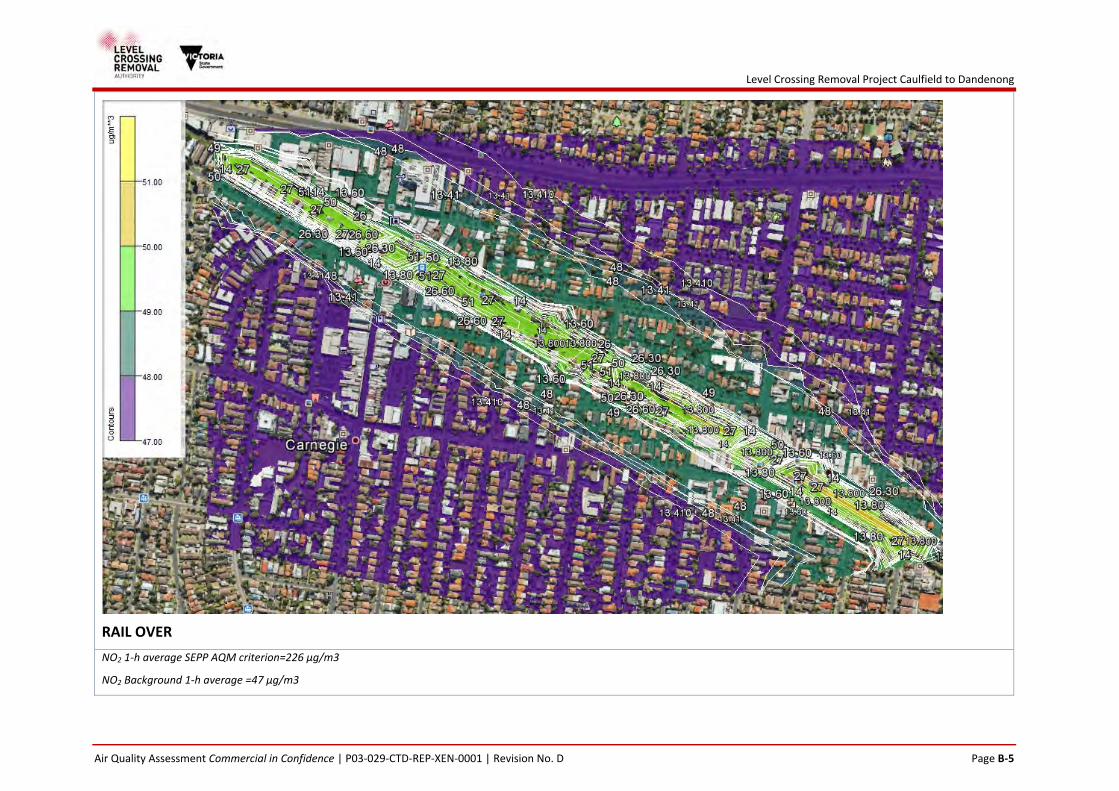
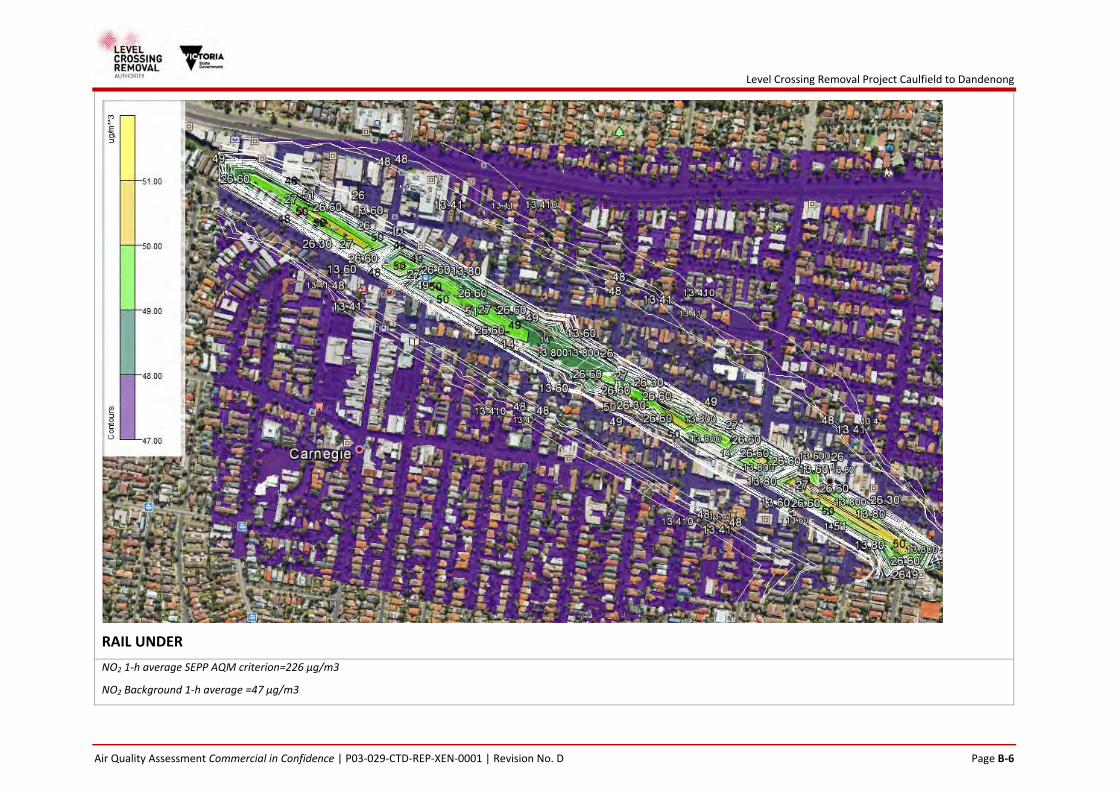
Ground level concentrations at 1.8m above the ground are examined in detail for NO2, PM10 and PM2.5 in Appendix A to D to display the dispersion characteristics of the pollutants. For all three scenarios, the SEPP AQM criteria is not exceeded at the nearest residential receivers to the rail corridor.
For the Rail Under Scenario, it can be seen that the pollutants at 1.8m above the ground are concentrated closer to the centre line due to the pollutants being entrained by the cuttings present.
Under the Rail Over Scenario, the pollutants are lower at 1.8m closer to the rail centre line due to the pollutants being released more than 10m from ground level. Away from the rail corridor, the difference in pollutant contours for the three scenarios become marginal and the background pollutant concentrations in the air shed dominate the overall ground level concentrations.
Rail Over
At Grade
Rail Under
Level Crossing Removal Project Caulfield to Dandenong
Air Quality Assessment | P03‐029‐CTD‐REP‐XEN‐0001 | Revision No. D Page 12
6 CONCLUSION Based on the assessment of NO2, PM2.5 and PM10 emissions from the rail between Carnegie Station and Murrumbeena Station, the NEPM AAQ criteria will not be exceeded by the proposed design in a Rail Over scenario. The Rail Over scenario provides an overall improvement in air quality compared to existing conditions for those properties immediately adjacent to the rail corridor, and a better air quality outcome than a potential rail under scenario. Beyond the rail corridor there is only a marginal difference between all three scenarios.
The Rail Over scenario will facilitate dispersion at the rail corridor due its elevation, which will aid pollutant release into the atmosphere, while the rail under scenario will entrain pollutants within the rail corridor. Beyond the rail corridor, the contribution of the rail, regardless of the scenario, is marginal as background pollutant concentrations dominate the overall ground level concentrations for the assessed pollutants.
The assessment is representative for existing At Grade, Rail Over and Rail Under scenarios throughout the Caulfield to Dandenong Level Crossing Removal Project.
7 REFERENCES
Department of Environment and Conservation (NSW). (2005). Approved Methods for the Modelling and Assessments of Air Pollutants in New South Wales.
EPA Victoria. (2007). AusRoads User Manual.
EPA Victoria. (2015). Air monitoring report 2014 – Compliance with the National Environment Protection (Ambient Air Quality) Measure.
GHD. (2010). Department of Transport Air Quality Assessment for Regional Rail Link.
Golder Associates. (2012). KBR‐Arup Joint Venture Air Quality Modelling Assessment for Regional Rail Link Moonee Ponds Creek to Dudley Street.
National Environment Protection (Ambient Air Quality) Measure (2003).
State Environment Protection Policy (Air Quality Management), No. S 240 (Victorian Goverment Gazette 2001).
VicRoads. (2012). Caulfield to Dandenong Rail Crossing Study, Summary of Community Issues and Ideas.
Level Crossing Removal Project Caulfield to Dandenong
Air Quality Assessment | P03‐029‐CTD‐REP‐XEN‐0001 | Revision No. D Page 13
APPENDICES
ATTACHMENTS AND REFERENCE DOCUMENTS
8 APPENDICES LIST
Appendix Title
A RAIL POLLUTANT DISPERSION
B NO2 GROUND LEVEL CONTOURS
C PM10 GROUND LEVEL CONTOURS
D PM2.5 GROUND LEVEL CONTOURS
Level Crossing Removal Project Caulfield to Dandenong
Air Quality Assessment Commercial in Confidence | P03‐029‐CTD‐REP‐XEN‐0001 | Revision No. D Page A‐1
APPENDIX A. RAIL POLLUTANT DISPERSION
Level Crossing Removal Project Caulfield to Dandenong
Air Quality Assessment Commercial in Confidence | P03‐029‐CTD‐REP‐XEN‐0001 | Revision No. D Page A‐2
Level Crossing Removal Project Caulfield to Dandenong
Air Quality Assessment Commercial in Confidence | P03‐029‐CTD‐REP‐XEN‐0001 | Revision No. D Page A‐3
Level Crossing Removal Project Caulfield to Dandenong
Air Quality Assessment Commercial in Confidence | P03‐029‐CTD‐REP‐XEN‐0001 | Revision No. D Page B‐4
APPENDIX B. NO2 GROUND LEVEL CONTOURS
AT GRADE
NO2 1‐h average SEPP AQM criterion=226 µg/m3
NO2 Background 1‐h average =47 µg/m3
Level Crossing Removal Project Caulfield to Dandenong
Air Quality Assessment Commercial in Confidence | P03‐029‐CTD‐REP‐XEN‐0001 | Revision No. D Page B‐5
RAIL OVER
NO2 1‐h average SEPP AQM criterion=226 µg/m3
NO2 Background 1‐h average =47 µg/m3
Level Crossing Removal Project Caulfield to Dandenong
Air Quality Assessment Commercial in Confidence | P03‐029‐CTD‐REP‐XEN‐0001 | Revision No. D Page B‐6
RAIL UNDER
NO2 1‐h average SEPP AQM criterion=226 µg/m3
NO2 Background 1‐h average =47 µg/m3
Level Crossing Removal Project Caulfield to Dandenong
Air Quality Assessment Commercial in Confidence | P03‐029‐CTD‐REP‐XEN‐0001 | Revision No. D Page C‐7
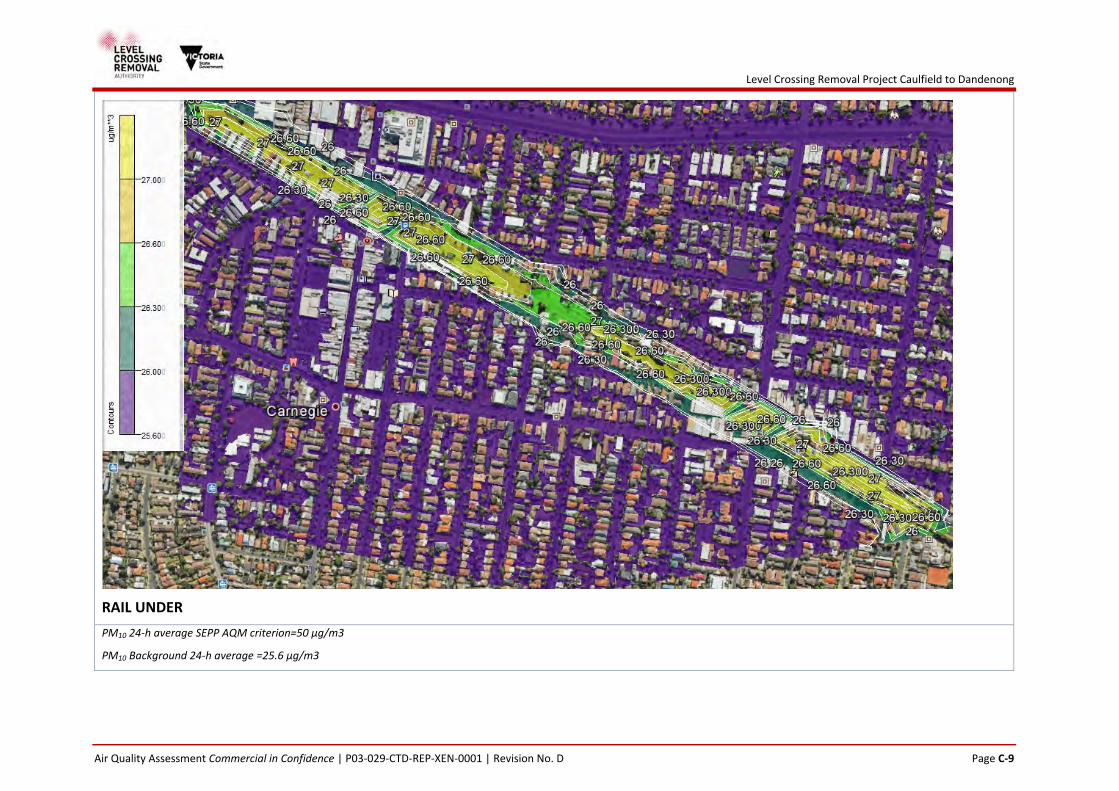
APPENDIX C. PM10 GROUND LEVEL CONTOURS
AT GRADE
PM10 24‐h average SEPP AQM criterion=50 µg/m3
PM10 Background 24‐h average =25.6 µg/m3
Level Crossing Removal Project Caulfield to Dandenong
Air Quality Assessment Commercial in Confidence | P03‐029‐CTD‐REP‐XEN‐0001 | Revision No. D Page C‐8
RAIL OVER
PM10 24‐h average SEPP AQM criterion=50 µg/m3
PM10 Background 24‐h average =25.6 µg/m3
Level Crossing Removal Project Caulfield to Dandenong
Air Quality Assessment Commercial in Confidence | P03‐029‐CTD‐REP‐XEN‐0001 | Revision No. D Page C‐9
RAIL UNDER
PM10 24‐h average SEPP AQM criterion=50 µg/m3
PM10 Background 24‐h average =25.6 µg/m3
Level Crossing Removal Project Caulfield to Dandenong
Air Quality Assessment Commercial in Confidence | P03‐029‐CTD‐REP‐XEN‐0001 | Revision No. D Page D‐10
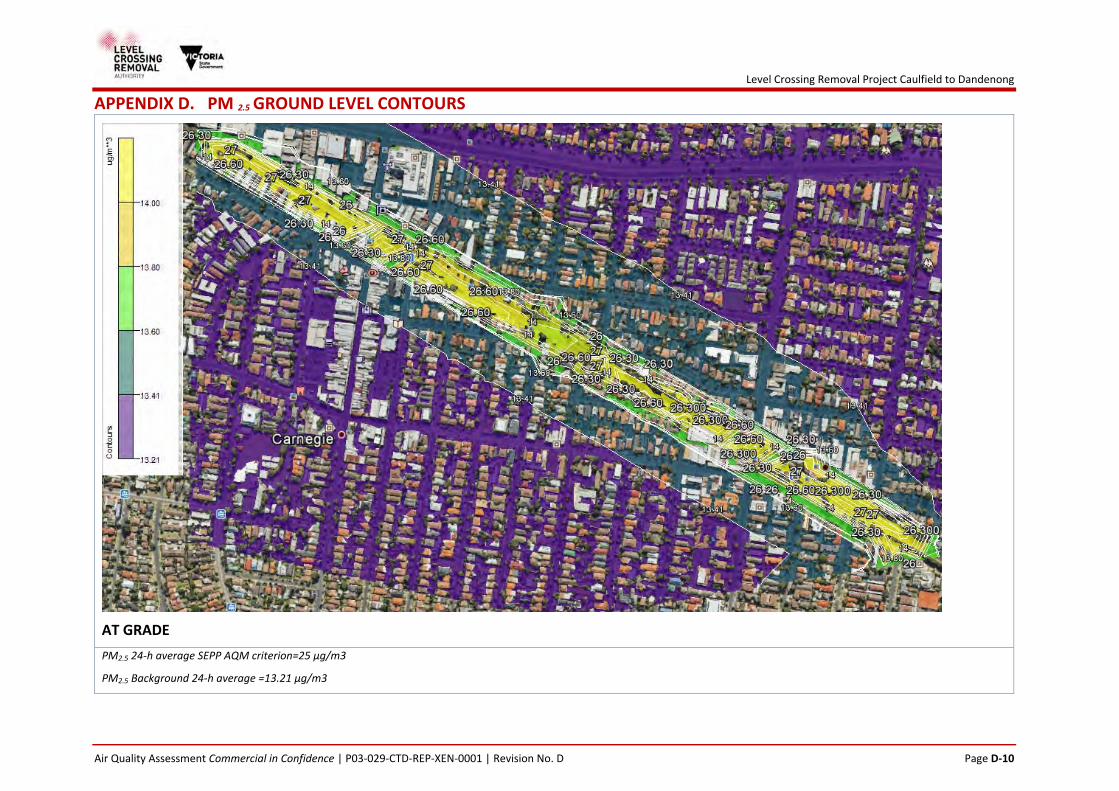
APPENDIX D. PM 2.5 GROUND LEVEL CONTOURS
AT GRADE
PM2.5 24‐h average SEPP AQM criterion=25 µg/m3
PM2.5 Background 24‐h average =13.21 µg/m3
Level Crossing Removal Project Caulfield to Dandenong
Air Quality Assessment Commercial in Confidence | P03‐029‐CTD‐REP‐XEN‐0001 | Revision No. D Page D‐11
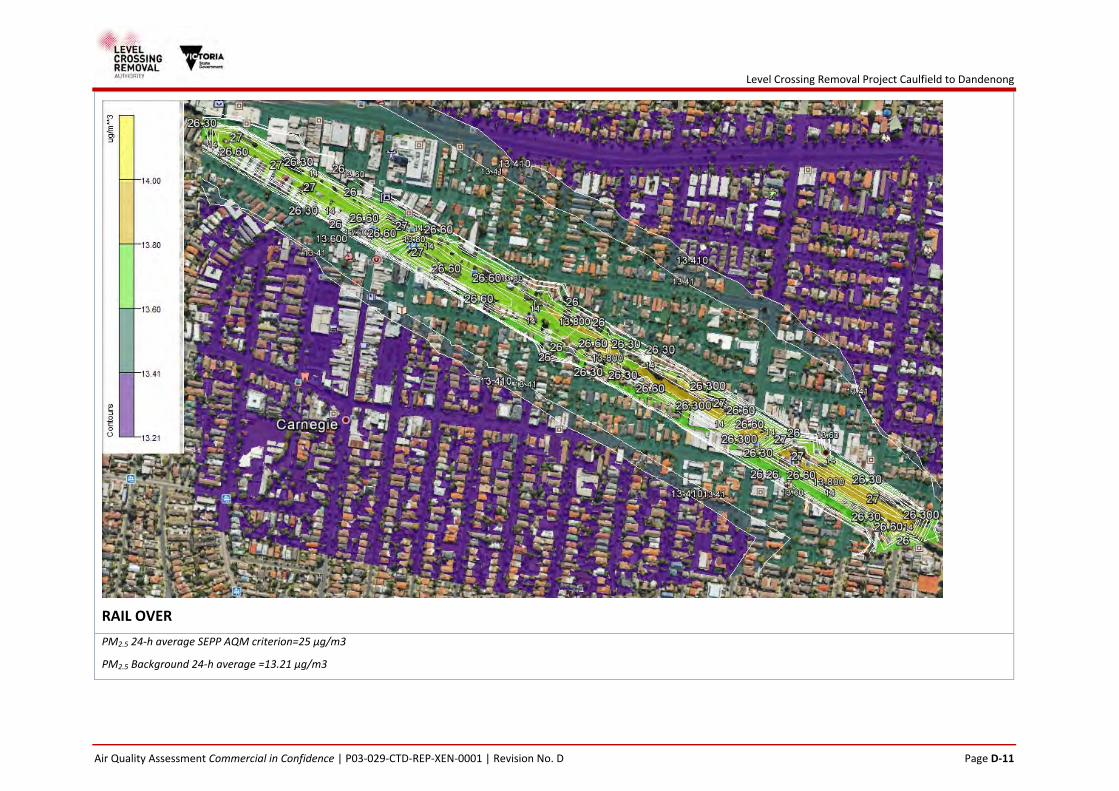
RAIL OVER
PM2.5 24‐h average SEPP AQM criterion=25 µg/m3
PM2.5 Background 24‐h average =13.21 µg/m3
Level Crossing Removal Project Caulfield to Dandenong
Air Quality Assessment Commercial in Confidence | P03‐029‐CTD‐REP‐XEN‐0001 | Revision No. D Page D‐12
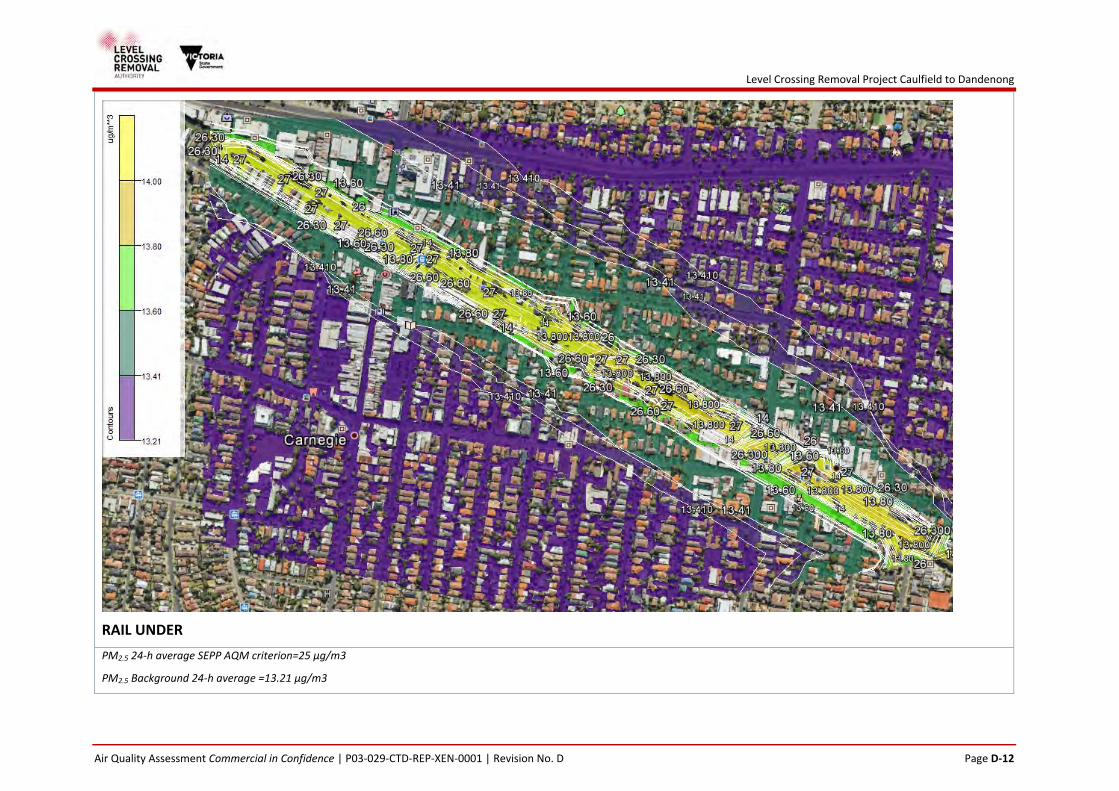
RAIL UNDER
PM2.5 24‐h average SEPP AQM criterion=25 µg/m3
PM2.5 Background 24‐h average =13.21 µg/m3
Level Crossing Removal Project Caulfield to Dandenong
Air Quality Assessment Commercial in Confidence | P03‐029‐CTD‐REP‐XEN‐0001 | Revision No. D Page D‐13