Exa-Scale Volunteer Computing David P. Anderson Space Sciences Laboratory U.C. Berkeley.
Upload
cameron-andersonCategory
view
322download
0
Page 1 Cameron Anderson - The Set-Up and Application of a Germanium Gamma Ray Detector
I. Introduction
Since its discovery in 1896 [1], the use of nuclear radia-
tion to determine the structure and composition of the
world around us has been standard practice. Easily ma-
nipulated and detected, radiation allows small and large
objects to be probed to gain information about their
composition or their fundamental building blocks, using
‘invisible radiation to make a visible image of an invisi-
ble object’ [2]. Early investigations capitalised on the
charge of alpha and beta radiation to peer deep into nu-
clear structure whereas the observability, negligible ab-
sorption and scattering in air, contrary to alpha and beta
particles [3], makes gamma radiation the superior choice
when it comes to imaging larger objects.
I.I Gamma Radiation and Detection
Gamma radiation consists of photons with energies typi-
cally in the region of the electromagnetic spectrum be-
tween 0.1Mev and 10Mev [3]. Although weakly ionis-
ing, their high energies ensure they are highly penetra-
tive. The creation of a gamma ray photon occurs in an
unstable radioactive nucleus. Most alpha and beta decays
leave the nucleus in a final excited state. These excited
states decay to the ground state energy though emission
of one or more gamma rays [3]. The activity of a radio-
active source will decrease exponentially as a function of
time,
𝐴 = 𝐴0𝑒−𝜆𝑡. (1)
Where A is the activity at time t, A0 is the source’s activi-
ty at t = 0, and λ the decay constant of the radioactive
source, related to the half-life of the source, τ1/2 by
𝜆 =𝑙𝑛2
𝜏1/2. (2)
Variable attenuation of gamma radiation makes it ideal
for imaging. Interactions with matter occur in a variety
of ways, with over 99% of interactions dominated by the
Photoelectric effect, pair production and Compton Scat-
tering. The Photoelectric effect is prominent with low-
energy gamma rays and a high Z (atomic) number of
attenuating matter (important in heavy atoms like lead
[4]), with the inverse being true for pair production.
Compton scattering dominates in intermediate energies,
particularly for low Z values. [5]
As mentioned previously, the observability of gamma
rays makes them perfect for imaging. High resolution
semiconductor detectors are readily available, with a
coaxial germanium detector being used for the duration
of this investigation. Spectrometry using germanium
detectors is preferable for investigating radionuclides
due to the sharply defined characteristic energies of
gamma rays produced by different radioactive nuclei. [6]
The excellent resolution of a germanium detector allows
these characteristic energies to be resolved.
Germanium gamma ray detectors contain a germanium
crystal which, when bombarded with gamma ray pho-
tons, excite electrons within the crystal structure to cre-
ate an electron-hole pair, allowing the electrons to trans-
verse the energy band gap of germanium. These elec-
trons are subsequently swept away by an applied electric
field, created by applying a large voltage across the ger-
manium crystal. The charge collected from liberated
electrons, which is proportional to the energy deposited
into the detector by the gamma ray photons [7], is con-
verted to a voltage pulse which is subsequently ampli-
fied for measurement. One drawback of the germanium
detector arrangement is that a band gap of germanium
The Set-Up and Application of a Germanium Gamma Ray Detector for Imaging using
Gamma Rays and Fluorescent X-rays
Cameron Anderson (and Paul Gape)
Level 3 Laboratory Project, Final Report
Michaelmas Term 2014 Investigations into the set-up of an Ortec® germanium gamma ray detector are conducted, leading eventually to 2D
imaging of simple lead based objects using gamma rays from a radioactive Co60 source. Simple, well defined objects
are successfully imaged, with difficulties in determining any irregular defects in objects.
The success of imaging with gamma rays allows the use of imaging with X-rays to be studied, with the detection set-
up altered to apprehend hard X-ray photons, imaging using the principle of X-ray fluorescence to identify a known
element is conducted. Although trivial scans were successful, many areas are opened up for further study to fully re-
fine the process, making it applicable to industrial and academic areas of study.
Material Atomic
Symbol
Atomic
Number
Operating
Temperature
Band Gap
(eV)
Electron-hole
creation energy ε
(eV)
Density (gcm-3
)
Germanium Ge 32 Liquid N2 (77K) 0.67 2.96 5.32
Table 1. Properties of semiconducting germanium within the detector implemented for the duration of the investigation. [7] Properties
displayed are at the operating temperature of 77K

Page 2 Cameron Anderson - The Set-Up and Application of a Germanium Gamma Ray Detector
large enough to ensure thermally excited electrons do
not become charge carriers must be established. Cooling
the crystal to liquid nitrogen temperatures safeguards
against this. Some operating parameters of germanium
can be seen in table 1.
The practical applications of gamma ray imaging are
extensive, with the prominent areas of research being
medical physics and astronomy. In medical physics, con-
trary to x-rays, the defining feature of gamma ray imag-
ing is that the source of energy is usually located inside
the body, introduced by a radioactive pharmaceutical. [8]
An image of emission can then be produced using gam-
ma ray detection techniques. With regards to astronomy,
the primary purpose of high energy gamma ray detection
is to observe obscure phenomena in extreme astrophysi-
cal environments. [9] Gamma ray’s advantageous prop-
erties make them applicable to many areas of physical
research.
I.II X-rays and X-ray Fluorescence
One step below gamma rays in the electromagnetic spec-
trum we find X-rays, though this is not a definite bound-
ary. The regions of hard, high energy X-rays overlap the
regions of soft, low energy gamma rays. [10] This being
the case, it is not unreasonable to adapt gamma ray im-
aging techniques to image hard X-rays, i.e. photons with
wavelengths in the region 0.1-0.01nm. [10]
The generation of X-rays is predominately completed
using an X-ray tube assembly. [11] A beam of cathode
electrons run through the tube and interact with the ma-
terial of the anode, slow down and stop. Some energy
loss in this process forms X-rays known as ‘bremsstrah-
lung’ or braking radiation. [12] This will not be the con-
cern of this investigation, which will focus on the pro-
duction of X-rays thorough X-ray fluorescence.
Atomic X-ray fluorescence occurs when an incoming
photon excites electrons at a low electron orbital (K
shell). The stripping of electrons from this shell creates a
vacancy in the orbital. This vacancy is hence filled by an
electron in a higher energy level (L or M shell) to stabi-
lise the atom. This de-excitation of an electron from a
higher energy level will emit a characteristic X-ray
unique to this element. [13]
Fig. 1 The process of X-ray fluorescence, the secondary release
of a photon from an atom after absorption of an incident
photon.
The specificity of the X-ray photon emitted by the atom
in the fluorescence process allows the atom to be identi-
fied. If the energy of this characteristic X-ray can be
measured and compared to a previously measured value,
one can confidently say the element is present in the
item being studied (Although the specific isotope of the
element cannot be identified [14]).
The applications of analytical methods using X-ray fluo-
rescence are considerable. These include non-destructive
testing, medical research, trace-element analysis and
analysis of samples in situ for geological exploration.
[15] The non-destructive property of this type of imag-
ing makes it preferable for a range of fields, for example,
in the analysis of pigments and inks in historical manu-
scripts. [16] In medical physics, the presence of heavy
elements in biologically important molecules can be
investigated. [17] Solid state detectors with high energy
resolution, such as the germanium detector implemented
in this investigation, have made it possible to study X-
fluorescence for in-vivo investigations. [18]
As far as this investigation is concerned, detailed study
into the set-up of the Germanium gamma ray detector
will be completed. Determination of the optimum exper-
imental parameters to detect firstly gamma rays from a
specified source, and subsequently X-rays leading to the
detection of X-ray fluorescence will be the main aim of
the experiment. The arrangement of the detector will be
used to take scans of known objects to investigate the
limitations of the experimental arrangement as a gamma
ray/X-ray fluorescence imaging set up.
II. Methods
II.I Gamma Ray Source
For the duration of the germanium detector configura-
tion and imaging, the radioactive source used was a
Co60 (Cobalt 60 isotope) gamma ray emitter. With an
initial activity of 458kBq and a half-life of 1925 days,
the current activity of the source was determined to be
66.7kBq from equation 1, due to the fact the source was
obtained with its original activity on 23/02/2000 (i.e.
time since initial activity ≈ 5350 days). It was assumed
due to the large half-life of the source that any drop in
activity for the duration of gamma ray scans was negli-
gible.
As with many gamma emitters, Co60 decays via beta
radiation, which in turn leaves the nucleus in an excited
state. Gamma photons will then be released as the
nucleus returns to the ground state. Two characteristic
gamma photons are realsed in different quantities, as
seen in figure 2, with energies of 1.17Mev and 1.33Mev
respectively.

Page 3 Cameron Anderson - The Set-Up and Application of a Germanium Gamma Ray Detector
Fig. 2 Decay scheme of Co60, two beta decay processes lead to
two separate gamma ray emissions. [19]
II.II Germanium Detector Configuration
The detector implemented in the investigation contained
a germanium crystal of diameter 49.6mm and length
35.3mm, with a 3mm space between the end cap of the
detector and the crystal. Absorbing layers in the detector
included a 1.27mm thickness of aluminum to protect the
crystal, and 0.7mm of inactive germanium.
To set up the germanium gamma ray detector to eventu-
ally scan items, two main electronic settings required
optimum determination. These were the amplification of
signals received from the detector and the bias voltage
across the germanium crystal within the detector. A sim-
ple flow diagram of the electronic set up of the system
can be seen in figure 3.
Fig. 3 Electronic set up to configure detector, a high voltage
supply allows the detector to create pulses, which are in turn
amplified and passed to a PC with suitable analysis software.
The software used for the primary stages in the investi-
gation was Ortec®’s Maestro® software, allowing full
energy spectra to be easily analysed. It aided in the con-
figuration of the detector by allowing trivial calculations
of spectral properties to be completed. Signals from the
amplifier were transferred to the software via a multi-
channel buffer.
Firstly, the gain setting of the amplifier in the electronic
system was investigated in an attempt to locate the opti-
mum amplification for signals from the detector to be
read in Maestro®. Maestro® itself operates by placing a
voltage pulse detected in a certain channel for visualisa-
tion. As the gain of the amplifier is increased, the range
over which these voltage pulses are placed widens. For
example, a small amplification will lead to all pulses
from the detector being in a very small range of voltag-
es; hence a very tight spectrum will be observed in
Maestro®, and vice versa for a high amplification. If
amplification is too high, a characteristic gamma energy
peak will be spread widely between channels, and hence
may be difficult to observe. This being the case a wide
range of amplification gains were investigated and a
spectrum taken of Co60 for each one. An amplification
that placed the two Co60 peaks centrally within the
spectrum was considered to be adequate. Gains investi-
gated included 5,8,10,12,15,17.5,20,25 and 30, with a
counting time in Maestro® of 120s to ensure a complete
spectrum was observed. A gain of 20 was eventually
selected (see part III: Results/Discussion).
The high voltage supply was the next electrical compo-
nent to be configured. This voltage over the germanium
crystal within the detector was required to pick up volt-
age signals when a photon event occurred in the crystal.
A voltage that was not substantial enough would mean
photon events would be been missed, hence not being
amplified and subsequently displayed in Maestro®. To
determine the optimum voltage a range of voltages were
selected and an energy spectrum of Co60 taken over 60s.
To assess the change in photon events recorded at each
voltage the net-area of both characteristic peaks of Co60
were measured by Maestro®. [20] A bias voltage of
3.5kV was selected (see part III Results/Discussion).
Although Maestro displays a measured spectrum, it re-
quires calibration to display a spectrum in terms of ener-
gy, and not as previously mentioned, by channel number.
This is a trivial calculation done within Maestro but does
require the user to manually determine the energy of two
points on the spectrum from which the remaining chan-
nel energies can be determined. This was completed
initially with the Co60 source, with known peaks at en-
ergies of 1.17Mev and 1.33Mev [21].
Due to the fact only changes in counts were compared
for the duration of the experiment, and not the change
relative changes in energies of photons hitting the
detecor, an investiagion into the energy efficiency of the
dector was not required, it was assumed that the
efficiency was constant for the duration of all
experimental procedures.
II.III Scanning Movement Set Up
After configuration of the system to detect gamma rays,
a method of moving an object to be scanned was re-
quired. The method implemented consisted of an X-Y
stage to move in two dimensions. Within the stage a
small area was removed to allow a source to be placed
directly behind the object for scanning, creating an emp-
ty scanning area of 40mm x 35mm. The stage also con-
tained a small opening on its reverse side to allow a ra-
Page 4 Cameron Anderson - The Set-Up and Application of a Germanium Gamma Ray Detector
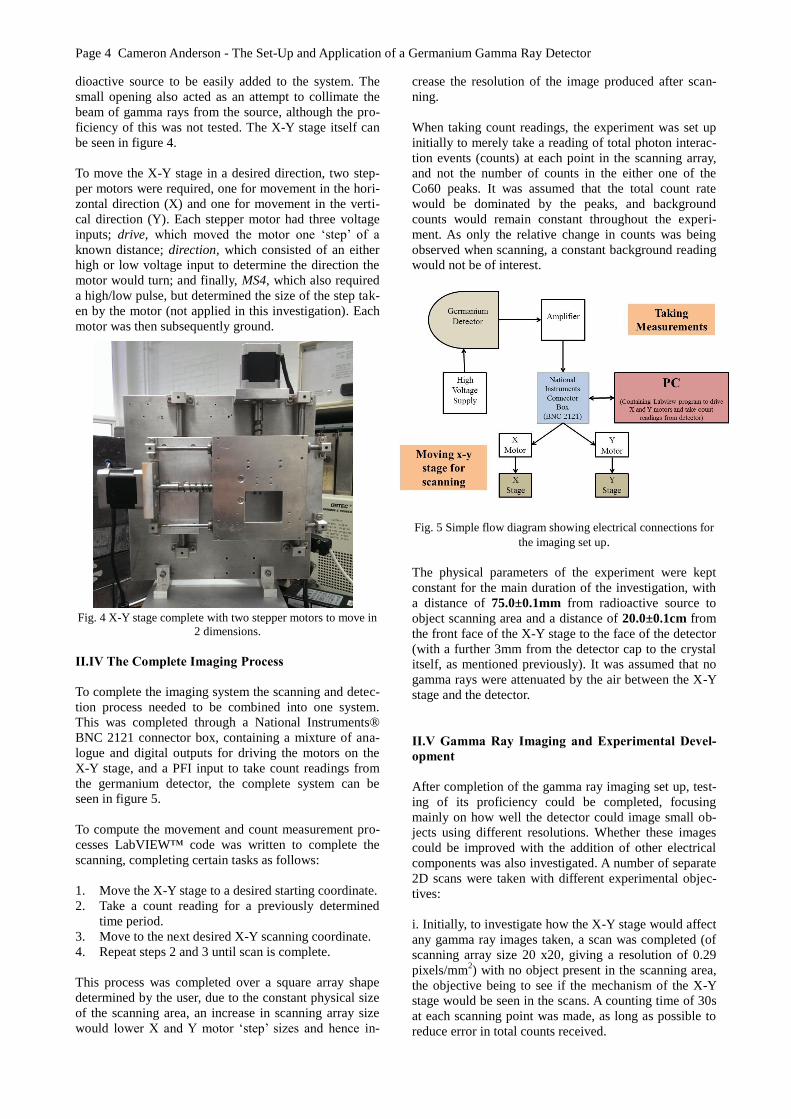
dioactive source to be easily added to the system. The
small opening also acted as an attempt to collimate the
beam of gamma rays from the source, although the pro-
ficiency of this was not tested. The X-Y stage itself can
be seen in figure 4.
To move the X-Y stage in a desired direction, two step-
per motors were required, one for movement in the hori-
zontal direction (X) and one for movement in the verti-
cal direction (Y). Each stepper motor had three voltage
inputs; drive, which moved the motor one ‘step’ of a
known distance; direction, which consisted of an either
high or low voltage input to determine the direction the
motor would turn; and finally, MS4, which also required
a high/low pulse, but determined the size of the step tak-
en by the motor (not applied in this investigation). Each
motor was then subsequently ground.
Fig. 4 X-Y stage complete with two stepper motors to move in
2 dimensions.
II.IV The Complete Imaging Process
To complete the imaging system the scanning and detec-
tion process needed to be combined into one system.
This was completed through a National Instruments®
BNC 2121 connector box, containing a mixture of ana-
logue and digital outputs for driving the motors on the
X-Y stage, and a PFI input to take count readings from
the germanium detector, the complete system can be
seen in figure 5.
To compute the movement and count measurement pro-
cesses LabVIEW™ code was written to complete the
scanning, completing certain tasks as follows:
1. Move the X-Y stage to a desired starting coordinate.
2. Take a count reading for a previously determined
time period.
3. Move to the next desired X-Y scanning coordinate.
4. Repeat steps 2 and 3 until scan is complete.
This process was completed over a square array shape
determined by the user, due to the constant physical size
of the scanning area, an increase in scanning array size
would lower X and Y motor ‘step’ sizes and hence in-
crease the resolution of the image produced after scan-
ning.
When taking count readings, the experiment was set up
initially to merely take a reading of total photon interac-
tion events (counts) at each point in the scanning array,
and not the number of counts in the either one of the
Co60 peaks. It was assumed that the total count rate
would be dominated by the peaks, and background
counts would remain constant throughout the experi-
ment. As only the relative change in counts was being
observed when scanning, a constant background reading
would not be of interest.
Fig. 5 Simple flow diagram showing electrical connections for
the imaging set up.
The physical parameters of the experiment were kept
constant for the main duration of the investigation, with
a distance of 75.0±0.1mm from radioactive source to
object scanning area and a distance of 20.0±0.1cm from
the front face of the X-Y stage to the face of the detector
(with a further 3mm from the detector cap to the crystal
itself, as mentioned previously). It was assumed that no
gamma rays were attenuated by the air between the X-Y
stage and the detector.
II.V Gamma Ray Imaging and Experimental Devel-
opment
After completion of the gamma ray imaging set up, test-
ing of its proficiency could be completed, focusing
mainly on how well the detector could image small ob-
jects using different resolutions. Whether these images
could be improved with the addition of other electrical
components was also investigated. A number of separate
2D scans were taken with different experimental objec-
tives:
i. Initially, to investigate how the X-Y stage would affect
any gamma ray images taken, a scan was completed (of
scanning array size 20 x20, giving a resolution of 0.29
pixels/mm2) with no object present in the scanning area,
the objective being to see if the mechanism of the X-Y
stage would be seen in the scans. A counting time of 30s
at each scanning point was made, as long as possible to
reduce error in total counts received.

Page 5 Cameron Anderson - The Set-Up and Application of a Germanium Gamma Ray Detector
ii. A simple scan was then taken with a small lead strip
of dimensions 36.07±0.07mm x 11.77±0.14mm x
2.92±0.01mm. A scanning array size of 20 x 20 was
chosen for the sole reason that the resultant scan could
have the ‘background scan’ (scan i) taken from it to re-
move any effects of the X-Y stage scanning mechanism.
A counting time of 30s at each point was made allowing
for simple comparison with scan i.
iii. To test how an increased resolution would affect the
image produced by the scanning set up, another scan of
the lead strip from scan ii was taken, but with a resolu-
tion of 0.64 pixels/mm2 (scanning array size of 30 x 30).
This increase in resolution dramatically increased the
time to complete the scan (i.e. from 400 scanning points
to 900 scanning points). The counting time at each point
was chosen to be 60s.
In an attempt to improve the scanning process, it was
decided that a discriminator would be added to the imag-
ing system (between amplification and computation of
voltage pulses) to only accept voltage pulses from the
germanium detector above a certain threshold voltage.
This being the case, only photons registered in the detec-
tor producing voltage pulses over this threshold voltage
would be acknowledged as counts when a scan was
completed.
The set-up of the discriminator was completed using a
voltage pulse generator set at the desired threshold volt-
age. This was completed using the Maestro® software to
visualize the voltage pulses as photon energies. To avoid
tampering with the amplification settings set in part II.II,
an attenuator was added to the system to bring incoming
voltage pulses into the working range of the discrimina-
tor.
For the Co60 source the discriminator was set to remove
any photon events in the detector below an energy of
1.1Mev, as seen in figure 6. This was to ensure that the
total counts at each scanning point were more so domi-
nated by the Co60 energy peaks than previous scans.
Fig. 6 Co60 energy spectrum with dashed line representing the
location of discrimination (1.1Mev) all counts below this value
were not registered in the scanning process.
iv. A scan to test the discriminator’s effect was complet-
ed. This would take the same form as scan iii, a 30 x 30
scan of the same lead strip, the only modification being
the addition of the discriminator.
v. To investigate how apt the detector was in imaging a
less uniform object, a large defect was cut into the side
of the lead strip used in scans iii and iv, the resultant
object can be seen in figure 7. A scan was then complet-
ed (with the discriminator from iv still present) with an
increased scanning array size of 50 x 50 (1.8 pixels/mm2
resolution) in an attempt to see the defect. The counting
time at each point was set to be 37s due to time con-
straints.
vi. In an attempt to see the defect in scan v in more de-
tail, a scan of the top left quadrant of the original scan-
ning area was taken. As before, a 50 x 50 scan was com-
pleted, meaning the resolution in physical space was
increased by 4, with a counting time of 30s at each scan-
ning point.
Fig. 7 Lead strip with defect imaged in scans v and vi with
dimensions shown.
II.VI X-rays and X-ray Fluorescence Scanning
It was hypothesized that if gamma ray imaging with the
germanium detector was successful, that alterations with
the scanning process could lead ultimately to an X-ray
fluorescence scan of an object. Incoming gamma rays
would interact with the object in the scanning area, with
fluorescent X-rays produced by any X-ray producing
materials present in the object for detection.
Before any X-ray fluorescent scans could be taken, in-
vestigations into whether the germanium detector was
capable of observing the lower energies of X-ray pho-
tons were concluded. Due to the very low voltage pulses
from the germanium detector produced by incident X-
rays, a much higher amplification was required to allow
the X-rays to be analysed computationally. A second
amplifier was added to the electrical system in figure 5
and set to a gain of 20, giving an overall gain of 400 for
the whole system.
Page 6 Cameron Anderson - The Set-Up and Application of a Germanium Gamma Ray Detector
To investigate whether the detector was able to detect
energies down to those of the hard X-ray part of the
spectrum, a variable X-ray fluorescence source was
used. The source contained a gamma ray source irradiat-
ing a selected metal, which would in turn emit X-rays
characteristic to that metal with energies displayed in
table 2 [22]. For each metal, a spectrum was taken in
Maestro® to see if X-ray peaks could be observed. Met-
als from the variable X-ray source investigated were
terbium, barium and silver bombarded by an americium-
241 gamma ray source emitting photons of 59.5keV,
with respectively decreasing characteristic X-ray ener-
gies.
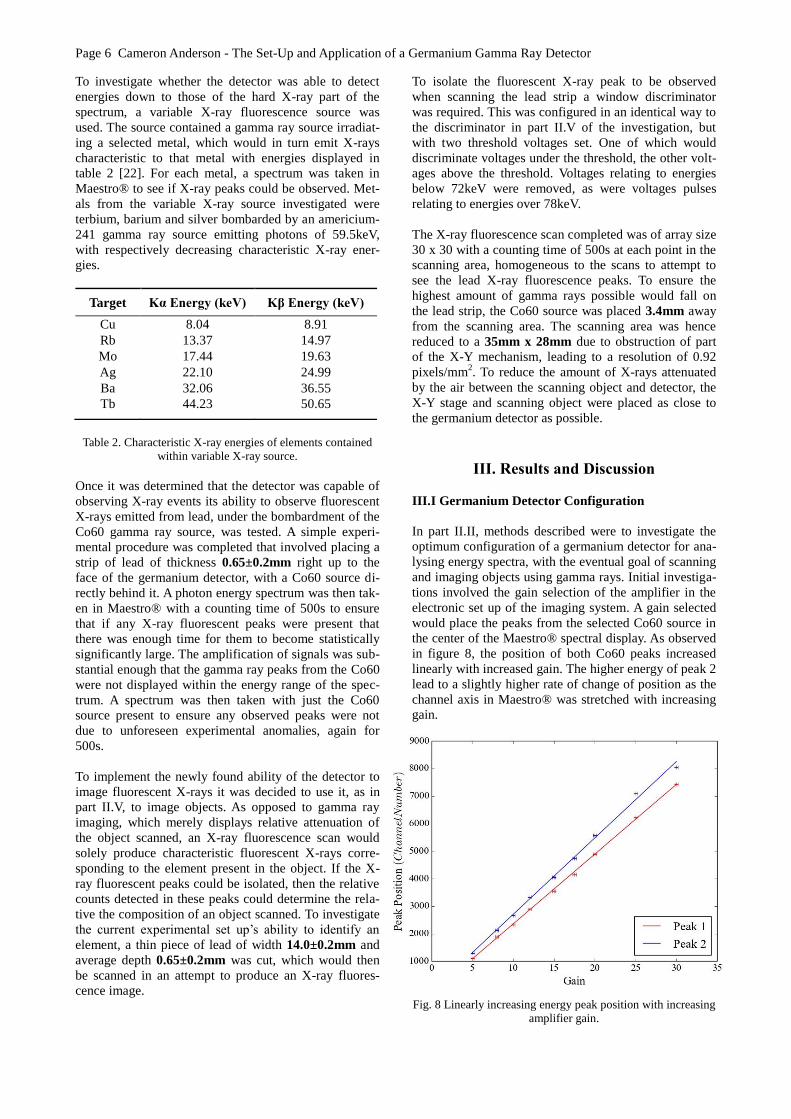
Target Kα Energy (keV) Kβ Energy (keV)
Cu 8.04 8.91
Rb 13.37 14.97
Mo 17.44 19.63
Ag 22.10 24.99
Ba 32.06 36.55
Tb 44.23 50.65
Table 2. Characteristic X-ray energies of elements contained
within variable X-ray source.
Once it was determined that the detector was capable of
observing X-ray events its ability to observe fluorescent
X-rays emitted from lead, under the bombardment of the
Co60 gamma ray source, was tested. A simple experi-
mental procedure was completed that involved placing a
strip of lead of thickness 0.65±0.2mm right up to the
face of the germanium detector, with a Co60 source di-
rectly behind it. A photon energy spectrum was then tak-
en in Maestro® with a counting time of 500s to ensure
that if any X-ray fluorescent peaks were present that
there was enough time for them to become statistically
significantly large. The amplification of signals was sub-
stantial enough that the gamma ray peaks from the Co60
were not displayed within the energy range of the spec-
trum. A spectrum was then taken with just the Co60
source present to ensure any observed peaks were not
due to unforeseen experimental anomalies, again for
500s.
To implement the newly found ability of the detector to
image fluorescent X-rays it was decided to use it, as in
part II.V, to image objects. As opposed to gamma ray
imaging, which merely displays relative attenuation of
the object scanned, an X-ray fluorescence scan would
solely produce characteristic fluorescent X-rays corre-
sponding to the element present in the object. If the X-
ray fluorescent peaks could be isolated, then the relative
counts detected in these peaks could determine the rela-
tive the composition of an object scanned. To investigate
the current experimental set up’s ability to identify an
element, a thin piece of lead of width 14.0±0.2mm and
average depth 0.65±0.2mm was cut, which would then
be scanned in an attempt to produce an X-ray fluores-
cence image.
To isolate the fluorescent X-ray peak to be observed
when scanning the lead strip a window discriminator
was required. This was configured in an identical way to
the discriminator in part II.V of the investigation, but
with two threshold voltages set. One of which would
discriminate voltages under the threshold, the other volt-
ages above the threshold. Voltages relating to energies
below 72keV were removed, as were voltages pulses
relating to energies over 78keV.
The X-ray fluorescence scan completed was of array size
30 x 30 with a counting time of 500s at each point in the
scanning area, homogeneous to the scans to attempt to
see the lead X-ray fluorescence peaks. To ensure the
highest amount of gamma rays possible would fall on
the lead strip, the Co60 source was placed 3.4mm away
from the scanning area. The scanning area was hence
reduced to a 35mm x 28mm due to obstruction of part
of the X-Y mechanism, leading to a resolution of 0.92
pixels/mm2. To reduce the amount of X-rays attenuated
by the air between the scanning object and detector, the
X-Y stage and scanning object were placed as close to
the germanium detector as possible.
III. Results and Discussion
III.I Germanium Detector Configuration
In part II.II, methods described were to investigate the
optimum configuration of a germanium detector for ana-
lysing energy spectra, with the eventual goal of scanning
and imaging objects using gamma rays. Initial investiga-
tions involved the gain selection of the amplifier in the
electronic set up of the imaging system. A gain selected
would place the peaks from the selected Co60 source in
the center of the Maestro® spectral display. As observed
in figure 8, the position of both Co60 peaks increased
linearly with increased gain. The higher energy of peak 2
lead to a slightly higher rate of change of position as the
channel axis in Maestro® was stretched with increasing
gain.
Fig. 8 Linearly increasing energy peak position with increasing
amplifier gain.

Page 7 Cameron Anderson - The Set-Up and Application of a Germanium Gamma Ray Detector
As mentioned previously an increase in gain would
spread out measured energy peaks between channels.
Although this would make the peaks less defined, it was
required to make use of the full range of Maestro®’s
analysis software, leading to a more accurate energy
calibration. Figure 9 shows the effect of a small gain, the
peaks are well defined but very close together.
Fig. 9 Energy Spectrum of Co60 in Maesto® with a gain of 5.
Calibration has not been completed as in figure 6.
It was hence determined that a gain of 20 would be suit-
able for Co60 spectral observations. The subsequent
spectrum taken can be seen in figure 6, but with an ener-
gy calibration completed, converting the channel number
of each peak to an energy using the previously known
energies of Co60 gamma energy peaks.
Following the set-up of the gain for future spectroscopic
measurements, the bias voltage across the germanium
detector was investigated, with results displayed in fig-
ure 10.
Fig. 10 Effect of Bias Voltage across the germnaium detector
of Co60 peak gross area
At very low voltages photon crystal events were missed
by the detector, hence the large difference in peak area at
a voltage of 0.5. As voltage was increased, gross areas of
both peaks increased and subsequently levelled off. A
voltage of 3.5kV was selected to ensure no photon crys-
tal events were missed. Although it was important to
obtain information on how the detector behaved under
different input voltages, it was not crucial for the main
purpose of the investigation due to the fact only relative
drops in count rates would be measured. It can be seen
from figure 10 that a change in bias voltage has a similar
effect on each peak gross area, implying that the voltage
has a similar effect at different photon energies.
III.II Gamma Ray Imaging
After the germanium detector was configured to detect
gamma rays proficiently from the selected Co60 source,
and the X-Y stage pictured in figure 4 was set up to
move as in part II.IV, preliminary scanning could take
place. With scans corresponding to those described in
part II.V:
i. The first completed scan was a ‘background scan' with
no object present in the scanning area. A 20 x 20 scan
led to a resolution of 0.29 pixels/mm2.
Fig. 11 (Scan i) ‘Background’ Scan with no object present in
the scanning area.
Figure 11 clearly shows an attenuating effect of the
mechanism of the X-Y stage. Fortunately it is only in a
small part of the scanning area. The reduction in counts
received by the detector is significant, but it remains to
be seen whether it will be significant enough to affect
subsequent scans.
ii. The primary scan of an object was that of the lead
strip of dimensions 36.07±0.07mm x 11.77±0.14mm x
2.92±0.01mm. With the resultant scan displayed in fig-
ure 12.

Page 8 Cameron Anderson - The Set-Up and Application of a Germanium Gamma Ray Detector
Fig. 12 (Scan ii) First scan of a lead strip
It can be observed in the image that the object scanned is
approximately 10mm in width, similar to that of the
physical object in question. A more precise determina-
tion of width would require a higher resolution scan, due
to one pixel taking up a physical size of 2mm x 1.75mm.
The large drop in count rates of scanning points in the
top of the image was due to the X-Y stage attenuating
gamma rays, homogeneous to scan i. This being the
case, it was determined that a ‘relative’ count scan would
be produced by taking total counts at each scanning
point of the scan ii from the ‘background’ scan i. The
resultant image can be seen in figure 13.
Fig. 13 Combination of scan i and scan ii to create a ‘corrected
scan in an attempt to remove the attentuation of photons due to
the mechanism of the X-Y stage
It appears that the ‘corrected scan’ has been partially
successful in removing the effects of the X-Y stage, es-
pecially in the top left quadrant of the scan. There is still
a though discrepancy between the top of the corrected
scan and the lead strip itself.
After further investigation into the movement of the X-Y
stage, it was determined that an electronic interference
effect was responsible for firstly the slight difference in
the image of the X-Y stage mechanism in scans i and ii,
leading to the ‘corrected scan’ not correctly displaying
the lead strip; and secondly the slight curve in the imag-
es of the lead strip. The interference effect was located in
the wiring of the separate X and Y stepper motors, when
X was programmed to be stationary (whilst Y stepped),
it would step without command, and vice versa. Addi-
tional programming with LabVIEW™ corrected the ef-
fect.
iii. After demonstration that the imaging process could
see the lead strip at low resolution, and the interference
effect from initial scans was dealt with a more in detail
scan of the lead strip could be completed, with a 30 x 30
image produced, leading to a 0.64 pixel/mm2 resolution.
Fig. 14 (Scan iii) Higher resolution scan of lead strip with an
increased resolution and removal of interference effect.
Figure 14 gives an improved image of the lead strip,
demonstrating the success of the interference correction.
The X-Y stage can still though seen to be affecting the
image, and to take another ‘background scan’ as in scan i
would take a large amount of time (due to the difference
in resolution, a simple comparison is not possible as in
figure 13). This being the case it was determined that
any in detail analysis of the image should neglect the top
12mm (≈10 scanning points in y) of the scan, hence pro-
ducing an image with the same resolution but of smaller
physical size. This would give a better lead/background
contrast due to the absence of the X-Y mechanism pho-
ton attenuation.

Page 9 Cameron Anderson - The Set-Up and Application of a Germanium Gamma Ray Detector
Fig. 15 Scan iii with the top of the image removed to eliminate
the image of X-Y stage mechanism.
Figure 15 displays the desired increase in contrast be-
tween the lead and air, the width of the lead strip was
determined from the image to be within the range of
8.0mm to 13.3mm by observation, comparable with the
11.77±0.14mm width of the lead strip.
iv. As described in part II.V, scan iii was repeated with
the same conditions, but now with an addition of a dis-
criminator to the imaging system to remove low energy
photons being counted and subsequently displayed in the
scanning image. The resultant scan is displayed in figure
16.
Fig. 16 (Scan iv) Lead strip scan with discriminator added to
imaging sytem.
The addition of the discriminator has successfully re-
moved the effect of the X-Y mechanism as seen in pre-
liminary scans due to the fact low energy photons pro-
duced by the mechanism’s attenuating effect were not
measured. The removal of low energy photons will have
also removed a large fraction of the assumed constant
‘background’ counts (i.e. photons only partially attenuat-
ed by the lead and any background radiation). Although
figure 16 seems to display the lead strip with a less de-
fined edge than that of figure 14, the lack of gradient
between the background and the lead strip allows for a
more accurate determination (again by observation) of
the width of the strip as within the range of to 9.3mm to
12mm. A higher resolution scan would be needed to pre-
cisely determine the width of the strip.
As a comparison of the scan with and without a discrim-
inator, both images were plotted with the same colour
bar in an attempt to identify whether the discriminator
scan returns an image with better contrast (for this to be
completed, the count totals in scan iv were scaled up by
a factor of seven to bring them in the range of scan iii).
The resultant images are displayed in figure 17, showing
a higher contrast between counts within and outside the
lead strip in the discriminator scan.
Fig. 17 Scans iii (right) and iv (left) plotted with same relative
colour bar to show the increased contrast produced by the addi-
tion of the discriminator.
Due to the lower counts recorded using the discrimina-
tor, the percentage error in these count rates will be larg-
er than the scan without the discriminator present. It was
determined though that the increase in percentage error
did not have a large effect on the colour gradient of the
scan when observed in figure 16. It must be noted
though that if a quick scan were to be completed (one
with a small counting time at each scanning array point),
the larger errors on count totals in the discriminator scan
would make the set-up without the discriminator prefer-
able.
It was determined that for the duration of scanning with
gamma rays that the discriminator would remain in the
imaging system due to its ability to achieve superior
contrast and remove the X-Y stage mechanism from
images, neglecting the need to cut down scans, as with
scan iii.
v. To test further the abilities of the scanning set up, a
scan of the lead strip with a defect cut (figure 7) was
completed. An increased resolution of 1.8pixels/mm2
was configured in an attempt to see the defect, with the
resultant scan in figure 18.
Page 10 Cameron Anderson - The Set-Up and Application of a Germanium Gamma Ray Detector
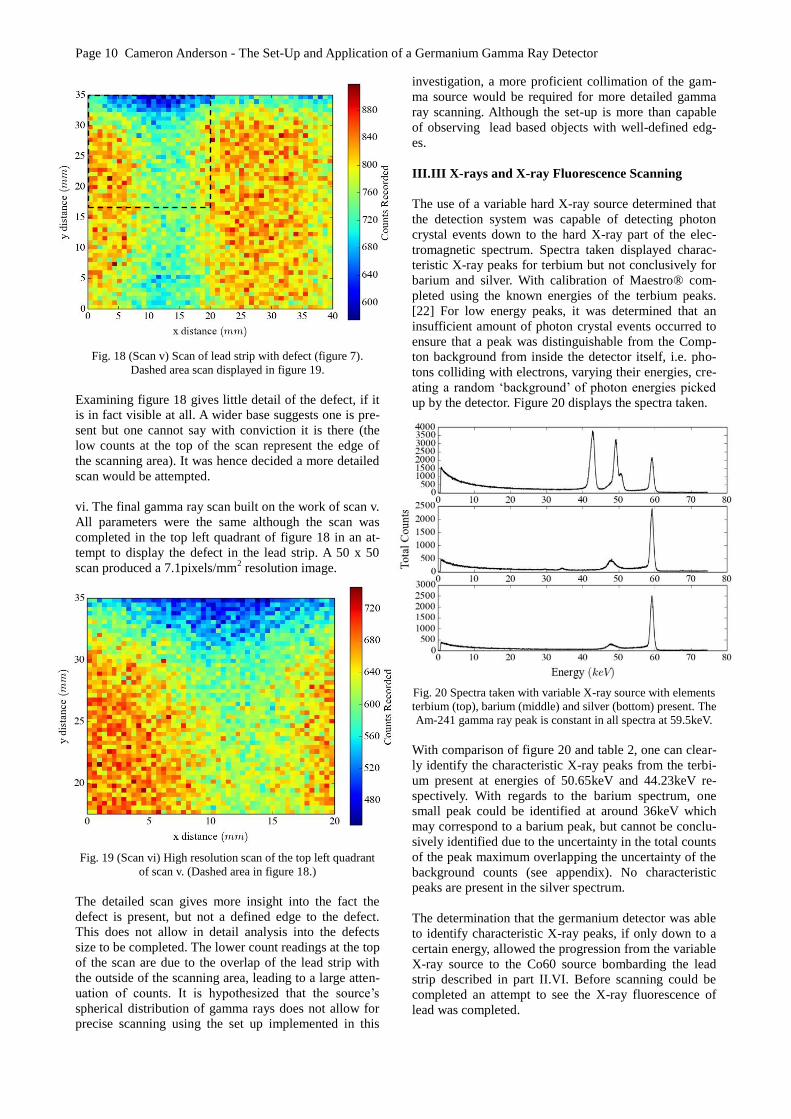
Fig. 18 (Scan v) Scan of lead strip with defect (figure 7).
Dashed area scan displayed in figure 19.
Examining figure 18 gives little detail of the defect, if it
is in fact visible at all. A wider base suggests one is pre-
sent but one cannot say with conviction it is there (the
low counts at the top of the scan represent the edge of
the scanning area). It was hence decided a more detailed
scan would be attempted.
vi. The final gamma ray scan built on the work of scan v.
All parameters were the same although the scan was
completed in the top left quadrant of figure 18 in an at-
tempt to display the defect in the lead strip. A 50 x 50
scan produced a 7.1pixels/mm2 resolution image.
Fig. 19 (Scan vi) High resolution scan of the top left quadrant
of scan v. (Dashed area in figure 18.)
The detailed scan gives more insight into the fact the
defect is present, but not a defined edge to the defect.
This does not allow in detail analysis into the defects
size to be completed. The lower count readings at the top
of the scan are due to the overlap of the lead strip with
the outside of the scanning area, leading to a large atten-
uation of counts. It is hypothesized that the source’s
spherical distribution of gamma rays does not allow for
precise scanning using the set up implemented in this
investigation, a more proficient collimation of the gam-
ma source would be required for more detailed gamma
ray scanning. Although the set-up is more than capable
of observing lead based objects with well-defined edg-
es.
III.III X-rays and X-ray Fluorescence Scanning
The use of a variable hard X-ray source determined that
the detection system was capable of detecting photon
crystal events down to the hard X-ray part of the elec-
tromagnetic spectrum. Spectra taken displayed charac-
teristic X-ray peaks for terbium but not conclusively for
barium and silver. With calibration of Maestro® com-
pleted using the known energies of the terbium peaks.
[22] For low energy peaks, it was determined that an
insufficient amount of photon crystal events occurred to
ensure that a peak was distinguishable from the Comp-
ton background from inside the detector itself, i.e. pho-
tons colliding with electrons, varying their energies, cre-
ating a random ‘background’ of photon energies picked
up by the detector. Figure 20 displays the spectra taken.
Fig. 20 Spectra taken with variable X-ray source with elements
terbium (top), barium (middle) and silver (bottom) present. The
Am-241 gamma ray peak is constant in all spectra at 59.5keV.
With comparison of figure 20 and table 2, one can clear-
ly identify the characteristic X-ray peaks from the terbi-
um present at energies of 50.65keV and 44.23keV re-
spectively. With regards to the barium spectrum, one
small peak could be identified at around 36keV which
may correspond to a barium peak, but cannot be conclu-
sively identified due to the uncertainty in the total counts
of the peak maximum overlapping the uncertainty of the
background counts (see appendix). No characteristic
peaks are present in the silver spectrum.
The determination that the germanium detector was able
to identify characteristic X-ray peaks, if only down to a
certain energy, allowed the progression from the variable
X-ray source to the Co60 source bombarding the lead
strip described in part II.VI. Before scanning could be
completed an attempt to see the X-ray fluorescence of
lead was completed.
Page 11 Cameron Anderson - The Set-Up and Application of a Germanium Gamma Ray Detector
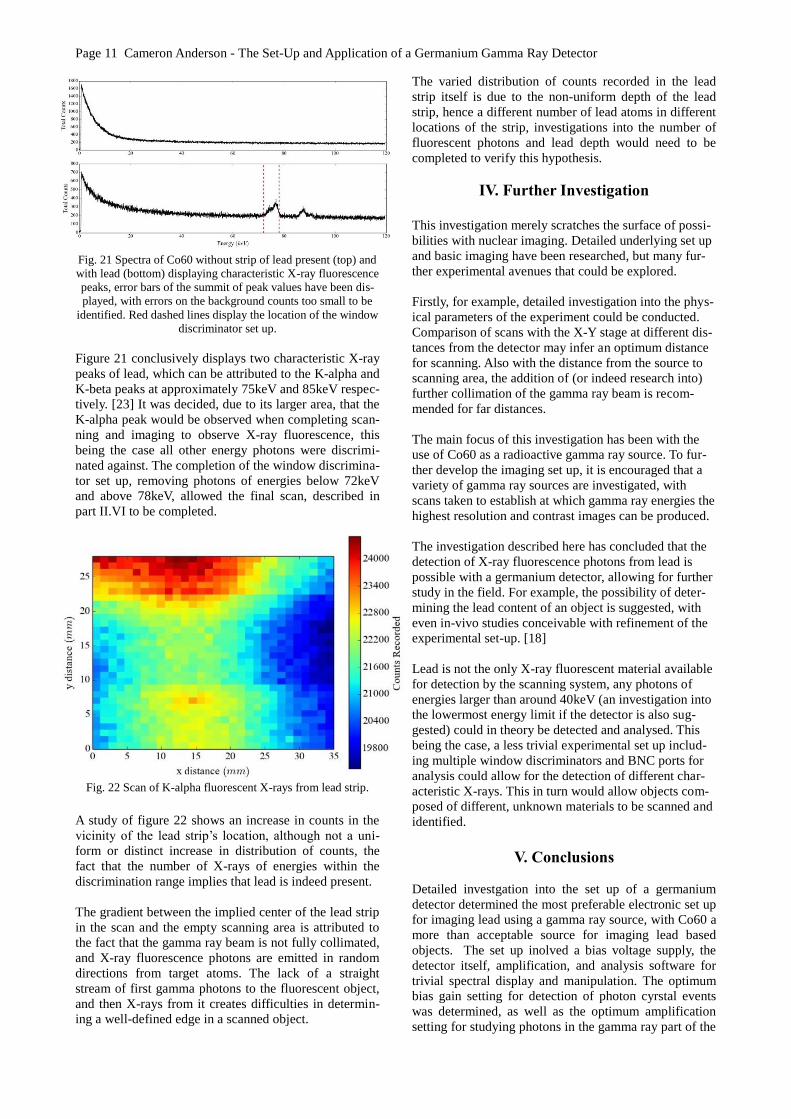
Fig. 21 Spectra of Co60 without strip of lead present (top) and
with lead (bottom) displaying characteristic X-ray fluorescence
peaks, error bars of the summit of peak values have been dis-
played, with errors on the background counts too small to be
identified. Red dashed lines display the location of the window
discriminator set up.
Figure 21 conclusively displays two characteristic X-ray
peaks of lead, which can be attributed to the K-alpha and
K-beta peaks at approximately 75keV and 85keV respec-
tively. [23] It was decided, due to its larger area, that the
K-alpha peak would be observed when completing scan-
ning and imaging to observe X-ray fluorescence, this
being the case all other energy photons were discrimi-
nated against. The completion of the window discrimina-
tor set up, removing photons of energies below 72keV
and above 78keV, allowed the final scan, described in
part II.VI to be completed.
Fig. 22 Scan of K-alpha fluorescent X-rays from lead strip.
A study of figure 22 shows an increase in counts in the
vicinity of the lead strip’s location, although not a uni-
form or distinct increase in distribution of counts, the
fact that the number of X-rays of energies within the
discrimination range implies that lead is indeed present.
The gradient between the implied center of the lead strip
in the scan and the empty scanning area is attributed to
the fact that the gamma ray beam is not fully collimated,
and X-ray fluorescence photons are emitted in random
directions from target atoms. The lack of a straight
stream of first gamma photons to the fluorescent object,
and then X-rays from it creates difficulties in determin-
ing a well-defined edge in a scanned object.
The varied distribution of counts recorded in the lead
strip itself is due to the non-uniform depth of the lead
strip, hence a different number of lead atoms in different
locations of the strip, investigations into the number of
fluorescent photons and lead depth would need to be
completed to verify this hypothesis.
IV. Further Investigation
This investigation merely scratches the surface of possi-
bilities with nuclear imaging. Detailed underlying set up
and basic imaging have been researched, but many fur-
ther experimental avenues that could be explored.
Firstly, for example, detailed investigation into the phys-
ical parameters of the experiment could be conducted.
Comparison of scans with the X-Y stage at different dis-
tances from the detector may infer an optimum distance
for scanning. Also with the distance from the source to
scanning area, the addition of (or indeed research into)
further collimation of the gamma ray beam is recom-
mended for far distances.
The main focus of this investigation has been with the
use of Co60 as a radioactive gamma ray source. To fur-
ther develop the imaging set up, it is encouraged that a
variety of gamma ray sources are investigated, with
scans taken to establish at which gamma ray energies the
highest resolution and contrast images can be produced.
The investigation described here has concluded that the
detection of X-ray fluorescence photons from lead is
possible with a germanium detector, allowing for further
study in the field. For example, the possibility of deter-
mining the lead content of an object is suggested, with
even in-vivo studies conceivable with refinement of the
experimental set-up. [18]
Lead is not the only X-ray fluorescent material available
for detection by the scanning system, any photons of
energies larger than around 40keV (an investigation into
the lowermost energy limit if the detector is also sug-
gested) could in theory be detected and analysed. This
being the case, a less trivial experimental set up includ-
ing multiple window discriminators and BNC ports for
analysis could allow for the detection of different char-
acteristic X-rays. This in turn would allow objects com-
posed of different, unknown materials to be scanned and
identified.
V. Conclusions
Detailed investgation into the set up of a germanium
detector determined the most preferable electronic set up
for imaging lead using a gamma ray source, with Co60 a
more than acceptable source for imaging lead based
objects. The set up inolved a bias voltage supply, the
detector itself, amplification, and analysis software for
trivial spectral display and manipulation. The optimum
bias gain setting for detection of photon cyrstal events
was determined, as well as the optimum amplification
setting for studying photons in the gamma ray part of the
Page 12 Cameron Anderson - The Set-Up and Application of a Germanium Gamma Ray Detector
spectrum in the Maestro® spectral analysis software.
The addition of a discriminator was also investgiated,
which removed some scanning artefacts and led to more
defined images. The addtion of the discriminator lowers
the amount of counts recorded by the detector per unit
time, hence a quick scan will yield high errors on count
rates. It may be preferable for a scan requiring
completion in a limited amount of time to not have the
discrimintor present.
The physical set up of the scanning system was kept
constant through primary scanning, investigations into
the effect of altering the set-up is suggested as possible
further study.
Primary scanning of a simple object implied the
scanning set up was capable of producing images
consistent with the object placed in the scanning area,
allowing for an estimate of the object’s physical size,
with the addition of the discriminator refining this
process. There were limitations to the method, testing
with an artefact cut into a small lead strip led to
difficulties in imaging the defect, increasing image
resolution allowed the presence of the artefact to be
detected but not its physical size to be determined. It is
hence implied that the system described here can be used
to identify well defined objects, with small imperfections
deemed too small to be imaged accurately, although their
presence may be identifiable.
Development from imaging simply with gamma rays led
to investigations into whether the germanium detector
was capable of observing photons in the hard X-ray part
of the spectrum, with photon energies down to approxi-
mately 40keV detected. Although it is suggested that in
detail study could more accurately determine the lower-
most energy capable of observation with a germanium
detector.
The observation of fluorescent X-rays was applied to a
similar process used to image using gamma rays in the
primary part of the experiment. Bombarding a thin strip
of lead was with Co60 and discriminating against pho-
tons not in its K-alpha characteristic X-ray peak allowed
an X-ray fluorescence scan to be produced. This in turn,
due to the specificity of the energy of the X-ray peak,
allowed the item to be determined as lead. Many devel-
opments of this notion are suggested, with the main aim
to determine the relative composition of an unknown
object.
To conclude, the use of gamma ray and hard X-ray pho-
tons allow for a huge depth of study into the size, struc-
ture and composition of materials, of which the basic
principles have been studied within this investigation.
Further study refining the processes described here
would allow for the set-up of an imaging system more
than appropriate for location in academic study and in-
dustrial environments.
Acknowledgements: The author would like to thank Dr.
Ian Terry and Paul Branch for their help and guidance
for the duration of the experiment.
References
[1, 3] K. S. Krane, Introductory Nuclear Physics, 2nd
edition , John Wiley & Sons Inc. , USA (1988) p.i, p.327
[2] M. N. Wernick, J. N. Aarsvold, Emission Tomogra-
phy: The Fundamentals of PET and SPECT, Elsevier
Inc., UK (2004) p.3
[4] G. Nelson, D. Reilly, Gamma-Ray Interactions with
Matter, Passive Nondestructive Analysis of Nuclear Ma-
terials, Los Alamos National Laboratory, LA-UR 90-
732, (1991) p.32
[5] F. Ajzenberg-Selove(edited), Nuclear Spectroscopy –
Part A, Academic Press Inc. , UK (1960) p.211
[6, 7, 14, 19] G. Gilmore, Practical Gamma-ray Spec-
trometry, 2nd
Edition, John Wiley & Sons Ltd., England
(2008) p.22, p.41, p.22, p.5
[8] R. Bourne, Fundamentals of Digital Imaging in Med-
icine, Springer Science & Business Media, UK (2010)
p.35
[9] T.C. Weekes, Very High Energy Gamma-Rau As-
tronomy, IOP Publishing Ltd, UK (2003) p.3
[10] H. Karttunen et al., Fundamental Astronomy, Fifth
Edition, Springer, USA (2007) p.76
[11, 12] H. Aichinger et al., Radiation Exposure and
Image Quality in X-ray Diagnostic Radiology, Second
Edition, Springer, Germany (2012) p.13, p.14
[13] C. Zhang, Fundamentals of Environmental Sam-
pling and Analysis, John Wiley & Sons Inc., USA
(2007) p.227
[15, 17] W.Bambynek, B. Crasemann et al. , X-Ray Flu-
orsecence Yeilds, Auger, and Coster-Kronig Transition
Probabilities, Reviews of Modern Physics, Vol. 44,
Number 4 (1972) p.718, p.718
[16] R. Klockenkamper, A. von Bohlen and L. Moens,
Analysis of Pigments and Inks on Oil Paintings and His-
torical Manuscripts Using Total Reflection X-Ray Fluo-
rescence Spectrometry, X-Ray Spectrom. 29, 119–129
(2000) p.119
[18] L. Ahlgren, K. Liden et al. X-ray fluorescence anal-
ysis of lead in human skeleton in vivo, Scand. j. work
environ. & health 2 82 – 86 (1976) p.82
[20] Ortec®, Maestro®-32 MCA Emulator Software
User’s Manual, Advanced Measurement Technology,
Inc. USA (2006),
(http://web.mit.edu/8.13/8.13d/manuals/Ortec-
MAESTRO-software-manual.pdf) p.76
[21] Laboratoire National Henri Becquerel,
http://www.nucleide.org/DDEP_WG/Nuclides/Co-
60_tables.pdf, 2014
[22] MIT Department of Physics, X-ray Physics, Id:
31.xrays.tex,v 1.22 2007/08/29 (2014) p.6
[23] Ametek®, http://www.amptek.com/charge-
trapping-in-xr-100t-cdte-cadmium-telluride-detectors-
application-note/, 2014
[24, 25, 26] I. G. Hughes and T. P. A. Hase, Measure-
ments and Their Uncertainties, Oxford University Press,
Oxford (2010) p.30, p.44, p.20

Page 13 Cameron Anderson - The Set-Up and Application of a Germanium Gamma Ray Detector
Errors Appendix
For the duration of the experiment it was assumed the
use of Poisson statistics was appropriate for analysing
counting events. This being the case it was taken that if
the experiment yielded a mean count of N, the best esti-
mate of the error was taken to be the root of this value
[24], reporting the measurement as,
𝑁 ± √𝑁. (A.1)
On the determination of spectral peaks, it was hypothe-
sied that a peak could be said to be distinguished from
the ‘background’ photon energies if the error bars of the
reading of the peak maximum and a subsequent back-
ground count reading in the vicinity of the peak did not
overlap.
When analysing spectra in the Maestro® software the
determination of errors came straight from the Oretc®’s
Maestro® software manual or were displayed by the
program itself. For example, an uncertainty of 5 was
quoted by the measurement software when determining
the channel position of peaks in part II.II of the investi-
gation. When a measurement of peak area was taken
subsequently in this part of the experiment, the gross
area of the peak was quoted to have an error identical to
that of a single count reading, the square root of the
measured value (i.e. √𝑁 ). [20]
The lack of detailed error analysis made study of gamma
ray images quick and trivial, as mentioned previously, it
was assumed all total count readings had a simple square
root error. The one exception to this was in part II.V
where scans i and ii were compared to produce a ‘cor-
rected’ scan in an attempt to remove the effects of the X-
Y stage used in the investigation. The subtraction of two
count totals at each scanning point required the use of
propagation of errors through a function of subtraction
[25], given by
𝛼𝑐 = √(𝛼𝑏)2 + (𝛼𝑙)2, (A.2)
where αb is the error in the counts at each point in the
‘background’ scan (scan i) and αl the error in counts at
each point in the lead strip scan (scan ii). αc hence is the
combined error of counts at each scanning point in the
corrected scan (figure 13).
Diverging away from errors relating to radioactive count
rates and to more trivial matters, when determining the
error on physical measurements, for example, lead strip
dimensions. The error on mean measurements was simp-
ly taken as the standard error of the mean [26],
𝛼 =𝜎𝑁−1
√𝑁, (A.3)
with σN-1 taken to be the standard deviation of measure-
ments, and N the number of measurements taken.
The final values that require justification of error values
was those of gain and bias voltage in part II.II of the
experiment. These were taken simply to be double the
smallest division on the analogue dials on the electronic
systems to account for any electrical inaccuracy. These
were taken to be 0.2 and 0.02V respectively.