435900-Bio-Rad IR Inorganics Bio-Rad Sadtler Spectral Database

Let’s RAD:Rendezvous Around Data
March 18, 2016
Meeting facilitated by
Nathalie Franco, Rowena Hernandez-Muzquiz, Michelle Jackson, Trish Joyce, David Perdian, Barbara J. Rodriguez, Patrick Sammon, Jr.

Agenda
Provide an overview of the QEP assessment & evaluation plan
Review the concept of assessment
Share 2014-2015 assessment results for QEP direct and indirect measures
Work collaboratively to use results for continuous improvement

QEP Assessment & Evaluation Plan
Student Artifacts– Direct Measure
10 (100%) of the 10 faculty provided student artifacts for scoring (Fall 2014).
29 (97%) of the 30 faculty provided student artifacts for scoring (Spring 2015).
Systematic sampling was used to select the student artifacts to score from the designated enhanced classes (276 artifacts selected for both terms).
A team of QEP scorers, none were QEP Scholars, scored artifacts using BC’s CT Scoring Guide.
Each artifact was scored by 2 independent scorers who assigned a score of 1-4 points for each outcome.

QEP Assessment & Evaluation Plan
Faculty Focus Survey– Indirect Measure
Administered each Spring term
Emailed electronically to all Broward
College faculty (part-time and full-time)
Focuses on questions related to critical
thinking, teaching strategies, and
outcomes-based assessment
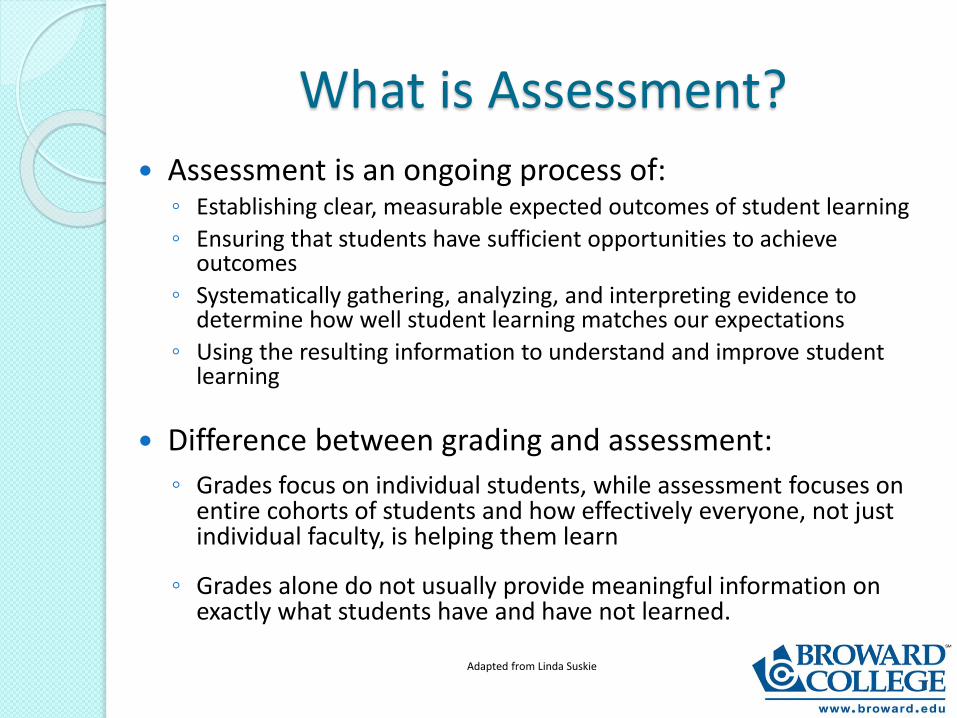
What is Assessment?
Assessment is an ongoing process of:◦ Establishing clear, measurable expected outcomes of student learning
◦ Ensuring that students have sufficient opportunities to achieve outcomes
◦ Systematically gathering, analyzing, and interpreting evidence to determine how well student learning matches our expectations
◦ Using the resulting information to understand and improve student learning
Difference between grading and assessment:
◦ Grades focus on individual students, while assessment focuses on entire cohorts of students and how effectively everyone, not just individual faculty, is helping them learn
◦ Grades alone do not usually provide meaningful information on exactly what students have and have not learned.
Adapted from Linda Suskie

What is Assessment?
Difference between assessment and research
◦ Traditional empirical research is conducted to test theories, while assessment is a form of action research.
◦ The purpose of action research is to inform and improve one’s own practice rather than make broad generalizations.
◦ Four step process of action research: plan, act, observe, reflect
Adopted from Linda Suskie

“Our Assessment”
◦ Summative assessment may be too late to help current students, but can be used to make changes affecting subsequent students
◦ Embedded assessments for 39 of the 40 courses during 2014-2015; one Add-on assessment
◦ Faculty developed Performance-based/Authentic-based and traditional assessments for their designated courses:
Performance-based: students demonstrate their skills rather than relate what they’ve learned through traditional tests. Ex. Writing assignments, projects, laboratory and studio assignments.
Authentic-based: performance-based assessments that ask students to do real-life tasks, such as analyzing case studies with bona-fide data, conducting realistic laboratory experiments, or completing internships.
Traditional: multiple-choice tests, essay tests, and oral examinations. Essay test questions and oral examinations straddle the line between traditional and performance assessments
Definitions from Linda Suskie’s book, Assessing Student Learning
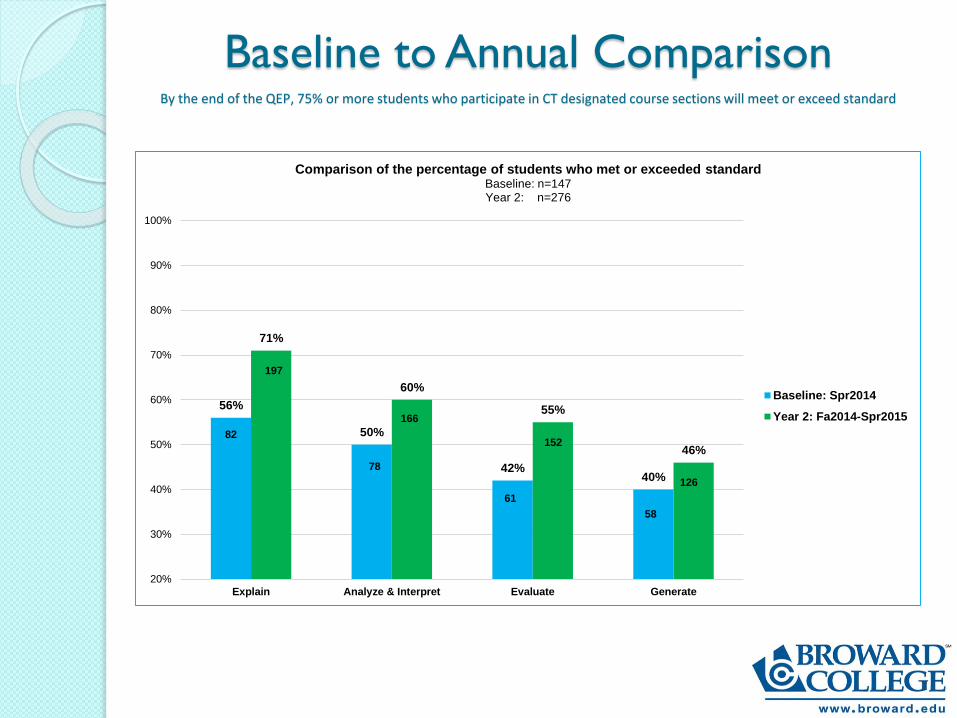
Baseline to Annual ComparisonBy the end of the QEP, 75% or more students who participate in CT designated course sections will meet or exceed standard
56%
50%
42%40%
71%
60%
55%
46%
20%
30%
40%
50%
60%
70%
80%
90%
100%
Explain Analyze & Interpret Evaluate Generate
Comparison of the percentage of students who met or exceeded standardBaseline: n=147Year 2: n=276
Baseline: Spr2014
Year 2: Fa2014-Spr2015
78
61
58
197
166
152
126
82

Student Sample Size by Proficiency and Outcome2014-2015
3 821
41
76
102103
109
153
137134
110
4429 18 16
0
50
100
150
200
250
300
Explain Analyze & Interpret Evaluate Generate
Exceeds Standard Demonstrates Standard Approaches Standard Below Standard
n=276
40% of Student Artifacts Collected from Enhanced Courses
46% met/exceeded60% met/exceeded 55% met/exceeded71% met/exceeded
Guiding QuestionsStudent Artifacts– Direct Measure
1. What are the major conclusions you would draw about the students’ ability to master each of the learning outcomes?
a. Explain problems, questions, and/or issues
b. Analyze and Interpret relevant information
c. Evaluate information to determine potential conclusions
d. Generate a well-reasoned conclusion
2. Do the results indicate any strengths; if so, what are the strengths?
3. What concerns, if any, are raised by the results?
4. What are some recommendations for using these results to improve learning?

Guiding QuestionsCCSSE/CCFSSE
1. What are the major conclusions you would draw about faculty perception about any/all questions from Faculty Focus Survey?
2. Do the results indicate any strengths; if so, what are the strengths?
3. What concerns, if any, are raised by the results?
4. What are some recommendations for using these results, in conjunction with the results from the student artifacts, to improve learning, pedagogical/andragogical practices, and QEP process?

Thank you! Assessment results are located on
the QEP website at www.broward.edu/qep