Lessons learned from China’s solar policies: Implications ...
Upload
nguyendangCategory
view
216download
0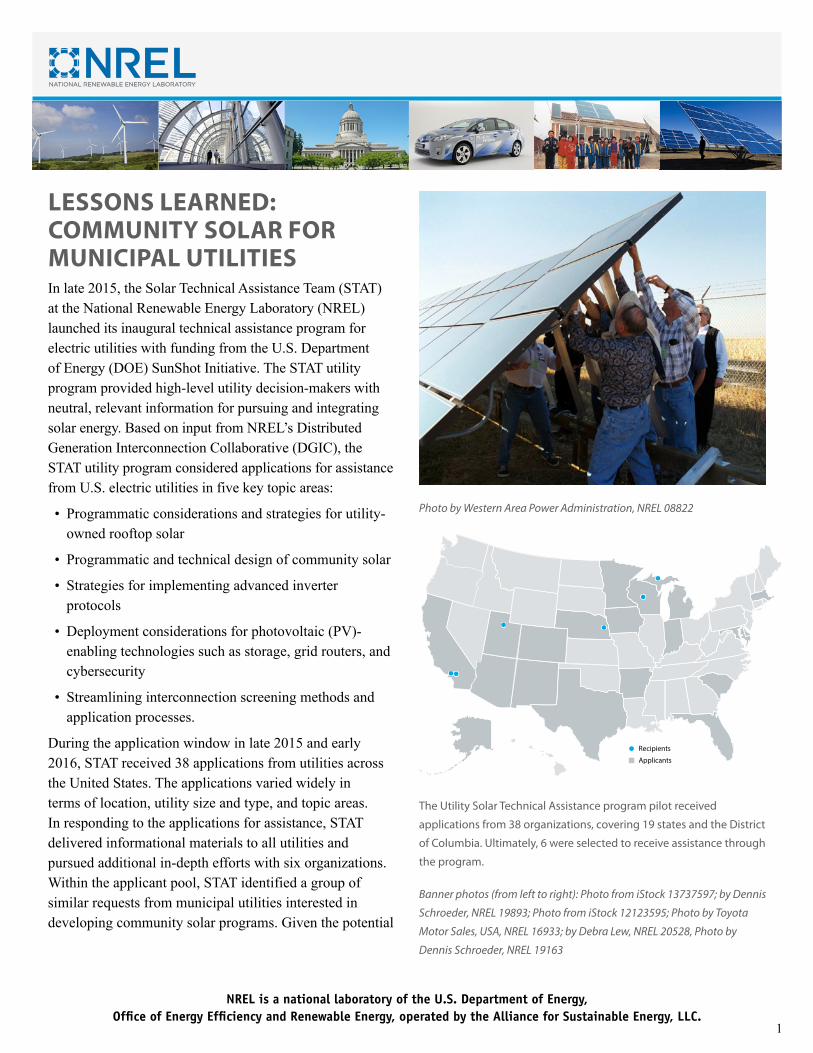
NREL is a national laboratory of the U.S. Department of Energy, Office of Energy Efficiency and Renewable Energy, operated by the Alliance for Sustainable Energy, LLC.
1
LESSONS LEARNED: COMMUNITY SOLAR FOR MUNICIPAL UTILITIESIn late 2015, the Solar Technical Assistance Team (STAT) at the National Renewable Energy Laboratory (NREL) launched its inaugural technical assistance program for electric utilities with funding from the U.S. Department of Energy (DOE) SunShot Initiative. The STAT utility program provided high-level utility decision-makers with neutral, relevant information for pursuing and integrating solar energy. Based on input from NREL’s Distributed Generation Interconnection Collaborative (DGIC), the STAT utility program considered applications for assistance from U.S. electric utilities in five key topic areas:
• Programmatic considerations and strategies for utility-owned rooftop solar
• Programmatic and technical design of community solar
• Strategies for implementing advanced inverter protocols
• Deployment considerations for photovoltaic (PV)-enabling technologies such as storage, grid routers, and cybersecurity
• Streamlining interconnection screening methods and application processes.
During the application window in late 2015 and early 2016, STAT received 38 applications from utilities across the United States. The applications varied widely in terms of location, utility size and type, and topic areas. In responding to the applications for assistance, STAT delivered informational materials to all utilities and pursued additional in-depth efforts with six organizations. Within the applicant pool, STAT identified a group of similar requests from municipal utilities interested in developing community solar programs. Given the potential
Photo by Western Area Power Administration, NREL 08822
Banner photos (from left to right): Photo from iStock 13737597; by Dennis
Schroeder, NREL 19893; Photo from iStock 12123595; Photo by Toyota
Motor Sales, USA, NREL 16933; by Debra Lew, NREL 20528, Photo by
Dennis Schroeder, NREL 19163
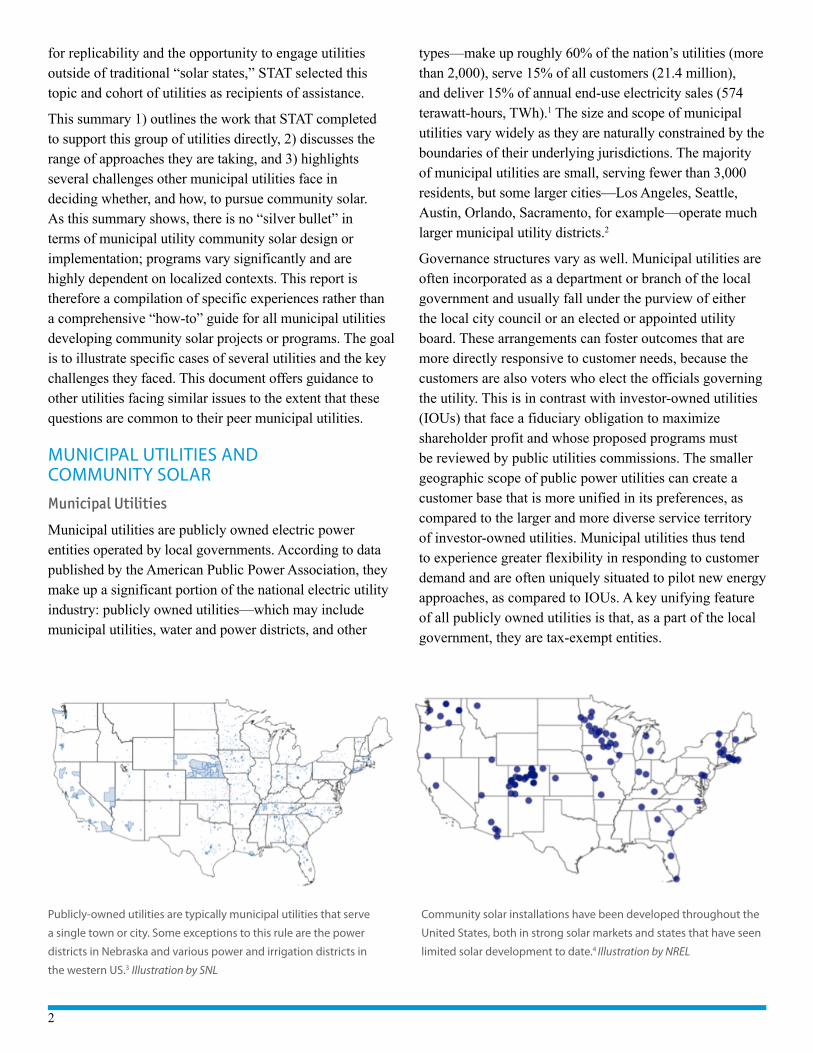
Recipients
Applicants
The Utility Solar Technical Assistance program pilot received
applications from 38 organizations, covering 19 states and the District
of Columbia. Ultimately, 6 were selected to receive assistance through
the program.
2
for replicability and the opportunity to engage utilities outside of traditional “solar states,” STAT selected this topic and cohort of utilities as recipients of assistance.
This summary 1) outlines the work that STAT completed to support this group of utilities directly, 2) discusses the range of approaches they are taking, and 3) highlights several challenges other municipal utilities face in deciding whether, and how, to pursue community solar. As this summary shows, there is no “silver bullet” in terms of municipal utility community solar design or implementation; programs vary significantly and are highly dependent on localized contexts. This report is therefore a compilation of specific experiences rather than a comprehensive “how-to” guide for all municipal utilities developing community solar projects or programs. The goal is to illustrate specific cases of several utilities and the key challenges they faced. This document offers guidance to other utilities facing similar issues to the extent that these questions are common to their peer municipal utilities.
MUNICIPAL UTILITIES AND COMMUNITY SOLARMunicipal Utilities
Municipal utilities are publicly owned electric power entities operated by local governments. According to data published by the American Public Power Association, they make up a significant portion of the national electric utility industry: publicly owned utilities—which may include municipal utilities, water and power districts, and other
types—make up roughly 60% of the nation’s utilities (more than 2,000), serve 15% of all customers (21.4 million), and deliver 15% of annual end-use electricity sales (574 terawatt-hours, TWh).1 The size and scope of municipal utilities vary widely as they are naturally constrained by the boundaries of their underlying jurisdictions. The majority of municipal utilities are small, serving fewer than 3,000 residents, but some larger cities—Los Angeles, Seattle, Austin, Orlando, Sacramento, for example—operate much larger municipal utility districts.2
Governance structures vary as well. Municipal utilities are often incorporated as a department or branch of the local government and usually fall under the purview of either the local city council or an elected or appointed utility board. These arrangements can foster outcomes that are more directly responsive to customer needs, because the customers are also voters who elect the officials governing the utility. This is in contrast with investor-owned utilities (IOUs) that face a fiduciary obligation to maximize shareholder profit and whose proposed programs must be reviewed by public utilities commissions. The smaller geographic scope of public power utilities can create a customer base that is more unified in its preferences, as compared to the larger and more diverse service territory of investor-owned utilities. Municipal utilities thus tend to experience greater flexibility in responding to customer demand and are often uniquely situated to pilot new energy approaches, as compared to IOUs. A key unifying feature of all publicly owned utilities is that, as a part of the local government, they are tax-exempt entities.
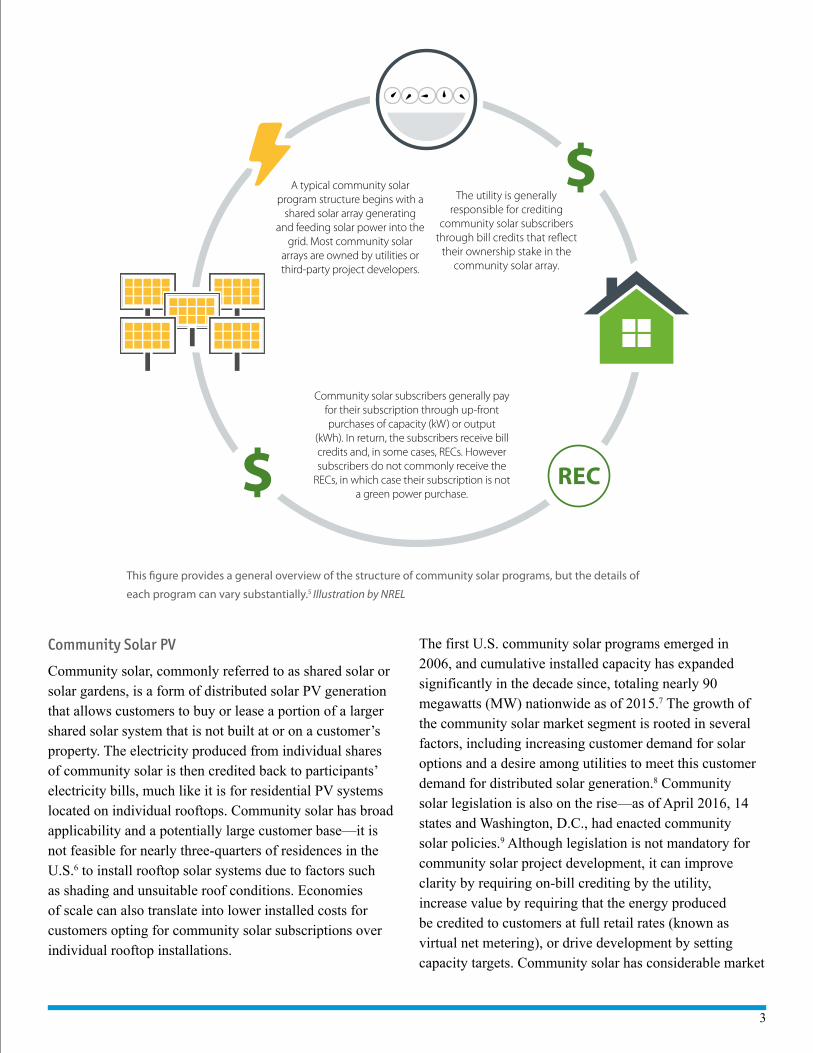
Publicly-owned utilities are typically municipal utilities that serve
a single town or city. Some exceptions to this rule are the power
districts in Nebraska and various power and irrigation districts in
the western US.3 Illustration by SNL
Community solar installations have been developed throughout the
United States, both in strong solar markets and states that have seen
limited solar development to date.4 Illustration by NREL
3
Community Solar PV
Community solar, commonly referred to as shared solar or solar gardens, is a form of distributed solar PV generation that allows customers to buy or lease a portion of a larger shared solar system that is not built at or on a customer’s property. The electricity produced from individual shares of community solar is then credited back to participants’ electricity bills, much like it is for residential PV systems located on individual rooftops. Community solar has broad applicability and a potentially large customer base—it is not feasible for nearly three-quarters of residences in the U.S.6 to install rooftop solar systems due to factors such as shading and unsuitable roof conditions. Economies of scale can also translate into lower installed costs for customers opting for community solar subscriptions over individual rooftop installations.
The first U.S. community solar programs emerged in 2006, and cumulative installed capacity has expanded significantly in the decade since, totaling nearly 90 megawatts (MW) nationwide as of 2015.7 The growth of the community solar market segment is rooted in several factors, including increasing customer demand for solar options and a desire among utilities to meet this customer demand for distributed solar generation.8 Community solar legislation is also on the rise—as of April 2016, 14 states and Washington, D.C., had enacted community solar policies.9 Although legislation is not mandatory for community solar project development, it can improve clarity by requiring on-bill crediting by the utility, increase value by requiring that the energy produced be credited to customers at full retail rates (known as virtual net metering), or drive development by setting capacity targets. Community solar has considerable market
$
$ REC
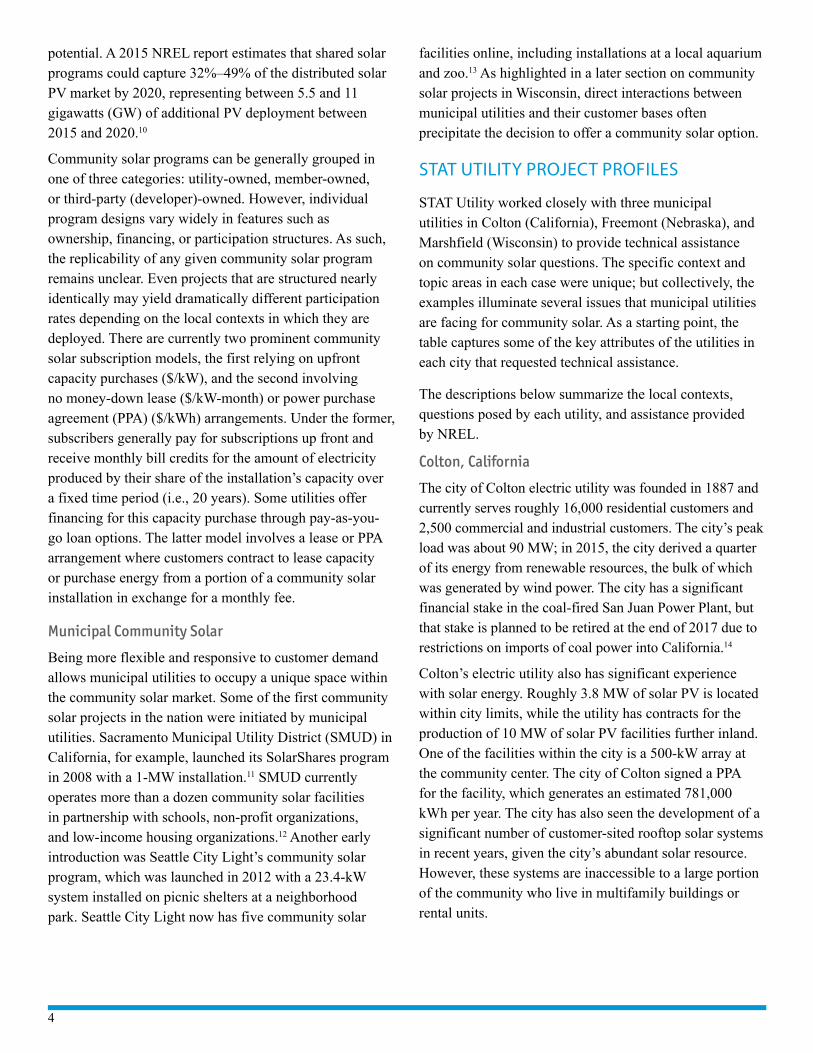
A typical community solar program structure begins with a
shared solar array generating and feeding solar power into the
grid. Most community solar arrays are owned by utilities or third-party project developers.
Community solar subscribers generally pay for their subscription through up-front purchases of capacity (kW) or output
(kWh). In return, the subscribers receive bill credits and, in some cases, RECs. However subscribers do not commonly receive the
RECs, in which case their subscription is not a green power purchase.
The utility is generally responsible for crediting
community solar subscribers through bill credits that re�ect
their ownership stake in the community solar array.
This figure provides a general overview of the structure of community solar programs, but the details of
each program can vary substantially.5 Illustration by NREL
4
potential. A 2015 NREL report estimates that shared solar programs could capture 32%–49% of the distributed solar PV market by 2020, representing between 5.5 and 11 gigawatts (GW) of additional PV deployment between 2015 and 2020.10
Community solar programs can be generally grouped in one of three categories: utility-owned, member-owned, or third-party (developer)-owned. However, individual program designs vary widely in features such as ownership, financing, or participation structures. As such, the replicability of any given community solar program remains unclear. Even projects that are structured nearly identically may yield dramatically different participation rates depending on the local contexts in which they are deployed. There are currently two prominent community solar subscription models, the first relying on upfront capacity purchases ($/kW), and the second involving no money-down lease ($/kW-month) or power purchase agreement (PPA) ($/kWh) arrangements. Under the former, subscribers generally pay for subscriptions up front and receive monthly bill credits for the amount of electricity produced by their share of the installation’s capacity over a fixed time period (i.e., 20 years). Some utilities offer financing for this capacity purchase through pay-as-you-go loan options. The latter model involves a lease or PPA arrangement where customers contract to lease capacity or purchase energy from a portion of a community solar installation in exchange for a monthly fee.
Municipal Community Solar
Being more flexible and responsive to customer demand allows municipal utilities to occupy a unique space within the community solar market. Some of the first community solar projects in the nation were initiated by municipal utilities. Sacramento Municipal Utility District (SMUD) in California, for example, launched its SolarShares program in 2008 with a 1-MW installation.11 SMUD currently operates more than a dozen community solar facilities in partnership with schools, non-profit organizations, and low-income housing organizations.12 Another early introduction was Seattle City Light’s community solar program, which was launched in 2012 with a 23.4-kW system installed on picnic shelters at a neighborhood park. Seattle City Light now has five community solar
facilities online, including installations at a local aquarium and zoo.13 As highlighted in a later section on community solar projects in Wisconsin, direct interactions between municipal utilities and their customer bases often precipitate the decision to offer a community solar option.
STAT UTILITY PROJECT PROFILES
STAT Utility worked closely with three municipal utilities in Colton (California), Freemont (Nebraska), and Marshfield (Wisconsin) to provide technical assistance on community solar questions. The specific context and topic areas in each case were unique; but collectively, the examples illuminate several issues that municipal utilities are facing for community solar. As a starting point, the table captures some of the key attributes of the utilities in each city that requested technical assistance.
The descriptions below summarize the local contexts, questions posed by each utility, and assistance provided by NREL.
Colton, California
The city of Colton electric utility was founded in 1887 and currently serves roughly 16,000 residential customers and 2,500 commercial and industrial customers. The city’s peak load was about 90 MW; in 2015, the city derived a quarter of its energy from renewable resources, the bulk of which was generated by wind power. The city has a significant financial stake in the coal-fired San Juan Power Plant, but that stake is planned to be retired at the end of 2017 due to restrictions on imports of coal power into California.14
Colton’s electric utility also has significant experience with solar energy. Roughly 3.8 MW of solar PV is located within city limits, while the utility has contracts for the production of 10 MW of solar PV facilities further inland. One of the facilities within the city is a 500-kW array at the community center. The city of Colton signed a PPA for the facility, which generates an estimated 781,000 kWh per year. The city has also seen the development of a significant number of customer-sited rooftop solar systems in recent years, given the city’s abundant solar resource. However, these systems are inaccessible to a large portion of the community who live in multifamily buildings or rental units.
5
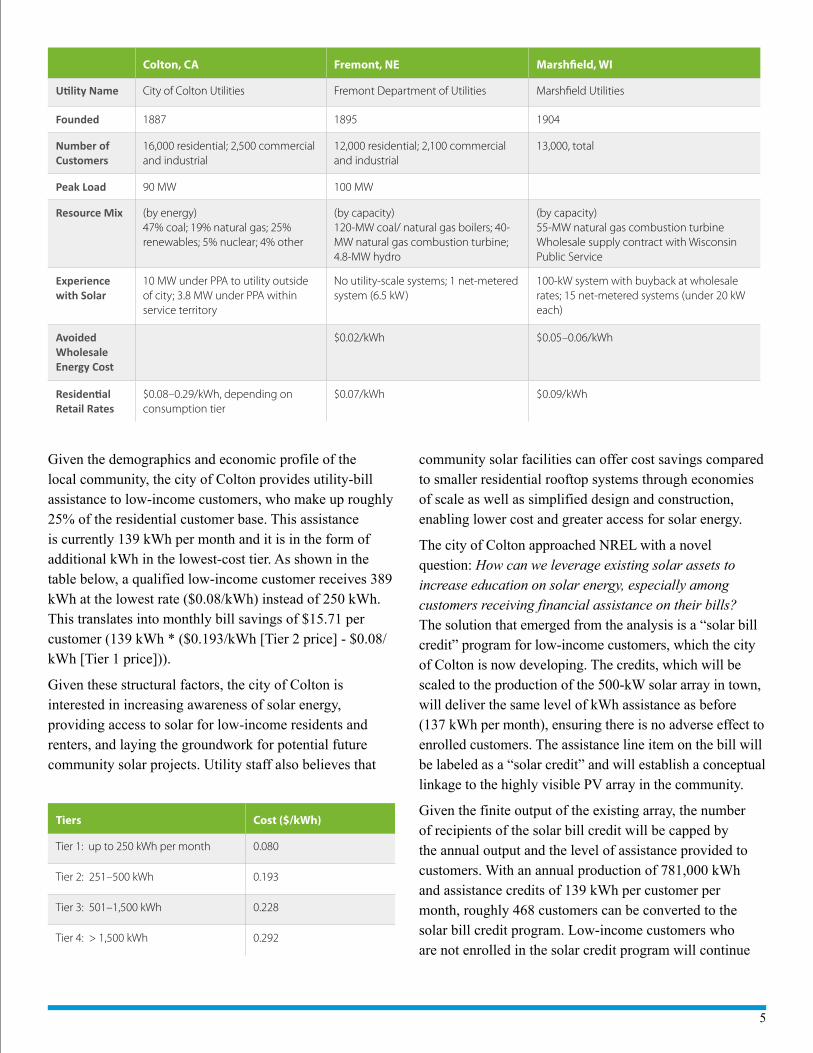
Given the demographics and economic profile of the local community, the city of Colton provides utility-bill assistance to low-income customers, who make up roughly 25% of the residential customer base. This assistance is currently 139 kWh per month and it is in the form of additional kWh in the lowest-cost tier. As shown in the table below, a qualified low-income customer receives 389 kWh at the lowest rate ($0.08/kWh) instead of 250 kWh. This translates into monthly bill savings of $15.71 per customer (139 kWh * ($0.193/kWh [Tier 2 price] - $0.08/kWh [Tier 1 price])).
Given these structural factors, the city of Colton is interested in increasing awareness of solar energy, providing access to solar for low-income residents and renters, and laying the groundwork for potential future community solar projects. Utility staff also believes that
community solar facilities can offer cost savings compared to smaller residential rooftop systems through economies of scale as well as simplified design and construction, enabling lower cost and greater access for solar energy.
The city of Colton approached NREL with a novel question: How can we leverage existing solar assets to increase education on solar energy, especially among customers receiving financial assistance on their bills? The solution that emerged from the analysis is a “solar bill credit” program for low-income customers, which the city of Colton is now developing. The credits, which will be scaled to the production of the 500-kW solar array in town, will deliver the same level of kWh assistance as before (137 kWh per month), ensuring there is no adverse effect to enrolled customers. The assistance line item on the bill will be labeled as a “solar credit” and will establish a conceptual linkage to the highly visible PV array in the community.
Given the finite output of the existing array, the number of recipients of the solar bill credit will be capped by the annual output and the level of assistance provided to customers. With an annual production of 781,000 kWh and assistance credits of 139 kWh per customer per month, roughly 468 customers can be converted to the solar bill credit program. Low-income customers who are not enrolled in the solar credit program will continue
Colton, CA Fremont, NE Marshfield, WI
Utility Name City of Colton Utilities Fremont Department of Utilities Marshfield Utilities
Founded 1887 1895 1904
Number of Customers
16,000 residential; 2,500 commercial and industrial
12,000 residential; 2,100 commercial and industrial
13,000, total
Peak Load 90 MW 100 MW
Resource Mix (by energy) 47% coal; 19% natural gas; 25% renewables; 5% nuclear; 4% other
(by capacity) 120-MW coal/ natural gas boilers; 40-MW natural gas combustion turbine; 4.8-MW hydro
(by capacity) 55-MW natural gas combustion turbine Wholesale supply contract with Wisconsin Public Service
Experience with Solar
10 MW under PPA to utility outside of city; 3.8 MW under PPA within service territory
No utility-scale systems; 1 net-metered system (6.5 kW)
100-kW system with buyback at wholesale rates; 15 net-metered systems (under 20 kW each)
Avoided Wholesale Energy Cost
$0.02/kWh $0.05–0.06/kWh
Residential Retail Rates
$0.08–0.29/kWh, depending on consumption tier
$0.07/kWh $0.09/kWh
Tiers Cost ($/kWh)
Tier 1: up to 250 kWh per month 0.080
Tier 2: 251–500 kWh 0.193
Tier 3: 501–1,500 kWh 0.228
Tier 4: > 1,500 kWh 0.292
6
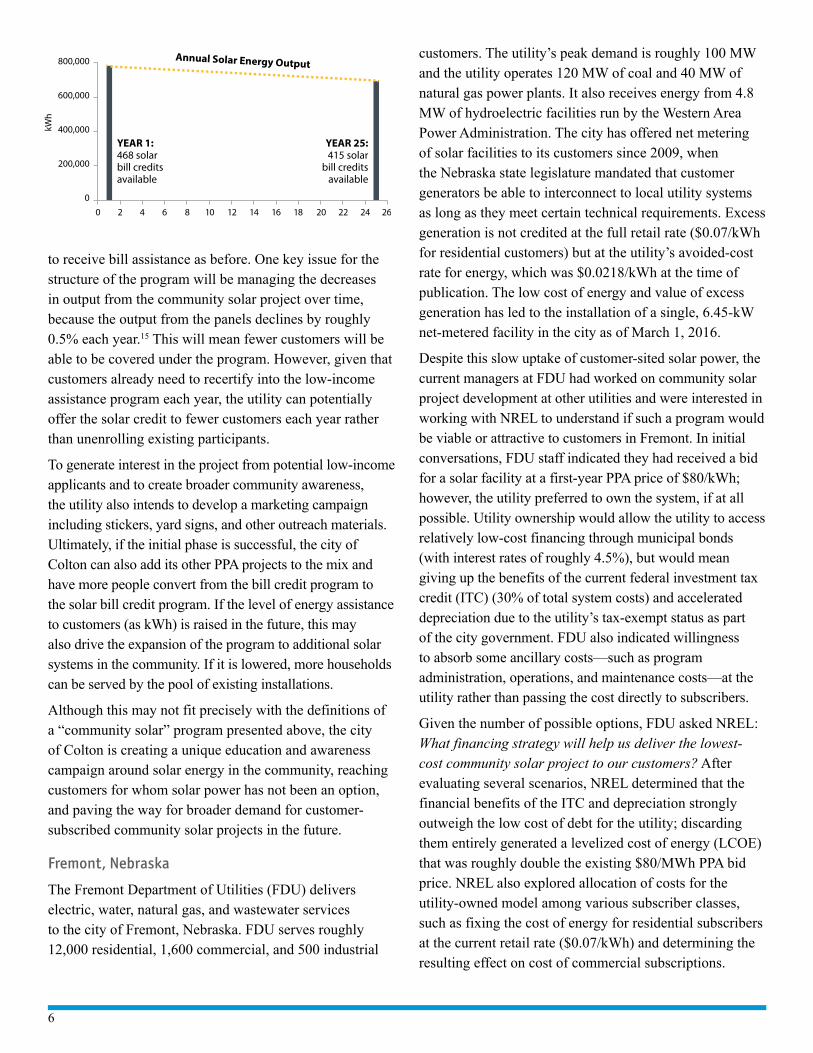
to receive bill assistance as before. One key issue for the structure of the program will be managing the decreases in output from the community solar project over time, because the output from the panels declines by roughly 0.5% each year.15 This will mean fewer customers will be able to be covered under the program. However, given that customers already need to recertify into the low-income assistance program each year, the utility can potentially offer the solar credit to fewer customers each year rather than unenrolling existing participants.
To generate interest in the project from potential low-income applicants and to create broader community awareness, the utility also intends to develop a marketing campaign including stickers, yard signs, and other outreach materials. Ultimately, if the initial phase is successful, the city of Colton can also add its other PPA projects to the mix and have more people convert from the bill credit program to the solar bill credit program. If the level of energy assistance to customers (as kWh) is raised in the future, this may also drive the expansion of the program to additional solar systems in the community. If it is lowered, more households can be served by the pool of existing installations.
Although this may not fit precisely with the definitions of a “community solar” program presented above, the city of Colton is creating a unique education and awareness campaign around solar energy in the community, reaching customers for whom solar power has not been an option, and paving the way for broader demand for customer-subscribed community solar projects in the future.
Fremont, Nebraska
The Fremont Department of Utilities (FDU) delivers electric, water, natural gas, and wastewater services to the city of Fremont, Nebraska. FDU serves roughly 12,000 residential, 1,600 commercial, and 500 industrial
customers. The utility’s peak demand is roughly 100 MW and the utility operates 120 MW of coal and 40 MW of natural gas power plants. It also receives energy from 4.8 MW of hydroelectric facilities run by the Western Area Power Administration. The city has offered net metering of solar facilities to its customers since 2009, when the Nebraska state legislature mandated that customer generators be able to interconnect to local utility systems as long as they meet certain technical requirements. Excess generation is not credited at the full retail rate ($0.07/kWh for residential customers) but at the utility’s avoided-cost rate for energy, which was $0.0218/kWh at the time of publication. The low cost of energy and value of excess generation has led to the installation of a single, 6.45-kW net-metered facility in the city as of March 1, 2016.
Despite this slow uptake of customer-sited solar power, the current managers at FDU had worked on community solar project development at other utilities and were interested in working with NREL to understand if such a program would be viable or attractive to customers in Fremont. In initial conversations, FDU staff indicated they had received a bid for a solar facility at a first-year PPA price of $80/kWh; however, the utility preferred to own the system, if at all possible. Utility ownership would allow the utility to access relatively low-cost financing through municipal bonds (with interest rates of roughly 4.5%), but would mean giving up the benefits of the current federal investment tax credit (ITC) (30% of total system costs) and accelerated depreciation due to the utility’s tax-exempt status as part of the city government. FDU also indicated willingness to absorb some ancillary costs—such as program administration, operations, and maintenance costs—at the utility rather than passing the cost directly to subscribers.
Given the number of possible options, FDU asked NREL: What financing strategy will help us deliver the lowest-cost community solar project to our customers? After evaluating several scenarios, NREL determined that the financial benefits of the ITC and depreciation strongly outweigh the low cost of debt for the utility; discarding them entirely generated a levelized cost of energy (LCOE) that was roughly double the existing $80/MWh PPA bid price. NREL also explored allocation of costs for the utility-owned model among various subscriber classes, such as fixing the cost of energy for residential subscribers at the current retail rate ($0.07/kWh) and determining the resulting effect on cost of commercial subscriptions.
86420 10 12 14 16 18 20 22 24 26
800,000
600,000
400,000
200,000
0
Annual Solar Energy Output
YEAR 1: 468 solar bill credits available
YEAR 25: 415 solar
bill credits available
kWh
7
With an initial understanding of the financing options and pathways for a community solar project, the next key step for FDU was to determine the level of customer demand and price points. NREL worked to enroll FDU in the Smart Electric Power Alliance’s (SEPA’s) ongoing community solar technical assistance program, which is specifically geared toward customer outreach and subscription issues. The utility is now working with SEPA to survey customers about their willingness to participate and pricing; FDU expects to collect final responses in the fall of 2016. Once the data are collected, FDU will combine the outputs of NREL’s financial analysis with the survey results to determine how to proceed with a community solar project in terms of system size, financing mechanism, and customer subscription pricing.
Marshfield, Wisconsin
Marshfield Utilities provides electric service to more than 13,000 customers in the city of Marshfield, Wisconsin. The city owns and operates a combustion turbine peaker plant and transmission lines up to 115 kV. The city has a contract to procure additional power at wholesale prices from Wisconsin Public Service. Marshfield Utilities has seen limited uptake of solar PV among customers, with about 15 customers installing rooftop solar systems in the utility’s net-metering program, which credits excess generation at the full retail rate ($0.085/kWh). Similar to Fremont, the low avoided cost for the customer and limited value of excess generation has a low adoption rate to date.
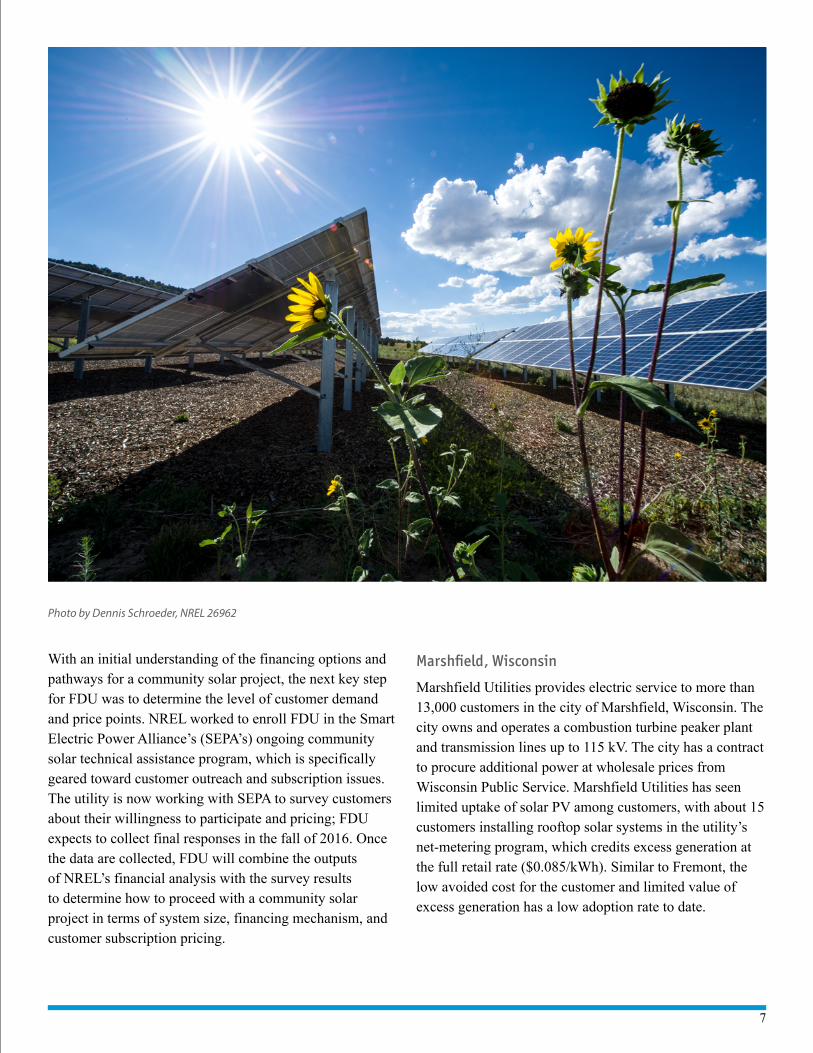
Photo by Dennis Schroeder, NREL 26962
8
The utility is evaluating a community solar program as a way to offer access to solar energy to customers. The utility solicited bids from a number of developers and received PPA prices in the range of $0.10–0.11 per kWh. Given that the Wisconsin Public Services Commission has stipulated that there can be no cross-subsidization of solar customers by other customer classes, Marshfield Utilities must either achieve a levelized cost of solar energy in line with its $0.05–0.06/kWh avoided cost of energy or demand higher costs from subscribers to launch the program.
Given these constraints, Marshfield Utilities posed the question: What combination of project finance and subscription pricing will be needed to meet our cost targets? To determine whether this could be achieved, NREL modeled several financing scenarios beyond the PPA. For example, a direct purchase by the utility, using its low cost of financing but forgoing the ITC and accelerated depreciation, would generate an LCOE of $0.16/kWh. This premium for direct purchase mirrored the higher price seen in Fremont, Nebraska.
One novel structure considered under the analysis would be for the utility to develop a project on behalf of a group of subscribers who collectively form a limited liability corporation (LLC) to own the solar facility. The subscriber-owners would contribute funds to the LLC in proportion to their ownership interest in the capacity and energy of the solar facility, and they could then claim the federal ITC equal to 30% of the value of their share of the facility.
Although this financing scenario generated a cost of energy from the facility of just $0.072/kWh, such an arrangement is risky for a number of reasons. The foremost issue is that the ability of the subscriber-owners to claim the ITC on a share of a collectively owned installation has not been formally established by the Internal Revenue Service (IRS). Instead, it has only been dealt with through Private Letter Rulings (PLR), such as for a community solar project in Vermont that strategy is based on.16 PLRs
are not intended to serve as a precedent for other tax cases (as the name implies), so each subscriber would need to seek their own PLR to claim their share of the project ITC without fear of audit. In addition, this development model makes significant assumptions about the financial situations of the potential subscribers: each subscriber would be able to personally finance the purchase price of their portion of the array (roughly $2,500/kW before the tax credit) and that each would have a tax burden large enough to fully utilize the credits gained.
In addition to the analysis described, NREL facilitated conversations between Marshfield Utilities and several community solar project developers who can develop the physical facility and manage marketing, subscription administration, and bill crediting for the utility.
To support Marshfield’s decisions about program design, NREL reviewed numerous other community solar projects in the state of Wisconsin, whether currently operating or under development, to see how those projects are being executed. Size, financing mechanisms, cost, subscription rates, and other program structures were all considered under the review. The following section provides an overview of these projects to serve as case studies within the Midwest.
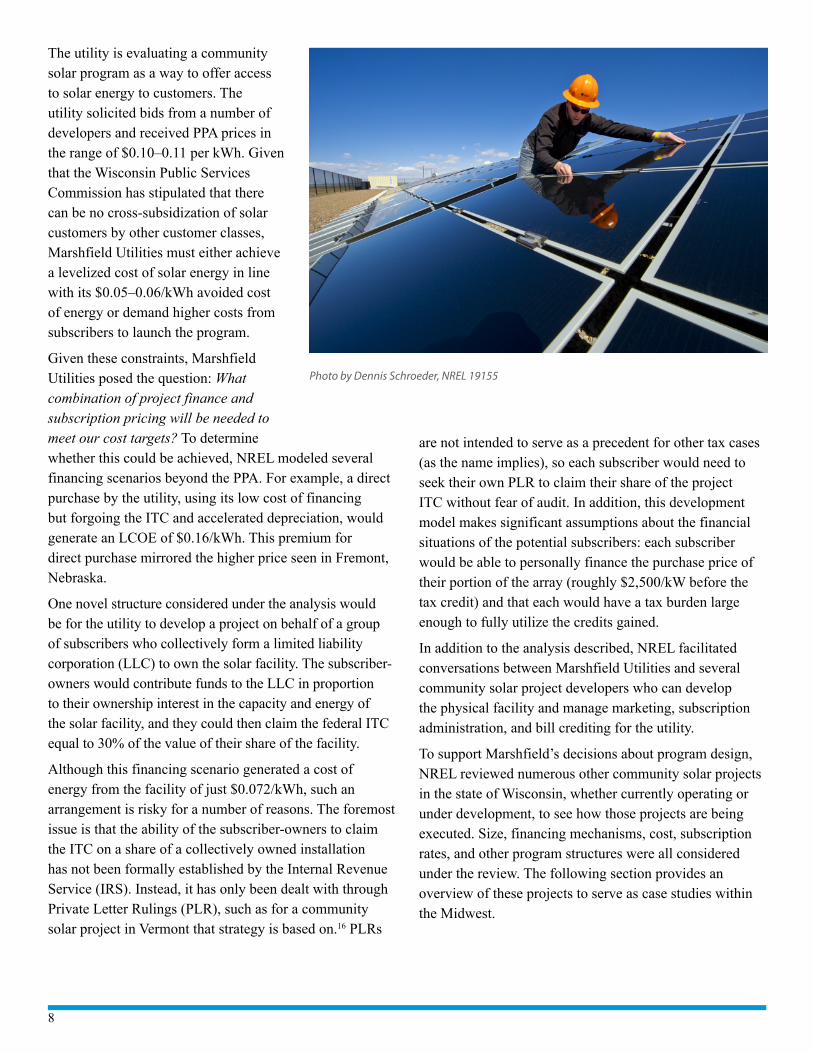
Photo by Dennis Schroeder, NREL 19155
9
COMMUNITY SOLAR CASE STUDIES FROM WISCONSIN
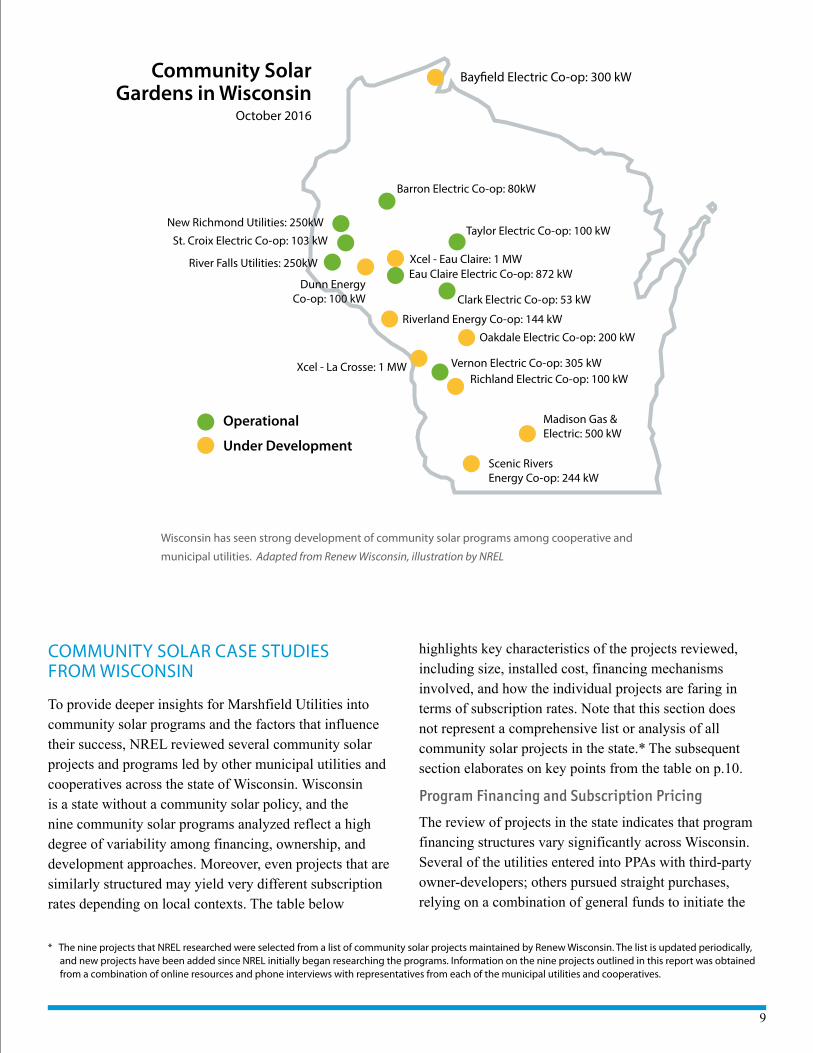
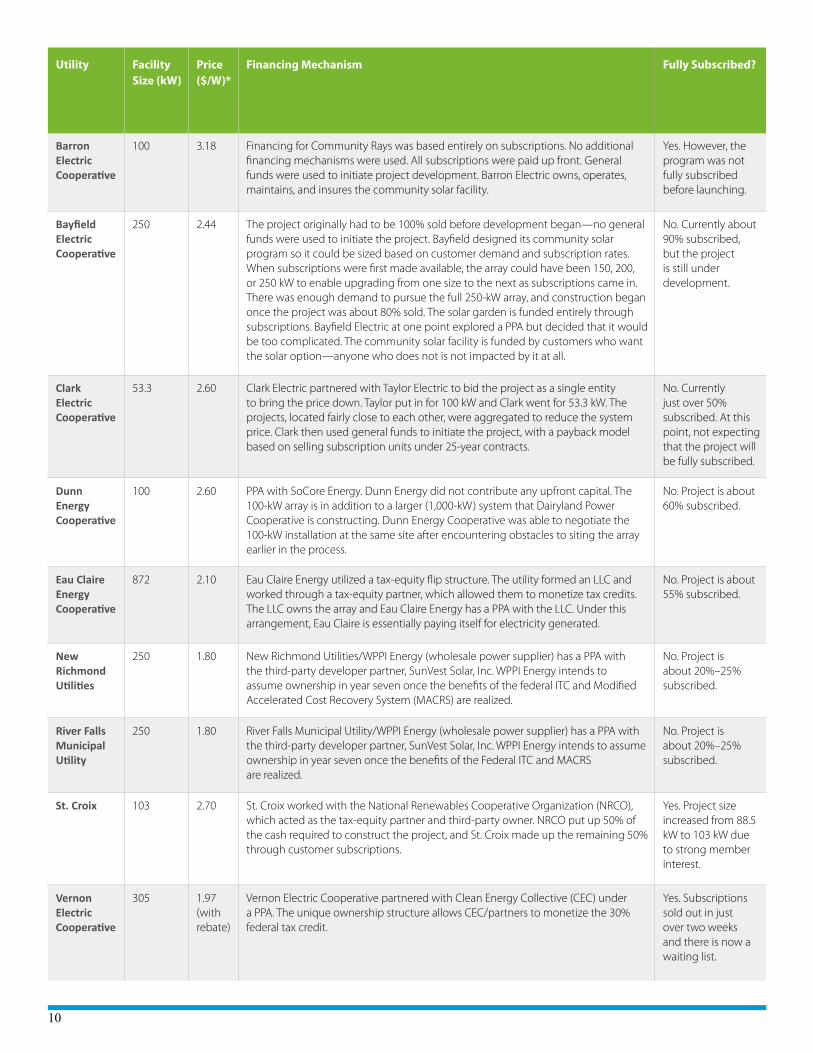
To provide deeper insights for Marshfield Utilities into community solar programs and the factors that influence their success, NREL reviewed several community solar projects and programs led by other municipal utilities and cooperatives across the state of Wisconsin. Wisconsin is a state without a community solar policy, and the nine community solar programs analyzed reflect a high degree of variability among financing, ownership, and development approaches. Moreover, even projects that are similarly structured may yield very different subscription rates depending on local contexts. The table below
highlights key characteristics of the projects reviewed, including size, installed cost, financing mechanisms involved, and how the individual projects are faring in terms of subscription rates. Note that this section does not represent a comprehensive list or analysis of all community solar projects in the state.* The subsequent section elaborates on key points from the table on p.10.
Program Financing and Subscription Pricing
The review of projects in the state indicates that program financing structures vary significantly across Wisconsin. Several of the utilities entered into PPAs with third-party owner-developers; others pursued straight purchases, relying on a combination of general funds to initiate the
Wisconsin has seen strong development of community solar programs among cooperative and
municipal utilities. Adapted from Renew Wisconsin, illustration by NREL
Barron Electric Co-op: 80kW
Bay�eld Electric Co-op: 300 kW
New Richmond Utilities: 250kW
River Falls Utilities: 250kW
St. Croix Electric Co-op: 103 kWTaylor Electric Co-op: 100 kW
Xcel - Eau Claire: 1 MW
Xcel - La Crosse: 1 MW
Eau Claire Electric Co-op: 872 kW
Clark Electric Co-op: 53 kW
Vernon Electric Co-op: 305 kW
Oakdale Electric Co-op: 200 kW
Richland Electric Co-op: 100 kW
Scenic RiversEnergy Co-op: 244 kW
Madison Gas & Electric: 500 kW
Riverland Energy Co-op: 144 kW
Dunn EnergyCo-op: 100 kW
Operational
Under Development
Community SolarGardens in Wisconsin
October 2016
* The nine projects that NREL researched were selected from a list of community solar projects maintained by Renew Wisconsin. The list is updated periodically, and new projects have been added since NREL initially began researching the programs. Information on the nine projects outlined in this report was obtained from a combination of online resources and phone interviews with representatives from each of the municipal utilities and cooperatives.
10
Utility Facility Size (kW)
Price ($/W)*
Financing Mechanism Fully Subscribed?
Barron Electric Cooperative
100 3.18 Financing for Community Rays was based entirely on subscriptions. No additional financing mechanisms were used. All subscriptions were paid up front. General funds were used to initiate project development. Barron Electric owns, operates, maintains, and insures the community solar facility.
Yes. However, the program was not fully subscribed before launching.
Bayfield Electric Cooperative
250 2.44 The project originally had to be 100% sold before development began—no general funds were used to initiate the project. Bayfield designed its community solar program so it could be sized based on customer demand and subscription rates. When subscriptions were first made available, the array could have been 150, 200, or 250 kW to enable upgrading from one size to the next as subscriptions came in. There was enough demand to pursue the full 250-kW array, and construction began once the project was about 80% sold. The solar garden is funded entirely through subscriptions. Bayfield Electric at one point explored a PPA but decided that it would be too complicated. The community solar facility is funded by customers who want the solar option—anyone who does not is not impacted by it at all.
No. Currently about 90% subscribed, but the project is still under development.
Clark Electric Cooperative
53.3 2.60 Clark Electric partnered with Taylor Electric to bid the project as a single entity to bring the price down. Taylor put in for 100 kW and Clark went for 53.3 kW. The projects, located fairly close to each other, were aggregated to reduce the system price. Clark then used general funds to initiate the project, with a payback model based on selling subscription units under 25-year contracts.
No. Currently just over 50% subscribed. At this point, not expecting that the project will be fully subscribed.
Dunn Energy Cooperative
100 2.60 PPA with SoCore Energy. Dunn Energy did not contribute any upfront capital. The 100-kW array is in addition to a larger (1,000-kW) system that Dairyland Power Cooperative is constructing. Dunn Energy Cooperative was able to negotiate the 100-kW installation at the same site after encountering obstacles to siting the array earlier in the process.
No. Project is about 60% subscribed.
Eau Claire Energy Cooperative
872 2.10 Eau Claire Energy utilized a tax-equity flip structure. The utility formed an LLC and worked through a tax-equity partner, which allowed them to monetize tax credits. The LLC owns the array and Eau Claire Energy has a PPA with the LLC. Under this arrangement, Eau Claire is essentially paying itself for electricity generated.
No. Project is about 55% subscribed.
New Richmond Utilities
250 1.80 New Richmond Utilities/WPPI Energy (wholesale power supplier) has a PPA with the third-party developer partner, SunVest Solar, Inc. WPPI Energy intends to assume ownership in year seven once the benefits of the federal ITC and Modified Accelerated Cost Recovery System (MACRS) are realized.
No. Project is about 20%–25% subscribed.
River Falls Municipal Utility
250 1.80 River Falls Municipal Utility/WPPI Energy (wholesale power supplier) has a PPA with the third-party developer partner, SunVest Solar, Inc. WPPI Energy intends to assume ownership in year seven once the benefits of the Federal ITC and MACRS are realized.
No. Project is about 20%–25% subscribed.
St. Croix 103 2.70 St. Croix worked with the National Renewables Cooperative Organization (NRCO), which acted as the tax-equity partner and third-party owner. NRCO put up 50% of the cash required to construct the project, and St. Croix made up the remaining 50% through customer subscriptions.
Yes. Project size increased from 88.5 kW to 103 kW due to strong member interest.
Vernon Electric Cooperative
305 1.97 (with rebate)
Vernon Electric Cooperative partnered with Clean Energy Collective (CEC) under a PPA. The unique ownership structure allows CEC/partners to monetize the 30% federal tax credit.
Yes. Subscriptions sold out in just over two weeks and there is now a waiting list.

11
projects and income from subscriptions to finance them; and a few were able to leverage a tax-equity flip structure through strategic partnerships. To achieve economies of scale, several of the utilities coordinated efforts to jointly pursue community solar programs, effectively reducing individual project costs and making community solar feasible for some of the smaller utilities that otherwise may have been unable to finance it. These coordinated utilities benefited from either combining projects as a single entity for bidding purposes (i.e., Clark Electric Cooperative and Taylor Electric Cooperative), co-locating with larger solar installations (i.e., Dunn Energy Cooperative), or being included as a pilot project under a larger wholesale power provider (i.e., New Richmond Utilities and River Falls Municipal Utilities).
Project financing was largely dependent on recouping costs through customer subscriptions. For the most part, subscription prices were calculated to just cover the cost of project development and operation. Among all of the projects, the subscription price calculation essentially amounted to dividing the total cost of the project by the number of solar panels or subscription units (i.e., a designated unit of output) for sale. In general terms, a combination of factors including net construction costs, projected operating and maintenance costs, land leases, cash flows, program marketing, tax benefits, PPA prices (depending on the financing structure), and insurance costs were evaluated to determine an overall cost for the community solar installation. In most cases, this number was then divided evenly across the number of subscription units to yield a subscription price; margins above costs were slim or non-existent across the projects. In some instances, the utilities were able to reduce the subscription price by absorbing some of the costs. St. Croix Electric Cooperative, for example, donated land, eliminating any associated land costs, whereas Vernon Electric Cooperative offered a rebate through the utility’s energy-efficiency program.
Although calculating the necessary subscription price was fairly straightforward in most of the Wisconsin cases, alignment with what a customer is willing to pay is a more nebulous, but important, factor. Dunn Energy, for example, considered what other cooperatives were selling community solar blocks for to set their subscription price. Vernon Electric Cooperative, which partnered with the
CEC under a PPA, negotiated to get to the original $671 per 305-watt module subscription price point, which was reduced to $600 ($1.97/W) by a $71 rebate. Vernon Electric’s goal was to offer subscriptions at between $500 and $600; a higher price point would have been a concern in attracting subscribers.
Once the subscription price was set, the majority of the Wisconsin utilities required upfront subscription payments, and the vast majority of subscribers opted for paying the full amount upfront, even if alternative payment structures (such as loans) were offered. In the instances where utilities partnered with local financing institutions to provide a pay-as-you-go option, few customers chose it. Clark Electric, for example, partnered with Forward Financial, a local bank, to provide financing for qualified customers. Forward Financial agreed to this primarily as a community outreach endeavor, but no Clark Electric customers have elected to pursue this option to date.
Subscription Rates
The Wisconsin municipal utilities and cooperatives are experiencing dramatically different subscription rates among their community solar programs, despite
Community solar projects that have achieved full subscription
typically do so within six months of energizing the system, with some
completely filled prior to operation. Others energize their systems
with only a small share of capacity subscribed.18 Illustration courtesy
of SEPA17
12
undertaking significant member survey and outreach endeavors prior to launching the projects. Three of the nine community solar installations are currently sold out, and in two of those cases, the project size was either increased to meet customer demand (for the St. Croix Electric Cooperative) or the utility is in the process of developing additional capacity (for Vernon Electric).
However, in other cases, member surveys designed to gauge interest in a community solar option appear to have over-estimated demand. Several of the utility contacts mentioned that there had been significant customer interest in community solar as a conceptual idea, but that most of the people who indicated on paper that they would participate in a community solar program have not ended up subscribing. One utility representative commented that people may indicate considerable interest in renewables, but that locating the system on their homes makes the benefits more tangible.
The interaction between the subscription process and project development is also important to highlight. Two of the three projects that achieved full subscription did so prior to project construction or development; a fourth project that is still in development is roughly 90% subscribed. This approach helps ensure that all shares are accounted for, that the financial impact on the utility is in line with expectations, and that the project can be canceled or scaled back if interest does not justify development. In essence, this tactic can help utilities manage their subscription risk, especially in a state such as
Wisconsin where there are strict rules regarding the cross-subsidization of solar energy.
Some utilities worried that enthusiastic solar customers might lose interest in subscribing to a community solar project if there was a long delay between project announcement and completion date due to the need to fully subscribe the project before construction. However, this concern was not borne out in the experience of the utilities surveyed. It has been thought that a potential benefit to starting without full subscription is that physical construction progress on the facility and publicity around it might help draw in more subscribers; however, this model did not seem to be able to get projects that were undersubscribed at construction start to full subscription. These conclusions generally align with data gathered by SEPA in their “Community Solar: Program Design Models” report as shown in the figure. The report indicated that projects that achieved 100% subscription tended to do so within six months of the online date, and that 30% of those projects were fully subscribed prior to coming online. Few projects achieved full subscription through gradual additions over a long period.
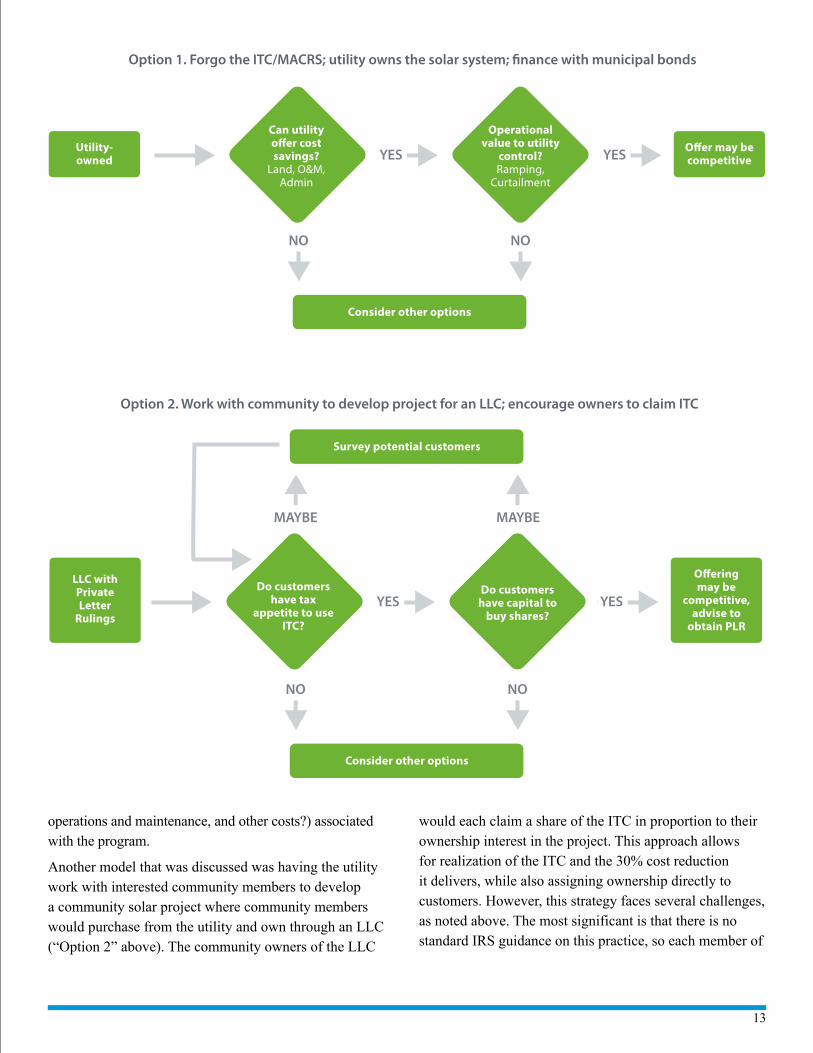
FINANCING DECISION POINTS FOR MUNICIPAL UTILITIES ON COMMUNITY SOLARIn considering how to finance a community solar project, the most important question that municipalities face is whether—and how—to access the ITC and accelerated depreciation. Three main options emerged from working with the technical assistance recipients in the STAT utility program, each with their own benefits and drawbacks.
Both Fremont and Marshfield initially considered utility ownership as the most attractive option (“Option 1” below); each utility cited the relative organizational simplicity and the ability to access low-cost capital through municipal bonds. Utilities may already own a viable site for the solar system, eliminating any land-acquisition cost. The analysis NREL conducted through the STAT Utility program indicated that such advantages did not outweigh the cost benefits of the 30% ITC and MACRS. To proceed with this option, utilities will likely need to identify additional benefits to self-ownership (e.g., is there a high value of operational flexibility or curtailment?) or further ways to reduce costs (e.g., will the utility subsidize administration,
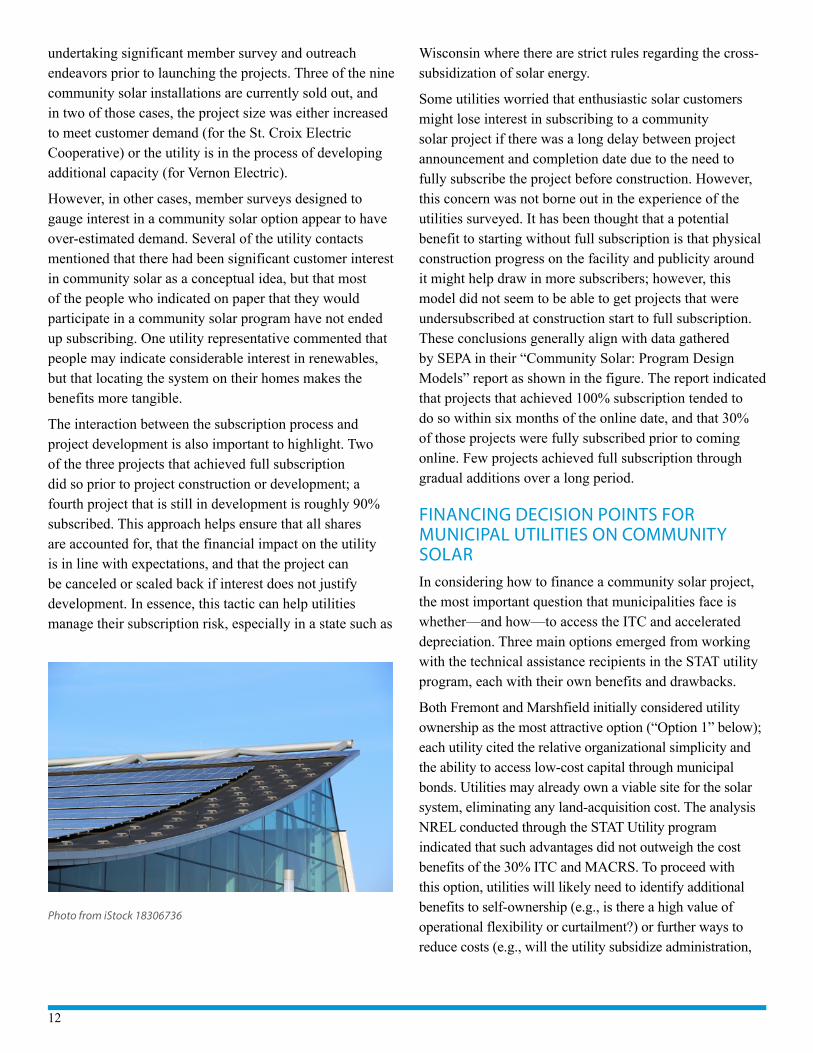
Photo from iStock 18306736
13
operations and maintenance, and other costs?) associated with the program.
Another model that was discussed was having the utility work with interested community members to develop a community solar project where community members would purchase from the utility and own through an LLC (“Option 2” above). The community owners of the LLC
would each claim a share of the ITC in proportion to their ownership interest in the project. This approach allows for realization of the ITC and the 30% cost reduction it delivers, while also assigning ownership directly to customers. However, this strategy faces several challenges, as noted above. The most significant is that there is no standard IRS guidance on this practice, so each member of
YESYES O�er may be competitive
Utility-owned
Consider other options
NO NO
Can utility o�er cost savings?
Land, O&M, Admin
Operational value to utility
control? Ramping,
Curtailment
Option 1. Forgo the ITC/MACRS; utility owns the solar system; �nance with municipal bonds
YESYES
O�ering may be
competitive, advise to
obtain PLR
LLC with Private Letter
Rulings
Survey potential customers
Consider other options
MAYBE MAYBE
Option 2. Work with community to develop project for an LLC; encourage owners to claim ITC
NO NO
Do customers have tax
appetite to use ITC?
Do customers have capital to
buy shares?
14
the LLC may need to obtain a private-letter ruling to claim their share of the project ITC. In addition, the customer base would need to have sufficient capital (or borrowing power) to purchase an interest in the LLC and sufficient tax appetite to realize the full value of their share of the ITC.
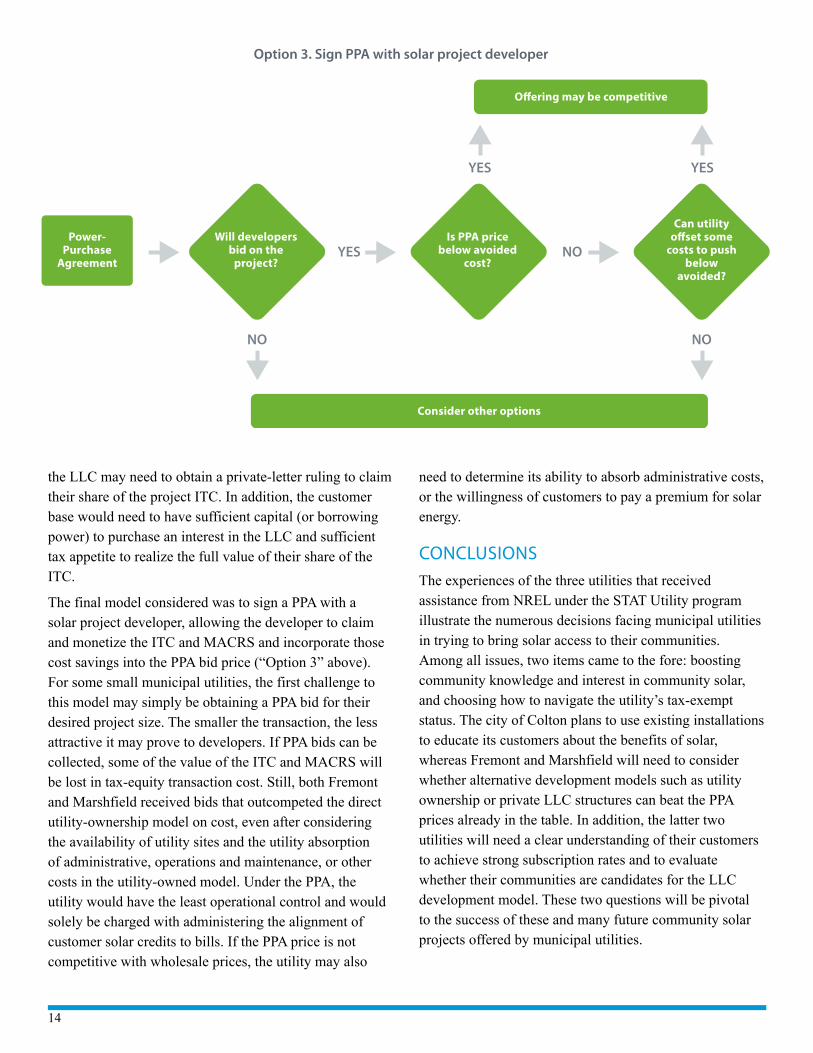
The final model considered was to sign a PPA with a solar project developer, allowing the developer to claim and monetize the ITC and MACRS and incorporate those cost savings into the PPA bid price (“Option 3” above). For some small municipal utilities, the first challenge to this model may simply be obtaining a PPA bid for their desired project size. The smaller the transaction, the less attractive it may prove to developers. If PPA bids can be collected, some of the value of the ITC and MACRS will be lost in tax-equity transaction cost. Still, both Fremont and Marshfield received bids that outcompeted the direct utility-ownership model on cost, even after considering the availability of utility sites and the utility absorption of administrative, operations and maintenance, or other costs in the utility-owned model. Under the PPA, the utility would have the least operational control and would solely be charged with administering the alignment of customer solar credits to bills. If the PPA price is not competitive with wholesale prices, the utility may also
need to determine its ability to absorb administrative costs, or the willingness of customers to pay a premium for solar energy.
CONCLUSIONSThe experiences of the three utilities that received assistance from NREL under the STAT Utility program illustrate the numerous decisions facing municipal utilities in trying to bring solar access to their communities. Among all issues, two items came to the fore: boosting community knowledge and interest in community solar, and choosing how to navigate the utility’s tax-exempt status. The city of Colton plans to use existing installations to educate its customers about the benefits of solar, whereas Fremont and Marshfield will need to consider whether alternative development models such as utility ownership or private LLC structures can beat the PPA prices already in the table. In addition, the latter two utilities will need a clear understanding of their customers to achieve strong subscription rates and to evaluate whether their communities are candidates for the LLC development model. These two questions will be pivotal to the success of these and many future community solar projects offered by municipal utilities.
NOYESPower-
Purchase Agreement
O�ering may be competitive
Consider other options
YES YES
Option 3. Sign PPA with solar project developer
NO NO
Is PPA price below avoided
cost?
Will developers bid on the
project?
Can utility o�set some
costs to push below
avoided?
15
REFERENCES1 http://www.publicpower.org/files/PDFs/USElectricUtilityIndustry
Statistics.pdf
2 http://www.publicpower.org/files/PDFs/DistributionofPublicPower Utilities1.pdf
3 SNL Energy data
4 http://www.nrel.gov/docs/fy17osti/67147.pdf
5 http://www.nrel.gov/docs/fy17osti/67147.pdf
6 NREL. “Community Shared Solar: Policy and Regulatory Considerations” (2014) http://www.nrel.gov/docs/fy14osti/62367.pdf
7 “Community Solar Program Design Models.” Solar Electric Power Alliance (SEPA), November, 2015. https://sepa.force.com/CPBase__item?id= a12o000000Id07sAAB
8 “Community Solar Program Design Models.” Solar Electric Power Alliance (SEPA), November, 2015. https://sepa.force.com/CPBase__item?id= a12o000000Id07sAAB
9 “The 50 States of Solar: Q1 2016 Quarterly Report.” NC Clean Energy Technology Center, April, 2016. https://nccleantech.ncsu.edu/wp-content/uploads/50-SoS-Q1-2016_Final.pdf. Feldman, D., Brockway, A.M., Ulrich, E., & Margolis, R. Shared Solar: Current Landscape
10 Feldman, D., Brockway, A.M., Ulrich, E., & Margolis, R. Shared Solar: Current Landscape, Market Potential, and the Impact of Federal Securities Regula-tion. National Renewable Energy Laboratory, 2015. http://www.nrel.gov/docs/fy15osti/63892.pdf
11 Coughlin, Jason, Jennifer Grove, Linda Irvine, Janet F. Jacobs, Sarah Johnson Phillips, Alexandra Sawyer, and Joseph Wiedman. “A Guide to Community Shared Solar: Utility, Private, and Nonprofit Project Development.” US De-partment of Energy, SunShot Initiative. DOE/GO-102012-3569 (2012). http://www.nrel.gov/docs/fy12osti/54570.pdf
12 SMUD. “SMUD Community Solar.” https://www.smud.org/en/about-smud/environment/renewable-energy/community-solar.htm
13 Seattle City Light. “Community Solar.” http://www.seattle.gov/light/solaren-ergy/commsolar.asp
14 Power content label: http://www.ci.colton.ca.us/DocumentCenter/View/2984
15 See median degradation rates for silicon modules (more typical for rooftop applications) on page 6: http://www.nrel.gov/docs/fy12osti/51664.pdf
16 http://www.cesa.org/assets/2015-Files/IRS-Community-Shared-Solar-PLR.pdf
17 https://www.solarelectricpower.org/media/422095/community-solar-design-plan_web.pdf
National Renewable Energy Laboratory15013 Denver West Parkway Golden, CO 80401
303-275-3000 • www.nrel.gov
NREL is a national laboratory of the U.S. Department of Energy Office of Energy Efficiency and Renewable Energy Operated by the Alliance for Sustainable Energy, LLC
NREL prints on paper that contains recycled content.
NREL/BR-7A40-67442 • December 2016