Lessons from Europe, North America, and Asia: Financing Models … · Models that are Facilitating...
15
Lessons from Europe, North America, and Asia: Financing Models that are Facilitating Building Energy Efficiency at Scale Authors: Bruce Schlein 1 , Carolyn Szum, Nan Zhou, Jing Ge, Helen He 2 1 Citi, 2 International Finance Corporation/ The World Bank group Energy Analysis and Environmental Impacts Division Lawrence Berkeley National Laboratory China Energy Group Preprint version of conference paper of the European Council for an Energy Efficient Economy’s 2017 Summer Study, held in Presqu’ile de Giens, Hyeres, France, on 29 May – 3 June 2017 May 2017 The work was supported by The Energy Foundation, Rocky Mountain Institute, and the U.S. Department of Energy’s Building Technologies Office (BTO) under Lawrence Berkeley National Laboratory Contract No. DE-AC02-05CH11231. .
Transcript of Lessons from Europe, North America, and Asia: Financing Models … · Models that are Facilitating...
Lessons from Europe, North America, and Asia: Financing Models that are Facilitating Building Energy Efficiency at
Scale
Authors:
Bruce Schlein1, Carolyn Szum, Nan Zhou, Jing Ge, Helen He2 1Citi, 2 International Finance Corporation/ The World Bank group
Energy Analysis and Environmental Impacts Division Lawrence Berkeley National Laboratory China Energy Group
Preprint version of conference paper of the European Council for an Energy Efficient Economy’s 2017 Summer Study, held in Presqu’ile de Giens, Hyeres, France, on 29 May – 3 June 2017
May 2017
The work was supported by The Energy Foundation, Rocky Mountain Institute, and the U.S. Department of Energy’s Building Technologies Office (BTO) under Lawrence Berkeley National Laboratory Contract No. DE-AC02-05CH11231. .

DISCLAIMER
This document was prepared as an account of work sponsored by the United States Government. While this document is believed to contain correct information, neither the United States Government nor any agency thereof, nor The Regents of the University of California, nor any of their employees, makes any warranty, express or implied, or assumes any legal responsibility for the accuracy, completeness, or usefulness of any information, apparatus, product, or process disclosed, or represents that its use would not infringe privately owned rights. Reference herein to any specific commercial product, process, or service by its trade name, trademark, manufacturer, or otherwise, does not necessarily constitute or imply its endorsement, recommendation, or favoring by the United States Government or any agency thereof, or The Regents of the University of California. The views and opinions of authors expressed herein do not necessarily state or reflect those of the United States Government or any agency thereof, or The Regents of the University of California. Ernest Orlando Lawrence Berkeley National Laboratory is an equal opportunity employer.

6-146-17 Bruce SCHLEIN
Lessons from Europe, North America, and Asia: Financing Models that are Facilitating Building Energy
Efficiency at Scale
Bruce Schlein Citi 390 Greenwich Street New York, NY 10013 Email: [email protected] Carolyn Szum, Nan Zhou, Jing Ge Lawrence Berkeley National Laboratory One Cyclotron Road, MS90R2121 Berkeley, CA 94720 Emails: [email protected], [email protected], [email protected] Helen He International Finance Corporation / The World Bank Group 1501, China World Office 2 No. 1 Jianguomenwai Avenue Beijing 100004 P.R. China Email: [email protected]
Abstract A critical component of achieving energy and carbon dioxide reduction goals set forth in The Paris Agreement is reduction of energy usage in buildings, which account for over one-third of all global energy consumption. While it is widely understood that curbing energy usage in buildings at the scale necessary to limit climate change requires involvement from capital markets, few structures exist in the market today for institutional investors to deploy capital, resulting in the absence of energy efficiency as an asset class. In general, capital markets would operate where projects can be efficiently aggregated, standardized, and assessed for credit quality; conditions that are challenging to achieve in certain market segments. This paper will discuss work being carried out by a consortium of scientists, bankers, and policy analysts from Lawrence Berkeley National Laboratory, Rocky Mountain Institute, Citi, and the International Finance Corporation to develop and pilot new policies, tools, and financial products that can facilitate building energy efficiency investment at scale. This paper will include an assessment of the most critical barriers to the deployment of private capital for building energy efficiency projects in Europe, the United States, and China; recent examples of success; and lessons from current exploratory work in the United States and China to pilot new mechanisms that allow capital markets to better assess and bear the technical and credit risks of projects.
Introduction According to the Intergovernmental Panel on Climate Change (IPCC) in its Fifth Assessment Report (AR5), “warming of the climate system is unequivocal…(and) science now shows with 95 percent certainty that human activity is the dominant cause of observed warming since the mid-20th century.” (Stocker et al. 2013.) Scientists predict that without further mitigation measures, global surface temperature is more than likely to rise in excess of 4° Celsius (C) above pre-industrial levels by the end of the 21st century with severe implications for human and natural systems. A critical component of achieving mitigation goals is to reduce energy usage and carbon dioxide (CO2) emissions in buildings, which account for over one-third of final global energy consumption (IEA 2013, 9). The International Energy Agency (IEA) estimates that limiting global temperature rise to 2°C will require an estimated 77% reduction in total CO2 emissions in buildings by 2050 compared to a baseline of 2012 (IEA 2013, 10). However, numerous barriers exist to curbing energy usage and CO2 emissions in buildings. In general, barriers can be organized into six interrelated categories: market barriers, technical barriers, institutional barriers,
2
motivational barriers, and financial barriers (Becque et al. 2014). While all of these barriers must be overcome through integrated responses, this paper will focus specifically on addressing financing barriers to building EE. According to the International Energy Agency (IEA), in its 450 Scenario, the cumulative investments in building EE, alone, must reach €3.6 trillion by 2035 to keep global surface temperature rise below 2°C (Rugova 2016, 2-3). This scale exceeds the capacity of public funding alone and makes mobilization of private capital necessary to address climate change (IPEEC 2016, 38). Yet, despite widespread acknowledgment that curbing energy usage in buildings is necessary and presents a massive, albeit highly fragmented, economic opportunity, few structures exist in the market today for institutional investors to deploy capital, resulting in the absence of EE as an asset class and slowing progress toward climate change mitigation. According to the Energy Efficiency Financing Institutions Group (EEFIG), piloting innovative financing mechanisms is among the top four market actions required by the European Union to grow EE investment in buildings (EEFIG 2015). This paper discusses work being carried out by a consortium of scientists, bankers, and public policy analysts from Lawrence Berkeley National Laboratory (LBNL), Citi, and the International Finance Corporation (IFC) under the U.S.-China Clean Energy Research Center-Building Energy Efficiency (CERC-BEE)1 program to increase the deployment of private capital for building EE in capital markets by developing and piloting new specialized financial products, tools, and policies for building EE. Part I provides an introduction to the topic. Part II defines key terms and presents the paper scope. Part III includes an assessment of the most critical barriers to capital market engagement in building EE in different geographic markets: (1) United States and Europe, and (2) China, examining unique attributes by market segment for each geographic location. Part IV describes recent example of success accessing private capital for building EE. Part V discusses current exploratory work in China and the United States to develop and new policies, tools, and financial products that allow capital markets to better assess and bear technical and credit risks of projects. Part VI draws conclusions.
Definition of Terms The capital market, broadly defined, serves as a conduit for demand and supply of debt and equity capital. It allocates funds between lenders and borrowers through financial instruments (e.g., bonds, notes) and is comprised of the stock market, bond market, and money market (Goldman Sachs 2014). The primary capital market refers to the initial financing of a loan between a lender and a borrower. The secondary capital market refers to the resale of one or more loans to a new (secondary) investor. Secondary market transactions often involve highly standardized products and the bundling of numerous loans into tradable instruments. An asset-backed security (ABS), which is a bond backed by assets that provide a regular income stream, is an example of a secondary market product. The particular value of the secondary market (versus the primary market) is that it links investors best suited to providing capital to a given product at scale, which can lead to more efficient financing and lower cost of capital. Secondary markets have played a critical role in providing large volumes of low-interest loans for mortgages and automobiles, and there is similar potential for building EE (SEE Action 2015). There are two broad categories of financing products that can be utilized for building EE projects. The first of these is traditional products, which are conventional financing options such as credit cards, lines of credit, or unsecured loans. The second category is specialized products, which are loans or other financing products specifically designed to fund EE and solar projects. Typically, they have unique features, such as extended repayment terms or ability to remit payment via utility bill (SEE Action 2015). An example in the United States is property-assessed clean energy (PACE) financing which allows residential homeowners to finance EE improvements through their property tax bill (Campbell 2016). This paper will focus primarily on the barriers and solutions for financing building EE through innovative specialized products. Further, while barriers and solutions for both the primary and secondary markets will be discussed, some emphasis will be placed on the secondary market, which is still relatively nascent and untested (there have been only about 10 secondary market transactions recorded since 2011 with a volume of just €375 million in the United States) but presents a significant opportunity to achieve building EE at scale and meet climate change mitigation targets (SEE Action 2015). Secondary markets hold particular promise in that they lower transaction costs and promote financial liquidity (by providing an exit strategy and a transparent market price) thereby making EE investment more accessible to pension funds, insurance companies, and private equity (Rugova 2016). 1 The CERC-BEE is a ten-year initiative to support leading scientists from United States and China in collaborative research to accelerate the development and deployment of advanced building energy efficiency technologies. Additional information can be found at https://cercbee.lbl.gov/.

3
As previously noted, barriers differ by both geography and by market segment, providing implications for both the types of solutions available and their potential replicability across geographies and markets. The following is a typology of market segments referred to throughout this paper.
Table 1. Typology of Market Segments Market Segment Definition MUSH Municipal and state government; university and college; school; and hospital buildings. Federal Federal government buildings housing agencies and offices. Single Family Detached residential home occupied by a single family. Multifamily Building containing multiple separate housing units, such as an apartment building or condominium. Commerciali Non-residential buildings used for commercial purposes, such as hotels, commercial offices, or shopping
malls. Corporate Building owned and occupied by a single corporation (e.g., corporate headquarters).
i Commercial buildings in the United States and Europe are referred to as public buildings in China. In addition, the following are standard definitions for the technical terms utilized throughout the paper.
Table 2. Technical Terms and Definitions Technical Term Definition Host The property upon which measures are being implemented (may also refer to owner of said property). Energy Service Company (ESCO)
The company responsible for implementing the measures, that in some case takes performance risk through a guarantee.
Lender The financial institution that provides debt for a project, and in so doing takes credit, and in some constructs, performance risk
Critical Barriers to Capital Market Engagement Europe and the United States Background and Context Today, the investment opportunity for EE in Europe is estimated at €100 billion annually and has been identified as the most cost-effective method to reduce Europe’s reliance on energy imports (costing over €400 annually) (EDF 2016; EEFIG 2015). The United States’ investment opportunity is estimated at €262 billion to €488 billion. Yet, experts indicate that this level of investment is too large for bank balance sheets and will require secondary market capital engagement (IPEEC 2016). The key components to capital markets engagement in building EE financing are: (1) sufficient scale, (2) standardization, and (3) the ability to efficiently understand credit quality (the likelihood or repayment to a lender) of a portfolio of hosts. Scale is important for two reasons: (1) the costs of executing a capital markets transaction (legal, rating agency and other fees) must be borne by the monetary size of the transaction; and (2) institutional investors have minimum investment thresholds, compounded by the condition that they may not be allowed to be the sole investor in a deal. Scale, therefore, points to the interconnectedness of other factors in scaling EE, namely the ability for developers or sponsors to aggregate sufficient activity or demand. Standardization speaks to a number of factors including measures, contracts, and underlying credit of the host. Measures and their performance must be defined and well-understood. The agreements that dictate how cash flows, responsibilities of parties, warranties, etc. must all be uniform. Finally, “like credits” or property types must be grouped together, such that uniform credit risk analysis can be applied. Thus, while the investment opportunity for EE is significant on aggregate, the opportunity is highly fragmented by property type, measures, and other dimensions, making it essential to have integrated strategies for aggregating to a scale sufficient for capital markets engagement.
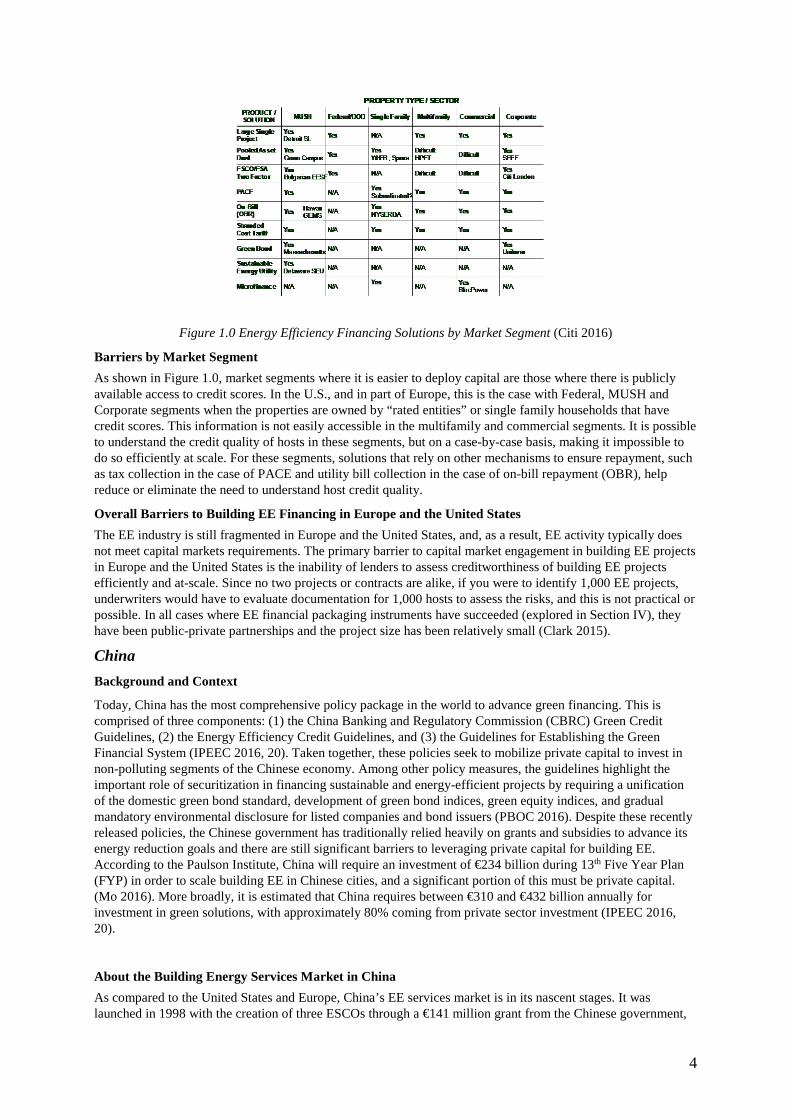
Key Market Segments One approach to doing this is breaking down the market by segment and product, and identifying where the most viable scaling opportunities exist, based in part on market fundamentals, as well as the existence of primary market activity (a pool of projects to work with). The framework below (Figure 1.0) is an example of such an approach developed by Citi (2016) to guide its understating and approach to the market.
4
Figure 1.0 Energy Efficiency Financing Solutions by Market Segment (Citi 2016)
Barriers by Market Segment As shown in Figure 1.0, market segments where it is easier to deploy capital are those where there is publicly available access to credit scores. In the U.S., and in part of Europe, this is the case with Federal, MUSH and Corporate segments when the properties are owned by “rated entities” or single family households that have credit scores. This information is not easily accessible in the multifamily and commercial segments. It is possible to understand the credit quality of hosts in these segments, but on a case-by-case basis, making it impossible to do so efficiently at scale. For these segments, solutions that rely on other mechanisms to ensure repayment, such as tax collection in the case of PACE and utility bill collection in the case of on-bill repayment (OBR), help reduce or eliminate the need to understand host credit quality.
Overall Barriers to Building EE Financing in Europe and the United States The EE industry is still fragmented in Europe and the United States, and, as a result, EE activity typically does not meet capital markets requirements. The primary barrier to capital market engagement in building EE projects in Europe and the United States is the inability of lenders to assess creditworthiness of building EE projects efficiently and at-scale. Since no two projects or contracts are alike, if you were to identify 1,000 EE projects, underwriters would have to evaluate documentation for 1,000 hosts to assess the risks, and this is not practical or possible. In all cases where EE financial packaging instruments have succeeded (explored in Section IV), they have been public-private partnerships and the project size has been relatively small (Clark 2015).
China Background and Context
Today, China has the most comprehensive policy package in the world to advance green financing. This is comprised of three components: (1) the China Banking and Regulatory Commission (CBRC) Green Credit Guidelines, (2) the Energy Efficiency Credit Guidelines, and (3) the Guidelines for Establishing the Green Financial System (IPEEC 2016, 20). Taken together, these policies seek to mobilize private capital to invest in non-polluting segments of the Chinese economy. Among other policy measures, the guidelines highlight the important role of securitization in financing sustainable and energy-efficient projects by requiring a unification of the domestic green bond standard, development of green bond indices, green equity indices, and gradual mandatory environmental disclosure for listed companies and bond issuers (PBOC 2016). Despite these recently released policies, the Chinese government has traditionally relied heavily on grants and subsidies to advance its energy reduction goals and there are still significant barriers to leveraging private capital for building EE. According to the Paulson Institute, China will require an investment of €234 billion during 13th Five Year Plan (FYP) in order to scale building EE in Chinese cities, and a significant portion of this must be private capital. (Mo 2016). More broadly, it is estimated that China requires between €310 and €432 billion annually for investment in green solutions, with approximately 80% coming from private sector investment (IPEEC 2016, 20).
About the Building Energy Services Market in China As compared to the United States and Europe, China’s EE services market is in its nascent stages. It was launched in 1998 with the creation of three ESCOs through a €141 million grant from the Chinese government,
5
World Bank, Global Environment Facility, and the European Commission. Despite its infancy, the industry has experienced rapid growth. By 2011, the Chinese energy services market was worth €6.01 billion (larger than the €5.92 billion U.S. market) and by 2013, it had grown to €11.3 billion in terms of energy performance contract (EPC) investments (Evans et al. 2015, iii). As of 2013, there were 4,852 ESCOs conducting business in China generating a total economic output of €31 billion and responsible for approximately 18% of China’s total energy savings. With modest to accelerated market expansion, this proportion could shift to between 33% and 37%, respectively, by 2020 (Evans et al. 2015, 2 and 14). In China, ESCOs typically provide financing for building EE projects from their own capital or through bank loans directly to the ESCO. This is a distinct difference with the U.S. and Europe, where financing is typically provided by lenders to the property owner (host) and not the ESCO. While there are several EPC models, the shared savings model is most common because shared savings projects benefit from government incentives and tax advantages (Evans et al. 2015). Despite the rapid growth of the Chinese ESCO industry, access to third-party finance is still constrained. While the dominant form of financing is bank debt financing, in 2011, bank loans represented only 20% of total EPC project funding, and only 18% of ESCOs had access to bank loans, with just 36 companies (or 2%) borrowing over 65% of the loans lent to ESCOs in 2011 (Evans et al. 2015, 5). Thus, approximately 82% of ESCOs funded their own EPCs using working capital. As a result, ESCO projects remain small in China, with typical project size between €90,000 and €900,000 (compared to €1.8 million to €14 million in U.S. and European markets). (Evans et al. 2015, 28). While bank loans comprise the majority of third-party financing options for ESCOs, other available sources of financing include private equity and venture capital, public equity, lease financing, special bank programs, ESCO industry development funds, international donor agency financing EPC trading/factoring/forfeiting. However, all of these are being experimented with at a minimal scale (Evans et al. 2015, 5-6).
Key Market Segments and Barriers The market segments in China do not differ from those outlined in Section II of this paper, however, it is worth recognizing that the majority of EE projects by ESCOs occur in the industrial sector in China. In 2013, the share of total industry sector EPCs was 72%, compared to 21% in buildings and 7% in transportation (Evans et al. 2015, 3). Within the buildings sector, most EE projects occur in commercial buildings. Untapped market segments for ESCOs include the MUSH market and multifamily residential (Evans et al. 2015, 30). Interestingly, MUSH has historically been the leading segment in the U.S., due to credit quality and time horizon for hosts to remain in the property (aligned with tenor of financing). The MUSH market holds considerable potential but is underdeveloped in China due to government policies which link buildings’ energy budget to pre-established energy-use thresholds based on region and building type, as well as the previous year’s actual energy expenses. While these policies incentivize buildings to reduce energy usage, the energy budget allowance reduces the buildings’ ability to remit payment on savings. As a result, ESCOs do not pursue MUSH market projects because they cannot benefit from the cost saving (Evans et al. 2015, 13).
Overall Barriers to Building EE Financing in China While the MUSH market faces unique institutional barriers that must be addressed at a political level, the following are overarching barriers to building EE financing in China.
Lack of Technical Capacity, Information, and M&V Standards and Tools To function well, markets require information and lack of, and asymmetric, information have long been acknowledged as barriers to building EE investment (Hsu 2013; IEA 2007). First, lack of publicly available information on a building’s previous and current energy characteristics prevents project owners and financiers in China from investing in building EE, as the costs and savings from the EE project cannot be predicted, calculated, and verified (Hsu 2013; Pan et al. 2016). Added to this is the fact that China does not have a legally enforceable national standard for evaluating the savings of EE projects (Shen et al. 2012, 22). In the absence of public information and a well-designed monitoring and verification (M&V) protocol, banks lack third-party M&V schemes that can provide independent verification of savings and must rely on the estimated energy and cost savings of the implementing ESCO, which are often exaggerated (Pan et al. 2016; Shen et al. 2012, 22). In a stakeholder workshop co-convened by LBNL and Price Waterhouse Cooper (PWC) in Shanghai, China on October 20, 2016 to identify barriers to EE financing, major Chinese commercial banks, including Bank of Shanghai (BOS) and Shanghai Pudong Development Bank (SPDB), noted the actual cost savings on the EE projects they loaned money to were much lower than anticipated. This resulted in delayed repayment and default (Wei and Li 2016). While this barrier is not unique to China, it is among its most critical. Thirdly, due to the newness of the energy services market in China, bank loan officers lack understanding of EE technologies as well as to outside experts that could assess these risks for them (as exist in developed markets). This results in
6
incapacity to identify technical risks of projects and create appropriate risk controls (IFC and EMCA; Shen et al. 2015, 22).
Lack of Credit System that Facilitates Lending to Hosts In 2006, the People’s Bank of China, created a national credit database which consists of credit information for 600 million individuals and 16 million businesses across China. The database it is accessible to all banks and financial institutions that rely upon the information to make their investment decisions (Shen et al. 2012, 15). While China has a credit database, there are gaps in standards and criteria for independent financial audits and questions as to the reliability of audited financial statements in China, making assessment of the creditworthiness generally difficult (Evans et al. 2015, 12). Where creditworthiness can be assessed, ESCOs often do not meet required credit ratings for bank loans. First, at present, most ESCOs are small and medium enterprises (SME) (with less than 10% having assets and working capital greater than €9.4 million) (Evans et al. 2015, 48). Due to strict government regulations, banks require very high credit ratings to make loans. Often, SMEs cannot meet these high credit ratings (as they are often startups delivering services around niche technologies (Shen et al. 2012). Furthermore, even if SMEs do meet credit rating requirements, the amount of loans being offered by banks exceeds what SMEs need for financing, and banks are not interested in issuing smaller portion loans to SMEs due to economies of scale (Dudovsky 2012). In addition to inadequate credit scores, as light asset companies, Chinese ESCOs also do not meet collateral requirements of banks. Further, they often rely on government subsidies for their loan repayment plans. Since subsidies can be cancelled on short notice (as happened with solar photovoltaic), banks are reluctant to offer loans (Pan et al. 2016). As a result of these credit barriers, there is an imbalance in investment between China’s small and large ESCOs. In a 2014 ESCO Committee of China Energy Conservation Association (EMCA) survey, 1,866 ESCOs reported a total investment from banks of €4.13 billion. Approximately 50% of the loan value was to only 5% of registered ESCOs (Evans et al. 2015, 2). Another survey by the IFC substantiated this, as it found among 446 Chinese ESCO companies surveyed, 72% (322) have encountered financing difficulty. For those companies indicating no financing difficulty, the majority are state-owned enterprises or stock-listed companies (IFC and EMCA, 98).
Recent Examples of Successful Capital Market Engagement in Building EE Financing Market actors are innovating new mechanisms for financing building EE that address these barriers. The following are examples of successful capital market engagement in building EE financing which may offer lessons for replication and scale-up within and across geographies and market segments.
Bulgarian Energetics and Energy Savings Fund (EESF) Type: Factoring (forfeiting); Credit Risk: Host municipal risk backed by federal guarantee; Performance Risk: Assumed by host; Aggregation: Multiple EPCs under a single ESCO EESF is special purpose company, supported by the European Bank for Reconstruction and Development (EBRD) and listed on the Bulgarian Stock Exchange. EESF finances the energy services business of Enemona AD, a construction and engineering firm in Bulgaria and the majority shareholder in the fund. EESF is privately managed and typically provides EE projects for schools, hospitals, and other public buildings in Bulgaria (Economic Commission for Europe 2010). Most projects have a seven-year term (Evans, Roshchanka, and Baranovskiy 2012, 10). Since 2008, EBRD has provided Enemona AD with loans totally €17 million to purchase future receivables from EPCs carried out by Enemona AD (Bullier and Milin 2013). This practice, called forfeiting, allows Enemona AD to provide off-balance sheet financing to its clients without affecting its own balance sheet (Economic Commission for Europe 2010). The fund earns a profit by discounting the value of the receivables it purchases (typically between 10 to 15%), which becomes the cost of financing. The ESCO prices the project to include its implementation costs, profit, and the presumed discount rate. The fund and ESCO coordinate closely on municipal risks and pricing. The fund addresses credit risk by investing in projects in municipalities with low risk and drawing on the Bulgarian government’s guarantee, which allows the fund to obtain payment from a government agency when the ESCO’s remittance is 30 days overdue. The ESCO guarantees the project savings even after it sells the receivables. If the savings are below the guaranteed level, the host will still pay the fund the same fee, but the ESCO must pay the host the difference between the actual savings and the guaranteed amount. Thus, the fund does not take the technical savings risk. Since 2006, EESF has purchased receivables under more than 20 EPCs with a total value of more than €5.6 million (Evans, Roshchanka, and Baranovskiy 2012). While this is an innovative model with replication potential in emerging markets, this approach does require that a secondary buyer be able to purchase a stream of and be willing to hold the portfolio until maturity (Rugova 2016).
7
EBRD Sustainable Energy Finance Facilities (SEFFs) Type: Market and subsidized lending facility; Credit Risk: Concessional and market funders; Performance Risk: Concessional and market funders; Aggregation: Facility available to multiple lenders EBRD’s SEFF provides credit lines to local financial institutions to promote EE to SME and corporate and residential borrowers. One SEFF example is the Turkish Sustainable Energy Finance Facility (TURSEFF), which was launched in 2010 to overcome barriers including: the private sector investors’ misjudgement of risks and benefits of EE projects; banks’ insufficient capacity to identify, evaluate, and process EE projects; and banks’ limited access to long-term financing for EE. TURSEFF combined concessional funding from the Clean Technology Fund (CTF), non-concessional funding from the EBRD, and technical assistance (TA) to banks and investors financed by the European Union and the CTF. Concurrently, the International Bank for Reconstruction and Development (IBRD) and IFC created similar financing facilities to establish market demand. As of 2014, TURSEFF partner banks had disbursed loans to 370 sustainable energy projects with a total project value of €432 million. The average value of these loans was €657,000 and approximately 65% were allocated for EE projects. To-date, these projects have generated primary energy savings of nearly 1.5 terrawatt hours (TWh) per year (SEI 2014).
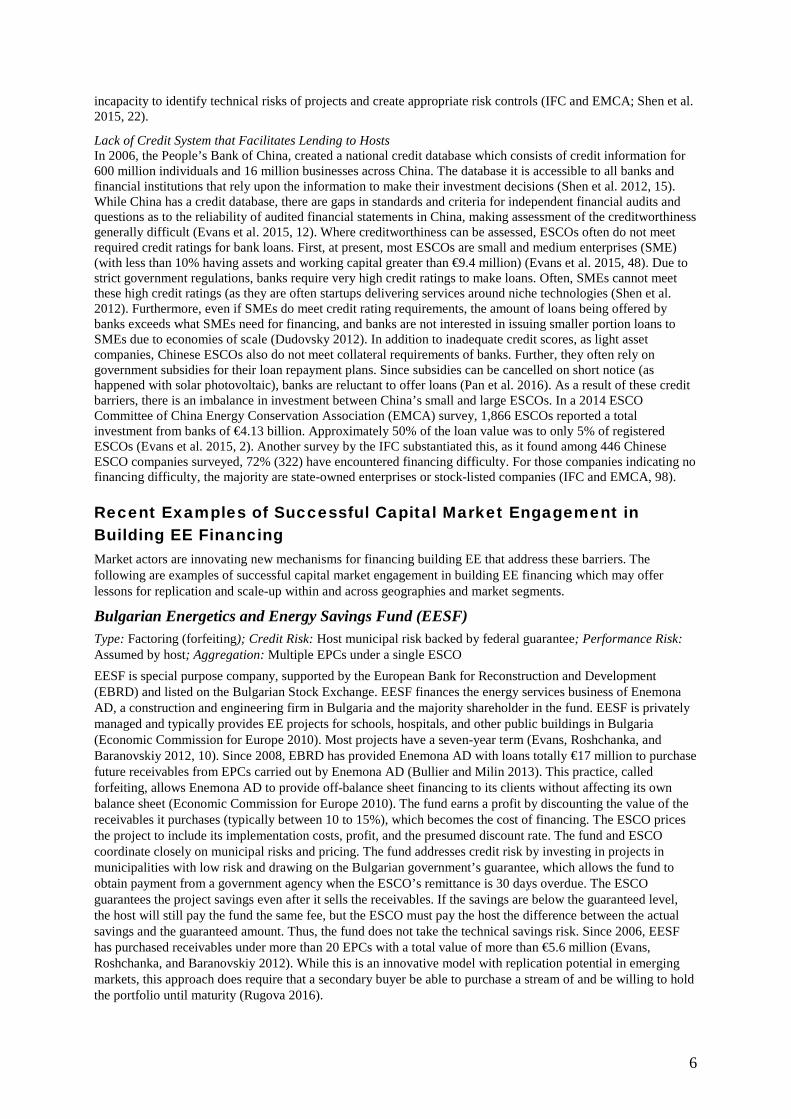
BlocPower - Crowdsourced Microfinance for EE in Underserved Communities Type: Crowdsourcing; Credit Risk: OBR and Equity credit enhancement; Performance Risk: Host; Aggregation: Partnerships and Institutional Networks Crowdsourcing mobilizes individuals to dedicate small amounts of money toward a common objective. Depending on the platform, investors receive equity in the enterprise, product, or other compensation (Fundable). BlocPower is a crowdsourcing platform that aims to market, finance, and install EE retrofits in 100 <5,000 square meter properties in financially underserved communities in the United States. It addresses two key challenges: (1) the inability of traditional public EE and clean energy programs to access a €40 billion market for EE in financially underserved communities in the United States, (2) the inability of 60 million Americans to invest in EE. BlocPower acquires potential projects for retrofit though institutional networks (e.g., Emerald Cities Collaborative). Projects are selected based on a stringent credit analysis. As shown in Figure 2.0 below, selected projects are then placed into a special purpose vehicle (SPV). BlocPower provides equity capital as a credit enhancement (5-20%), and investors and financial institutions provide debt capital (80%-95%). Cash flow from savings are distributed to customers, lenders, and BlocPower. Local utilities or third party billing agents collect payment from customers on monthly energy bills and make payments to BlocPower. Lower payment default rates result due to the risk of electricity shut off. Overall, the project estimates deployment of €94 million for EE projects, resulting in €94 million in energy cost savings, 200,000 tons of CO2 emissions avoided, and 50
new jobs created. (Baird 2015). Figure 2.0 BlocPower Financing Structure (Baird 2015)
Energy Reduction Asset (ERA) Fund Type: Equity fund applying YieldCo model; Credit Risk: Loan loss reserve; Performance Risk: Insurance; Aggregation: Fund structure
8
In 2014, Joule Assets, Inc. launched the Energy Reduction Asset (ERA) Fund, a €94 million private equity fund for investment in EE and demand response projects globally which substantially draws on the YieldCo model. 2 In this case, the YieldCo model creates a low-risk entry point for accredited investors into the €846 billion energy reduction assets market (CleantechIQ 2014).3 The ERA Fund aggregates small- to medium-size EE and demand response projects requiring capital between €47,000 to €470,000. The ERA Fund mitigates performance risk, credit risks, and high transaction costs that have traditionally inhibited investment in small to medium-size EE projects. It does this by requiring no up-front payment from the end-user (Bresina 2015). It also provides a loan-loss reserve (covering 10 to 20% of the loan value of projects) and performance guarantees backed by third-party insurers (CleantechIQ 2014). Additionally, the ERA fund accelerates project financing by allowing non-credit-rated customers finance through specialized mitigation tools and offering revenue-sharing with customers, which reduces the effective rate by offsetting the interest repayment through demand response and rebates. (Bresina 2015). After management expenses, the ERA Fund yields of 11% to 14% (the first 6% of which is secured by reserve funds, making its returns on-par with most YieldCos) (Konrad 2014).
Warehouse for Energy Efficiency Loans with Renewable Funding (WHEEL) Type: Warehouse facility and asset-backed securitization (ABS); Credit Risk: Host credit quality; Performance Risk: N/A; Aggregation: Platform for multiple state programs
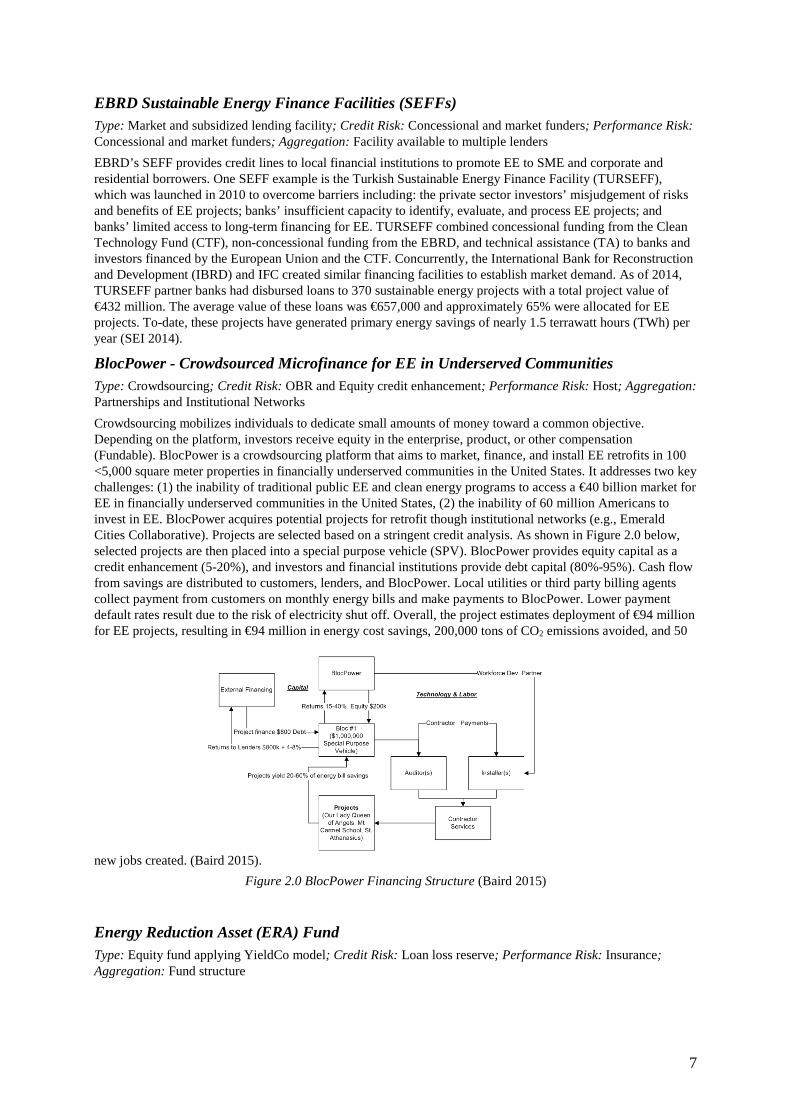
The Energy Programs Consortium, Pennsylvania, U.S. Treasury, Renewable Funding, and Citi worked together in launching a secondary market for low-cost, consumer EE loans through WHEEL, a national platform for the
aggregation and securitization of unsecured consumer EE loans originated by state programs. As illustrated in Figure 3.0, the consumer EE loans were aggregated into a diversified pool and used to support the issuance of rated asset-backed notes sold to capital markets investors. Proceeds from the note sales were used to recapitalize WHEEL, allowing it to continue purchasing eligible loans from state and local programs for future rounds of bond issuance. The loans were fully amortizing, monthly pay, fixed rate with a maximum original term of 10 years and prime credit underwriting, with some capacity for non-prime obligors (Citi 2014).
Figure 3.0 WHEEL EE Financing Structure (SEE Action 2015)
Delaware Sustainable Energy Utility (SEU) Type: State general bond issuance; Credit Risk: State credit quality and appropriations support; Performance Risk: ESCO guarantee; Aggregation: State aggregator General obligations bonds (private or public) are one type of bond sale (ABS being the other) to generate capital for EE projects. Bonds are issued by a state or municipality (or other public or quasi-public entity) and are backed by the public entity, supported by cost savings derived from underlying EPCs. They are relatively simple
2 YieldCos are dividend growth-oriented public companies spun off from their parent companies for the sole purpose of bundling and holding long-term contracted operating assets in order to generate predictable cash flows. YieldCos allocate cash available for distribution to shareholders in the form of dividends. The capital raised can be used to finance new projects at low rates (Urdanick 2014). 3 An energy reduction asset (ERA) is a term for any unit of energy reduced, which has become a tangible asset (SteamFeed 2015).
9
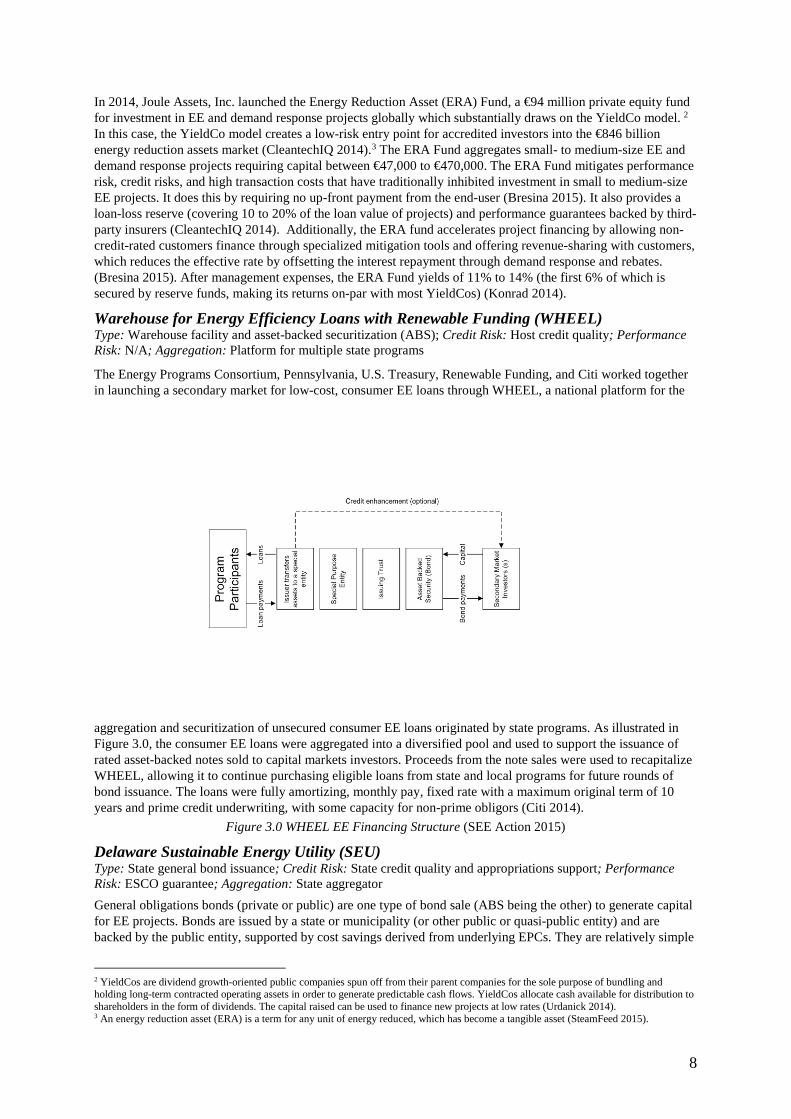
with low transaction, legal, and investment banking fees and rating methods. Municipal bonds have been used in all market segments in the United States to access secondary market capital for EE projects (though to a very limited extent). An early proof-of-concept is Delaware’s SEU, the structure of which is shown in Figure 4.0 below. The Delaware SEU issued €68 million in tax-exempt municipal bonds in 2011 to support implementation of ESCO projects across multiple state entities aggregated by the SEU. Annual appropriations for utility payments by state entities, combined with ESCO guaranteed savings enhances state obligation, however this aspect is subject to annual appropriations risk (SEE Action 2015).
Figure 4.0 Delaware SEU EE Financing Structure (SEE Action 2015)
U.S.- China Green Building Energy Efficiency Fund Type: Private Equity Fund / Public-Private Partnership; Credit Risk: Local government guarantee; Performance Risk: Local government equity; Aggregation: Fund structure The U.S.-China Green Building Energy Efficiency Fund was launched in 2015 to accelerate the deployment of U.S. technology and expertise for energy efficient buildings in China. The fund utilizes a unique Public-Private-Partnership (PPP) model. Unlike traditional private equity funds, where investments come ahead of projects, this fund identifies projects first and then identifies appropriate financing mechanisms and funding sources. Fund participants include financial institutions, private firms from both the United States and China, and Chinese local government. The role for Chinese local government is as an investor and guarantor for the project (Zhang, 2016). An example of a recently launched project is that led by the Zhenjiang Green Development Industry Fund. The project scope includes upgrades for enterprises in Zhejiang Province, southern Jiangsu, and the Yangtze River Delta, costing an estimated €408 million. Zhenjiang Municipal People’s Government authorized the Zhenjiang State-owned Investment Holding Group Co., Ltd. to contribute 75%, and the U.S.-China Building Energy Efficiency Fund to contribute the remaining 25% to the project. The funds are invested in three instalments of €136 million each. The Zhenjiang Green Development Industry Fund oversees the daily operation and marketing of the project. The Zhenjiang State-owned Investment Holding Group Co., Ltd. and the U.S.-China Building Energy Efficiency Fund jointly operate a fund management company, where the former holds 75% of the equity and the latter holds 25% of the equity (Zhejiang Government 2016).
Chongqing Commercial Building Energy Efficiency Type: Government contract and subsidy; Credit Risk: ESCO; Performance Risk: ESCO; Aggregation: Contract for bulk (square meters) in multiple properties Chongqing, China had the goal of retrofitting 4 million square meters of commercial buildings and reducing building energy usage intensity by at least 20%. To achieve this, in 2011, Chongqing municipal government hired out Tongfang Co. Ltd., a listed company with EE retrofit expertise and high credit rating, allowing it to secure a €272 million from the Bank of Chongqing. The Municipal Finance Bureau also offered €2.04 per square meter for buildings with 20-25% energy intensity reduction, and €2.72 per square meter for building with at least 25% energy intensity reduction. This was combined with another central government subsidy of €2.72 per square meter for commercial buildings that reduce 20% after retrofit. As shown in Figure 5.0 below, an innovative aspect of the project was that Tongfang’s subsidiary company, Technovator International Ltd., subcontracted the retrofit projects to 30 local start-up companies. Technovator transferred its technology and

10
expertise to those local start-up companies with the hope of acquiring them after the projects were completed to expand business in Chongqing. In addition, Technovator shared 20% of the profit with building owners to spark their interests in participating in the retrofit. By the end of 2015, Chongqing had successfully completed its targeted 4 million square meters of retrofits, with 107 public buildings retrofitted. Encouraged by the success of the first round of retrofitting project, Chongqing government has decided to retrofit another 3.5 million square meters of commercial buildings using the same model (Mo 2016).
Figure 5.0 Chongqing Commercial Building EE Financing Structure (Mo 2016)
Current Exploratory Work the United States and China As discussed in Section III of the paper, one of the key overarching barriers to capital market engagement in building EE projects across all geographies is the inability of lenders to assess creditworthiness of BEE projects efficiently and at-scale. In China, the problem runs somewhat deeper, in that the newness of the energy services market prevents adequate assessment and control of technical risks, thereby resulting in lending to creditworthy conglomerates with ESCO businesses, as opposed to specific building EE projects. Interestingly, what this suggests is that while credit risk is extremely important in China, lenders in this market are also basing their investment decisions to a large extent on the performance of the building EE project; the ability of the ESCO to perform measures as specified or guaranteed. This is not the case in the United States and Europe, where, lending is to hosts and what matters most is whether the building is an ongoing viable property capable of paying its bills (regardless of the technical performance of the project). In light of these conditions, the U.S.-China CERC-BEE team has identified the following as the most promising collaboration opportunities to increase EE investment in both the United States and China.
Data Transparency and Benchmarking Policies Data transparency and benchmarking policies require building owners to evaluate a building’s energy performance using standardized rating tools and to disclose these results publicly (Dunsky and Hill 2013). The rationale for these policies is that publicizing building energy performance allows the market to properly account for and value EE (Dunsky et al. 2009). From the perspective of lenders, publicly available information on a building’s previous and current energy characteristics encourages investment in building EE, as the costs and savings from the EE project could predicted, calculated, and verified (Hsu 2013; Pan et al. 2017, 26). Currently, under CERC-BEE, U.S. and Chinese researchers are working to advance benchmarking and data transparency policies in both countries by identifying the set of data points necessary to identify the minimum set of data points that should be disclosed to support retrofit project identification and M&V of savings.
Building Retrofit Analysis and M&V Tool The U.S.-China CERC-BEE team is also collaborating with private industry to develop a free, public-access, open-source, on-line, tool which facilitates up-front assessment of retrofit opportunities and M&V of energy and cost reductions in buildings for China and the United States. The tool is based on Johnson Control Inc.’s LEAN Energy Analytic Tool and the American Society of Heating, Refrigeration, and Air Conditioning Engineers (ASHRAE)’s Inverse Modeling Toolkit) (Kissock, Haberl, and Claridge 2003). The tool utilizes basic building data (size, location, monthly energy usage) to quantify energy and cost savings potential for a building, identify retrofit opportunities, and to monitor and verify savings following retrofits. It will provide both U.S. and Chinese financial institutions (and third-party verifiers) with an efficient and cost-effective way to predict, calculate, and verify the savings from BEE retrofit projects.
Insurance Products for Building EE

11
The U.S.-China CERC-BEE team is also partnering with the China Association of Building Energy Efficiency (CABEE) to explore the development of an energy performance insurance product for BEE. In this case, an insurance company (with technical and engineering expertise) would assess and bear the technical risk of a BEE project, allowing Chinese lenders to focus on exclusively on underwriting the credit risk of the borrower and insurer. (Evans et al. 2015, 7-8).
Standardized Contract Documentation Lastly, the CERC-BEE team is evaluating opportunities to establish a national standard EPC for building EE projects, as was done at a state level in the case of the Delaware SEU. By following the lead of the U.S. solar photovoltatic industry which, in just a few years, developed standardized contracts for renewable energy credits (REC) for solar projects with the support of the national government and private industry (SolarCity, Sungevity), thereby facilitating numerous secondary market transactions (Clark 2015). The CERC-BEE team is exploring whether similar potential exists for the U.S. and Chinese markets and beginning to identify the relevant stakeholders and possible paths toward national standards for building EE project EPCs in both countries.
Conclusions There has never been a more urgent need to increase the investment in building EE globally. Capital markets and EE practitioners must work together to bridge the EE gap by creating new tools, policies, and financing mechanisms that overcome project technical and credit risk. Given that the barriers to building EE investment differ by geography and market segment, there is no one-size fits all solution. However, there are common points of intersection, and by sharing successful cases from around the world, the authors hope that lessons can be learned and new solutions developed. The U.S.-China CERC-BEE’s work in the United States and China has shown that both countries must enhance creditworthiness of hosts and facilitate efficient and cost-effective assessment of project creditworthiness at scale, and is therefore exploring standardized building EE contracts to do this. In China, where the energy services market is relatively new, the team is also advancing data transparency policies, insurance products, and new M&V tools to support better assessment of technical risk and verification of energy and cost savings.
References Baird, D. 2015. “Crowdsourced Microfinance for Energy Efficiency in Underserved Communities.” Presentation
at the 2015 Building Technologies Office Peer Review. Becque, Renilde, E. Mackres, J. Layke, N. Aden, S. Liu, K. Managan, C. Nesler, S. Mazur-Stommen, K.
Petrichenko, P. Graham. 2014. Accelerating Building Energy Efficiency: Eight Actions for Urban Leaders. Washington, DC: World Resources Institute (WRI) Ross Center for Sustainable Cities and Johnson Controls, Inc.
Bresina, D. 2015. “Incenergy Partners with Joule Assets: Financing for Global Energy Efficiency Projects.” Incenergy, March 25. http://www.incenergy.com/incenergy-partners-with-joule-assets-financing-for-global-energy-efficiency-projects/.
Bullier, Adrien, and C. Milin. 2013. “Alternative Financing Schemes for Energy Efficiency in Buildings.” In 2013 ECEEE Summer Study Proceedings, 796-805. Stockholm, Sweden: ECEEE.
Campbell, M. 2016. “How Energy Efficiency Enables Stable Capital Markets.” RMI Outlet, January 27. http://blog.rmi.org/blog_2016_01_27_how_energy_efficiency_enables_stable_capital_markets.
Citi. 2014. Renewable Funding: Energy Efficiency Warehouse Facility Case Study. April 8. New York: Citi. Citi. 2016. Energy Efficiency Financing Solutions. November. New York: Citi. Clark, A. 2015. “Citigroup: Energy Efficiency Industry Needs to Talk Securitization.” GreenBiz, February 9
https://www.greenbiz.com/article/citigroup-energy-efficiency-industry-needs-talk-securitization. CleantechIQ. 2014. “Joule Assets Provides Access to $900B Energy Reductions Asset Market.” CleantechIQ,
February 10. http://cleantechiq.com/2014/02/new-joule-assets-fund-provides-access-to-900b-energy-reductions-asset-market/.
Dudovsky, J. 2012. “SMEs in China: Overview.” Research Methodology, August 8. http://research-methodology.net/small-and-medium-enterprises-in-china-overview/.
Dunsky, P. and Hill, A. 2013. Building Energy Rating and Disclosure Policies: Update and Lessons from the Field. Massachusetts, U.S.: Northeast Energy Efficiency Partnerships.

12
Dunsky, P., J. Lindberg, E. Piyalé-Sheard, and R. Faesy. 2009. Valuing Building Energy Efficiency Through Disclosure and Upgrade Policies: A Roadmap for the Northeast U.S. Massachusetts, U.S.: Northeast Energy Efficiency Partnerships.
Economic Commission for Europe. 2010. Financing Global Climate Change Mitigation. New York and Geneva: United Nations.
Energy Efficiency Financial Institutions Group (EEFIG). 2015. Energy Efficiency – the First Fuel for the EU Economy: How to Drive New Finance for Energy Efficiency Investments. European Union.
Environmental Defense Fund (EDF). 2016. “ICP Europe Launches Investor Network, Aims to Boost Investment in Energy Efficiency by €1 Billion.” https://www.edf.org/media/icp-europe-launches-investor-network-aims-boost-investment-energy-efficiency-eu1-billion.
Evans, M., S. Yu, V. Roshchanka, M. Halverson, B. Shen, L. Price, M. Liu, M. Lu, M. Pei, and D. Fan. 2015. White Paper: Unleashing Energy Efficiency Retrofits Through Energy Performance Contracts in China and the United States. Berkeley, CA: Lawrence Berkeley National Laboratory.
Evans, M., V. Roshchanka, S.A. Parker, A. Baranovskiy. 2012. Energy Efficiency Investments in Public Facilities: Developing a Pilot Mechanism for Energy Performance Contracts (EPCs) in Russia. USA: Pacific Northwest National Laboratory.
Fundable. “What is Crowdfunding?” the startups.co platform. Accessed January 13. https://www.fundable.com/learn/resources/guides/crowdfunding-guide/what-is-crowdfunding.
Goldman Sachs. 2014. “Interactive Guide to Capital Markets.” Goldman Sachs. http://www.goldmansachs.com/s/interactive-guide-to-capital-markets/.
Hsu, David. 2013. “How Much Information Disclosure of Building Energy Performance is Necessary.” Energy Policy 64: 263-272.
IEA (International Energy Agency). 2007. Mind the Gap: Quantifying Principal-Agent Problems in Energy Efficiency. Paris, France: Organization for Economic Cooperation and Development (OECD)/IEA.
IEA. 2013. Transition to Sustainable Buildings: Strategies and Opportunities to 2050. Paris, France: International Energy Agency.
International Finance Corporation (IFC) and EMCA. China Energy Service Company (ESCO) Market Study. Beijing, China: IFC and EMCA.
IPEEC (International Partnership for Energy Efficiency Cooperation). 2016. 2016 Activity Report of the G20 Energy Efficiency Finance Task Group (EEFTG). October 13. Paris, France: IPEEC.
Joule Assets. “Flexible Financing.” Accessed January 1 2017. http://www.jouleassets.com/contractors/. Kissock J.K., J.S. Haberl, and D.E. Claridge. 2003. Inverse Modeling Toolkit: Numerical Algorithms. American
Society of Heating, Refrigerating and Air-Conditioning Engineers (ASHRAE). Konrad, T. 2014. “Five Clean Energy YieldCos You May Not Have Heard About.” Greentech Media,
September 8. https://www.greentechmedia.com/articles/read/five-clean-energy-yieldcos-you-may-not-have-heard-of.
Mo, K. 2015. Financing Energy Efficiency Buildings in Chinese Cities. Washington, DC: Paulson Institute. Pan, Z., J. Qian, Y. Wang, S. Yiyang, L. Pike, X. Zhou, and Y. Zheng. “Feasibility Study on Building Energy
Performance Benchmarking and Disclosure in China.” Unpublished report, last modified December 16, 2016. Microsoft Word file.
People’s Bank of China (PBOC). 2016. “The People’s Bank of China and Six Other Agencies Jointly Issue ‘Guidelines for Establishing the Green Financial System.’” PBOC. http://www.pbc.gov.cn/english/130721/3131759/index.html.
Rugova, Q. 2016. Financing Energy Efficiency Through Publicly Listed “YieldCo” Vehicles. Geneva, Switzerland: Geneva Summit on Sustainable Finance.
Shen, B., L. Price, J. Wang, M. Li, and Z. Lei. 2012. China’s Approaches to Financing Sustainable Development: Policies, Practices, and Issues. Berkeley, CA: Lawrence Berkeley National Laboratory.
Shen, B., L. Price, L. Xu, M. Lu, S. Wenjing, M. Evans, V. Roshchanka, S. Yu. 2015. Expanding Energy Performance Contracting in China: Policy Solutions and Market Mechanisms. Berkeley, CA: Lawrence Berkeley National Laboratory.
State and Local Energy Efficiency Action Network (SEE Action). 2015. Accessing Secondary Markets as a Capital Source for Energy Efficiency Finance Programs: Program Design Considerations for Policymakers and Administrators. Washington, DC: SEE Action.

13
SteamFeed. 2015. “Joule Assets Launches Joule Energy Reduction Assets Fund, Opens Previously Closed Demand Response and Energy Efficiency Markets to Accredited Investors.” SteamFeed, June 16. http://www.steamfeed.com/joule-assets-launches-joule-energy-reduction-assets-fund-opens-previously-closed-demand-response-and-energy-efficiency-markets-to-accredited-investors/.
Stocker, T.F., D. Qin, G.-K. Plattner, M. Tignor, S.K. Allen, J. Boschung, A. Nauels, Y. Xia, V. Bex and P.M. Midgley. 2013. IPCC, 2013: Climate Change 2013: The Physical Science Basis, Contribution of Working Group I to the Fifth Assessment Report of the Intergovernmental Panel on Climate Change. Cambridge and New York: Cambridge University Press.
Sustainable Energy Initiative (SEI). 2014. Case Study, Turkish Sustainable Energy Financing Facility (TURSEFF). Washington, DC: The World Bank Group.
Urdanick, M. 2014. “Renewable Energy Project Finance: A Deeper Look into Yieldco Structuring.” National Renewable Energy Laboratory (NREL). https://financere.nrel.gov/finance/content/deeper-look-yieldco-structuring.
Wei Y. and Z. Li. “Uncovering Barriers and Solutions to Building Energy Efficiency Interactive Workshop.” Roundtable Discussion, Shanghai, China. 2016.
Zhang, Mo. 2016. “中美建筑节能基金首批投资项目将出炉.” Economic Information Daily, April 22. http://jjckb.xinhuanet.com/2016-04/22/c_135301812.htm.
Zhenjiang government. 2016. Green Finance Background Information for Zhenjiang Government.
Acknowledgments The work was supported by The Energy Foundation, Rocky Mountain Institute, and the U.S. Department of Energy’s Building Technologies Office (BTO) under Lawrence Berkeley National Laboratory Contract No. DE-AC02-05CH11231.