Lessons From EmployBridge: Benchmarking A/R Shared Service ...
60
WEBINAR
Transcript of Lessons From EmployBridge: Benchmarking A/R Shared Service ...

WEBINAR

Presenters
Jason Herrington Elaine Nowak
Senior Director of CollectionsDirector of
Product Management and Marketing
Sarah Fane
Head of Content

• Send me your question early
• Use this opportunity to get the answers/info you seek
• The sooner you send me the question, the more likely it will be asked
• Remember to stay on for Q&A in the last 10 minutes of the session
Questions

Your copy of the slides
The slides will be available
after the webinar at
www.sharespace.digital

Order-to-cash and Accounts Receivable GPOs today are moving away from a simple cost-optimization
approach when managing their shared service centers.
To drive higher value, more and more Accounts Receivable leaders are focused on delivering better
customer service, with minimal touchpoints and seamless internal collaboration.
Shared service order-to-cash leaders are benchmarking their operations against their industry peers to
note how top-performing counterparts are managing disparate systems and customer relationships
differently from themselves.
Context

Agenda
1.
2.
3.
4.
5.
Evolution of the Role of an Order-To-Cash Global Process Owner
Benchmarking: The What and How
Digital Transformation For Order-To-Cash Shared Service Centres
Digital Transformation from the O2C Perspective: The EmployBridge Automation Story
Benchmarking Your Digital Transformation Project
6. About HighRadius
Agenda

Poll Question
01 What is your plan for your A/R Shared Services In 2021?
1. Leverage our current model to drive further cost optimization
2. Focus on recovery from COVID-19
3. Leverage our current model to provide higher value and
competitive edge
4. We are yet to create a fixed plan for 2021

Evolution of the Role of an Order-To-Cash
Global Process Owner

Top focus areas for every finance leader in 2021 is driving
working capital and improving cash flow
Expectations from Order-To-Cash is high
as it is an important strategic lever to achieve the said objectives

10
Today Order-To-Cash GPOs are Expected to Do Much More
2010+
GPOs had to ensure the survival and proper functioning of Order-
To-Cash in different Business Units
GPOs now need to take the lead to ensure the BUs are
driving working capital and cash flow improvement
2020+

11
Today Order-To-Cash GPOs are Expected to Do Much More
Global Process Owner
GPOs today face heightened expectations from across the chain of command
GPOs have tremendous pressure to perform

12
Most GPOs are Turning Towards Technology as a Result
● Would drive profit
● Would increase team productivity
● Would increase the efficiency
But Is Automation Enough?
90% of respondents in an SSON survey mentioned that Automation is the key to adapt their shared services operations to the current business climate

As per Gartner, 85% AI-Powered
Transformation Projects End In Failure!

14
Where Do Things Go Wrong
BAD APPROACHAutomation is not the end goal
It is a means to achieve the end business goal
Any Digital Transformation exercise needs to begin with
understanding the results that you need to drive
BENCHMARKING is the first step of any successful digital transformation project

15
Why Benchmarking
Benchmarking helps you make well-informed decisions from both business context as well as personal context
Clearly define the goals of your
digital transformation exercise
Manage the expectations from
across the chain of command
Business Context Personal Context

Benchmarking: The What and How

Defining Successful Benchmarking
The following are the three steps for an effective benchmarking
321
Identify what data
do you want to
measure
Determine if the
measures are actionable
and meaningful
Understand how
frequently you would
need to measure
Data Action Frequency

What to benchmark
Process Benchmarking:Perform detailed assessment of the current processes to identify maturity gaps. Track the key metrics such as:
Hit rate DSO Past-due invoicesUnapplied cash
People Benchmarking:Reassess the skillsets of your team while also critically evaluating yourself as an employer:
Average salary
costs
No. of accounts per
userCommunication skills Problem-solving skills
Benchmarking: The What
Benchmark to evaluate your processes against a best-in-class industry standard

Benchmarking: The How
The APQC framework for benchmarking end-to-end order-to-cash

Top performers’ O2C process costs are almost 2.5X less than bottom performers
N=598
The Cost of O2C Processes Between Different Tier Performers
Source: APQC

Likewise, top performers’ O2C FTE number is a little under half of that of bottom performers
N=1,983
The Number of FTEs in O2C Processes Between Different Tier Performers
Source: APQC

Process-specific KPIs
The productivity disparity between top and bottom performers for credit and receivables is dramatic
Number of Receipts Processed per A/R FTENumber of Credit Reviews per Credit FTE
N=241 N=2,467
The Productivity Disparity Across Different Tier Performers
Source: APQC

Process-specific KPIs
In addition, top performers receive the majority of receipts electronically, and report 18 days lower DSO
N=910 N=6,744
The Improvement in Efficiency Across Different Tier Performer
Source: APQC
94% 92%
75%

Treat all your lines of businesses differently
Compare against your own best numbers from the past as well as industry best-in-class
Evaluate how you are doing as an employer while performing people benchmarking
Plan future changes in accordance with the benchmarked results
Track and identify those KPIs that have a direct impact on your organizational goals
Best Practices To Keep In Mind While Benchmarking
1
2
3
4
5
Guidelines on how to benchmark your order-to-cash

Results of Order-To-Cash Benchmarking
Once you complete the benchmarking exercise successfully, you would identify the following:
Identify gaps in your AR
processes
Compare your team performance to others
in the industry
Identify areas where you need to deploy
technology
1 2 3
Digital transformation is the key to fill the gaps identified on benchmarking your order-to-cash processes

Digital Transformation is Not Just Automation
26
Automation = Digital Transformation
Automation is just one part of the Digital transformation
Automation:
✔ Focused on process-metrics improvement
✔Cost optimization through positive ROI
✔Data security and integrity
✔ Seamless internal collaboration
Digital Transformation:
✔Highly focused on end customer experience
✔ Increased employee engagement
✔Promotes a culture of continuous improvement
✔ Leveraging Humans + Machines for business

Digital Transformation For Order-To-
Cash Shared Service Centres

Poll Question
02What stage of A/R digital transformation is your organization currently in?
1. Planning Stage - Deciding product and vendor
2. Deployment Stage - Fixing integrations and testing the system
3. Post-Go Live Stage - Evaluating the new system
4. Have not automated yet
5. Automated a very long time ago
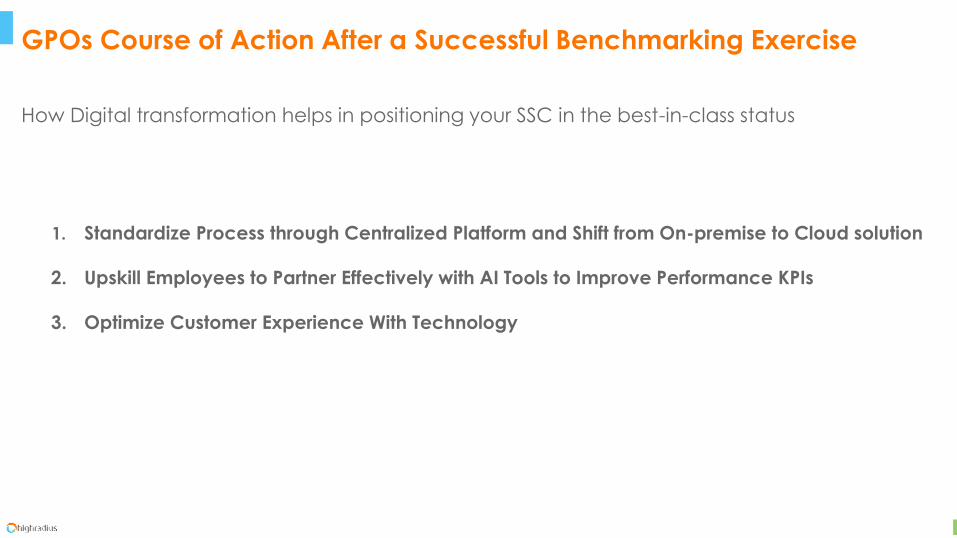
GPOs Course of Action After a Successful Benchmarking Exercise
1. Standardize Process through Centralized Platform and Shift from On-premise to Cloud solution
2. Upskill Employees to Partner Effectively with AI Tools to Improve Performance KPIs
3. Optimize Customer Experience With Technology
How Digital transformation helps in positioning your SSC in the best-in-class status

GPOs Course of Action After a Successful Benchmarking Exercise
Standardize Process through Centralized Platform and Shift from
On-premise to Cloud solution
How Digital transformation helps in positioning your SSC in the best-in-class status

65% respondents said that Cloud-based technologies either form or
are actively in the process of forming most of their tech stack
SSO Global Report 2020 Survey

GPOs Course of Action After a Successful Benchmarking Exercise
1. Standardize Process through Centralized Platform and shift from On-premise to Cloud solution
On Premise Cloud
Needs Regular Maintenance Minimal Maintenance Requirements
Regular Data Backups
IT Resources redirected towards product
Adjustable according to budget
Cloud is built to Scale!
Risk of Data Loss is High
Requires additional IT Support
High capital expenses
Limitations on Scaling services

GPOs Course of Action After a Successful Benchmarking Exercise
Upskill Employees to Partner Effectively with AI Tools to
Improve Performance KPIs
How Digital transformation helps in positioning your SSC in the best-in-class status

GPOs Course of Action After a Successful Benchmarking Exercise
2. Upskill Employees to Partner Effectively with AI aids to improve performance KPIs
Comparing skills demand, today v/s tomorrow
Current
Critical thinking &
analysis
Complex problem
solving
Attention to details,
trustworthiness
Leadership & social
influence
Trending
Creativity, originality &
initiative
Active learning &
strategies
Emotional
intelligence
System analysis &
evaluation
Declining
Management of financial,
material resources
Memory, verbal, auditory
& spatial abilities
Technology and
maintenance
Quality control & safety
awareness
Source: Future of Job Surveys, World Economic Forum
2020 2022

Six Steps to Upskill the Workforce
1 Recognize and re-assess existing roles in the workforce
2 Understand skills demand
3 Hire and nurture the right talent
4 Build employee skills critical to the new business model
5 Start now, test rapidly, and iterate
6 Act like a small company to have big impact
35

GPOs Course of Action After a Successful Benchmarking Exercise
Optimize Customer Experience With Technology
How Digital transformation helps in positioning your SSC in the best-in-class status

GPOs Course of Action After a Successful Benchmarking Exercise
3. Optimize Customer Experience With Technology
Cloud-based, end-to-end automation
platform
Self-service customer portals
Out-of-the-box reporting
dashboards

The EmployBridge Automation Story
Digital Transformation from the O2C Perspective:

Our Benchmarking Journey
1 2 3
Gained visibility intoStaffing Industry KPIs
Right-sized teams for Cash App, Collections, Credit
Developed Standard Operating Procedures

1. Cloud-Based Platform
2. Integration with our Financial
Institutions
3. No ERP Customization to
Implement Solution
4. 75% Zero-touch cash-application
AutomatedCash Application
CollectionsSystem
1. Electronically capture check
images using mobile phone
devices
2. Same-day deposit of customer
checks
1. Tier-based collection strategy
configuration
2. Customizable collections
automation
3. Upgradeable to AI functionality
Mobile Remote Deposit Capture
Electronic Presentment and Payment Portal
1. Fully hosted customer portal for
payment processing
a. Level 2 & 3 credit card
data interchange
b. Credit card surcharging
c. ACH debit
2. Customer invoice presentment,
statements, payment history
reporting
Solutions and Features Desired for the Focus Areas

The Highradius PlatformPioneering the Technology Landscape of Cloud-Based Systems, HRC is the only truly Integrated Receivables Solution for -
CASH APPLICATION
CREDIT COLLECTIONS EIPP
Why did we Choose

CASH APPLICATION
MOBILE REMOTE DEPOSIT CAPTURE CREDITRADIUS ONE COLLECTIONS
2017JANUARY
2019JUNE
2019SEPTEMBER
2020OCTOBER
2020NOVEMBER
Implementation Journey with Highradius

Results Achieved

Cash Application
47% Reduction in Team Size (34 to 16)
75% Remittance to Invoice Match Rate
Unapplied Cash at Period Closed Reduced to 0.34% of AR Balance

Collections
Seamless Integration with Cash Application System
Additional Functionality to Cloud Platform
Tier-Based Dunning Strategy
Seamless Integration with Credit Management System

Mobile Remote Deposit Capture
Eliminated Mail and Express Delivery Lag Time
Eliminated Bank Float to Accelerate Availability to Cash
Same-Day Cash Deposits

RadiusOne Network
$350k reduction of credit card fees
Level II and Level III Data Interchange
Additional Payment Method of ACH Debit
Seamless and Cost-Effective Interaction with Customers

Benchmarking Your Digital Transformation Project

Benchmarking Framework to Track your Digital Transformation End-to-End
Cost calculation of a Digital Transformation undertaking
Product usage metrics
Customer performance metrics
Analyst usage metrics
Key Performance Indicators
Business Value Metrics
Bottom-up
approach
The HighRadius framework to benchmark your Order-To-Cash digital transformation
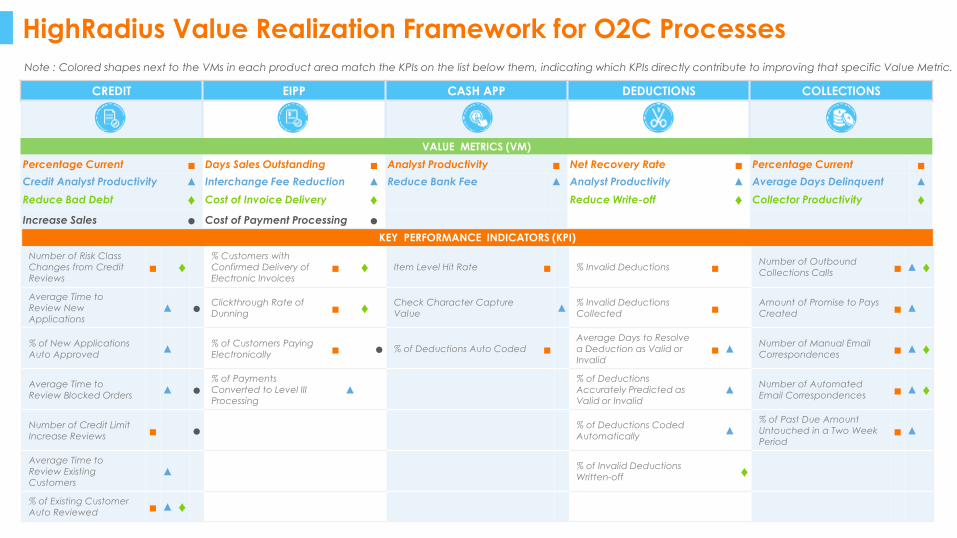
HighRadius Value Realization Framework for O2C Processes
CREDIT EIPP CASH APP DEDUCTIONS COLLECTIONS
VALUE METRICS (VM)
Percentage Current ■ Days Sales Outstanding ■ Analyst Productivity ■ Net Recovery Rate ■ Percentage Current ■
Credit Analyst Productivity ▲ Interchange Fee Reduction ▲ Reduce Bank Fee ▲ Analyst Productivity ▲ Average Days Delinquent ▲
Reduce Bad Debt ♦ Cost of Invoice Delivery ♦ Reduce Write-off ♦ Collector Productivity ♦
Increase Sales ● Cost of Payment Processing ●KEY PERFORMANCE INDICATORS (KPI)
Number of Risk Class
Changes from Credit
Reviews■ ♦
% Customers with
Confirmed Delivery of
Electronic Invoices■ ♦ Item Level Hit Rate ■ % Invalid Deductions ■
Number of Outbound
Collections Calls ■ ▲ ♦
Average Time to
Review New
Applications▲ ●
Clickthrough Rate of
Dunning ■ ♦Check Character Capture
Value▲
% Invalid Deductions
Collected ■Amount of Promise to Pays
Created ■ ▲
% of New Applications
Auto Approved▲
% of Customers Paying
Electronically ■ ● % of Deductions Auto Coded ■Average Days to Resolve
a Deduction as Valid or
Invalid■ ▲
Number of Manual Email
Correspondences ■ ▲ ♦
Average Time to
Review Blocked Orders▲ ●
% of Payments
Converted to Level III
Processing▲
% of Deductions
Accurately Predicted as
Valid or Invalid▲
Number of Automated
Email Correspondences ■ ▲ ♦
Number of Credit Limit
Increase Reviews ■ ●% of Deductions Coded
Automatically▲
% of Past Due Amount
Untouched in a Two Week
Period■ ▲
Average Time to
Review Existing
Customers▲
% of Invalid Deductions
Written-off ♦
% of Existing Customer
Auto Reviewed ■ ▲ ♦
Note : Colored shapes next to the VMs in each product area match the KPIs on the list below them, indicating which KPIs directly contribute to improving that specific Value Metric.

About HighRadius

2006
On-PremiseSolutions
2010
CloudSolutions
2014
Artificial
Intelligence
2019
Autonomous
Systems
2017
StrategicInvestments
Trusted By
200+ Fortune 1000Companies
$ 1 Trillion +transactions processed annually
2020
PERFORMANCE
A/R Suite for Mid-Size Businesses
Series B | $1b+ Valuation
New Products & IP
Credit EIPP Cash App Deductions Collections
Integrated Receivables
Treasury Management
Cash Forecasting
Cash Management
Bank Reconciliation

Partial List of Customers
1000+Finance Transformation Projects
6 continents | 45 countries
53

Serving 500+ Industry Leading Customers
54
CONSUMERGOODS
MANUFACTURINGAPPAREL
& FOOTWEARFOOD
& BEVERAGETECHNOLOGY
TRANSPORTATION& LOGISTICS

Ireland
SwedenNetherlands
Luxembourg
Thailand
China
South Korea
Canada
United
States
Mexico
Costa Rica
Brazil
Argentina
Russia
Japan
South Africa
Malaysia
Singapore
Philippines
Taiwan
Indonesia
Australia
New Zealand
Finland
United Kingdom
Norway
Denmark
PolandGermany
Czech Republic
RomaniaSwitzerland
Italy
France
Portugal
Spain
HEADQUARTER
Houston
India
Amsterdam
London
Frankfurt
Global Footprint
Regional Offices
● Houston, TX (Global Headquated)
● London, UK
Frankfurt, DE
● Amsterdam, NL
● Hyderabad, India
1000+ Implementations6 continents | 45 countries
55
Implementations
Amsterdam
London
Frankfurt
EMEA Regional Offices

Poll Question
03Would you like to know more about AI-powered automation solutions from HighRadius?
A. Yes, connect me to an expert
B. Yes, send me some material for research
C. Yes, but not at the moment
D. No, I am not interested

Thank you!

Q&A

Next from sharedserviceslink
www.sharespace.digital
January 23rdJanuary 16th January 30th