The Special Senses. Five Senses Vision (Sight) Hearing Smell Taste Touch (Palpation)
Upload
nguyendangCategory
view
213download
0
Division 44 Water, Energy, Transport
Measuring Public Transport PerformanceLessons for Developing Cities
Sustainable Urban Transport Technical Document # 9
Information Stockholm Oslo Helsinki Copenhagen Geneva
Easy to get the info needed when planning a trip 74 % 74 % 81 % 73 % 71 %
The info is good when traffic problems occur 22 % 21 % 28 % 31 % 49 %
The information is good in stops and terminals 37 % 51 % 45 % 43 % 81 %

AcknowledgementThe author would like to acknowledge the research carried out by the authors of Tran-sit Cooperative Research Program (TCRP) Reports No 88 and 144; and the authors of the Research Results Digest 95 of the Inter-national Transit Studies Program (ITSP) of the TCRP, which provided guidance to build the case for introducing and improving per-formance measurement in developing cities. The author would also like to express her deep gratitude to experts Todd Litman, Heather Allen and Mohinder Singh for their critical review and valuable suggestions for improving this document.
About the authorChhavi Dhingra is a civil engineer with a Master’s Degree in transportation engineer-ing from the Asian Institute of Technology, Thailand. For the last seven years she has been researching on issues related to sustainable mobility and urban development policy and planning, in the developing country context. Her work areas include improving urban public transport services, policies to encourage usage of clean transport modes, transport and equity issues, and capacity development in the urban transport sector. Chhavi is part of GIZ’s Sustainable Urban Transport Project (SUTP) team where in addition to research and policy advisory work for cities, she is involved in the design and delivery of training courses and development of course material.
i
IMPRINT
Author: Chhavi Dhingra
Editor: Deutsche Gesellschaft für Internationale Zusammenarbeit (GIZ) GmbHP. O. Box 518065726 Eschborn, Germanyhttp://www.giz.dehttp://www.sutp.org
Division 44: Water, Energy, TransportSector Project “Transport Policy Advisory Services”
On behalf ofFederal Ministry for Economic Cooperationand Development (BMZ)Division 313 – Water, Energy, Urban Development
BMZ BonnDahlmannstraße 453113 Bonn, Germany
BMZ Berlin | im EuropahausStresemannstraße 9410963 Berlin, Germanyhttp://www.bmz.de
Manager: Manfred Breithaupt
Editing: Santhosh Kodukula, Jonathan Gómez Vilchez
Cover photos: Chhavi Dhingra, Santhosh Kodukula
Layout: Klaus Neumann, SDS, G.C.
Eschborn, December 2011
Measuring Public Transport PerformanceLessons for Developing Cities
Sustainable Urban Transport Technical Document # 9
CopyrightThis publication may be reproduced in whole or in part in any form for educational or non-profit purposes without special permission from the copyright holder, whenever provided acknowledgement of the source is made. The GIZ would appreciate receiving a copy of any publication that uses this GIZ publication as a source. No use of this publication may be made for resale or for any other commercial purpose whatsoever.
Disclaimer
Findings, interpretations and conclusions expressed in this document are based on information gathered by GIZ and its consult-ants, partners and contributors from reliable sources. GIZ does not, however, guarantee the accuracy or completeness of information in this document, and cannot be held respon-sible for any errors, omissions or losses which emerge from its use.

ii

iii
AbstractPerformance measures are navigation tools that can help public transport authorities and city governments determine where they want to go and how to get there. They have many practical applications including trend analysis, comparisons, target setting, system improve-ment and incentives for managers and employ-ees. They help identify potential problems and optimal solutions. This document describes the role that performance measurement can play in public transportation planning and management, the need for developing cities to start adopting performance evaluation and the steps for initiating this. This document pro-vides examples of successful public transport performance evaluation systems from across the globe, including developing cities that are beginning to explore these systems, and iden-tifies key factors necessary for creating success-ful evaluation systems. This information will be useful to policy-makers, analysts, and prac-titioners involved in urban transport planning and particularly public transport planning and provision in cities, in both developed and developing countries.

iv
Contents
1. Introduction 1
2. Performance measurement 22.1 Performance measurement applications 32.2 Uses of performance measurement in the transit industry 42.3 Types of performance indicators 52.4 Performance points of views 6
3. Past efforts on performance measurement and benchmarking in the transport sector 83.1 International initiatives 83.2 Regional initiatives 93.3 Lessons learnt 11
4. Case studies of public transport performance measurement programs from around the globe 124.1 Key findings from the case studies 12
5. Customer satisfaction and quality improvement-‘must haves’ of any performance measurement program 15
6. Realities and challenges for developing cities 186.1 Service level benchmarks for urban transport in India: Brief overview 186.2 Suggestions for further improvement 20
7. Advice for cities and public transport agencies on setting up performance measurement systems 237.1 Data collection 237.2 Policy and/or legal enabler 247.3 Reporting 247.4 Making course corrections 247.5 Outreach, networking and feedback 25
8. Next steps 268.1 Data definition 268.2 Suggested performance evaluation areas 27
Bibliography 31
Appendix: Case studies on public transport performance evaluation 33
1
Measuring Public Transport Performance – Lessons for Developing Cities
1. Introduction
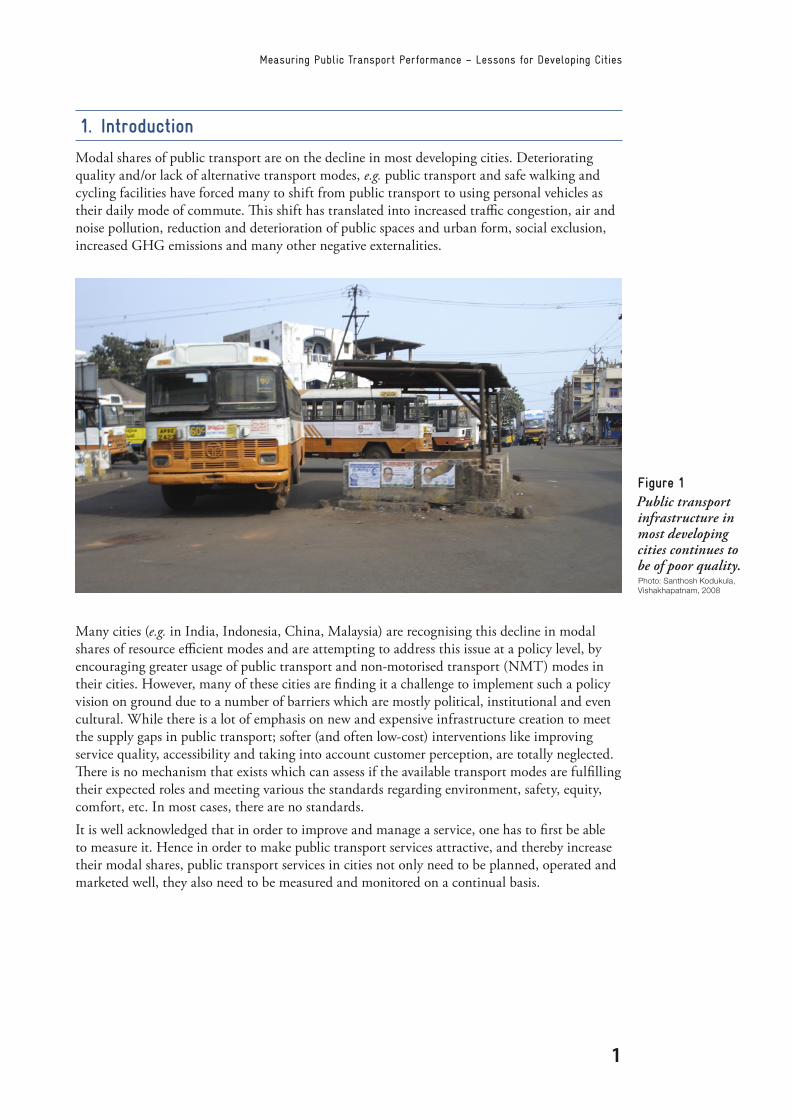
Modal shares of public transport are on the decline in most developing cities. Deteriorating quality and/or lack of alternative transport modes, e.g. public transport and safe walking and cycling facilities have forced many to shift from public transport to using personal vehicles as their daily mode of commute. This shift has translated into increased traffic congestion, air and noise pollution, reduction and deterioration of public spaces and urban form, social exclusion, increased GHG emissions and many other negative externalities.
Figure 1Public transport infrastructure in most developing cities continues to be of poor quality.Photo: Santhosh Kodukula, Vishakhapatnam, 2008
Many cities (e.g. in India, Indonesia, China, Malaysia) are recognising this decline in modal shares of resource efficient modes and are attempting to address this issue at a policy level, by encouraging greater usage of public transport and non-motorised transport (NMT) modes in their cities. However, many of these cities are finding it a challenge to implement such a policy vision on ground due to a number of barriers which are mostly political, institutional and even cultural. While there is a lot of emphasis on new and expensive infrastructure creation to meet the supply gaps in public transport; softer (and often low-cost) interventions like improving service quality, accessibility and taking into account customer perception, are totally neglected. There is no mechanism that exists which can assess if the available transport modes are fulfilling their expected roles and meeting various the standards regarding environment, safety, equity, comfort, etc. In most cases, there are no standards.It is well acknowledged that in order to improve and manage a service, one has to first be able to measure it. Hence in order to make public transport services attractive, and thereby increase their modal shares, public transport services in cities not only need to be planned, operated and marketed well, they also need to be measured and monitored on a continual basis.

2
Sustainable Urban Transport Technical Document # 9
2. Performance measurement
Performance measurement is essential for effective planning and management. It includes vari-ous activities that track an organisation’s ability to achieve its intended objectives:
box 1Key terms and definitionsPerformance evaluation refers to a specific monitoring and analysis process to determine how well policies, programs and projects perform with regard to their intended goals and objectives.
Benchmarking refers to a process for identifying best management practices that an organisation can emulate.
Performance indicators (also called measures of effectiveness) are specific measurable outcomes used to evaluate progress toward established goals and objectives.
Baseline (or benchmark) – existing, projected or reference conditions if change is not implemented.Source: VTPI, 2010
Performance measures are an extension of our personal senses – sight, hearing, touch, smell and taste. They are navigation tools that help an organisation determine where it wants to go and how to get there. They have many practical applications including problem identification, trend analysis, peer comparisons, target setting, evaluating potential improvements, and incentives for managers and employees (Litman, 2005).Performance measures are widely used in transport planning. They can have various names including, “sustainable transportation indicators”, “performance indicators” or just “transporta-tion statistics”. Regardless of what they are called, every jurisdiction and agency should develop an appropriate set of statistics that are collected consistently, suitable for planning and evalua-tion purposes (specific guidance on this is provided in the last section of this paper).Performance measurement can support public transport planning in many ways. It allows tran-sit planners and operators to determine if resources are used efficiently and equitably, identify potential problems, and to verify whether a particular improvement strategy achieves its pre-dicted targets. It paves the ways for course correction which translates into a constant effort at improving services to match the standards.Public transport performance evaluation can reflect various perspectives. Many commonly-used public transport performance indicators such as load factor and cost-per-vehicle-kilo-metre, measure operating efficiency. Other indicators, such as rider comfort, travel speed and reliability, affordability, integration and satisfaction, reflect the user experience. User-oriented indicators are important for developing public transit systems that respond to user demands and so are able to attract even choice riders. This is an area that needs serious attention in most developing cities today.

3
Measuring Public Transport Performance – Lessons for Developing Cities
Care is needed when using performance evaluation and benchmarking to insure that they are based on appropriate assumptions and quality data. Performance indicators should not be selected simply because they are considered easy to measure. Important objectives and impacts, such as social equity and user comfort, should not be ignored simply because they require more effort to evaluate. It is also important to monitor the quality and consistency of data used for evaluation, and to ensure that the people who use data understand how it is defined, how it was obtained, its reliability, and possible sources of bias.This document provides guidance on performance measurement program development for cities. It discusses basic concepts, describes examples of public transport system performance evaluation practices from around the globe, and identifies key factors for their success. This information will prove to be of value to policy-makers, policy analysts, and practitioners involved in urban transport planning, particularly public transport planning and provision in cities in both developed and developing countries.
2.1 Performance measurement applications
Performance measurement involves the collection, evaluation, and reporting of data that relates to how well an organisation is performing its functions and meeting its goals and objectives (TCRP, 2003). Performance evaluation refers to a specific monitoring and analysis process to determine how well policies, programs and projects perform with regard to their intended goals and objectives.Performance measurement can have many specific applications:�� Problem identification: It can identify undesirable conditions, such as wasted resources, traffic accidents or vehicle failures, and help determine their causes.�� Trend analysis: It can help identify changes that are occurring.�� Peer comparisons: It allows a particular organisation or group to be compared with peers (similar organisations or groups).�� Evaluating changes: It can be used to track the results of specific changes, including new policies and programs to determine if they are successful, and for research purposes.�� Target setting: It allows managers to set specific targets to be achieved.�� Incentives: It can be used to establish rewards for managers and employees.
“Benchmarking is the process of systematically seeking out best practices to emulate. Bench-marking involves direct contact with other organisations, delves into the reasons for their suc-cess, and seeks to uncover transferable practices applicable to the organisation performing the analysis” (TCRP, 2010).Performance measurement and benchmarking are different concepts. A performance report is not the desired end product of a benchmarking effort; rather performance measurement aids bench-marking by providing a set of indicators that are then used to provide insights, raise questions, compare with/identify other organisations from which one may be able to learn and improve.For example, NOVA, an international rail benchmarking program comprising a consortium of sixteen middle-sized metros from around the world, defines benchmarking as “a structured approach to identify actions that lead to superior performance. Benchmarking is not merely a comparison of performance data or a creation of league tables. Performance measures, for example, deliver little benefit on their own, but they stimulate productive questions and lines of enquiry for more in-depth analysis and research” [1].Figure 2 describes the step-wise methodology of benchmarking.
[1] http://www.nova-metros.org/GetAbout.do?category=Home&subcateg=Benchmarking, Accessed on 1 Sept. 2011.
4
Sustainable Urban Transport Technical Document # 9
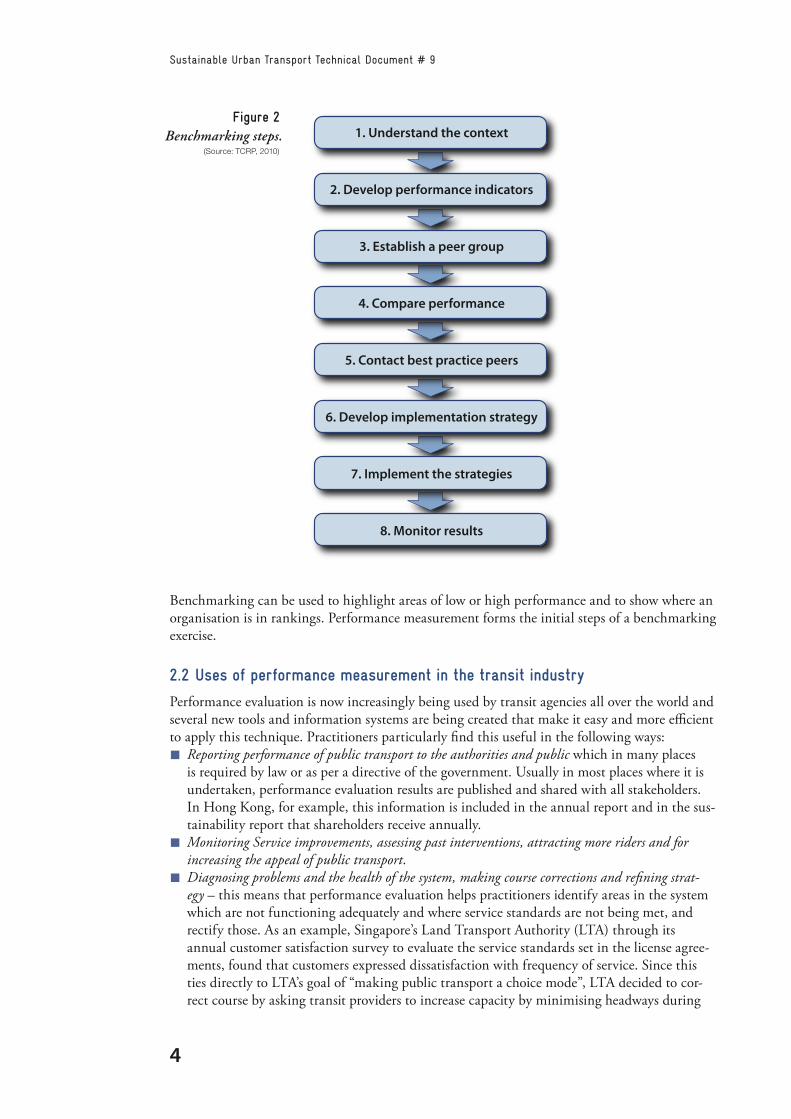
Benchmarking can be used to highlight areas of low or high performance and to show where an organisation is in rankings. Performance measurement forms the initial steps of a benchmarking exercise.
2.2 Uses of performance measurement in the transit industry
Performance evaluation is now increasingly being used by transit agencies all over the world and several new tools and information systems are being created that make it easy and more efficient to apply this technique. Practitioners particularly find this useful in the following ways:�� Reporting performance of public transport to the authorities and public which in many places is required by law or as per a directive of the government. Usually in most places where it is undertaken, performance evaluation results are published and shared with all stakeholders. In Hong Kong, for example, this information is included in the annual report and in the sus-tainability report that shareholders receive annually.�� Monitoring Service improvements, assessing past interventions, attracting more riders and for increasing the appeal of public transport.�� Diagnosing problems and the health of the system, making course corrections and refining strat-egy – this means that performance evaluation helps practitioners identify areas in the system which are not functioning adequately and where service standards are not being met, and rectify those. As an example, Singapore’s Land Transport Authority (LTA) through its annual customer satisfaction survey to evaluate the service standards set in the license agree-ments, found that customers expressed dissatisfaction with frequency of service. Since this ties directly to LTA’s goal of “making public transport a choice mode”, LTA decided to cor-rect course by asking transit providers to increase capacity by minimising headways during
Figure 2Benchmarking steps.
(Source: TCRP, 2010)
1. Understand the context
2. Develop performance indicators
3. Establish a peer group
4. Compare performance
5. Contact best practice peers
6. Develop implementation strategy
7. Implement the strategies
8. Monitor results

5
Measuring Public Transport Performance – Lessons for Developing Cities
peak period from 3 min to between 2 and 3 min and from 7 min to between 5 and 6 min during lunch periods (TCRP, 2010’).�� Incentivizing quality improvements.�� Responding to user feedback.�� Providing decision making bodies with accurate information to support the needed actions for investments, budgeting, etc.�� Providing the public with information on transit performance so they can choose it and use it.�� Setting service standards.�� Aiding internal communications and management.�� Noting community benefits (say increase in modal share of public transport over time, increased literacy rates and health improvements due to better access by public transport, etc.).
The quality and nature of data collected today on public transport performance in most devel-oping cities is limited and redundant, focusing largely on operational efficiencies and very little on quality and other user-related parameters. If modal shares for public transport have to be preserved and increased, it becomes very important that cities engage in performance evaluation of public transport from various perspectives-operator, user, local authority and community at large. A good starting point for initiating performance evaluation for public transport services in developing cities would be its inclusion in the overall policy framework. While in many devel-oping countries (for example India), an urban transport policy (or a draft) exists at the national level, it is not complimented by a policy evaluation and monitoring program, nor governed by regulations and not linked to the budgeting process.
2.3 Types of performance indicators
More than 400 performance indicators are used in the transit industry today. Each indica-tor is assessed based on its performance category (availability, service delivery, community impact, travel time, safety and security, maintenance and construction, and economic/financial
Figure 3TransMilenio, Bogota.(Source: GIZ Photo DVD, 2010)

6
Sustainable Urban Transport Technical Document # 9
viability), its data collection needs, and its potential strengths and weaknesses for particular applications (TCRP, 2010).Performance measures/indicators can be designed and defined at various levels, namely:
a. Sustainable development indicators (general statistics about a city’s economic, social and environmental performance);
b. Sustainable transport indicators (general statistics about a transport system’s economic, social and environmental performance);
c. Transport planning indicators (conventional statistics about transport system perfor-mance, such as travel speed, congestion delays, accidents and fuel consumption);
d. Public transport strategic planning indicators (long-term public transport performance trends);
e. Public transport operations indicators (short-term public transport performance).Within these, indicators could be again classified as very important, helpful or specialised as well as environmental, social and economic. Therefore, a right balance has to be maintained while selecting indicators. Indicators should be relevant and analytically sound, and correspond-ing statistical data needs to be available. This data should comply with certain quality standards. In many cases, the availability of statistical data is currently a bottleneck for passenger transport benchmarking, especially for non-motorised transport. These issues are discussed in greater detail in the last section of this document.
2.4 Performance points of views
Performance measurement can be carried out from different perspectives: from an enterprise perspective or from a customer perspective. It can take place at different levels: at policy level (regulatory framework, infrastructure provision) and at microeconomic or enterprise level (transport companies and operators). Many current public transport system performance indica-tors focus on operating efficiency (e.g. load factors and cost per vehicle-kilometre) rather than performance as experienced by users (convenience, comfort, speed, reliability, affordability, inte-gration, etc.).Measures can be either outcome or descriptive indicators. Outcome indicators describe the per-formance achieved by the organisation, given a set of inputs, and should be the majority of the measures used in the analysis. In a public transport context, many outcome indicators are per-formance ratios that compare an outcome (e.g. ridership) to an input (e.g. revenue hours).As Rickert (2005) describes, performance indicators can be direct (e.g. “Disabled passengers took 250 trips in March on Bus route # 17”) or they can be proxy measures which are sub-stituted for the direct measure (e.g. “Following the deployment of low-floor buses at newly improved bus stops on Bus route # 17, Rehabilitation Center A reports that 20 additional per-sons living near this route are now using their services.”). Both the direct and the proxy meas-ures provide helpful data to understand the results. Both measures can be compared a year later to indicate if usage is increasing or decreasing. Both measures permit comparisons to the situa-tion prior to initiating accessible bus service as well as a comparison to some stated objective for anticipated performance.In broad terms, performance measures could be of the following kinds:�� Ratios (e.g. cost per revenue km, passenger per seat);�� Indices (e.g. a measure combining capacity, route coverage, and frequency);�� Level of service (e.g. frequency levels);�� Stand-alone individual quantitative or qualitative measures (e.g. ridership, frequency, pres-ence of digital information systems at bus stops);�� Percentages (% increase in school/college enrolments after introduction of bus services in an area, percentage times when the bus arrived within a 5 minute delay, etc.).

7
Measuring Public Transport Performance – Lessons for Developing Cities
General sustainability indicators can be integrated with other types of accounting statistics in transport. Indicator sets should be derived as much as possible from existing accounting data sets, while existing accounting data should be extended towards sustainable development requirements (Litman, 2005).Performance measures should be simple, intelligible to all concerned, and relevant to the most important goals of the agency. Cities should carefully look at trade-offs between the time and cost of collecting data for performance indicators, on the one hand, and the utility of the data, on the other. But most importantly, cities should first define its goals and targets from which the performance measures flow.An extensive collection of performance measures (130 families of measures and over 400 indi-vidual measures) as a reference for agencies developing or updating a performance-measure-ment program can be found in the TCRP Report No 88 (2003), which is available at: http://onlinepubs.trb.org/onlinepubs/tcrp/tcrp_report_88/Guidebook.pdf. The American Public Trans-portation Association publishes an annual Public Transportation Fact Book reports (http://www.apta.com/research/stats), the Canadian Urban Transit Association publishes the Canadian Transit Fact Book, and the US Federal Transit Administration maintains the National Transit Database (http://www.ntdprogram.gov/ntdprogram). The Mobility in Cities Database (2001) of the UITP also contains some 120 indicators under 15 themes related to urban transport. This is discussed in more detail in the next section.

8
Sustainable Urban Transport Technical Document # 9
3. Past efforts on performance measurement and benchmarking in the transport sector
In 1996, the European Commission (EC) identified passenger transport and in particular public passenger transport, as a sector growing at an annual rate of 3.2 % while the average annual growth of GDP in real terms was 2.4 %. Growth largely occurred in private transport where 75 % of the total kilometres were by private car, 15 % by conventional public passenger trans-port and the remaining 10 % by bicycle, walking, air and other means. Given this and the fact that urban public transport plays a key role in making cities sustainable, a number of efforts at performance measurement were initiated, particularly in Europe, over the last couple of decades to improve the delivery and attractiveness of public transport modes in cities. Some of these have been briefly discussed below (TTR, 2004)
3.1 International initiatives
3.1.1 The Millennium Cities Database (2001); Mobility in Cities Database (2006)
The Millennium Cities project involved the compilation of a database of data from 100 cities in order to compare their transport systems. Data was collected for over 200 indicators for the
box 2The ‘Mobility in Cities’ Database (2006)Developed by UITP in partnership with several other agencies in Europe, this database consists of 120 urban mobility indicators for 52 cities worldwide for the year 2001. The CD-Rom contains:
1. A set of urban mobility indicators which can be searched by topic, location or a combina-tion of both;
2. Reports, analyses, recommendations, factsheets, definitions of indicators, and local mobil-ity policies, available in 4 languages;
3. A tool to compare one city with up to 9 other cities in graph form.
Indicators for each location are grouped under the following themes:
1. Background information on city; 2. Private transport infrastructure; 3. Public transport infrastructure; 4. Private passenger vehicles: supply and use; 5. Taxis and collective taxis: supply and use; 6. Road traffic; 7. Public transport supply; 8. Mobility and modal split; 9. Public transport productivity and travel cost;10. Cost of travel for the traveller;11. Cost of passenger transport for the community;12. Energy consumption for passenger transport;13. Passenger transport polluting emissions;14. Passenger transport fatalities;15. Private motorised transport and public transport (comparisons).
Each of the above themes in turn has indicators specified under it, which have been reported for the selected cities. The document on definitions of indicators contains nearly 122 defini-tions, and is something cities developing performance evaluation systems would find extremely useful as a reference guide.

9
Measuring Public Transport Performance – Lessons for Developing Cities
cities for the year 1995 and compared with the year 2001. The database was later updated by UITP in 2005 (see Box 2). Conclusions on the evolution of key indicators between 1995 and 2001 can be drawn by comparing both databases. http://www.uitp.org/publications/pics/pdf/MILLE.pdf, http://www.uitp.org/publications/Mobility-in-Cities-Database.cfm.
3.1.2 NATCYP – Benchmarking National Cycling Policies (2001)
The NATCYP benchmarking initiative was another of the BEST network’s case studies which included a national level comparison of cycling policies between Czech Republic, England, Finland, The Netherlands and Scotland. In addition, the development and delivery of national cycling policies was given the much needed publicity, raising ministerial awareness of cycling’s potential, particularly with regard to sustainable transport policies. http://www.velomondial.net/page_display.asp?pid=14
3.1.3 CoMET (1996) and NOVA (1998)
These are both international railway benchmarking clubs. They are different, but related, groups which aim to compare the urban rail systems of various cities from around the world. Members pay a fee to belong to the ‘clubs’. COMET groups bring together large sized metros and NOVA medium and smaller sized metros. In these programs, agencies use insight from other metro systems in order to attempt to improve internal working cultures and one’s own service levels, based on a set of Key Performance Indicators (KPIs). http://www.comet-metros.org and http://www.nova-metros.org/Welcome.do
3.2 Regional initiatives
3.2.1 Citizen’s Network Benchmarking Initiative (1998–2001)
The goal of the pilot project of the European Commission, DG Energy and Transport (DG TREN), was to test the feasibility of comparing public transport performance across all modes, from a citizen’s point-of-view. During the pilot, 132 performance indicators were tested, which were refined to 38 indicators by the end of the process. The overall objective of the project was to promote the identification and dissemination of good practice in urban transport systems and infrastructure by enabling cities and regions to exchange ideas and experiences and to compare the performance of their local and regional transport systems by benchmarking methods. The three main questions which the indicators were seeking to answer are:�� How do people travel? What transport services do people prefer and how well is the system meeting these requirements?�� How accessible is the transport system? How congested are the roads? What information is available to motorist and transport users?�� What are the costs of transport? What is the impact of transport on the environment? How safe is it to travel?
http://www.transportbenchmarks.eu/benchmarking/initiatives-citizens-network.html#
3.2.2 EQUIP (1999–2000)
The EU Urban Transport Benchmarking initiative called ‘EQUIP’ was concerned with devel-oping a self-assessment benchmarking handbook that proposed indicators for measuring the ‘internal’ efficiency of land-based local public transport operators in EU nations. There are five separate but compatible versions of the handbook for five public transport modes (bus, trolley bus, tram/light rail, metro and local heavy rail) plus a short version of 27 ‘super indicators’ to provide an entry to benchmarking. http://www.transport-research.info/web/projects/project_details.cfm?id=289

10
Sustainable Urban Transport Technical Document # 9
3.2.3 Scandinavian BEST (1999 onwards)
Set up by the Stockholm public transport authority “SL”, this initially involved the four Nordic capitals of Oslo, Stockholm, Copenhagen and Helsinki and took the form of a survey of 36 questions based on 10 categories carried out in spring 2000. The idea was that, for each of the 10 categories, the city which displayed the best results would present a success story at a semi-nar. As a result, four Common Interest Groups were chosen and each city was made responsible for one of them. These were:�� Integrated Public Transport and City Planning – Copenhagen�� Information at Traffic Disruptions – Helsinki�� Complaint Management – Oslo�� Systematic Branding – Stockholm
http://best2005.net
3.2.4 BESTRANS (2004)
Benchmarking of Energy and Emission Performance in Urban Public Transport Operations aimed at developing an internal and external benchmarking methodology for energy and emis-sion performance in the urban public passenger transport sector and to carry out a benchmark-ing exercise with a number of European operators. The indicators used in the BESTRANS pro-ject focus particularly upon the efficiency, energy costs, average travel speeds and extent of route prioritisation for buses. http://www.tis.pt/proj/bestrans
3.2.5 The Urban Transport Benchmarking Initiative (2003–2006)
This three year initiative benchmarked different aspects of 45 participating European Cities’ transport systems, with themed working groups each researching individual urban transport topics in great depth. http://www.transportbenchmarks.eu
3.2.6 CAF’s Urban Mobility Observatory (SMO)
The Corporación Andina de Fomento (CAF) recently launched the Urban Mobility Observa-tory (SMO). The observatory is intended for Latin America and the Caribbean and provides technical indicators and data analysis for 15 metropolitan areas in nine countries of the region. Also see Box 3. http://www.caf.com/view/index.asp?pageMS=61860&ms=19

11
Measuring Public Transport Performance – Lessons for Developing Cities
box 3Transit Evaluation in Latin AmericaDespite having some of the most famous transit systems in the world, Latin America has recog-nised the need for better performance and maintenance of its systems. Since the 1970s, ever since the concept of BRT was born in Curitiba (Brazil), public transport systems have been running inconsistently and independently from each other, without a common set of standards, references or guidelines. To address the disparity in the performance of bus systems in the region, a new industry coalition was established in April 2010, called the Asociación Latinoaméricana de Siste-mas Integrados de Transporte y BRT (SIBRT) (Latin American Association for Integrated Transport Systems and Bus Rapid Transit). Weblink: http://www.sibrtonline.org
SIBRT includes 14 of the most influential transit agencies in Latin America, representing five countries: Colombia, Brazil, Chile, Mexico and Ecuador. The key objective of the SIBRT is to pri-oritise mass transit in Latin American cities by developing standard methodologies to measure the performance, impact and management of BRT systems, synchronising data collection across transit agencies, and creating safety baseline measurements. SIBRT is meant to provide a body of accessible research and expertise that cities can draw from in order to develop and build upon the models that exist in Latin America. The aim is to share a common set of standards, case studies and best practices, to help improve transit systems across Latin America, and deal with challenges like overcrowding and fare evasion, the encroachment of bus lanes by general traffic, or slow bus speeds.
Based on a set of “Key Benchmarking Indicators” (KBIs), SIBRT will help promote and standardise other elements of high-quality BRT systems, including Intelligent Transportation Systems (ITS), like real-time bus tracking or bus prioritisation at traffic lights, exclusive bus corridors, level plat-forms between the bus and curb, pre-payments and controlled access to stations. Other cities can monitor this mechanism and adopt it to suit their requirements. The Benchmarking and Innovation area of SIBRT has the task of coordinating the organisation, implementation and maintenance of a database of indicators.Sources: http://www.thecityfix.com/blog/establishing-standards-to-improve-brt-systems-in-latin-america; Last accessed on 6 September 2011, and http://www.sibrtonline.org; Last accessed on 27 November 2011.
3.3 Lessons learnt
Learnings from these initiatives indicate issues regarding data collection and the need to have consistent definitions of data for comparing cities/regions. Things like national (or even state level) regulations/laws, market conditions and technological changes and software upgrades impact data comparison results. Clear definitions of indicators, good quality, clear and consist-ent data sets and good legal backing and support of public transport operators and authorities is a must-have for cities to have a successful performance measurement system. All the key actors must understand the process and efforts needed for such a system and design it in a way that can make the system applicable and locally relevant. However, given that developing cities are literally to start this process from ground-zero, it is assumed that they will realise and address these issues as they go along the process, however, where possible they should learn from the experiences of the other cities/regions.The initiatives mentioned above raised some pertinent questions which are valid and important for all cities. The focus of these exercises, even all those years back, was measuring aspects like operations, quality, information, user perception, transport access, energy and environment impacts, etc. in relation to public transport, which is what developing cities need to focus on in a big way today.

12
Sustainable Urban Transport Technical Document # 9
4. Case studies of public transport performance measurement programs from around the globe
A study of a variety of good practices in public transport performance evaluation from Asia, Australia and Europe was carried out (see Appendix). Public transport performance evaluation systems of cities like Singapore, Kuala Lumpur, Sydney and Helsinki have been studied and documented. These cities were analysed against the following set of parameters which offer other cities a useful perspective on how performance evaluation systems could be set-up and run:�� Basic geographic and demographic information;�� Existing transport modes;�� Share of public transport trips;�� Key agencies involved in public transport planning and provision;�� Guiding Policy document for public transport provision/management?�� Performance evaluation mandatory as per Government requirement?�� Performance measures and standards used;�� Reporting Format;�� Feedback/evaluation methods;�� Legal enabler;�� Enforcement;�� Outreach efforts.
The technical sheets detailing public transport evaluation systems (in the above format) in select cities around the world have been provided in the Appendix.
4.1 Key findings from the case studies
A review of performance evaluation systems as presented in the Appendix shows that often agencies providing public transport, by law are required to (a) establish goals and objectives for improving services (b) develop strategies to meet these objectives (c) define performance criteria and targets (d) measure progress and define inputs for future improvements (e) report periodi-cally the results of performance evaluation.
Figure 4Kuala Lumpur
Photo: Andreas Rau, 2006

13
Measuring Public Transport Performance – Lessons for Developing Cities
85% of commuters to complete their door-to-door journeys
within 60 minutes during morning peak by improved
transfers and priority
Double rail transit network to 278 km by 2020Objective 1
Making public transport a choice mode
Policy/Base document Land Transport
Master plan
Objective 2Managing road usage
Objective 3Meeting the diverse
needs of people
Increase bus speeds to 20–25 km/h from 16–19 km/h by allotting all-day bus priority
Increase overall public transport ridership
from 63% to 70% by 2020
Limit the number of cars by using electronic road pricing
Allow market forces to set parking policies
Limit the number of vehicle registration issued
Community engagement, lower fares, barrier-free access,
promoting the use of bicycles and other clean vehicles
Figure 5Singapore adopts a systematic approach of setting measurable performance targets in line with its policy.Source: Derived from TCRP, 2010
In the Asian context, Singapore presents an example of a well-planned and systematic per-formance evaluation system, where each policy objective is clearly translated into measurable targets and performance indicators. Singapore also offers an excellent example of a well defined policy, policy objectives and targets under each objective for ensuring a sustainable urban trans-port system (Figure 5). This is something that other cities could emulate and learn from.Kuala Lumpur has only recently initiated a performance evaluation program, which appears to be less mature than Singapore’s. It is only recently that bus management in Rapid KL realised they needed to make corporate and strategic planning efforts to improve the company’s service and profitability, and it is to Rapid KLs’ credit that it has taken lessons from other systems in order to establish its own processes and is showing signs of success with each step forward. Developed cities like Sydney in Australia and Helsinki in Finland also offer examples of good performance evaluation systems, where service parameters are detailed out and measured with a proper feedback system, to meet the agency objectives. Sydney’s comprehensive and user-focussed set of performance measures and targets present a holistic approach in performance evaluation. Helsinki stands out for its highly customer-oriented approach of benchmarking its public transport system. In fact, most of the Benchmarking European Service of public Trans-port (BEST) surveys reveal that Helsinki is a clear winner when it comes to some aspects like value for money and customer loyalty. Besides focussing on quality parameters, Helsinki also

14
Sustainable Urban Transport Technical Document # 9
does well in areas like competitive tendering processes for buses, integrated ticketing and pro-viding bus priority. So does Sydney.This approach of packaging various measures to promote public transport is usually what is lacking in developing cities today. Also evaluating areas like access, equity, ease of transfers and customer perception is usually overlooked by public transport providers. As a result, service levels for the captive riders continue to deteriorate, and the choice users gradually move to per-sonal motorised modes of travel.Each case study offers a different perspective, yet valuable lessons for cities to initiate similar performance evaluation exercises in public transport. The presence of a guiding/mandatory policy and a legal enabler, a systematic and well-coordinated performance evaluation system (like BEST), clear agency goals and objectives, sound inter-agency coordination, identification and constant revision of performance measures, a special focus on customer care, good report-ing and information sharing, and enforcement, emerge as the common and key factors for achieving successful evaluation systems.
Figure 6Sydney
Photo: Manfred Breithaupt, 2008

15
Measuring Public Transport Performance – Lessons for Developing Cities
5. Customer satisfaction and quality improvement-‘must haves’ of any performance measurement program
This section does not focus on a particular city, but on a very important aspect of performance measurement which is largely neglected in developing cities today: customer satisfaction and quality improvement related measures in public transport.
Figure 7Having strong customer focus is one of the central elements of creating a good public transport performance evaluation system.Photo: Kaushik Deb, Karnataka, 2009
“Quattro (1998)” [2] was a research project carried out under the Transport Research and Tech-nological Development (RTD) Programme of the EU’s Fourth Framework Programme for RTD and Demonstration. The geographical scope of Quattro covered the European Union, Norway, Poland, Hungary and the Baltic States.Recognising that modal shares of public transport have to be increased, and that like any other successful service enterprise, public transport too should focus more on customer satisfaction, the objectives of the Quattro project were:�� to identify current and emerging quality management practices in contracting and tendering in the urban public transport (UPT) sector,�� to evaluate these practices and try to figure out how the existing trends in quality manage-ment in other fields than UPT could be implemented in UPT with identification of best practice and well developed total quality management,�� to suggest guidelines to authorities and operators involved in UPT provision on issues of ten-dering, contracting and performance monitoring, with a strong focus on quality.
The study also recognised that the quality of urban public transport was dependent on a number of factors like the capacity of the operator to manage his organisation, operating conditions, role of the public authorities (roads department, traffic police, etc.).At present, in many developing cities, the above ideas and practices are absent. Taking the example of India, where public transport is essentially bus-based and a state level function, cities have very little role to play in the planning, provision and monitoring of public transport. The state bus companies typically run in losses and without any incentives to improve quality and in the absence of a policy directive/law to measure and improve performance, bus operations in cities continue to remain inadequate and unattractive.Quattro’s research developed a specific quality management tool, “the UPT quality loop” (Figure 8), which can be applied at the firm’s level as well as at the whole UPT system’s level.
[2] http://www.transport-research.info/web/projects/project_details.cfm?id=636&backlink=%2Fweb%2Fcommon%2Fsearch%2Ecfm&referer=searchstring%2Aquattro; Last accessed on 27 November 2011.

16
Sustainable Urban Transport Technical Document # 9
Figure 8The Urban
Public Transport Quality Loop.
Source: QUATTRO taken from TCRP 2010
Final customers-passengers andcity dwellers
Service contributors-operator, authorities, police,road departments, etc.
Measuringsystemperformance
Measuringcustomersatisfaction
Expectedquality
Targetedquality
Perceivedquality
Deliveredquality
The report describes the quality loop to be based on four distinctive benchmarks:1. Expected Quality: This is the level of quality demanded by the customer. It can be
defined in explicit and implicit expectations. Tools for evaluation: revealed and stated preference methods.
Figure 9Good information
systems are an integral part of
good quality public transport systems.
Source: TransMilenio S.A., 2007

17
Measuring Public Transport Performance – Lessons for Developing Cities
2. Targeted Quality: This is the level of quality that the transport undertaking aims to provide for its passengers. It should be defined according to the level of quality expected by the passengers, external and internal pressures, and budgetary constraints and com-petitor/market performance. Tools for evaluation: customer charters and guarantees of service, partnership agreements, quality standards and certification, quality contracts, quality tenders and evaluation procedures, etc.
3. Delivered Quality: This is the level of quality that is achieved on a day-to-day basis in normal operating conditions. Disruptions to service, whether they are the fault of the undertaking or not, are considered. Tools for evaluation: compensation schemes for the benefit of the users, reward/penalty schemes concerning operators and authorities, inter-nal quality measurement, self assessment methods and benchmarking (KPIs).
4. Perceived Quality: This is the level of quality perceived by passengers during their jour-neys. Tools for evaluation: customer satisfaction index (CSI), customer charter feedback systems.
From the above, it is evident that there are many approaches that operators and public authori-ties can adopt to improve public transport quality. Box 4 describes Sydney’s experience on this.
box 4Applying customer satisfaction and quality monitoring in Sydney’s busesThe private bus operators in Sydney (‘Busways’) adopt a rigorous customer satisfaction policy as part of achieving their agency goals. In addition to moni-toring on-time running (drivers radio-in when delays are longer than 10 minutes and appropriate action is taken), there is an emphasis on using three dedicated staff personnel to perform customer service duties exclusively, on a roam-ing basis throughout the system. These employees are in direct contact with customers and are used as the “eyes” and “ears” of management to ensure that the operating plan works successfully. They also act as “troubleshooters” to solve on-the-spot problems (e.g. ticketing issues and missed connections). The coordinators are also bus drivers at different times of the day and this way get to experience first-hand the customer issues.
Customer information is provided at all bus shelters. ‘Busways’ uses two contractors to monitor performance on buses and at bus/rail interchanges. By travelling as passengers, these contractors are not recognised by the staff and are able to report to management on the performance of drivers (customer relations) and on any other problem encountered by passengers. Customer service is monitored by the use of customer surveys which are conducted at regular intervals.
In order to maintain long term loyalty, bus operators also employ an Infra-structure Planning Manager and an assistant, who consistently work with local councils, the Roads and Traffic authority, and other infrastructure developers to ensure that all planned developments are “bus friendly”.(Source: TCRP, 2003)
18
Sustainable Urban Transport Technical Document # 9
6. Realities and challenges for developing cities
Little has been done to establish performance evaluation systems for public transport in devel-oping cities. The reasons for the same are manifold: lack of one body accountable and respon-sible for public transport planning and provision, loss-making operations and hence different priorities (ironically engaging in performance evaluation could help make operations viable, but this is not the focus at the moment), inadequate policy thrust at state and central levels, lack of any legal binding for quality improvements and customer service, etc. Given these, the capac-ity challenges and the fact that in many developing cities, public transport services do not fall under the purview of responsibilities of the city authorities, many might feel that there is much that remains to be done in other areas before good performance management systems are estab-lished. On the other hand, establishing good performance evaluation as a regular practice can initiate the needed improvements and ensure long term sustainability of public transport sys-tems. The next section discusses an initiative of the Government of India in this direction.
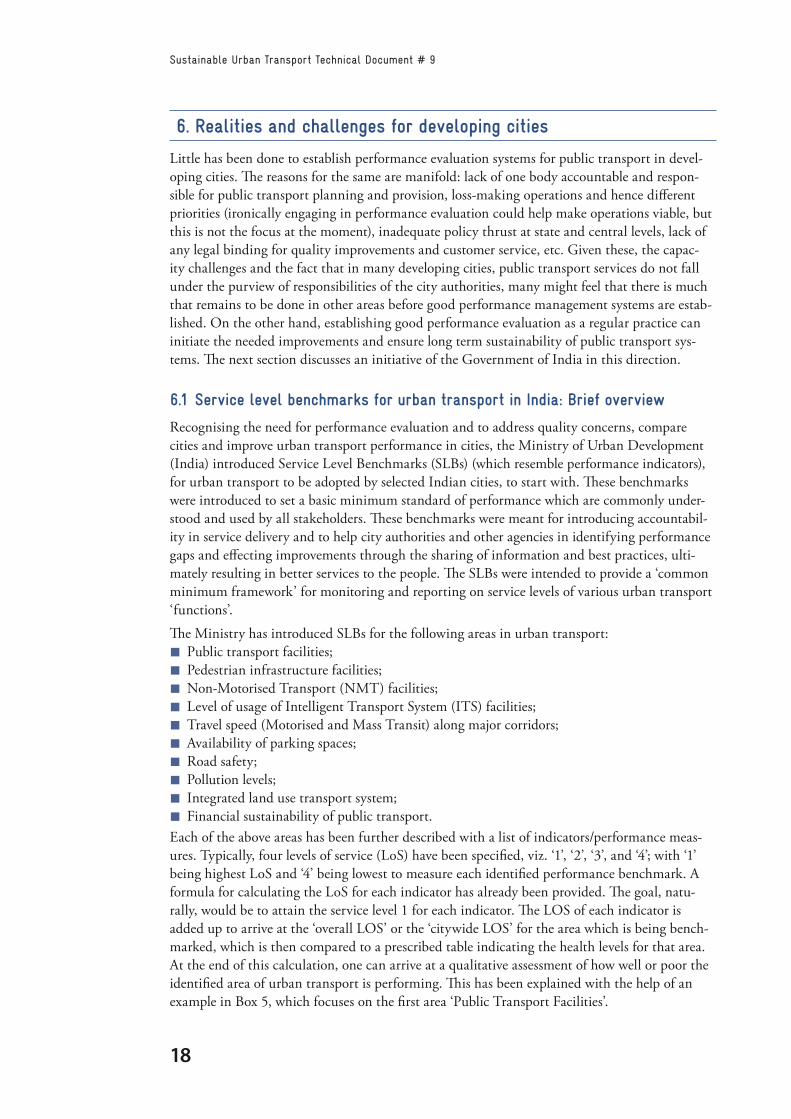
6.1 Service level benchmarks for urban transport in India: Brief overview
Recognising the need for performance evaluation and to address quality concerns, compare cities and improve urban transport performance in cities, the Ministry of Urban Development (India) introduced Service Level Benchmarks (SLBs) (which resemble performance indicators), for urban transport to be adopted by selected Indian cities, to start with. These benchmarks were introduced to set a basic minimum standard of performance which are commonly under-stood and used by all stakeholders. These benchmarks were meant for introducing accountabil-ity in service delivery and to help city authorities and other agencies in identifying performance gaps and effecting improvements through the sharing of information and best practices, ulti-mately resulting in better services to the people. The SLBs were intended to provide a ‘common minimum framework’ for monitoring and reporting on service levels of various urban transport ‘functions’.
The Ministry has introduced SLBs for the following areas in urban transport:�� Public transport facilities;�� Pedestrian infrastructure facilities;�� Non-Motorised Transport (NMT) facilities;�� Level of usage of Intelligent Transport System (ITS) facilities;�� Travel speed (Motorised and Mass Transit) along major corridors;�� Availability of parking spaces;�� Road safety;�� Pollution levels;�� Integrated land use transport system;�� Financial sustainability of public transport.
Each of the above areas has been further described with a list of indicators/performance meas-ures. Typically, four levels of service (LoS) have been specified, viz. ‘1’, ‘2’, ‘3’, and ‘4’; with ‘1’ being highest LoS and ‘4’ being lowest to measure each identified performance benchmark. A formula for calculating the LoS for each indicator has already been provided. The goal, natu-rally, would be to attain the service level 1 for each indicator. The LOS of each indicator is added up to arrive at the ‘overall LOS’ or the ‘citywide LOS’ for the area which is being bench-marked, which is then compared to a prescribed table indicating the health levels for that area. At the end of this calculation, one can arrive at a qualitative assessment of how well or poor the identified area of urban transport is performing. This has been explained with the help of an example in Box 5, which focuses on the first area ‘Public Transport Facilities’.

19
Measuring Public Transport Performance – Lessons for Developing Cities
box 5Analyzing service level benchmarks for Public Transport Facilities in IndiaPerformance Measures identified under the urban transport function ‘Public Transport Facilities’:
1. Presence of Organised Public Transport System in Urban Area
Target: Within the first year, all JNNURM cities to establish Organised Public Transport System and by second year all 0.2 million plus population cities (as per 2001 Census) to establish the same.
2. Extent of Supply/Availability of Public Transport
Target: Within the first two years, all million-plus cities but less than 4 million to increase public transit supply to service level 3 or above all 4 million-plus cities to increase supply to service level 2 or above.
3. Service Coverage of Public Transport in the city (Bus route network density)
Target: All million-plus cities but less than 4 million to increase their public transit coverage at least supply to service level 3 or above; all 4 million-plus cities to increase the service coverage to service level 2 or above.
4. Average waiting time for Public Transport users
Target: All million-plus cities to maintain average waiting time for public transport users to be a maximum of 10 minutes or below within 2 years.
5. Level of Comfort in Public Transport (Crowding)
Target: In all million-plus cities, within 2 years, the level of service should be 3 or above.
6. Percentage Fleet as per Urban Bus Specifications
Target: All million-plus cities to have at least 25 % of their fleet as per urban bus specifications by the end of first year.
For the calculation of LOS for the measure ‘Average waiting time for Public Transport users’, the steps to be followed are:a) Delineate the key corridors for public transport in the city;b) Calculate the average waiting time (in min) of passengers for each route;c) Create the frequency distribution.
LOS 4 Avg. waiting time
1 < = 4
2 4 – 6
3 6 – 10
4 > 10
Calculated LOS of Public Transport = LOS 1 + LOS 2 + LOS 3 + LOS 4 + LOS 5 + LOS 6
Overall Calculated LOS Interpretation for the city’s public transport system
1 < 12 Good, wide spread, easily available to the citizens, comfortable.
2 12 – 16Needs considerable improvements in terms of supply of buses/coaches, coverage and frequency. It is comfortable.
3 17 – 20May need considerable improvements in terms of supply of buses/coaches, coverage, frequency of the services and comfort.
4 21 – 24 Non-existent or poorly organised.
Similarly, LOS for other urban transport ‘functions’ is also to be calculated.
The complete document on SLBs can be accessed from: http://urbanindia.nic.in/programme/ut/Service_level.pdf

20
Sustainable Urban Transport Technical Document # 9
6.2 Suggestions for further improvement
The SLBs for urban transport introduced by the Ministry of Urban Development, Government of India, is a well thought out and intended technical initiative by the Government. Such an exercise is necessary to set baselines for urban transport in cities, which do not currently exist. This initiative also reflects the government’s vision of having a greater share of well-functioning public transport modes in the cities. Some observations and suggestions on the SLBs are dis-cussed below. Though these emerge from the Indian SLBs, they could be equally applicable to other developing cities which are considering establishing performance measurement or even benchmarking systems.
a) It would be a good idea to start with performance evaluation, develop the requisite sys-tems for monitoring, make improvements, and then gradually move towards creating a benchmarking system, where best practices are emulated from each other. Focussing on the latter should come after the cities have addressed their challenges and proven them-selves to be competitive in service delivery. Learning from good practices is no doubt useful, however bringing the service levels to a minimum acceptable standard should remain as the main focus.
b) Data collection and reporting is a resource intensive activity, and some kind of prioritisa-tion of areas should be done. It has been widely acknowledged that public transport and non-motorised transport improvements are priority areas for developing cities. Therefore, cities should develop a set of performance measures in areas relevant for them, rather than adopting the entire set of service level benchmarks and reporting on them. For example, areas like “level of usage of ITS”, may not be necessary for all cities, especially the medium and small order cities. In fact, if every city can start to measure the perfor-mance of its public transport and non-motorised transport systems properly, and use this information for generating improvements and creating a paradigm shift in policy-making and public perception these issues, it would be a significant achievement.
Figure 10Mumbai’s
sub-urban rail.Photo: Chhavi Dhingra, 2011

21
Measuring Public Transport Performance – Lessons for Developing Cities
c) Furthermore, the indicators for non-motorised and public transport should include prin-ciples of universal design and information and guidance systems as indicators.
d) Having ‘vehicle travel speeds of motorised vehicles’ and ‘availability of parking spaces’ service level benchmarks conveys a wrong signal, as improving these may result in creat-ing induced demand for more personal motor vehicles. Instead of targeting for ‘improve-ment’, these areas could be targeted for ‘demand management’ or discouraging personal vehicle usage, and to compliment public transport and non-motorised transport improve-ment. Instead of measuring travel speeds of personal vehicles, cities should measure how much the travel speeds of public transport modes increase every year as opposed to per-sonal modes, and, level, enforcement and effectiveness of parking management measures could be monitored instead of number of parking spaces.
e) Road safety is an important measure, but conflicts with the earlier area of having increased travel speeds. Increased speeds of say personal vehicles usually would imply increased road risk for other vulnerable road users and modes, hence reduced road safety. Hence, prioritisation of areas needs to be done for performance evaluation.
f) For air pollution related measures, focus should also be on monitoring technology usage and mix in fleets and tail-pipe emissions. Measuring things like energy efficiency of public transport vehicles, percentage of vehicles running on clean fuel, percentage of all urban trips made by public transport, emissions per public transport vehicle, etc. might be useful and more pro-active than simply measuring the pollutant concentration levels in air [3].
[3] The Benchmarking of Energy and Emission Performance in Urban Public Transport Operations (BESTRANS, 2004) report provides useful insights in this area.
Figure 11Bangalore’s air-conditioned buses offer comfort and convenience.Photo: Chhavi Dhingra, 2007

22
Sustainable Urban Transport Technical Document # 9
g) Aggregating results as a number in the form of ‘level of service’ does not always convey the correct picture and risks offering an aggregate and sometimes vague diagnosis of the problem where it becomes difficult to say which improvements matter most. At the end of the day, how we use the valuable data collected for interpreting results will govern how successful a performance evaluation system is. Review of international case studies reveals that it is necessary for the city authority/operator to have clear goals, objectives, perfor-mance measures and targets which give a clear idea of what and how much improve-ment is needed where. This does not imply that indicators need to always be quantitative. Simple ‘yes’ or ‘no’ indicators at times may be enough to understand the problem (e.g. do 90 % of the bus stops in the city have disabled ramp access?). However the questions asked or areas measured should reflect actual problem areas of urban transport and lead to ways for improving them, rather than presenting a generic urban transport scenario for the city in terms of numbers.
h) Comparisons based on the prescribed service level benchmarks and using the same cri-teria of LoS across different cities might obscure the cities’ unique characteristics. As already mentioned above, every city/region needs to identify its priority areas for meas-urement and develop indicators accordingly. In case of cities with similar public transport systems, there could be an agreed set of performance measures that they need to report on, depending on the reporting requirements of the government. However, all of this should be in line with the goals and objectives of a policy guideline/law or voluntary commitment to undertake performance evaluation for public transport.
i) Recognising the importance and role that Intermediate Public Transport (IPT) vehicles will continue to play in developing cities, a way to include IPT modes in performance evaluation and integrating them with existing/proposed public transport modes needs to be explored. This also translates into making the SLBs more conducive to the needs of the smaller cities which might not always have formalised public transport systems.
A comprehensive report by UITP on statistical indicators of public transport performance in Africa (UITP, 2010), offers good insights into using a set of global indicators for evaluating public transport performance, and identifying the specific challenges applicable in the Afri-can context through case studies. The report also makes recommendations for bringing about reforms in the public transport sector in African cities, which is dominated by the so called informal transport modes.

23
Measuring Public Transport Performance – Lessons for Developing Cities
7. Advice for cities and public transport agencies on setting up performance measurement systems
Performance measurement is a strategic process that will take some time to be fully developed, and come to a level where it is used for making substantial changes to policies and strategies. It needs the coming together of a number of aspects, and as far as possible should be an independ-ent and transparent process.Developing cities may need to address several challenges to create these systems (maybe even create new laws/enactments) and build the required capacity. Given below are guidelines that cities and transit agencies should keep in mind while establishing a comprehensive public trans-port performance measurement program:
7.1 Data collection
�� Carrying out an evaluation exercise would require time and rigorous data collection efforts, which would need effective monitoring, coordination and commitment on part of the city authorities. Performance evaluation efforts should not end in surveys, tabulation and report-ing only. Interlinking transport statistics to performance indicators would also need to be done.�� Cities should apply the following principles when selecting transportation performance indi-cators (VTPI, 2010):�¾ Comprehensive – Indicators should reflect various economic, social and environmental impacts, and various transport activities (such as both personal and freight transport).�¾ Data quality – Data collection practices should reflect high standards to insure that information is accurate and consistent.�¾ Comparable – Data collection should be standardised so the results are suitable for comparison between various jurisdictions, times and groups. Indicators should be clearly defined.�¾ Easy to understand – Indicators must useful to decision-makers and understandable to the general public. The more information condensed into a single index the less meaning it has for specific policy targets (for example, Ecological Footprint analysis incorporates many factors) and the greater the likelihood of double counting.�¾ Accessible and transparent – Indicators (and the raw data they are based on) and analysis details should be available to all stakeholders.�¾ Cost effective – The suite of indicators should be cost effective to collect. The decision-making worth of the indicators must outweigh the cost of collecting them.�¾ Net effects – Indicators should differentiate between net (total) impacts and shifts of impacts to different locations and times.�¾ Performance targets – select indicators that are suitable for establishing usable perfor-mance targets.
�� In most cities where performance evaluation is done, most data and information regarding mobility trends is placed in the public domain, and is accessible to general public and agen-cies, alike. This enables standardisation and avoids spending money on conducting multiple studies by different agencies. This kind of information sharing enables successful monitoring systems, and should be adopted by cities. This would again require good inter-agency coordi-nation and free-flow of information. Cities and public transport agencies should agree upon common measures and data definitions – this will provide standardisation and enable com-parison of data with other cities/countries (see more on this in Section 8.1).�� Indicators should be prepared early in the planning process. For example, performance measures should be included in invitations for transport concessionaires to provide services, or in requests for proposals for supplying transport vehicles or infrastructure. Leaving some

24
Sustainable Urban Transport Technical Document # 9
flexibility for minor negotiations with the regulating authorities, agreed upon standards and performance measures could go into the contractual language as binding criteria during the life of the agreement (Rickert, 2005).�� Training and capacity development to understand the various aspects of initiating and con-tinuing a performance evaluation program will need to be imparted at various levels for gov-ernmental and non-governmental stakeholders. This will include things like understanding data formats, conducting surveys, data analysis and suggesting remedial actions. Policy-mak-ers, city planners, transport operators, drivers and even the civil society need to understand the need and benefits of performance evaluation from their perspective.
7.2 Policy and/or legal enabler
�� Experience from other cities demonstrates that getting cities and operators to agree on engag-ing in performance evaluation usually requires a directive from the central government (could be a policy, law, commitment to a Charter or any legal enabler), state level support and the full cooperation of all local actors whose work affects public transport planning and pro-vision, including the civil society.�� States and cities shall commit to this effort and start with modest goals and objectives to monitor and improve public transport. It is important to ensure that such an effort is not one-off and the cities are able to sustain and continue with the same in the future.
7.3 Reporting
�� Annual/quarterly/monthly reports must be prepared and shared by cities/operators with all key stakeholders, including the public.�� Reporting should not be restricted to financial and operational measures. Service as per-ceived by the customer and measures like accessibility, safety, comfort, reliability, afford-ability, etc. should be made part of a formal performance evaluation system (see more on this in Section 8.2).
7.4 Making course corrections
�� This should be an ongoing process, and over time new and different performance indicators should be tested to seek further improvements. The integration of performance evaluation actively into agency development and decision-making is most critical.�� Practitioners should make sure that they link performance measures back to strategic goals and objectives and facilitate constant course correction. Experience from Asian cities like Singapore, Hong Kong, Taipei, etc. shows that this usually needs strong commitment and support of senior management, regularly scheduled meetings to evaluate performance, focus-sing on a limited number of measures, proper communication of the results internally and externally and presence of both quantitative and qualitative performance measures.

25
Measuring Public Transport Performance – Lessons for Developing Cities
7.5 Outreach, networking and feedback
�� Performance evaluation should be accompanied by good outreach efforts; e.g. having a help-ful website, call centre support, newsletter. All these enable operators to reach out to the public and in turn the public to understand and use their services more and more.�� Peer networking, mentoring and professional support are important factors, especially when cities are about to set up performance evaluation systems. Agency staff grows professionally through exposure to and discussions with colleagues in similar positions at other agencies. Two key success factors for European transit benchmarking networks have been the use of an external facilitator (e.g. a university or a private consultant) and ongoing financial support. The facilitator performs functions that individual transit agency staff may not have time or experience for, including compiling and analysing data, producing reports, and organising meetings (e.g. information-sharing working groups on a specific topic or an annual meeting of the network participants) (Ryus and Sembler, 2010).
There are several organisations working actively in this area; e.g. Volvo Research and Education Foundations, which could be contacted for advice by cities and public transport agencies.

26
Sustainable Urban Transport Technical Document # 9
8. Next steps
8.1 Data definition
One of the first things that developing cities need to do in order to engage with performance evaluation or even benchmarking, is data collection and before that, data definition. Most cities today do not have baseline data on aspects like urban travel demand, modal shares, trip maker profiles, travel patterns, land-use changes, infrastructure capacity and quality, service quality, inclusiveness, equity, etc. The quality of data that exists is usually poor and the absence of clear and consistent definitions and unreliable collection methods add to the quality problems.
Figure 12Proper data definition
and collection are pre-requisites to
successful performance evaluation systems.
Photo: Chhavi Dhingra, Ahmedabad, 2011
In order to address the data gaps, extensive surveys (household, transit, employment centres, etc. surveys) and data mining and consolidation from existing secondary sources (mobility plans, traffic and transportation studies, land-use plans, population census, etc.) might be required to be undertaken. Also, the database created should be in a standardised and agreed format which can be used by all stakeholders. A glossary of terms should be developed which should apply to all cities and the terms defined.Definitions of these terms could ideally be grouped by topics/themes, consistent with the data collection tables. For example, this could be one possible grouping:�� Modes of service related�� Demographic, geographic�� Financial�� Organisational�� Legal/regulatory�� Vehicle characteristics

27
Measuring Public Transport Performance – Lessons for Developing Cities
�� Energy and environment related�� Universal design�� Quality/services received by user�� Trip patterns in the city (planning)�� Services rendered/operations�� Vehicle and service related amenities, infrastructure
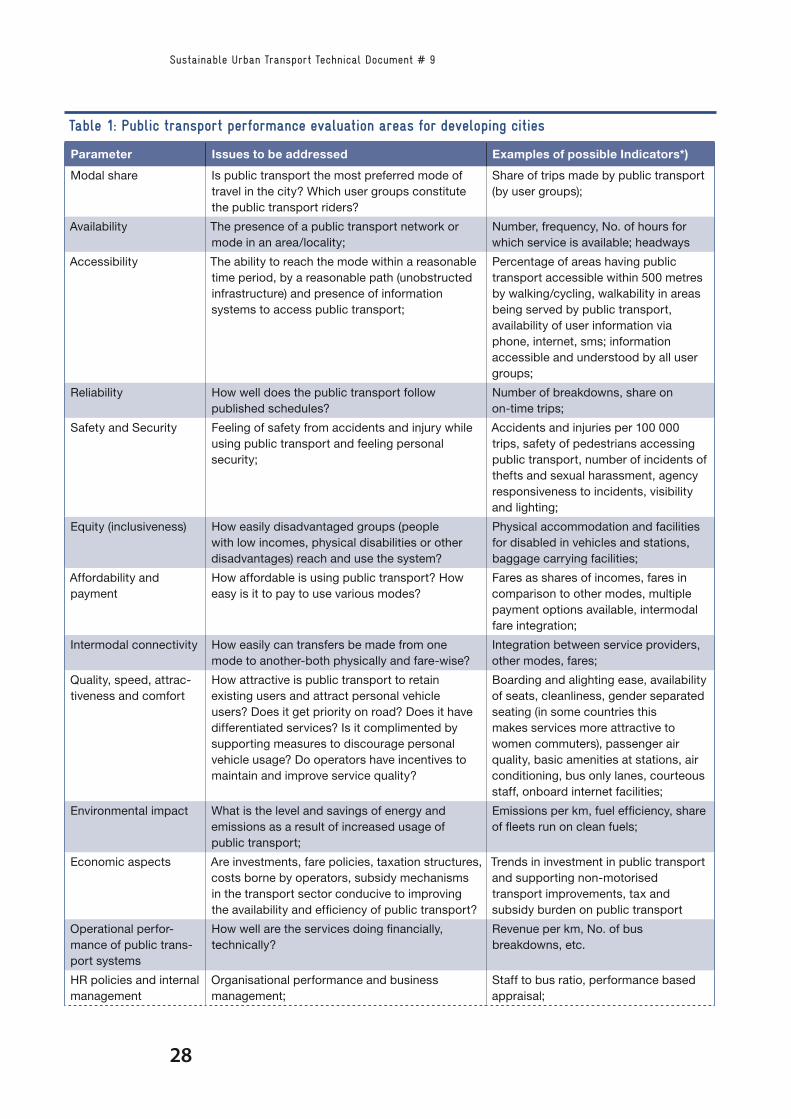
8.2 Suggested performance evaluation areas
Relevant parameters, in the form of questions, and examples of performance indicators for these parameters are listed below. Cities and public transport agencies should define start collecting public transport statistics and performance indicators on these guidelines, as part of setting up a performance evaluation system. This will give a good idea of the ‘health’ of the system. Once this is done and measures for correction identified, then agencies could look at setting bench-marks and start comparisons between cities.
Figure 13It makes sense to start with more obvious and basic performance measures like availability, access, affordability, safety, comfort, convenience and reliability.Photo: Chhavi Dhingra, Ahmednagar, 2011
28
Sustainable Urban Transport Technical Document # 9
Table 1: Public transport performance evaluation areas for developing cities
Parameter Issues to be addressed Examples of possible Indicators*)
Modal share Is public transport the most preferred mode of travel in the city? Which user groups constitute the public transport riders?
Share of trips made by public transport (by user groups);
Availability The presence of a public transport network or mode in an area/locality;
Number, frequency, No. of hours for which service is available; headways
Accessibility The ability to reach the mode within a reasonable time period, by a reasonable path (unobstructed infrastructure) and presence of information systems to access public transport;
Percentage of areas having public transport accessible within 500 metres by walking/cycling, walkability in areas being served by public transport, availability of user information via phone, internet, sms; information accessible and understood by all user groups;
Reliability How well does the public transport follow published schedules?
Number of breakdowns, share on on-time trips;
Safety and Security Feeling of safety from accidents and injury while using public transport and feeling personal security;
Accidents and injuries per 100 000 trips, safety of pedestrians accessing public transport, number of incidents of thefts and sexual harassment, agency responsiveness to incidents, visibility and lighting;
Equity (inclusiveness) How easily disadvantaged groups (people with low incomes, physical disabilities or other disadvantages) reach and use the system?
Physical accommodation and facilities for disabled in vehicles and stations, baggage carrying facilities;
Affordability and payment
How affordable is using public transport? How easy is it to pay to use various modes?
Fares as shares of incomes, fares in comparison to other modes, multiple payment options available, intermodal fare integration;
Intermodal connectivity How easily can transfers be made from one mode to another-both physically and fare-wise?
Integration between service providers, other modes, fares;
Quality, speed, attrac-tiveness and comfort
How attractive is public transport to retain existing users and attract personal vehicle users? Does it get priority on road? Does it have differentiated services? Is it complimented by supporting measures to discourage personal vehicle usage? Do operators have incentives to maintain and improve service quality?
Boarding and alighting ease, availability of seats, cleanliness, gender separated seating (in some countries this makes services more attractive to women commuters), passenger air quality, basic amenities at stations, air conditioning, bus only lanes, courteous staff, onboard internet facilities;
Environmental impact What is the level and savings of energy and emissions as a result of increased usage of public transport;
Emissions per km, fuel efficiency, share of fleets run on clean fuels;
Economic aspects Are investments, fare policies, taxation structures, costs borne by operators, subsidy mechanisms in the transport sector conducive to improving the availability and efficiency of public transport?
Trends in investment in public transport and supporting non-motorised transport improvements, tax and subsidy burden on public transport
Operational perfor-mance of public trans-port systems
How well are the services doing financially, technically?
Revenue per km, No. of bus breakdowns, etc.
HR policies and internal management
Organisational performance and business management;
Staff to bus ratio, performance based appraisal;

29
Measuring Public Transport Performance – Lessons for Developing Cities
Parameter Issues to be addressed Examples of possible Indicators*)
Presence of policies/norms at national/state/city levels to ensure:
Public transport services are run as a successful business enterprise;
Modal shares of public transport are increased by making it the most favoured and priority mode of travel in cities;
Performance evaluation is an integral part of public transport planning and provision;
Cities are responsible and empowered to plan and manage their public transport services;
There is complete coordination between various relevant agencies related to public transport planning and provision.
Existence of a public transport policy, policy directive on performance measurement, inter-agency coordination and cooperation.
*) Could be both qualitative and quantitative
Table 1: Public transport performance evaluation areas for developing cities (II)
Table 1 presents a starting point for cities to create an evaluation system. The mechanism for institutionalising performance evaluation could either be proposed by the Centre or be worked out jointly between the states and cities. There also needs to be some lead time for preparation for the cities and for them to develop capacities to initiate and continue such an exercise. To achieve this, there is a need to give local governments both incentives and management tools to implement policies for more efficient, cleaner and safer urban mobility and encourage a shift towards a more sustainable urban mobility culture. There are several initiatives that govern-ments worldwide are taking in this direction, which could offer valuable lessons and directions in this regard. Box 6 describes one such initiative.

30
Sustainable Urban Transport Technical Document # 9
box 6EcoMobility SHIFT – Measuring mobility policiesThe EcoMobility SHIFT project (June 2010 – May 2013) is an activity of the Global Alliance for EcoMobility which aims to create a certification scheme to assess and help improve local governments’ sustainable transport policies, where municipalities will be able to obtain an ‘EcoMobility Label’. The EcoMobility certification scheme is meant for local authorities or groups of municipalities responsible for transport policies in an urban region as a whole. The project defines an ‘EcoMobile City’ as one “developing, improving and encouraging the use of alternatives to the private car”. The project targets that a city, its trans-portation/mobility department, in cooperation with internal and external partnerships and supported by the policy-makers and citizens, is functioning and taking decisions in a way (enablers) as to put the right transport products and services of high quality in place (products and services) that can take the city towards EcoMobility (results and impacts). This is briefly explained in the figure below.
Labeling, identifying strengths and weaknesses, benchmarking and measuring: all form key aspects of such an exercise, which will require creating definitions and terminologies that distinguish good performance from bad, indicators, etc. This will be supplemented by knowledge of best practices in each of the identified areas for improvement.
In this Project, a list of 36 indicators has been compiled as well as information sheets for each of them. The list contains seven indicators for relevant factors impacting on the EcoMobility criteria (city profile), six indicators measuring the city’s approach in planning for EcoMobility (the Enablers), sixteen indicators measuring the authority’s output in public space (Transport systems and services), and seven indicators measuring the longer term impact of these efforts (Results & impacts) on the transport systems as well as on the city at large, such as modal split and energy efficiency. For each indicator, five levels of performance have been described to enable scoring. The weighing of the individual scores within the blocks (domains) of assessment criteria, as well as the weighing of the various blocks against each other (e.g. how do we rate processes com-pared to results) will be decided.
This approach facilitates the review of mobility policies and their impacts at a city level and therefore promises to enable a more holistic outcome. It also makes the city authorities more responsible and accountable for its mobility practices. It does however, require extensive information gathering. For more information, visit: http://www.ecomobility.org/shift-project
ENABLERS• Society and user needs• Vision and policy• Strategy• Leadership• Means and personnel• Citizen and stakeholder involvement• External partnerships• Monitoring and evaluation• Management review
PRODUCTS AND SERVICES• Walking and cycling• Public transport• Optimised use of private motorised modes• Mobility management
RESULLTS AND IMPACTS• Modal split• Safety impacts• Environmental impacts
CITY PROFILE:A number of characteristics referring to all issues exogenous to the citythat influence the enabler and/or products and services and/or results side

31
Measuring Public Transport Performance – Lessons for Developing Cities
Bibliography
�� CTE (2008), Improved Methods For Assessing Social, Cultural, And Economic Effects Of Transportation Projects, NCHRP Project 08-36, TRB (http://www.trb.org) and AASHTO; at http://www.statewideplanning.org/_resources/234_NCHRP-8-36-66.pdf.
�� CTOD (2010), Performance-Based Transit-Oriented Development Typology Guidebook, Center for Transit-Oriented Development (http://www.reconnectingamerica.org); at http://www.reconnectingamerica.org/public/display_asset/2010_performancebasedtodtypolo-gyguidebook.
�� CTS (2010), Measuring What Matters: Access to Destinations, the second research summary from the Access to Destinations Study, Center for Transportation Studies, University of Min-nesota (http://www.cts.umn.edu); at http://www.cts.umn.edu/Publications/ResearchRe-ports/pdfdownload.pl?id=1426.
�� FHA (2004). Transportation Performance Measures in Australia, Canada, Japan and New Zealand. U.S. Department for Transportation, Federal Highway Administration. USA
�� Margareta Friman and Markus Fellesson (2009), “Service Supply and Customer Satisfac-tion in Public Transportation: The Quality Paradox”, Journal of Public Transportation, Vol. 12, No 4, pp. 41-56; at http://www.nctr.usf.edu/jpt/pdf/JPT12-4.pdf.
�� Albert Gan, Feng Gui and Li Tang (2011), “System for Transit Performance Analysis Using the National Transit Database”, Journal of Public Transportation, Vol. 14, No 3, pp. 87-108; at http://www.nctr.usf.edu/wp-content/uploads/2011/10/JPT14.3.pdf.
�� Theunis F. P. Henning, Sugandree Muruvan, Wanhua A. Feng and Roger C.Dunn (2011), “The Development Of A Benchmarking Tool For Monitoring Progress Towards Sustainable Transportation In New Zealand”, Transport Policy, Vol. 18, pp. 480–488 (http://www.science-direct.com/science/article/pii/S0967070X10001368).
�� Robert A. Johnston (2008), “Indicators for Sustainable Transportation Planning”, Trans-portation Research Record 2067, Transportation Research Board (http://www.trb.org), pp. 146–154; at http://pubs.its.ucdavis.edu/publication_detail.php?id=1260.
�� Kittleson & Associates (2003a), Transit Capacity and Quality of Service Manual, Report 100, Transit Cooperative Research Program, Transportation Research Board (http://www.trb.org); at http://trb.org/news/blurb_detail.asp?id=2326.
�� Todd Litman (2003), “Measuring Transportation: Traffic, Mobility and Accessibility”, ITE Journal (http://www.ite.org), Vol. 73, No 10, October, pp. 28-32; at http://www.vtpi.org/measure.pdf.
�� Todd Litman (2005), Well Measured: Developing Indicators for Comprehensive and Sustain-able Transport Planning, VTPI (http://www.vtpi.org); at http://www.vtpi.org/wellmeas.pdf; summarised in “Developing Indicators For Comprehensive And Sustainable Transport Plan-ning”, Transportation Research Record 2017, TRB (http://www.trb.org), 2007, pp. 10-15.
�� Todd Litman (2008), Introduction to Multi-Modal Transport Planning, VTPI (http://www.vtpi.org); at http://www.vtpi.org/multimodal_planning.pdf.
�� Todd Litman (2007), “Developing Indicators For Comprehensive And Sustainable Transport Planning”, Transportation Research Record 2017, Transportation Research Board (http://www.trb.org), pp. 10-15; at http://www.vtpi.org/sus_tran_ind.pdf.
�� Todd Litman and Tom Rickert (2005), Evaluating Public Transit Accessibility: ‘Inclusive Design’ Performance Indicators For Public Transportation In Developing Countries, Victoria Transport Policy Institute (http://www.vtpi.org); at http://www.vtpi.org/tranacc.pdf.
�� MoUD (2009). “Service Level Benchmarks for Urban Transport at a Glance”, Ministry of Urban Development, Government of India. New Delhi, India. http://urbanindia.nic.in/pro-gramme/ut/Service_level.pdf; Last accessed 5 July 2011.

32
Sustainable Urban Transport Technical Document # 9
�� OECD (2000). Transport Benchmarking-methodologies, applications & data needs. Euro-pean Conference of Ministers of Transport. Paris, France.
�� PCT (2011), Measuring Transportation Investments: The Road To Results, Pew Charita-ble Trusts and The Rockefeller Foundation (http://www.pewtrusts.org); at http://www.pewtrusts.org/uploadedFiles/wwwpewtrustsorg/Reports/State_policy/Transportation_Report_2011.pdf.
�� Rickert, T. (2005). Transport for All: What Should We Measure? Comments on the use of indicators and performance measures for inclusive public transport in developing regions.
�� Ryus, P. and Sembler, C. (2010), “Best practices for benchmarking public transport” Submit-ted to the AITPM 2010 National Conference.
�� SLoCaT (2010). Transport Data Contact Group, Sustainable, Low Carbon Transport Part-nership (http://www.sutp.org/slocat); at http://www.sutp.org/slocat/work-program/transport-data-and-ghg-assessment.
�� STI (2008). Sustainable Transportation Indicators: A Recommended Program to define a Standard Set of Indicators For Sustainable Transportation Planning, Sustainable Transporta-tion Indicators Subcommittee (ADD40 [1]), TRB (http://www.trb.org); at http://www.vtpi.org/sustain/sti.pdf.
�� TCRP (2003). Kittelson & Associates, Inc., LKC Consulting Services, Inc., Morpace Interna-tional, Inc., Queensland University Of Technology and Nakanishi, Y., “A Guidebook for Developing a Transit Performance-Measurement System” TCRP Report 88. Transportation Research Board, Washington, D.C. 2003, http://onlinepubs.trb.org/onlinepubs/tcrp/tcrp_report_88/Guidebook.pdf; Last accessed 10 August 2011.
�� TCRP (2010). Ryus, P., Coffel, K., Parks, Perk, V., Cherrington, V., Arndt, J., Nakanishi,Y. and Gan, A., “A Methodology for Performance Measurement and Peer Comparison in the Public Transportation Industry” TCRP Report 141, Transportation Research Board. Washington, D.C., 2010, http://onlinepubs.trb.org/onlinepubs/tcrp/tcrp_report_88/Guidebook.pdf; Last accessed 10 August 2011.
�� TCRP (2010)’. Transit Cooperative Research Program. “Research Results Digest 95” Report on the Spring 2009 Mission, International Transit Studies Program, Transportation Research Board. Washington, D.C., 2010, http://onlinepubs.trb.org/onlinepubs/tcrp/tcrp_rrd_95.pdf; Last accessed on 1 August 2011.
�� TRB (2008), Performance Measurement Practice (http://www.trb-performancemeasure-ment.org), Performance Measurement Committee (ABC30), Transportation Research Board.
�� TTR (2004). Urban Transport Benchmarking Initiative: Annex A1.2 Review of Previous Initia-tives. July 2004. Transport and Travel Research Ltd. Prepared for European Commission Directorate General for Energy and Transport.
�� UITP (2010), Report On Statistical Indicators Of Public Transport Performance In Sub-Saha-ran Africa, International Association of Public Transport (http://www.uitp.org); http://www.uitp.org/knowledge/projects-details.cfm?id=444.
�� USEPA (2011), Guide To Sustainable Transportation Performance Measures, U.S. Environ-mental Protection Agency (http://www.epa.gov); at http://www.epa.gov/smartgrowth/pdf/Sustainable_Transpo_Performance.pdf.
�� Volvo Foundation Centres of Excellence, Public Transport Development, Benchmarking and performance assessment (http://www.vref.se/thefutprogramme/researchthemes/publictransportdevelopment.4.6a462c7912efb9dc85f80002387.html).
�� VTPI (2010), “Performance Evaluation”, Online TDM Encyclopedia, Victoria Transport Policy Institute (http://www.vtpi.org/tdm).

33
Measuring Public Transport Performance – Lessons for Developing Cities
AppendixCase Studies On Public Transport Performance Evaluation
Singapore
Kuala Lumpur
Sydney
Helsinki

34
Sustainable Urban Transport Technical Document # 9
A1. Singapore [1]
Location Singapore
Area 710 km2
Population 5.1 million
Modes Rail, bus
Total rail length 175 km
Stations 130
Total No. of buses 4 100
Bus routes 261
Total PT ridership 5.4 million passengers/day
Modal share of PT 59 %
Key agencies Land Transport Authority (LTA) and Public Transport Council (PTC) (within the auspices of the Ministry of Transport)
Guiding policy/document Land Transport Masterplan (2008) (see Figure 9)
Performance measures mandatory as per Government requirement
Yes
Performance measures and standards used
i. Reliabilitya. Headway adherenceb. Bus breakdownc. Actual/scheduled bus trips operated on each route
BUS ii. Passenger loadinga. Peak-hour loading
iii. Safetya. Accident rate
iv. Availability of servicea. Service coverage (within 400 m distance of any residence/
employment area), direct connectivityb. Temporal availability – maximum headways, No. of hours of
operationv. Integration of service between bus and trainvi. Customer information
a. Pre-trip and in-trip information, timetables
RAIL i. Service qualitya) On-time performanceb) Train service availabilityc) Passenger loadingd) Severity of service disruptionse) Train headwaysf) Frequency of occurrence of service disruptiong) Information and communication
1. Information and communication2. Equipment performance3. Reliability of functioning of ticketing machines, gates,
escalators lifts, etc.
[1] The year of data collected for each location corresponds to the year mentioned in the source for each case study.
È

35
Measuring Public Transport Performance – Lessons for Developing Cities
Location Singapore
Reporting Format The Public Transportation Council is responsible for delivering performance measures on bus service. The PTC publishes the performance of the bus service providers in Singapore every six months. SMRT and SBST report a set of agreed-upon rail operation performance measures to LTA. In general the following reporting formats are adopted:
� Monthly meetings and reports (internal) � Quarterly reports published and circulated � Annual reports
SMRT also reports to the NOVA International Rail Benchmarking group.
Feedback/evaluation methods Smartcards provide information on ridership, trainload and revenue, customer feedback surveys, monitoring and tracking customer complaints, central control divisions, automated delay and incident tracking systems, cross-validation of electronic data with passenger surveys.
Legal enabler The Rapid Transit Systems Act gives LTA the authority to grant operating licenses, regulate terms and conditions of concessionaire contracts, and issue standards for practice, as well as directives, as needed, to individual operators. For bus services, the Public Transport Act gives PTC the authority to grant bus service licenses, bus service operator’s licenses and regulate fares and service standards.
Enforcement of performance evaluation
1. License and operating agreements contain performance meeting conditionality, including penalty for non-compliance.
2. Independent customer satisfaction surveys and random field audits performed by LTA and PTC.
3. LTA and PTC (only for buses) have authority to conduct audits to ensure that operators are in compliance. Random audits are conducted on a monthly basis. Process audits of the operators are performed annually, and a system audit takes place every 3 years.
Outreach efforts Web, Quarterly newsletter “Connect”, Annual report
A1. Singapore (II)

36
Sustainable Urban Transport Technical Document # 9
*) The balanced scorecard (BSC) is a strategic performance management tool – a semi-standard structured report, supported by proven design methods and automation tools that can be used by managers to keep track of the execution of activities by the staff within their control and to monitor the consequences arising from these actions. Source: http://en.wikipedia.org/wiki/Balanced_scorecard; Last accessed on 20 September 2011.
A2. Kuala Lumpur, Malaysia
Location Kuala Lumpur (KL), Malaysia
Area 243 km2
Population 1.7 million
Modes Rail, bus
Total rail length 56 km
Stations 49
Total No. of buses 978
Bus routes 165
Total PT ridership 750 000 passengers/day
Modal share of PT 14 %
Key agencies RapidKL (Rangkaian Pengangkutan Integrasi Deras Sdn Bhd) (Light Rail and buses), KL Star Rail
Guiding policy/document Quality management business strategy of Rapid KL based on 4 pillars:1. Internal processes2. Financial performance3. Customer satisfaction4. Learning and growthWithin the four pillars, there are nine objectives and 21 key performance indicators, based on contractual requirement, customer needs, shareholder expectations, and government regulations.
PM mandatory as per Government requirement
Yes
Performance measures and standards used
Bus operations scorecard which includes:
BUS 1. Internal process (most important for Rapid KL): � To achieve and monitor daily bus schedule (on-time performance).
� To implement a bus ticketing system � To develop standard operating procedures for operations � To fully satisfy operations quality standards
2. Financial goals: � To achieve the targeted budgeted revenue � To maintain operating costs within budget
3. Customer: � To provide safe and efficient bus service
4. Learning and growth: � To retain quality, skilled employees � To develop skilled employees.
RAIL 1. Service reliability, punctuality, frequency2. Safety and operating statistics
Reporting Format Balanced Scorecard Method*) is adopted. All the departments make an effort to monitor the targets monthly and make adjustments and improvements as needed. Safety and operating characteristics are reported quarterly to the board of directors and government for compliance purposes. È

37
Measuring Public Transport Performance – Lessons for Developing Cities
Location Kuala Lumpur (KL), Malaysia
Feedback/evaluation methods Event logs, schedules, automated data collection systems with in-built quality checks, peer group inputs and evaluations, benchmarking against similar systems like Vancouver (SkyTrain), Laus (Dublin’s LRT) and the John F. Kennedy International Airport in New York (AirTrain JFK), customer surveys, automated data collection systems, etc.
Legal enabler RapidKL provides operators with a base salary plus bonuses for the number of trips they perform, attendance, punctuality, revenue, accidents/incidents, and customer complaints. To comply with its operating agreement with Prasarana, RapidKL must report these key indicators, and the indicators must meet the previously agreed-upon targets (TCRP, 2010).
Enforcement of performance evaluation
No program yet for auditing performance independently or independent assessment of service quality.
Outreach efforts Website: http://www.myrapid.com.my
A2. Kuala Lumpur, Malaysia (II)

38
Sustainable Urban Transport Technical Document # 9
A3. Sydney, Australia
Location Sydney, Australia
Area 2 500 km2
Population 2.5 million
Modes Public bus, ferry, rail
Total No. of buses, ferries 1 900 buses, 2 ferries
Routes 300
Total No. of ferries 30
Total PT ridership 200 million passengers per year (in 2006)
Modal share of PT 14 %
Key agencies State Transit (ST)
Guiding policy/document The Transport Administration Act defines the following objectives as having equal importance for State Transit:
� Operate efficient, safe, and reliable services, � Maximise the net worth of the State’s investment in State Transit,
� Be socially responsible, � Be environmentally responsible, and � Be responsible toward regional development and decentralisation.
This legislation required that an overall business management system be put in place, one that can be adequately assessed. At the corporate level, the main ST goal is to “contribute to the development of a sustainable urban environment by attracting travellers to public transport” (TCRP, 2003)
PM mandatory as per Government requirement
Yes
Performance measures and standards used
To achieve the main goal, a number of objectives have been defined. The level of detail and quantification of performance measures directly related to each objective varies depending on the objective. Some are quantified while others are given a qualitative treatment. Most of the objectives have measurable indicators to help monitor achievement levels. The objectives and related performance measures for State Transit, Sydney are as follows (TCRP, 2003):
1. New and Innovative Services:a. Numbers and types of services introduced;b. Patronage by route; time of day, and day of week;c. Monthly and annual patronage.
2. Accessibility Levels/Convenience:a. Percent of population living within 400 metres and within 800
metres of a bus stop;b. All routes connect to regional centers (yes/no);c. Community consultation activities are held frequently
(yes/no);d. Customer satisfaction (from regular attitudinal surveys);e. Customer complaints: number of complaints of each type;f. Bus fleet composition: targets are 25 % low floor; 20 %
wheelchair, accessible; 35 % air-conditioned. È

39
Measuring Public Transport Performance – Lessons for Developing Cities
Location Sydney, Australia
3. Reliability:a. On-time running (no later than 5 minutes) in normal traffic
conditions (target 95 %). On-time running is measured at route terminus (buses and ferries) and at mid-points along the route (buses).
b. Early running (target: 0 %);c. Mechanical failures preventable through regular
maintenance;d. Number of changeovers (buses that require in-service
replacement) per 100 000 kilometres (target: 98 % mechanical reliability for buses).
4. Safety and Security of Passengersa. All buses fitted with CCTV units (yes/no);b. All buses in radio contact with control center (yes/no);c. Non-slip floors on all buses (yes/no).
5. Comfort:a. Average fleet age (12 years is the contractual obligation);b. Number of buses air-conditioned, accessible to people with
disabilities, with quality seating, and low-floor;c. Percentage of buses cleaned internally daily; percent of
buses washed every 3 days;d. Percentage of buses purchased that are environmentally
friendly (target: 100 %).
6. Staff Training to Provide “Friendly” Service:a. Standards set for customer service training;b. Help available for customers who do not understand the
system;c. On-going communication of decisions.
7. Travel Information to Passengers:a. Percentage of public timetables reviewed within a set period
(target: 100 %);b. Number of transit shops;c. Numbers of agents selling tickets and providing information.
8. Efficiency to Keep Costs Down and Fares at Affordable Levels:a. Average operating cost per passenger trip for buses;b. Average operating cost per passenger trip for ferries;c. Cost per vehicle-kilometre for each main cost center.
Reporting Format Annual reports – the Corporate Plan; Annual Report; the annual submission to the fare-setting tribunal; reports to the State Government Department of Transport as the contracting agency; Monthly reports for the Board and for functional units; Weekly and daily reports for functional units.
A3. Sydney, Australia (II)
È

40
Sustainable Urban Transport Technical Document # 9
Location Sydney, Australia
Feedback/evaluation methods 4 main methods for data collection are adopted: � A fuel scanning system (transponder-based with readers at depots logging bus ID, fuel used, and kilometres run);
� Scheduling software (timetabling, crew roistering, and bus scheduling);
� Automatic fare collection (AFC) which reduces boarding times by as much as 30 % compared with other operators (this system also provides patronage and ticket sales data); and
� A payroll system (which provides labor cost data).The four systems are integrated into a single management reporting system called the ‘Executive Information System’ (EIS). Passenger surveys are conducted regularly.
Legal enabler The performance-evaluation system is also designed to monitor State Transit’s “Guarantee of Service”, which is a publicised pledge on customer service standards. A “Quality Service Charter” states the main service related goals as
� To ensure that service delivered reflects the travel needs of customers;
� To operate buses with excellent safety standards for the benefit of passengers, staff, and the general public;
� To provide bus services that meet high standards of frequency, timeliness, reliability, and cleanliness;
� To provide customers with complete, easily understood, and up-to-date service information about bus services;
� To develop a reputation for customer service through polite, courteous, and helpful staff; and
� To make services more accessible for all passengers.The service agreements with the NSW State Government cover financial performance, as well as levels and quality of service. The levels of fares are set by an independent tribunal and are based on cost-effectiveness, quality of service, and cost-of-living benchmarks.
Enforcement of performance evaluation
ST monitors closely the way in which it is able to fill off-peak seats (thus increasing patronage at low marginal cost), as well as making inroads into the segments of the market for which there is considerable latent demand (e.g. recreational and leisure trips). Patronage levels are monitored by time period (morning and evening peaks, off-peak, and weekends).
Outreach efforts Integrated Transport Information Service (ITIS) is a service which provides comprehensive integrated information on bus (both State Transit and private-sector operations), ferry, and rail services. The service is accessed by telephone and by Internet, and provides information like departure/arrival times, trip planning, special events travel, alerts to passengers on any service changes, interruptions, etc. There are Quarterly reports called ‘State Transit Proactive Release of Performance Information’.Website: http://www.sydneybuses.info
A3. Sydney, Australia (III)
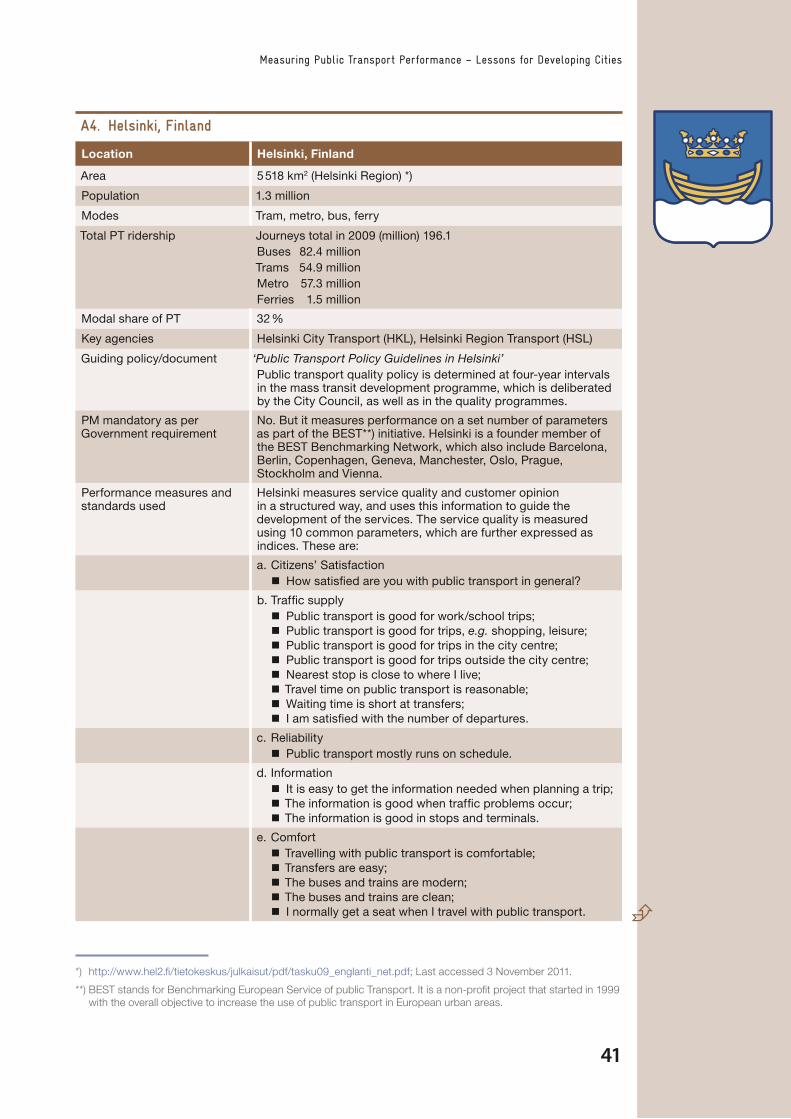
41
Measuring Public Transport Performance – Lessons for Developing Cities
*) http://www.hel2.fi/tietokeskus/julkaisut/pdf/tasku09_englanti_net.pdf; Last accessed 3 November 2011.
**) BEST stands for Benchmarking European Service of public Transport. It is a non-profit project that started in 1999 with the overall objective to increase the use of public transport in European urban areas.
A4. Helsinki, Finland
Location Helsinki, Finland
Area 5 518 km2 (Helsinki Region) *)
Population 1.3 million
Modes Tram, metro, bus, ferry
Total PT ridership Journeys total in 2009 (million) 196.1Buses 82.4 millionTrams 54.9 millionMetro 57.3 millionFerries 1.5 million
Modal share of PT 32 %
Key agencies Helsinki City Transport (HKL), Helsinki Region Transport (HSL)
Guiding policy/document ‘Public Transport Policy Guidelines in Helsinki’Public transport quality policy is determined at four-year intervals in the mass transit development programme, which is deliberated by the City Council, as well as in the quality programmes.
PM mandatory as per Government requirement
No. But it measures performance on a set number of parameters as part of the BEST**) initiative. Helsinki is a founder member of the BEST Benchmarking Network, which also include Barcelona, Berlin, Copenhagen, Geneva, Manchester, Oslo, Prague, Stockholm and Vienna.
Performance measures and standards used
Helsinki measures service quality and customer opinion in a structured way, and uses this information to guide the development of the services. The service quality is measured using 10 common parameters, which are further expressed as indices. These are:
a. Citizens’ Satisfaction � How satisfied are you with public transport in general?
b. Traffic supply � Public transport is good for work/school trips; � Public transport is good for trips, e.g. shopping, leisure; � Public transport is good for trips in the city centre; � Public transport is good for trips outside the city centre; � Nearest stop is close to where I live; � Travel time on public transport is reasonable; � Waiting time is short at transfers; � I am satisfied with the number of departures.
c. Reliability � Public transport mostly runs on schedule.
d. Information � It is easy to get the information needed when planning a trip; � The information is good when traffic problems occur; � The information is good in stops and terminals.
e. Comfort � Travelling with public transport is comfortable; � Transfers are easy; � The buses and trains are modern; � The buses and trains are clean; � I normally get a seat when I travel with public transport. È

42
Sustainable Urban Transport Technical Document # 9
Location Helsinki, Finland
f. Staff Behaviour � The staff answers my questions correctly; � The staff behaves nicely and correctly.
g. Personal Security and Safety � I feel secure at stations and bus stops; � I feel secure on board buses and trains; � I am not afraid of traffic accidents when using public transport.
h. Value for Money � Public transport gives value for money; � Public transport fares are reasonable.
i. Social Image � More people will travel with public transport in the future; � Public transport is good for the environment; � Public transport is beneficial to society.
j. Customer Loyalty � I gladly recommend travelling with public transport to others.
Reporting Format There are four main types of reports available:1. Index comparisons2. Quality elements comparisons3. Subgroups comparisons
� Index � Quality elements � Public transport mode
4. TablesUsually there is also a summary per city which includes:
� Which items the city achieves above average, average and below average results compared with other BEST cities;
� The change in index results from last year; � The top 5 drivers of satisfaction, compared with how many other BEST cities that has the same driver among its top 5.
Results and data from the BEST network of cities is available in BEST Surveys Results, BEST Reports and Analysis, BEST Seminar, BEST Web report which contains the results from the BEST Surveys conducted from 2001 until 2011, available through a web based reporting solution.
Feedback/evaluation methods A common survey is conducted each year in the beginning of March where 1 000 citizens are interviewed by telephone in each of the participating cities/regions about their attitudes to public transport. The basic questionnaire consists of 20 questions and an extended version contains an additional 8 questions. These questions cannot be changed, but it is possible for the cities to buy extra questions or additional interviews.
Each year a seminar is held for the BEST participants in a European city, with the objective of exchanging ideas and experiences, and creating and maintaining a network between public transport professionals. In addition, a number of common interest groups (CIGs) are established to compare processes and activities within a specific and agreed area. The CIGs normally have a couple of meetings between each seminar, where the agreed topic are studied more in-depth.
Legal enabler Finnish public transportation law makes it mandatory on the managing agency to ensure marketing, promotion and service quality standards are part of their mandate. È
A4. Helsinki, Finland (II)

43
Measuring Public Transport Performance – Lessons for Developing Cities
Location Helsinki, Finland
Enforcement of performance evaluation
Helsinki City Transport (HKL);
The service contracts include quality incentives, and also have penalties for below-standard performance.
Outreach efforts The BEST network holds seminars, events and other activities for evaluation, research and other development, where even Non-members can participate and either follow or learn from the BEST participants.
BEST News Updates, Workshops, Website:
http://www.best2005.net
http://www.hel.fi/hki/hkl/en/Etusivu
A4. Helsinki, Finland (III)

Deutsche Gesellschaft fürInternationale Zusammenarbeit (GIZ) GmbH
– German Technical Cooperation –
P. O. Box 518065726 ESCHBORN / GERMANYT +49-6196-79-1357F +49-6196-79-801357E [email protected] http://www.giz.de