Lessons during Covid
23
ECLAC - OECD Lessons during Covid
Transcript of Lessons during Covid

ECLAC - OECD
Lessons during Covid

Lost instruction days (upper secondary)
Source: OECD/UIS/UNESCO/UNICEF/WB Special Survey on Covid. March 2021
Austria
Czech Republic
Denmark
Finland
France
Germany
Ireland
Italy
Netherlands Norway
PolandSlovak Republic
Sweden
Switzerland
United Kingdom
Chile
Colombia
Estonia
IsraelSlovenia Lat…
Lithuania
Costa Rica
Portugal
New-Zealand
Korea
BelgiumRussian Federation
Turkey
0
20
40
60
80
100
120
140
160
180
400 420 440 460 480 500 520 540
Nu
mb
er
of
inst
ruct
ion
day
s w
he
re u
pp
er
seco
nd
ary
sch
oo
ls w
ere
fu
lly c
lose
d in
20
20

Lost instruction days (upper secondary)
Source: OECD/UIS/UNESCO/UNICEF/WB Special Survey on Covid. March 2021
Austria
Czech Republic
Denmark
Finland
France
Germany
Ireland
Italy
Netherl… Norway
PolandSlovak Republic
Sweden
Switzerland
United …
Chile
Colombia
Est…
IsraelSlovenia
Lat…
Lithuania
Costa Rica
Port…
New-Zealand
Ko…
BelgiumRussian …
Turkey
0
20
40
60
80
100
120
140
160
180
400 420 440 460 480 500 520 540
Nu
mb
er
of
inst
ruct
ion
day
s w
he
re u
pp
er
seco
nd
ary
sch
oo
ls w
ere
fu
lly c
lose
d in
20
20
Size of bubbles represents number of COVID-19 cases per million inhabitants in 2020
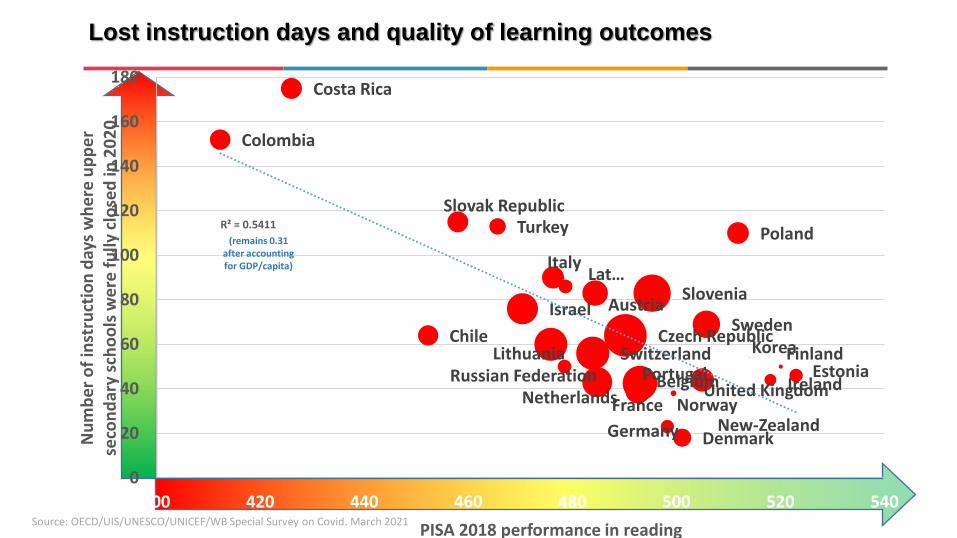
Lost instruction days and quality of learning outcomes
Source: OECD/UIS/UNESCO/UNICEF/WB Special Survey on Covid. March 2021
Austria
Czech Republic
Denmark
Finland
France
Germany
Ireland
Italy
Netherlands Norway
Poland
Slovak Republic
Sweden
Switzerland
United Kingdom
Chile
Colombia
Estonia
IsraelSlovenia
Lat…
Lithuania
Costa Rica
Portugal
New-Zealand
Korea
BelgiumRussian Federation
TurkeyR² = 0.5411
0
20
40
60
80
100
120
140
160
180
400 420 440 460 480 500 520 540
Nu
mb
er
of
inst
ruct
ion
day
s w
he
re u
pp
er
seco
nd
ary
sch
oo
ls w
ere
fu
lly c
lose
d in
20
20
PISA 2018 performance in reading
(remains 0.31 after accounting for GDP/capita)
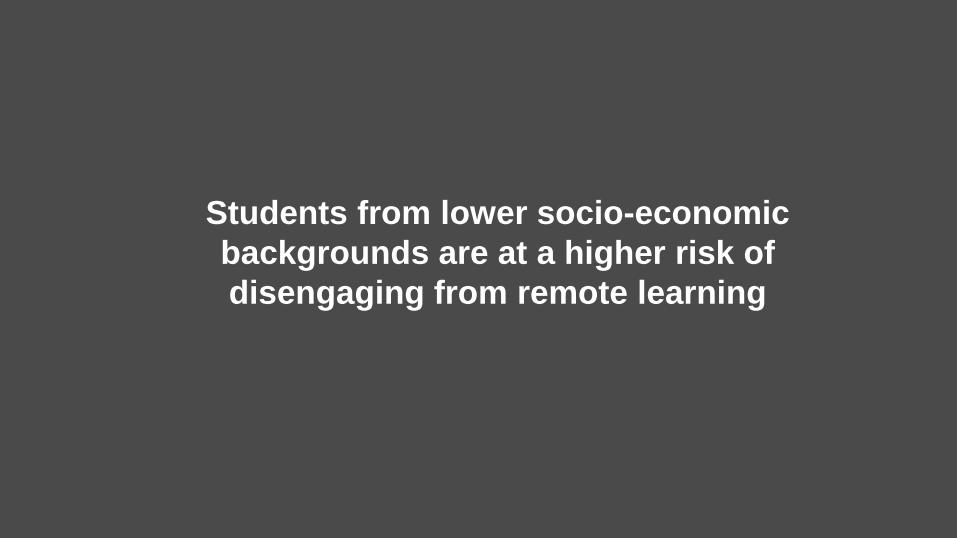
Students from lower socio-economic
backgrounds are at a higher risk of
disengaging from remote learning

In some countries, more than 5% of students repeat a grade
Share of repeaters in lower and upper secondary education (2019)
Figure B1.2.
0
1
2
3
4
5
6
7
8
9
10
Spa
in
Belg
ium
Port
ug
al
Gre
ece
Ch
ile
Austr
ia
Colo
mb
ia
Sau
di A
rab
ia
Germ
any
Ind
one
sia
EU
22 a
vera
ge
Costa
Ric
a
Esto
nia
Italy
Slo
vak R
epu
blic
OE
CD
ave
rag
e
Un
ited
Sta
tes
Hu
ng
ary
Pola
nd
Luxe
mb
ou
rg
Latv
ia
Fra
nce
Sw
itze
rla
nd
Isra
el
Denm
ark
Me
xic
o
Slo
ven
ia
Tu
rkey
Cze
ch R
ep
ub
lic
Lithu
ania
Fin
land
Ru
ssia
n F
ede
ratio
n
Ire
land
Kore
a
%
Lower secondary
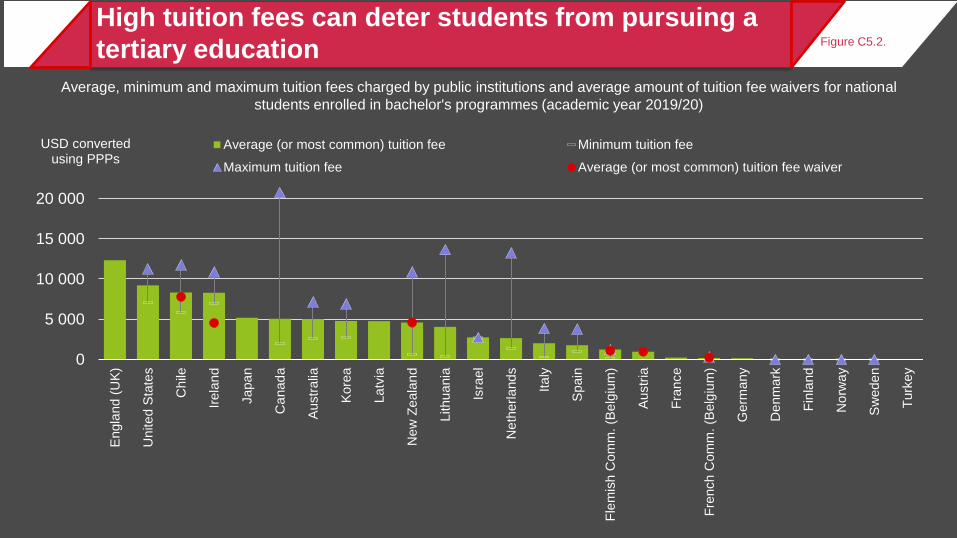
High tuition fees can deter students from pursuing a
tertiary education
Average, minimum and maximum tuition fees charged by public institutions and average amount of tuition fee waivers for national
students enrolled in bachelor's programmes (academic year 2019/20)
Figure C5.2.
0
5 000
10 000
15 000
20 000
Engla
nd
(U
K)
Un
ite
d S
tate
s
Ch
ile
Irela
nd
Japa
n
Ca
nad
a
Austr
alia
Kore
a
La
tvia
Ne
w Z
eala
nd
Lithu
ania
Isra
el
Ne
therl
and
s
Ita
ly
Spain
Fle
mis
h C
om
m.
(Belg
ium
)
Austr
ia
Fra
nce
Fre
nch C
om
m. (B
elg
ium
)
Germ
any
De
nm
ark
Fin
land
No
rwa
y
Sw
ede
n
Turk
ey
USD convertedusing PPPs
Average (or most common) tuition fee Minimum tuition fee
Maximum tuition fee Average (or most common) tuition fee waiver
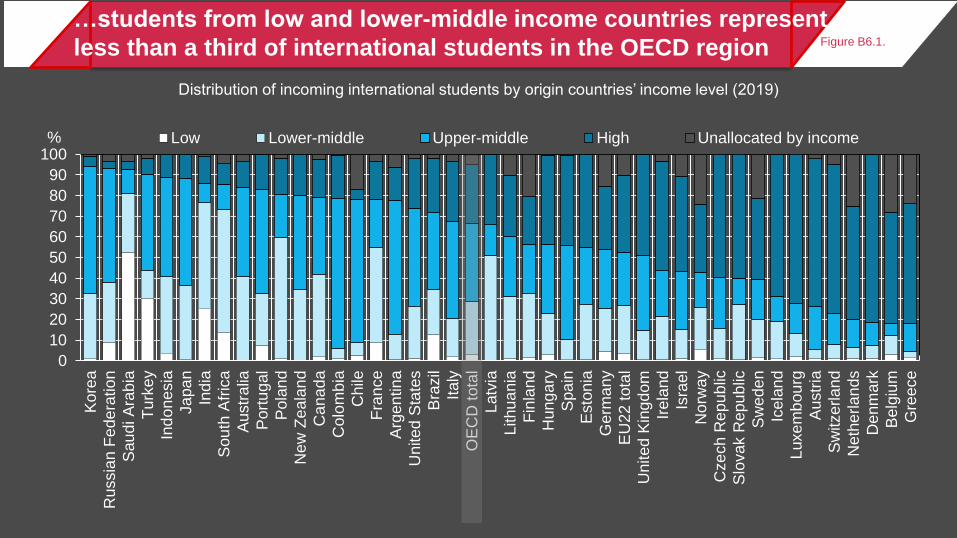
…students from low and lower-middle income countries represent
less than a third of international students in the OECD region Figure B6.1.
0
10
20
30
40
50
60
70
80
90
100
Kore
a
Russia
n F
ede
ratio
n
Sau
di A
rab
ia
Tu
rkey
Ind
one
sia
Ja
pa
n
Ind
ia
Sou
th A
fric
a
Austr
alia
Port
ug
al
Pola
nd
New
Ze
ala
nd
Cana
da
Colo
mb
ia
Chile
Fra
nce
Arg
en
tin
a
United
Sta
tes
Bra
zil
Italy
OE
CD
tota
l
Latv
ia
Lithu
ania
Fin
land
Hung
ary
Spa
in
Esto
nia
Germ
any
EU
22 t
ota
l
Un
ited
Kin
gd
om
Ire
land
Isra
el
Norw
ay
Cze
ch R
ep
ub
lic
Slo
vak R
epu
blic
Sw
ede
n
Icela
nd
Luxe
mb
ou
rg
Austr
ia
Sw
itze
rla
nd
Neth
erla
nds
De
nm
ark
Belg
ium
Gre
ece
% Low Lower-middle Upper-middle High Unallocated by income
Distribution of incoming international students by origin countries’ income level (2019)

Although international mobility can be high in some countries... Figure B6.2.
Incoming student mobility in tertiary education, by level of study (2019)
0
10
20
30
40
50
60
Austr
alia
New
Ze
ala
nd
Un
ited
Kin
gd
om
Sw
itze
rla
nd
Austr
iaC
ana
da
Cze
ch R
ep
ub
licH
ung
ary
Esto
nia
Ire
land
Denm
ark
Latv
iaG
erm
any
Belg
ium
Port
ug
al
Fra
nce
Slo
vak R
epu
blic
Icela
nd
Fin
land
EU
22 t
ota
lS
wede
nS
loven
iaO
EC
D t
ota
lL
ithu
ania
Ja
pa
nU
nited
Sta
tes
Sau
di A
rab
iaN
orw
ay
Ru
ssia
n F
ede
ratio
nP
ola
nd
Spa
inS
ou
th A
fric
aG
reece
Arg
en
tin
aK
ore
aIs
rael
Italy
Tu
rkey
Ch
ileM
exic
oC
hin
aB
razil
Colo
mb
iaIn
dia
Ind
one
sia
% All tertiary Bachelor's or equivalent Master's or equivalent Doctoral or equivalent

Poor education amplifies risks in the labour market
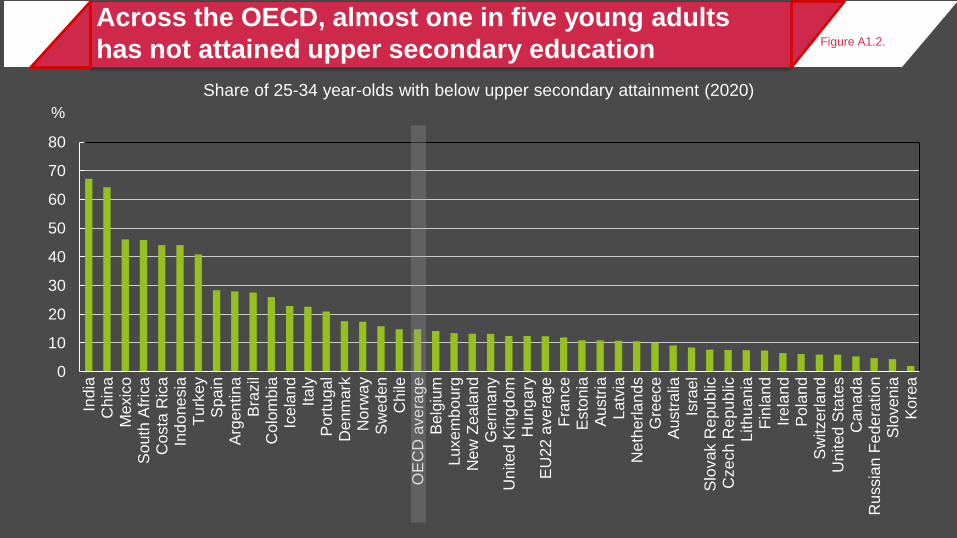
Across the OECD, almost one in five young adults
has not attained upper secondary education
Share of 25-34 year-olds with below upper secondary attainment (2020)
Figure A1.2.
0
10
20
30
40
50
60
70
80
Ind
iaC
hin
aM
exic
oS
ou
th A
fric
aC
osta
Ric
aIn
do
ne
sia
Tu
rkey
Spa
inA
rgen
tin
aB
razil
Colo
mb
iaIc
ela
nd
Italy
Port
ug
al
Denm
ark
No
rwa
yS
wede
nC
hile
OE
CD
ave
rag
eB
elg
ium
Luxe
mb
ou
rgN
ew
Ze
ala
nd
Germ
any
Un
ited
Kin
gd
om
Hung
ary
EU
22 a
vera
ge
Fra
nce
Esto
nia
Austr
iaL
atv
iaN
eth
erla
nds
Gre
ece
Austr
alia
Isra
el
Slo
vak R
epu
blic
Cze
ch R
ep
ub
licL
ithu
ania
Fin
land
Ire
land
Pola
nd
Sw
itze
rla
nd
United
Sta
tes
Ca
na
da
Ru
ssia
n F
ede
ratio
nS
loven
iaK
ore
a
%
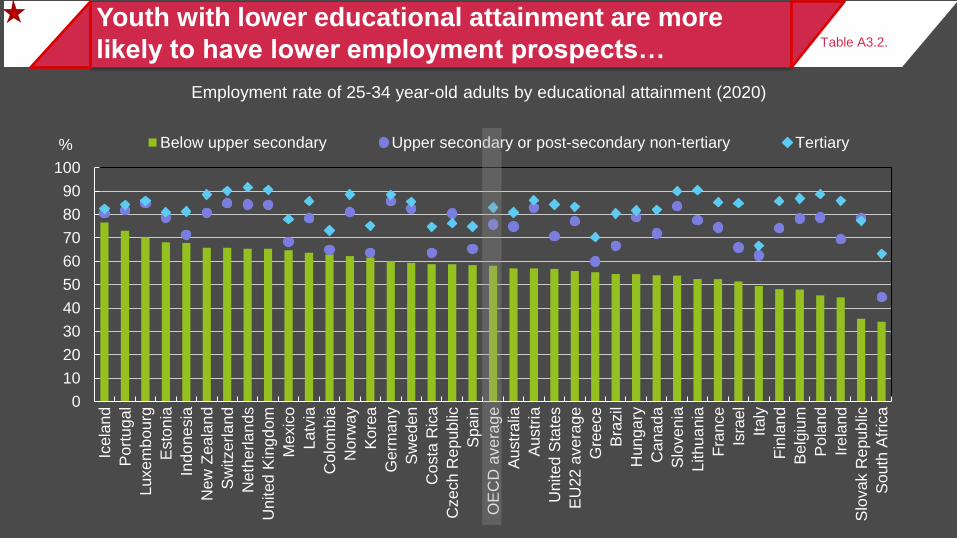
Youth with lower educational attainment are more
likely to have lower employment prospects…
Employment rate of 25-34 year-old adults by educational attainment (2020)
Table A3.2.
0
10
20
30
40
50
60
70
80
90
100
Icela
nd
Port
ug
al
Luxe
mb
ou
rg
Esto
nia
Ind
one
sia
Ne
w Z
eala
nd
Sw
itze
rla
nd
Ne
the
rla
nds
Un
ited
Kin
gd
om
Me
xic
o
Latv
ia
Co
lom
bia
Norw
ay
Kore
a
Germ
any
Sw
ede
n
Co
sta
Ric
a
Cze
ch R
ep
ub
lic
Spa
in
OE
CD
ave
rag
e
Austr
alia
Austr
ia
Un
ited
Sta
tes
EU
22 a
vera
ge
Gre
ece
Bra
zil
Hung
ary
Ca
na
da
Slo
ven
ia
Lithu
ania
Fra
nce
Isra
el
Italy
Fin
land
Belg
ium
Pola
nd
Ire
land
Slo
vak R
epu
blic
Sou
th A
fric
a
Below upper secondary Upper secondary or post-secondary non-tertiary Tertiary%
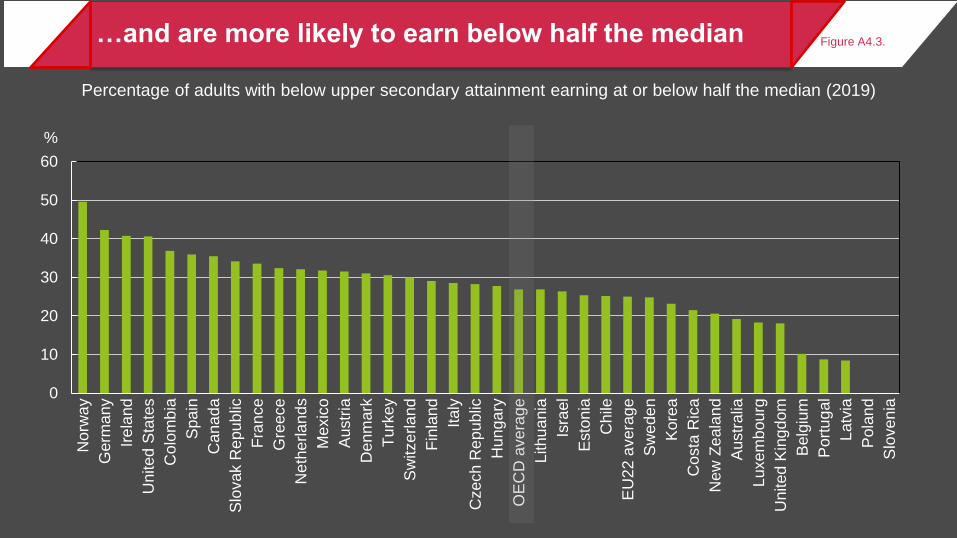
…and are more likely to earn below half the median
Percentage of adults with below upper secondary attainment earning at or below half the median (2019)
Figure A4.3.
0
10
20
30
40
50
60
Norw
ay
Germ
any
Ire
land
Un
ited
Sta
tes
Colo
mb
ia
Spa
in
Cana
da
Slo
vak R
epu
blic
Fra
nce
Gre
ece
Ne
the
rla
nds
Me
xic
o
Austr
ia
Denm
ark
Tu
rkey
Sw
itze
rla
nd
Fin
land
Italy
Cze
ch R
ep
ub
lic
Hung
ary
OE
CD
ave
rag
e
Lithu
ania
Isra
el
Esto
nia
Chile
EU
22 a
vera
ge
Sw
ede
n
Kore
a
Co
sta
Ric
a
Ne
w Z
eala
nd
Austr
alia
Luxe
mb
ou
rg
Un
ited
Kin
gd
om
Belg
ium
Port
ug
al
Latv
ia
Pola
nd
Slo
ven
ia
%

It’s not just about the money

Adults with tertiary education can expect to live 5 years
more than those with below upper secondary education
Difference in life expectancy at age 30 between those with tertiary attainment and those with below upper secondary attainment, by gender (2017)
Figure A6.1.
- 2
0
2
4
6
8
10
12
14
16
Slo
vak R
epu
blic
Pola
nd
Esto
nia
Hung
ary
Isra
el
Fra
nce
Ca
na
da
Denm
ark
EU
22 a
vera
ge
Fin
land
Avera
ge
Slo
ven
ia
No
rwa
y
Belg
ium
Ne
the
rla
nds
Sw
ede
n
Icela
nd
Cze
ch R
ep
ub
lic
Port
ug
al
Italy
Spa
in
Tu
rkey
Gre
ece
Total (men and women) Men Women
Years
Life expectancey of tertiary-educated adults is higher than for adults with belowupper secondary education

Starting strong?

Public-to-private transfers in pre-primary education
Distribution of public and private expenditure on educational institutions in pre-primary education (2018)
Figure B2.3.
0
10
20
30
40
50
60
70
80
90
100
Ja
pa
n
Un
ited
Kin
gd
om
Port
ug
al
Austr
alia
Chile
Colo
mb
ia
Tu
rkey
Un
ited
Sta
tes
Denm
ark
Slo
ven
ia
Italy
Kore
a
OE
CD
ave
rag
e
Spa
in
Pola
nd
Ne
w Z
eala
nd
Germ
any
Slo
vak R
epu
blic
No
rwa
y
Lithu
ania
Austr
ia
Icela
nd
EU
22 a
vera
ge
Ne
the
rla
nds
Gre
ece
Hung
ary
Czech R
ep
ub
lic
Isra
el
Fin
land
Fra
nce
Sw
ede
n
Latv
ia
Belg
ium
Luxe
mb
ou
rg
Private expenditure Public-to-private transfers Public expenditure%

Maintaining funding for education is key to
ensuring equitable student outcomes
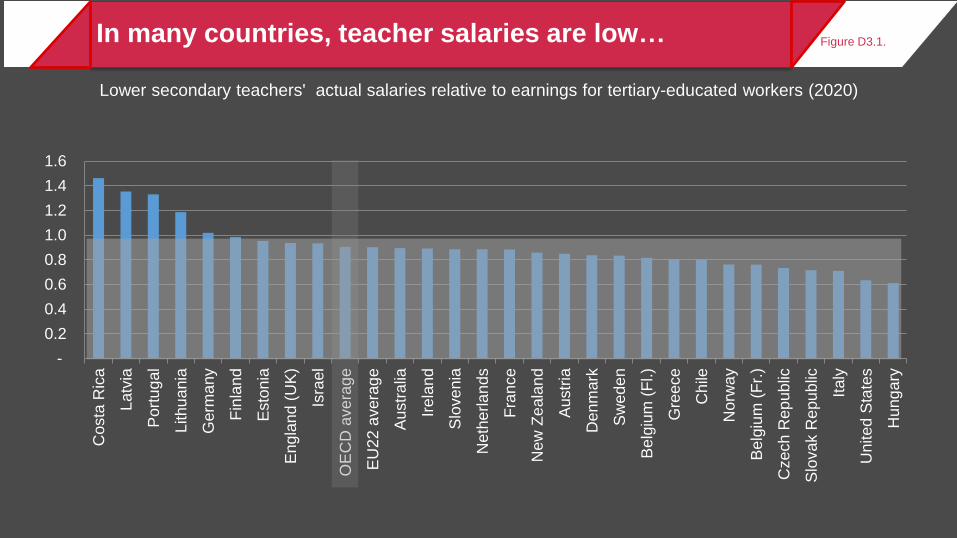
In many countries, teacher salaries are low…
Lower secondary teachers' actual salaries relative to earnings for tertiary-educated workers (2020)
-
0.2
0.4
0.6
0.8
1.0
1.2
1.4
1.6
Costa
Ric
a
Latv
ia
Port
ug
al
Lithu
ania
Germ
any
Fin
land
Esto
nia
Eng
land
(U
K)
Isra
el
OE
CD
ave
rag
e
EU
22 a
vera
ge
Austr
alia
Ire
land
Slo
ven
ia
Neth
erla
nds
Fra
nce
New
Ze
ala
nd
Austr
ia
Denm
ark
Sw
ede
n
Belg
ium
(F
l.)
Gre
ece
Ch
ile
Norw
ay
Belg
ium
(F
r.)
Czech R
ep
ub
lic
Slo
vak R
epu
blic
Italy
United
Sta
tes
Hung
ary
Figure D3.1.

…and the earnings progression is flat
Lower secondary teachers’ average actual salaries compared to the statutory starting and top of the scale salaries (2020)
Annual salaries of teachers in public institutions, in equivalent USD converted using PPPs
Figure D3.2.
0
20 000
40 000
60 000
80 000
100 000
120 000
140 000
Luxe
mb
ou
rgG
erm
any
Sw
itze
rla
nd
Denm
ark
Spa
inN
eth
erla
nds
Austr
alia
Austr
iaN
orw
ay
Un
ited
Sta
tes
Sw
ede
nS
cotla
nd (
UK
)B
elg
ium
(F
l.)
Fin
land
Icela
nd
Belg
ium
(F
r.)
Cana
da
Ire
land
EU
22 a
vera
ge
OE
CD
ave
rag
eIt
aly
Fra
nce
Port
ug
al
Ne
w Z
eala
nd
Kore
aE
ng
land
(U
K)
Slo
ven
iaT
urk
ey
Ja
pa
nL
ithu
ania
Me
xic
oC
ze
ch R
ep
ub
licC
hile
Esto
nia
Isra
el
Co
lom
bia
Gre
ece
Pola
nd
Slo
vak R
epu
blic
Latv
iaH
ung
ary
Co
sta
Ric
aB
razil
Starting salary/minimum qualifications Salary at top of scale/maximum qualificationsUSD

-3 500
-2 500
-1 500
- 500
500
1 500
2 500
3 500
Germ
any
De
nm
ark
Sw
itzerl
and
No
rwa
y
Belg
ium
(F
l)
Austr
ia
Belg
ium
(F
r)
Ca
nad
a
Austr
alia
Slo
ven
ia
Irela
nd
Icela
nd
Ne
therl
and
s
Spain
Port
ug
al
Ita
ly
Fin
land
Gre
ece
Japa
n
Pola
nd
Co
sta
Ric
a
Ch
ile
Isra
el
Lithu
ania
Hu
nga
ry
Fra
nce
Esto
nia
Turk
ey
Co
lom
bia
Czech R
ep.
Me
xic
o
La
tvia
Slo
vak R
ep.
Contribution of teachers' salary Contribution of instruction time
Contribution of teaching time Contribution of theoretical class size
Difference of salary cost of teachers per student from OECD average
Various factors contribute to the total salary cost of
teachers per studentContribution of various factors to salary cost of teachers per student in public institutions, primary education (2019)
Figure C7.2.
High salary cost Moderately high salary cost Moderately low salary cost Low salary cost
USD

Equity criteria in funding formulas help ensure resources
are directed to where they are the most needed
Share of total funding allocated by central and state governments to primary and lower secondary educational institutions by equity criteria (2019)
Figure D6.4.
0 5 10 15 20 25
The number or proportion of low-income students
The number or proportion of students with disabilities
The number or proportion of students with an immigrant background
Schools (or most local level of governance) serving poor or disadvantagedcommunities
Schools (or most local level of governance) that are in remote or high costlocations/regions
Schools (or most local level of governance) with special subject offerings (i.e.minority language)
The number or proportion of low-income people in thestate/region/province/municipality
The number or proportion of people with an immigrant background in thestate/region/province/municipality
States/regions/provinces/municipalities in remote and/or rural locations
The number or proportion of people who belong to minority communities in thestate/region/province/municipality
The number or proportion of people who belong to disadvantaged communities inthe state/region/province/municipality
Stu
de
nt
cha
racte
ristics
Scho
ol
cha
racte
ristics
Po
pu
latio
n c
hara
cte
ristics
Number of countries
Large Medium Small Unknown Not used
HUN
POL
BRA&HUN
AUS&BRA
HUN&IRL&POL&USA
AUS&CHL&ENG&HUN&IRL&USA
AUS&AUT&BRA&CHL&ISR&POL&USA
AUT&BFR&NLD&USA
BFR&HUN&LVA
LVA
IRL
COL
Find out more about our work at www.oecd.org/edu
– All publications
– The complete micro-level database
Thank you