Lesson: Natural and Urban Stormwater Water...
12
Lesson: Natural and Urban "Stormwater" Water Cycles Contributed by: Water Awareness Research and Education (WARE) Research Experience for Teachers (RET), University of South Florida, Tampa Grade Level: Lessons in this Unit: Time Required: Lesson Dependency : Subject Areas: Curricular Units: Activities: Quick Look 7 (68) 1 2 90 minutes (two 45minute class periods) None Related Curriculum Science and Technology Urban Stormwater Management Natural and Urban "Stormwater" Water Cycle Models How does the natural water cycle (left) differ from what you would find in your neighborhood? copyright Summary Through an overview of the components of the hydrologic cycle and the important roles they play in the design of engineered systems, students' awareness of the world's limited fresh water resources is heightened. The hydrologic cycle affects everyone and is the single most critical component to life on Earth. Students examine in detail the water cycle components and phase transitions, and then learn how water moves through the human made urban environment. This urban "stormwater" water cycle is influenced by the pervasive existence of impervious surfaces that limit the amount of infiltration, resulting in high levels of stormwater runoff, limited groundwater replenishment and reduced groundwater flow. Students show their understanding of the process by writing a description of the path of a water droplet through the urban water cycle, from the droplet's point of view.
Transcript of Lesson: Natural and Urban Stormwater Water...
6/30/2015 Natural and Urban "Stormwater" Water Cycles Lesson www.TeachEngineering.org
https://www.teachengineering.org/view_lesson.php?url=collection/usf_/lessons/usf_stormwater/usf_stormwater_lesson01.xml 1/12
Lesson: Natural and Urban "Stormwater" WaterCycles
Contributed by: Water Awareness Research and Education (WARE) Research Experience for Teachers(RET), University of South Florida, Tampa
Grade Level:Lessons in this Unit:
Time Required:
Lesson Dependency :
Subject Areas:Curricular Units:
Activities:
Quick Look
7 (68)1 290 minutes(two 45minute class periods)
None
Related Curriculum
Science and Technology
Urban Stormwater Management
Natural and Urban "Stormwater" Water Cycle Models
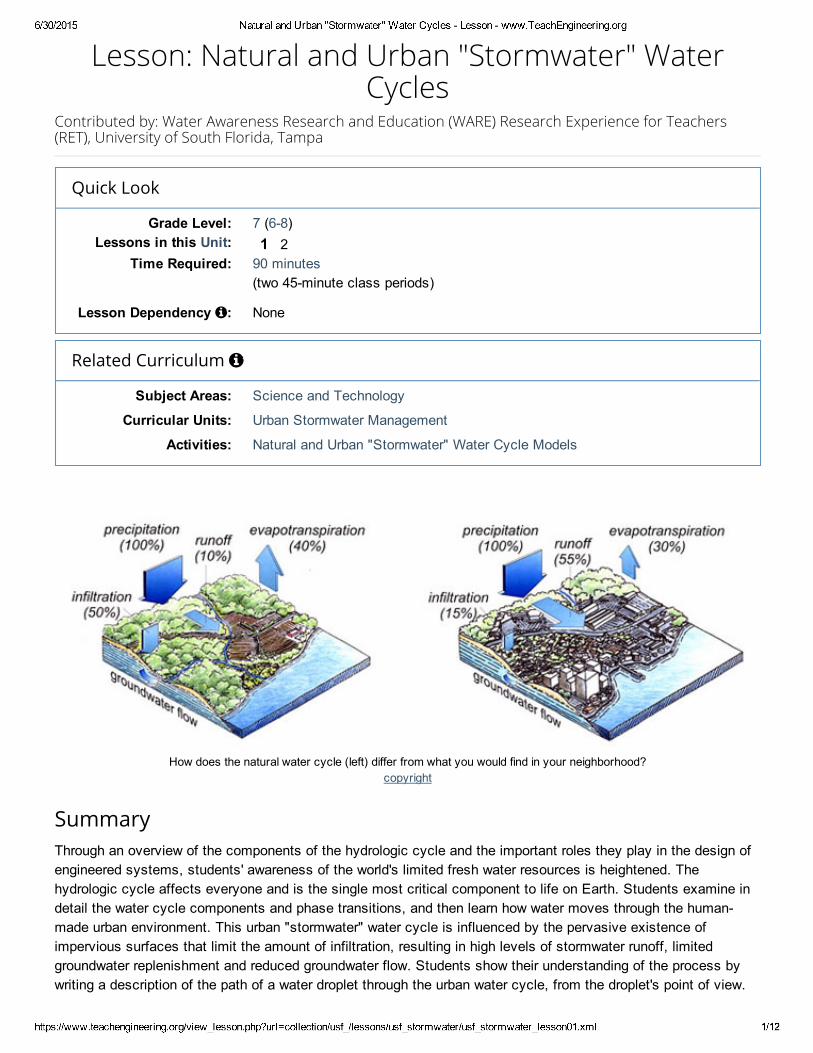
How does the natural water cycle (left) differ from what you would find in your neighborhood?copyright
SummaryThrough an overview of the components of the hydrologic cycle and the important roles they play in the design ofengineered systems, students' awareness of the world's limited fresh water resources is heightened. Thehydrologic cycle affects everyone and is the single most critical component to life on Earth. Students examine indetail the water cycle components and phase transitions, and then learn how water moves through the humanmade urban environment. This urban "stormwater" water cycle is influenced by the pervasive existence ofimpervious surfaces that limit the amount of infiltration, resulting in high levels of stormwater runoff, limitedgroundwater replenishment and reduced groundwater flow. Students show their understanding of the process bywriting a description of the path of a water droplet through the urban water cycle, from the droplet's point of view.

6/30/2015 Natural and Urban "Stormwater" Water Cycles Lesson www.TeachEngineering.org
https://www.teachengineering.org/view_lesson.php?url=collection/usf_/lessons/usf_stormwater/usf_stormwater_lesson01.xml 2/12
The lesson lays the groundwork for rest of the unit, so students can begin to think about what they might do tomodify the urban "stormwater" water cycle so that it functions more like the natural water cycle. A PowerPoint®presentation and handout are provided.
Engineering ConnectionThe hydrologic cycle is the central focus of hydrology. In fluid mechanics, the application of the basic principles ofmass, momentum and energy to a fluid flow system is accomplished with a control volume. A comprehensiveunderstanding of the hydrologic cycle is important for civil and environmental engineers who design criticalinfrastructure systems such as stormwater ponds, control structures, earthen dams, levies, treatment facilityinfluent and effluent; sheet, overland and channelized flows; and stream flow and base flow. They are responsibleto account for stormwater runoff, infiltration rates and treatment processes that occur as a result of the stochasticnature of storm events.
Educational Standards Florida: Science
International Technology and Engineering Educators Association: Technology
Montana: Science
Next Generation Science Standards: Science
Pre-Req KnowledgeA general understanding of the water cycle and its processes, and the concept of density.
Learning ObjectivesAfter this lesson, students should be able to:
Discuss the planet's limited freshwater resources.
Explain how water transforms from one phase to another within the natural water cycle.
Describe how humans affect the movement of water within the urban water cycle.
Explain how reaction rates and transformation processes are critical to engineering design.
Introduction/MotivationToday we will discuss the important role the water cycle plays in our everyday lives and how the urban"stormwater" water cycle is linked to civil and environmental engineering.
Do you usually hear our planet referred to as "planet Earth?" Why might we better describe our planet as "planetwater?" (Answer: Nearly threequarters of the Earth's surface is covered by water.)
Who can describe for me one of the steps in the water cycle? (Expect students to be able to identify several stepsfrom previous knowledge, such as evaporation, condensation, precipitation).
It is common for engineers to determine the rate of a reaction or what causes transformation processes to takeplace, for example, speed or velocity, flow rate, kinetics, biological reaction rates, chemical reaction rates.Engineers must know how fast or slow reactions are expected to take in order to correctly design systems.Examples of typical designs relating to the urban water cycle are drinking water treatment plants, wastewatertreatment plants and stormwater management facilities.
6/30/2015 Natural and Urban "Stormwater" Water Cycles Lesson www.TeachEngineering.org
https://www.teachengineering.org/view_lesson.php?url=collection/usf_/lessons/usf_stormwater/usf_stormwater_lesson01.xml 3/12
Today we will focus on understanding the parts of the water cycle, specifically focusing on the urban environment,the causes of transformations from one state to another, how to determine rates of reaction, and the flow of waterthrough the urban water cycle.
Lesson Background and Concepts for TeachersLesson Overview
Before the presenting the Natural and Urban "Stormwater" Water Cycle Presentation (a PowerPoint® file),distribute the Natural and Urban "Stormwater" Water Cycle Handout and instruct students to fill in theblanks in the left column, "Your Predictions," with what they know or their best guesses. Let students knowthat the class will discuss what they answered correctly and incorrectly, examining their preconceivednotions and what they learned.
As a class, go through the presentation using the handout, allowing adequate time for students to fill in theright column, "From the Presentation." Use the slide narration for the presentation, provided below.
At the conclusion of the presentation, discuss with the class the assumptions they made, what theyanswered correctly and what they answered incorrectly and why.
After a detailed explanation of the urban water cycle, assign students the RAFT project described in theAssessment section. For this project, students take on the role of a travel magazine journalist as theydescribe the journey through the urban water cycle from a water droplet's point of view.
Slide Narration for Natural and Urban "Stormwater" Water Cycles Presentation
(Slide 1) Our planet is covered by nearly 71% water, so why do we call it "planet Earth?" Why not "planet water?"(This question gets students thinking about water." From where does all this water come? Some scientists think itcame from comets during the late heavy bombardment period, approximately 3.8 to 4.1 billion years ago, a periodwhen the Earth, our moon and neighboring planets were slammed by an unusually large number of asteroids andcomets. One theory, called the "Nice (say 'neece') model," proposes that the gas giant planets of Jupiter, Saturn,Uranus and Neptune swapped orbital paths, forcing objects contained within the asteroid belt to propel towards theterrestrial planets.
(Slide 2) How much water is that? The total volume of water on Earth is estimated at 1,386,984,610 km or 366.1quintillion gallons (18 zeros), fresh water 35,029,210 km or 9.3 quintillion gallons (18 zeros), groundwater10,530,000 km or 2.7 quintillion gallons (18 zeros), surface and atmosphere 12,900 km or 3.4 quadrillion gallons(15 zeros). (Chow, 1998) (If desired, give students time to do conversions from km to gallons.)
The volume of water that goes over Niagara Falls every second is 750,000 gallons. It would take more than 15billion years for that amount of water to go over the Niagara Falls! (From these numbers, students begin to graspthe enormous quantity of water that makes up our world.) We then must ask the question, is this enough water foreveryone, and how much of this water is available to drink?
(Slide 3) How much of that water is available to drink and what portion of drinkable water is part of the watercycle? Generally, we estimate the quantities of water in various forms on Earth to be: 96.5% in the oceans 96.5%and 2.5% as fresh water. Of that fresh water, 1.7% is trapped as polar ice, 0.76% is fresh groundwater, and 0.1%is in the planet's surface and atmosphere. (Chow, 1988)
How many gallons for each person per day? Fresh groundwater sources (0.76%) equate to 391 million gallons perperson per year or enough water to fill 521 Olympic sized swimming pools. This is about 1.1 million gallons perperson per day. However, groundwater sources are not evenly distributed around the world, which leaves us withsurface and atmospheric water as the accessible sources of drinking water. When we investigate these numbers,we find that the volume of surface and atmospheric water is approximately 479,300 gallons per person per year or1,313 gallons per person per day.
3
3
3 3
3

6/30/2015 Natural and Urban "Stormwater" Water Cycles Lesson www.TeachEngineering.org
https://www.teachengineering.org/view_lesson.php?url=collection/usf_/lessons/usf_stormwater/usf_stormwater_lesson01.xml 4/12
Assuming that only 10% of the water evaporated over water makes it onto land, this means approximately 131gallons per person per day are available. The average American uses 100 gallons of water per day. And thatdoesn't count the great amounts of water used by industry to produce clothing, electricity, food and products, andthe estimated growth of the future population of the planet. Do you see the water crisis?
Yes, a global water crisis exists, as well as disparity between global drinking water resources and people who donot have access to safe drinking water and sanitation services. The global water crisis will only increase withpopulation growth. It will take innovative thinkers, scientists and engineers to solve these grand challenges.
(Slide 4) When we turn on the faucet, water always comes out. But how does it get there and how do we knowthat it is safe to drink? Civil and environmental engineers design systems to move this water from surface waterand groundwater sources to water treatment facilities and then to our homes. It is their job to provide qualitydrinking water, assuring our health and safety, and a sufficient quantity of water.
(Slide 5) Civil and environmental engineers use the rates of reaction to design treatment systems and mustunderstand the phase transformation occurring as a result of the reaction, in order to provide water that is safe todrink and release back into nature. As an engineering example, denitrification, the transformation of nitrate (NO , afertilizer) to nitrogen gas (N , 78% of atmosphere) is a critical component in the design and management ofwastewater treatment systems.
(Slide 6) Like everything on Earth, the water cycle owes its existence to the sun. The heat from the sun providesenergy that drives the water cycle. What are the different components of the natural water cycle? (Answers:Evaporation, condensation, precipitation, infiltration, stormwater runoff, groundwater flow, plant uptake,transpiration. Note: The slide is animated so each mouse click reveals another answer.)
What are the different phases before and after each of these listed phases? (Listen to student descriptions andcorrect as necessary.) What part of the water cycle creates the clouds that we see in the sky? (Condensation)What is the water cycle phase that happens before condensation? (Evaporation) And what phase(s) may occurafter a cloud is formed? This one is kind of tricky; a water molecule may evaporate again or fall from the sky asrain or precipitation. This is a good example of why we call the movement of water from one phase to another awater cycle, because it continuously cycles around and around with no defined beginning or end.
Diagram of the hydrologic cycle.
3
2

6/30/2015 Natural and Urban "Stormwater" Water Cycles Lesson www.TeachEngineering.org
https://www.teachengineering.org/view_lesson.php?url=collection/usf_/lessons/usf_stormwater/usf_stormwater_lesson01.xml 5/12
copyright
(Slide 7) Evaporation is when water changes from a liquid to a gas (water vapor). By definition, the water cyclehas no beginning or end, but if we were going to pick a place to start, evaporation would be a good place. Thesun's energy breaks the bonds that hold water molecules together, transforming it from a liquid to a gaseousphase. Net evaporation occurs when the rate of evaporation exceeds the rate of condensation.
(Slide 8) Condensation is when water vapor changes from its gaseous state (vapor) to the liquid phase. As watervapor rises into the atmosphere, it begins to condense as a result of the lower temperatures encountered at higherelevations where atmospheric pressure is less. When the temperature drops below the dewpoint temperature, netcondensation occurs, which means that the rate of condensation exceeds the rate of evaporation. As a result ofnet condensation, clouds form.
(It may be a challenge to relate the idea that air higher in the atmosphere weighs less than air at the groundsurface. Mention the following examples.) Have you ever flown in a plane? Do you remember feeling the pressurechange when you went up and then again as you went down? This change in pressure is a result of the weight ofthe atmosphere at different elevations. Have you ever dived to the bottom of a pool and felt the pressure changein your ears. This is due to the weight of water, causing an increase in pressure. (After students begin tounderstand the concept of pressure with change in elevation and how it relates to density, move on, asking thenext question.)
A large cumulonimbus cloud can weigh as much as a 747 jumbo jet. So why does it not come crashing down tothe ground? (Answer: The rising air responsible for the cloud formation keeps the cloud floating in the air becausethe air below the cloud is denser than the cloud.)
Moisture in warm air changes to liquid phase as a result of condensation. For example, think of the droplets thatform on the side of the glass of your favorite iced drink on a hot day. Likewise, if airplane exhaust contains watervapor, and if the air is very cold (which it often is at high altitudes), then the water vapor in the exhaust"condenses out," resulting in what we call contrails—those white streams we see behind a plane's path in the sky.It is anecdotally believed that if contrails disappear quickly or do not even form, continuing good weather can beexpected. On days when these contrails persist and remain in the sky, a change in the weather pattern may beexpected.
(Slide 9) Precipitation is condensed water vapor that falls to Earth as rain, snow or hail. It is theorized that watermolecules (drops, 10 microns to 5 mm in size) combine with tiny dust, salt and particulate matter (~2.5 microns)that act as a nucleus to form cloud droplets that develop into clouds.
If you look closely at a cloud you can see some parts disappearing (evaporating) while other parts are growing(condensation). Most of the condensed water in clouds does not fall as precipitation because the fall speed is notlarge enough to overcome updrafts that support the clouds.
Water droplets may grow as a result of additional condensation of water vapor when the particles collide. If enoughcollisions occur to produce a droplet with a fall velocity that exceeds the cloud updraft speed, then it falls out ofthe cloud as precipitation. This is not a trivial task since millions of cloud droplets are required to produce a singleraindrop. When the evaporation rate is less than the condensation rate, a droplet can grow into a cloud drop.
(Slide 10) Infiltration is the movement of water into the media layer. Media layers consist of sand, soil, and/ororganic matter (such as dirt). Factors affecting infiltration rate are: the intensity and duration of a storm event(precipitation), directly connected impervious areas (DCIA, impervious surfaces that are connected to each otherwithout any pervious separation), vegetative land cover and percolation rate. Percolation is the movement ofwater within the media layer. Factors affecting percolation rate are gravity, grain size, geological formations, depthto groundwater table and the infiltration rate of the surrounding soil. The percolation rate controls the infiltration rateby limiting the flow of above ground water into the media layer.
(Slide 11) Stormwater runoff is the flow of rainwater that occurs as a result of the precipitation rate exceeding
6/30/2015 Natural and Urban "Stormwater" Water Cycles Lesson www.TeachEngineering.org
https://www.teachengineering.org/view_lesson.php?url=collection/usf_/lessons/usf_stormwater/usf_stormwater_lesson01.xml 6/12
the soil infiltration and percolation rate. Stormwater runoff also occurs as a result of impervious surfaces, such asroofs, roads and sidewalks. This excess water flows over the land and impervious surfaces into stormwatersewers and then into stormwater ponds, affecting our ecosystems. Stormwater runoff picks up everything(particulates, nutrients, heavy metals) that settles onto the roofs, roads, sidewalks, grass and any other outdoorsurfaces. This process creates a place where all the pollution from our environment collects and is an example ofhow humans have changed the flow of water as a result of urbanization.
(Slide 12) As stormwater infiltrates and then percolates into the ground, it begins to contribute to groundwaterflow. Groundwater flow is the lateral or horizontal flow of water beneath the ground surface. Groundwater levelsare typically the surface level at which you can see water in a lake or the level of a well. Water is recharged(replenished) to the groundwater system by percolation of water from precipitation that flows to streams and lakes,and into the groundwater table.
(Slide 13) Plant uptake is the process of plants absorbing water and nutrients in order to grow. Plants use theenergy from the sun (photosynthesis) to transform inorganic nutrients into organic aboveground and belowgroundbiomass. Aboveground biomass uptake begins in spring, peaks in midsummer, and is very minimal in fall andwinter months. A good example of the rate of biomass formation is to think about how often you need to cut thegrass in the summer vs. winter.
(Slide 14) Transpiration the process by which plants release water into the air. Transpiration is defined as thewater lost from the surface media and groundwater due to plant uptake. Plant roots draw water and nutrients intothe stems and leaves through plant uptake. Plants then transpire this water into the atmosphere, which is similarto breathing. To conserve water in the dry season, plants drop their leaves, essentially eliminating transpirationand the growth of the plant.
As an engineering example, a concentration gradient between the moisture inside the plants and the moisture inthe atmosphere and capillary action drives the transpiration rate from plant uptake to evaporation. Plants utilizethis transformation process to cycle inorganic nutrients into organic biomass, hence growing and removing heatgenerated from the photosynthesis process.
Transpiration rate examples: An acre of corn gives off about 11,40015,100 liters (or 3,0004,000 gallons) of watereach day, and a large oak tree can transpire 151,000 liters (or 40,000 gallons) per year. (USGS, 2013) (If desired,give students time to do conversions from liters to gallons.)
(At this point, have students compare their predicted worksheet answers to the correct answers. Lead a classdiscussion to share observations, examine preconceived notions, recognize any erroneous assumptions andreflect on what they learned.)
6/30/2015 Natural and Urban "Stormwater" Water Cycles Lesson www.TeachEngineering.org
https://www.teachengineering.org/view_lesson.php?url=collection/usf_/lessons/usf_stormwater/usf_stormwater_lesson01.xml 7/12
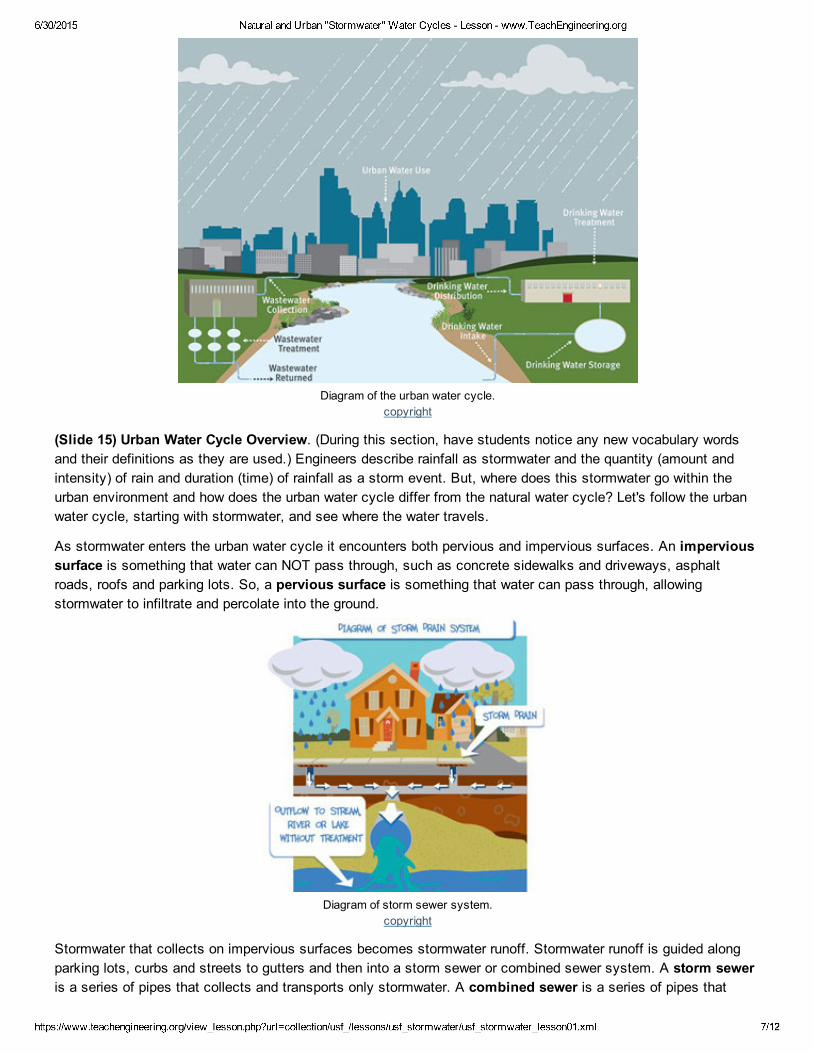
Diagram of the urban water cycle.copyright
(Slide 15) Urban Water Cycle Overview. (During this section, have students notice any new vocabulary wordsand their definitions as they are used.) Engineers describe rainfall as stormwater and the quantity (amount andintensity) of rain and duration (time) of rainfall as a storm event. But, where does this stormwater go within theurban environment and how does the urban water cycle differ from the natural water cycle? Let's follow the urbanwater cycle, starting with stormwater, and see where the water travels.
As stormwater enters the urban water cycle it encounters both pervious and impervious surfaces. An impervioussurface is something that water can NOT pass through, such as concrete sidewalks and driveways, asphaltroads, roofs and parking lots. So, a pervious surface is something that water can pass through, allowingstormwater to infiltrate and percolate into the ground.
Diagram of storm sewer system.copyright
Stormwater that collects on impervious surfaces becomes stormwater runoff. Stormwater runoff is guided alongparking lots, curbs and streets to gutters and then into a storm sewer or combined sewer system. A storm seweris a series of pipes that collects and transports only stormwater. A combined sewer is a series of pipes that

6/30/2015 Natural and Urban "Stormwater" Water Cycles Lesson www.TeachEngineering.org
https://www.teachengineering.org/view_lesson.php?url=collection/usf_/lessons/usf_stormwater/usf_stormwater_lesson01.xml 8/12
collects and transports stormwater and wastewater. Combined sewers are common in several of the oldest U.S.cities such as New York, Boston and Chicago. However, newer cities such as Tampa, Austin, Asheville, SanDiego, Portland and Seattle do not have combined sewers.
Stormwater runoff that enters a storm sewer system is transported to surface water collection areas. Surfacewater may include stormwater ponds, rivers, lakes, estuaries, bays, dams, wetlands, canals, levies, oceans orGulf Coast areas.
Water is extracted from surface water systems and groundwater sources by drinking water facilities to produce theclean water that comes out of our sink faucets and shower heads, and fills our washing machines, dishwashersand toilets. But where does this water go when it leaves our homes?
The water that leaves our homes is typically classified as wastewater and enters into a combined sewer systemor a sanitary sewer system. A sanitary sewer collects only wastewater and does not include stormwater. Bothsanitary and combined sewer systems travel under the urban environment as part of the urban infrastructure,transporting our wastewater to a wastewater treatment facility. Here, water is cleaned/treated and released backinto the surface water collection systems or used for irrigation, often on city property.
By contrast, the natural water cycle is free of humanmade objects and infrastructure, and is mostly composed ofpervious surfaces. These pervious surfaces promote infiltration, resulting in high levels of groundwater recharge(absorption or replenishment) and groundwater flow when compared to stormwater runoff.
(Slide 16) Urban Water Cycle RAFT Assignment. Explain to students the assignment, as described on the slideand in the Assessment section: To take on the role of a travel magazine journalist as they describe the journeythrough the urban water cycle from a water droplet's point of view.
Vocabulary/Definitionscombined sewer:A series of pipes that collects and transports stormwater and wastewater.condensation: The process in which water vapor changes from a gaseous state (vapor) to the liquid phase.directlyconnectedimperviousareas:
Impervious surfaces that are connected to each other without any pervious separation.Examples: Driveway to road, gutter to storm sewer. Abbreviated as DCIA.
evaporation: The process in which water changes from liquid to a gas or vapor.groundwaterflow:
A lateral or horizontal flow of water beneath the ground surface.
impervioussurface:
A surface that water can NOT pass through.
infiltration: The movement of water into the media layer.media layer: A mix of inorganic and/or organic earth materials, such as sand, soil, mulch, compost, gravel.percolation: The movement of water within a media layer.pervioussurface:
A surface that water can pass through.
plant uptake: The process of plants absorbing water and nutrients in order to grow.precipitation: Condensed water vapor that falls to Earth as rain, snow or hail.reaction rate: The speed of a reaction; how fast or slow a reaction takes place.sanitary sewer: A series of pipes that collects and transports only wastewater and does not include stormwater.stochastic: Unpredictable nature of storm events; random.storm duration: The length of a storm (in hours).
storm intensity: The rate of rainfall (in inches per hour).storm sewer: A series of pipes that collects and transports only stormwater.surface water: Water that is contained by stormwater ponds, rivers, lakes, estuaries, bays, dams, wetlands,

6/30/2015 Natural and Urban "Stormwater" Water Cycles Lesson www.TeachEngineering.org
https://www.teachengineering.org/view_lesson.php?url=collection/usf_/lessons/usf_stormwater/usf_stormwater_lesson01.xml 9/12
oceans or Gulf Coast areas.transpiration: A process by which plants release water into the air.urbaninfrastructure:
A structure or system that supports the urban environment. Examples: Roads, bridges, buildings,water distribution, sanitary and storm sewers, stormwater pond, electricity transmission lines,cable and internet.
wastewater: Water that exits your home through a drain.
Associated ActivitiesNatural and Urban "Stormwater" Water Cycle Models Students experiment with both the natural and urban"stormwater" water cycle models to develop and test hypotheses on how human development impacts theflow of stormwater runoff. They use the models to predict allocation of flow for different storm eventdurations and intensities. The water model device is made in advance by the teacher, basically using six 2liter plastic bottles.
Lesson ClosureThe world population is currently 7.2 billion (as of May 2014) and is not equally distributed around freshwaterresources. If our planet had equal distribution of freshwater resources, it is estimated that each person would haveaccess to 131 gallons per person per day. The average American uses 100 gallons of water per day, however wemust consider water used by industries, for example, the manufacturing of 1 gallon of milk uses 1,000 gallons ofwater. If the world's population reaches 9 billion by 2050, do we have a global water crisis, and what will you doabout it? (Example answer: Yes, a global water crisis exists, as well as a disparity between global drinking waterresources and people who do not have access to safe drinking water and sanitation services. The global watercrisis will only increase with population growth. It will take innovative thinkers, scientist and engineers to solvethese grand challenges.)
What is a sustainable source of drinking water? Is there enough water for everyone? (Answer; A water source thatmeets internationally recognized water quality standards, is accessible and/or delivered to a home or dwelling, ofsufficient quantity and constant pressure, and doesn't negatively affect surrounding ecosystems is recognized asa sustainable source of drinking water. No, there is no enough water for everyone; there is a global water crisis)
AttachmentsNatural and Urban "Stormwater" Water Cycle Presentation (pptx)
Natural and Urban "Stormwater" Water Cycle Presentation (pdf)
Natural and Urban "Stormwater" Water Cycle Handout (docx)
Natural and Urban "Stormwater" Water Cycle Handout (pdf)
Natural and Urban "Stormwater" Water Cycle Handout Answer Key (docx)
Natural and Urban "Stormwater" Water Cycle Handout Answer Key (pdf)
AssessmentPreLesson Assessment
Predictions: Hand out the Natural and Urban "Stormwater" Water Cycle Handout and give students time to write intheir known answers or best guesses under the "Your Predictions" column.
Questions: As a class, ask students the following questions to gauge their baseline understanding of the naturalwater cycle and its transformative phases:
6/30/2015 Natural and Urban "Stormwater" Water Cycles Lesson www.TeachEngineering.org
https://www.teachengineering.org/view_lesson.php?url=collection/usf_/lessons/usf_stormwater/usf_stormwater_lesson01.xml 10/12
Can you name and describe the different parts that make up the water cycle? (Answers may include but arenot limited to: Evaporation is when water changes from liquid to gas phase; condensation is when watervapor changes from gas to a liquid phase; precipitation is condensed water vapor that falls to the Earth asrain, snow or hail. Tell students that this will be covered in more detail in the lesson presentation.)
How does the water cycle transform from one phase to another, and are these phases connected? (Answer:All phases within the water cycle are connected to one or more phases, for instance, water condenses inthe atmosphere to create precipitation, and precipitation creates stormwater runoff that can be taken up byplants, transpirated, infiltrated or evaporated back into the atmosphere. One phase transforms to the otherby following the physical, chemical and biological processes of our natural and urban environment. Forexample: When a material changes phase, say from liquid to solid, or gaseous to liquid, energy is eitherreleased [exothermic reaction, that is, fuel combustion] or absorbed [endothermic reaction, that is, melting,boiling, evaporation, a chemical reaction that absorbs heat from its environment]. This is why you cool offwhen water evaporates from your skin.)
Lesson Embedded Assessment
Presentation/Handout: Use the Natural and Urban "Stormwater" Water Cycle Presentation to provide the class withan overview of fresh drinking water supplies, the phases within the water cycle and how understanding the watercycle is critical for water resources engineering design. During the slide presentation, have students complete thesecond column, "From the Presentation," on the Natural and Urban "Stormwater" Water Cycle Handout. Atpresentation end, have students compare their preassessment predictions to the correct answers and discusstheir preconceived notions and assumptions as a class. Then move on to explain the urban water cycle andpresent students with the RAFT assignment.
PostLesson Assessment
RAFT Assignment: An acronym for role, audience, format and topic, RAFT is an approach to creating imaginativeand interpretive student projects through varied viewpoints for specific audiences in order to aid in students'processing of ideas and information. For this project, students take on the role of a travel magazine journalist asthey describe the journey through the urban water cycle from a water droplet's point of view. Provide students withthe guidance below. Review their writings to gauge their depth of comprehension of the facts and concepts relatedto the urban "stormwater" water cycle.
You are a travel magazine journalist for Urban Environment Weekly.
Your assignment this week is to follow the life of a drop of water as it makes its way through the urbanenvironment.
In your article, include all the descriptive details of whom the drop met and what it encountered along theway.
(Answer: Expect students' creative descriptions to generally follow this sequence of events: Water is drawn fromnatural surface water sources > cleaned at drinking water facility > delivered to homes via water pipes > leaveshomes as wastewater > collected via sewer system > cleaned at water treatment facility > released into surfacewater collection systems or used for irrigation. Expect them to incorporate new vocabulary words and/or theirconcepts related to the urban water cycle: impervious surface, pervious surface, storm sewer, combined sewer,surface water, wastewater, sanitary sewer, urban infrastructure, as well as words and concepts related to thenatural water cycle.)
Additional Multimedia SupportAn alternate (and better) diagram for the urban water cycle may be found athttp://www.pacificwater.org/pages.cfm/waterservices/waterdemandmanagement/waterdistribution/thewatercycle.html.

6/30/2015 Natural and Urban "Stormwater" Water Cycles Lesson www.TeachEngineering.org
https://www.teachengineering.org/view_lesson.php?url=collection/usf_/lessons/usf_stormwater/usf_stormwater_lesson01.xml 11/12
A comprehensive interactive urban water cycle diagram may be found at SEQ Healthy Waterways Partnership athttp://www.healthywaterways.org/map.htm.
A great online source for weather data is Weather Underground at http://www.wunderground.com.
Learn the current world human population size at the Worldommeters website athttp://www.worldometers.info/worldpopulation/.
ReferencesChow, V. T., Maidment, D. R., and Mays, L. W. Applied Hydrology. New York, NY: McGrawHill, 1988.
Harrison, J. T. (1996). Managing wastewater in coastal urban areas – Natural Resources Council. OceanDevelopment and International Law, 27(4), 413415.
Hsieh, C. H., and Davis, A. P. (2005). Evaluation and optimization of bioretention media for treatment of urbanstorm water runoff. Journal of Environmental EngineeringASCE, 131(11), 15211531. doi: 10.1061/(asce)07339372(2005)131:11(1521)
Hsieh, C. H., Davis, A. P., and Needelman, B. A. (2007). Nitrogen removal from urban stormwater runoff throughlayered bioretention columns. Water Environment Research, 79(12), 24042411. doi: 10.2175/106143007x183844
Hunt, W. F., Smith, J. T., Jadlocki, S. J., Hathaway, J. M., and Eubanks, P. R. (2008). Pollutant removal andpeak flow mitigation by a bioretention cell in urban Charlotte, NC. Journal of Environmental EngineeringASCE,134(5), 403408. doi: 10.1061/(asce)07339372(2008)134:5(403)
Li, Houng, and Davis, Allen P. (2008). Urban particle capture in bioretention media. II: Theory and modeldevelopment. Journal of Environmental EngineeringASCE, 134(6), 419432. doi: 10.1061/(asce)07339372(2008)134:6(419)
Niagara Falls Facts and Information. Last updated 2012. Amazing Niagara Facts, Delaware North CompaniesParks and Resorts, Inc., Niagara Falls, NY. Accessed March 5, 2013.http://www.niagarafallsstatepark.com/AmazingFacts.aspx
Nice model. Last updated August 17, 2013. In Wikipedia, The Free Encyclopedia. Accessed March 5, 2013.http://en.wikipedia.org/wiki/Nice_model
U.S. Geological Survey. "The Water Cycle: Transpiration." WaterScience School. Accessed March 5 2013.http://ga.water.usgs.gov/edu/watercycletranspiration.html
ContributorsRyan Locicero, Maya Trotz, Krysta Porteus, Jennifer Butler, William Zeman, Brigith Soto
Copyright© 2014 by Regents of the University of Colorado; original © 2013 University of South Florida
Supporting ProgramWater Awareness Research and Education (WARE) Research Experience for Teachers (RET), University of SouthFlorida, Tampa
Acknowledgements

6/30/2015 Natural and Urban "Stormwater" Water Cycles Lesson www.TeachEngineering.org
https://www.teachengineering.org/view_lesson.php?url=collection/usf_/lessons/usf_stormwater/usf_stormwater_lesson01.xml 12/12
This curriculum was developed by Water Awareness Research and Education (WARE) Research Experience forTeachers (RET) at the University of South Florida, funded by National Science Foundation grant number EEC1200682. However, the contents do not necessarily represent the policies of the NSF, and should not be assumedan endorsement by the federal government.
This material is based upon work supported by the Tampa Bay Estuary Program and the Southwest Florida WaterManagement District. Any opinions, findings, and conclusions or recommendations expressed in this material arethose of the authors and do not necessarily reflect the views of the funding agencies.
Last modified: June 30, 2015