Lesson 3-5: Making Predictions with Linear Regression · 10/3/2018 · Lesson 3-5: Making...
7
IB Math Studies Yr 1 Name_________________________________ Date: ____________ Lesson 3-5: Making Predictions with Linear Regression Learning Goals: #1: How do we use the line of best fit to make predictions about our data? #2: How do we determine if a given data value is reliable or unreliable? Warm-up: Ten students were given two tests, one on Mathematics and one on English. The table shows the results of the tests for each of the ten students. Student A B C D E F G H I J Mathematics (x) 8.6 13.4 12.8 9.3 1.3 9.4 13.1 4.9 13.5 9.6 English (y) 33 51 30 48 12 23 46 18 36 50 (a) Calculate the mean of the Mathematics tests. (b) Calculate the mean of the English tests. (c) Calculate the standard deviation of the Mathematics tests, correct to two decimal places. (d) Calculate the correlation coefficient, and describe what this means in terms of the math test scores and english test scores. (e) Calculate the equation of the line of best fit. **HOW DO WE MAKE A PREDICTION WITH A LINEAR REGRESSION?** (f) Use your regression line from part (e) to estimate a score on the English test when a student scores a 7 on the Mathematics test.
Transcript of Lesson 3-5: Making Predictions with Linear Regression · 10/3/2018 · Lesson 3-5: Making...

IB Math Studies Yr 1
Name_________________________________
Date: ____________
Lesson 3-5: Making Predictions with Linear Regression
Learning Goals:
#1: How do we use the line of best fit to make predictions about our data? #2: How do we determine if a given data value is reliable or unreliable?
Warm-up: Ten students were given two tests, one on Mathematics and one on English.
The table shows the results of the tests for each of the ten students.
Student A B C D E F G H I J
Mathematics (x) 8.6 13.4 12.8 9.3 1.3 9.4 13.1 4.9 13.5 9.6
English (y) 33 51 30 48 12 23 46 18 36 50
(a) Calculate the mean of the Mathematics tests.
(b) Calculate the mean of the English tests.
(c) Calculate the standard deviation of the Mathematics tests, correct to two decimal places.
(d) Calculate the correlation coefficient, and describe what this means in terms of the math test scores and english test
scores.
(e) Calculate the equation of the line of best fit.
**HOW DO WE MAKE A PREDICTION WITH A LINEAR REGRESSION?**
(f) Use your regression line from part (e) to estimate a score on the English test when a student scores a 7 on the
Mathematics test.
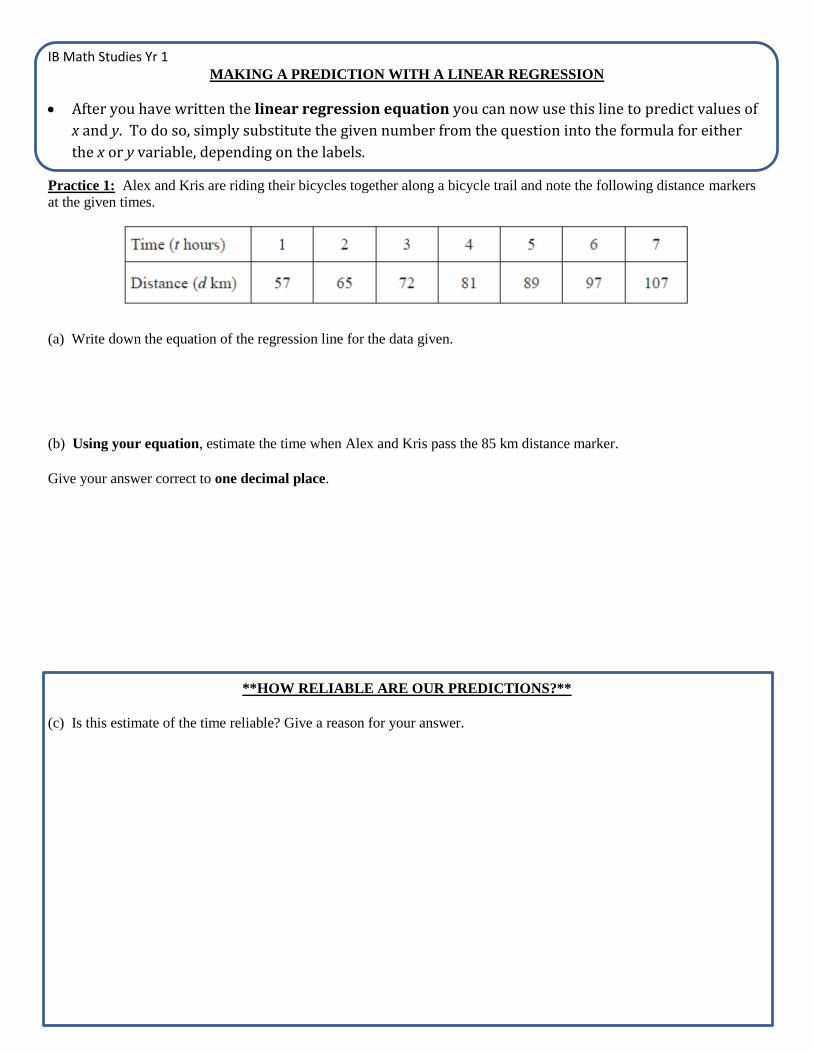
IB Math Studies Yr 1 MAKING A PREDICTION WITH A LINEAR REGRESSION
After you have written the linear regression equation you can now use this line to predict values of
x and y. To do so, simply substitute the given number from the question into the formula for either
the x or y variable, depending on the labels.
Practice 1: Alex and Kris are riding their bicycles together along a bicycle trail and note the following distance markers at the given times.
(a) Write down the equation of the regression line for the data given.
(b) Using your equation, estimate the time when Alex and Kris pass the 85 km distance marker.
Give your answer correct to one decimal place.
**HOW RELIABLE ARE OUR PREDICTIONS?**
(c) Is this estimate of the time reliable? Give a reason for your answer.
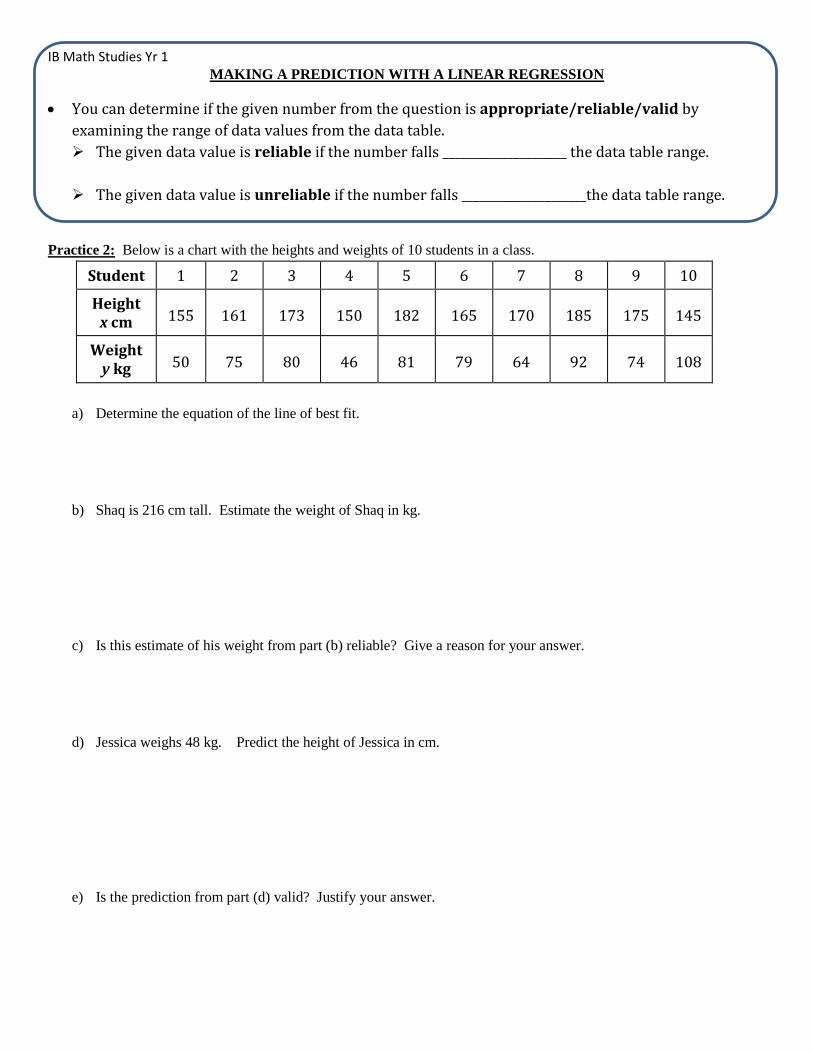
IB Math Studies Yr 1 MAKING A PREDICTION WITH A LINEAR REGRESSION
You can determine if the given number from the question is appropriate/reliable/valid by
examining the range of data values from the data table.
The given data value is reliable if the number falls _____________________ the data table range.
The given data value is unreliable if the number falls _____________________the data table range.
Practice 2: Below is a chart with the heights and weights of 10 students in a class.
Student 1 2 3 4 5 6 7 8 9 10
Height x cm 155 161 173 150 182 165 170 185 175 145
Weight y kg 50 75 80 46 81 79 64 92 74 108
a) Determine the equation of the line of best fit.
b) Shaq is 216 cm tall. Estimate the weight of Shaq in kg.
c) Is this estimate of his weight from part (b) reliable? Give a reason for your answer.
d) Jessica weighs 48 kg. Predict the height of Jessica in cm.
e) Is the prediction from part (d) valid? Justify your answer.
IB Math Studies Yr 1
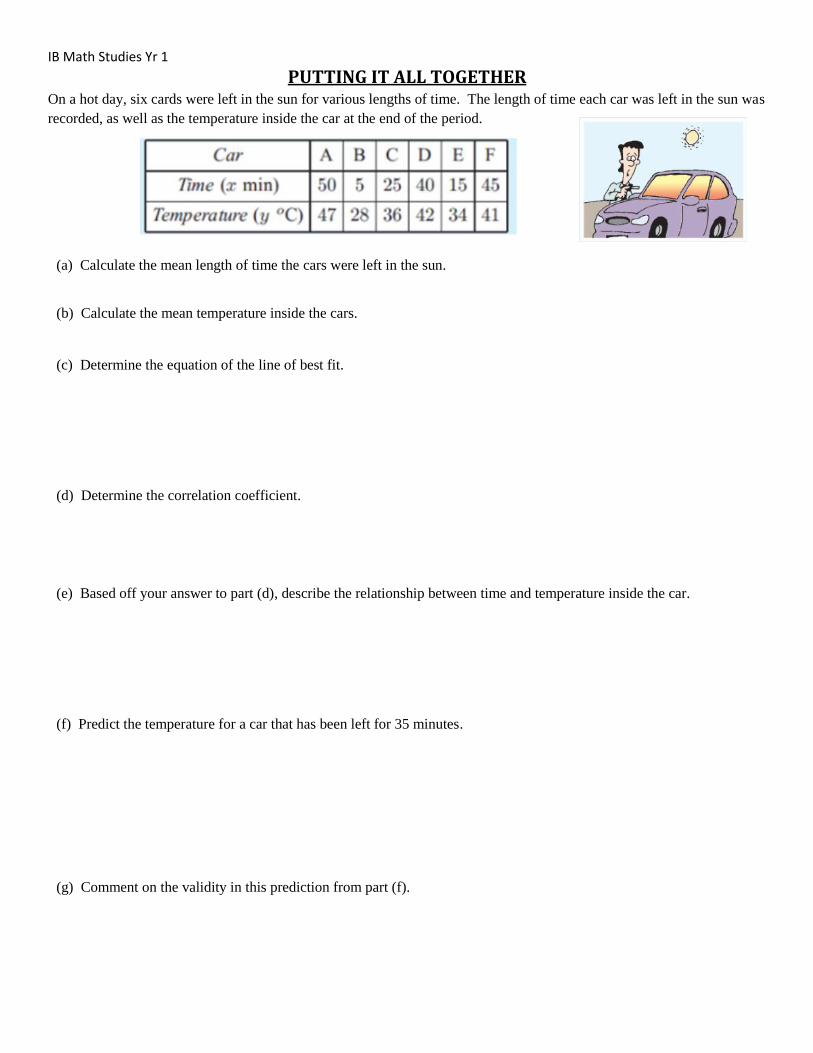
PUTTING IT ALL TOGETHER On a hot day, six cards were left in the sun for various lengths of time. The length of time each car was left in the sun was
recorded, as well as the temperature inside the car at the end of the period.
(a) Calculate the mean length of time the cars were left in the sun.
(b) Calculate the mean temperature inside the cars.
(c) Determine the equation of the line of best fit.
(d) Determine the correlation coefficient.
(e) Based off your answer to part (d), describe the relationship between time and temperature inside the car.
(f) Predict the temperature for a car that has been left for 35 minutes.
(g) Comment on the validity in this prediction from part (f).

IB Math Studies Yr 1 Name_____________________________
Date _____________________________
Lesson 3-5: Homework
1. Fifteen students were weighed, and their pulse rates were measured
a. Create a scatter plot for the information given on the separate graph paper (page 3).
b. Determine the mean point. Plot this point and label it M on the scatter diagram.
c. Sketch a suitable line of best fit.
d. Write down the correlation coefficient, and describe the relationship between weight and pulse rate.
e. Determine the equation of the line of best fit.
f. Use your line to predict the weight of someone who has a pulse of 72 beats per minute.
g. Comment on the reliability in this prediction from part (f).
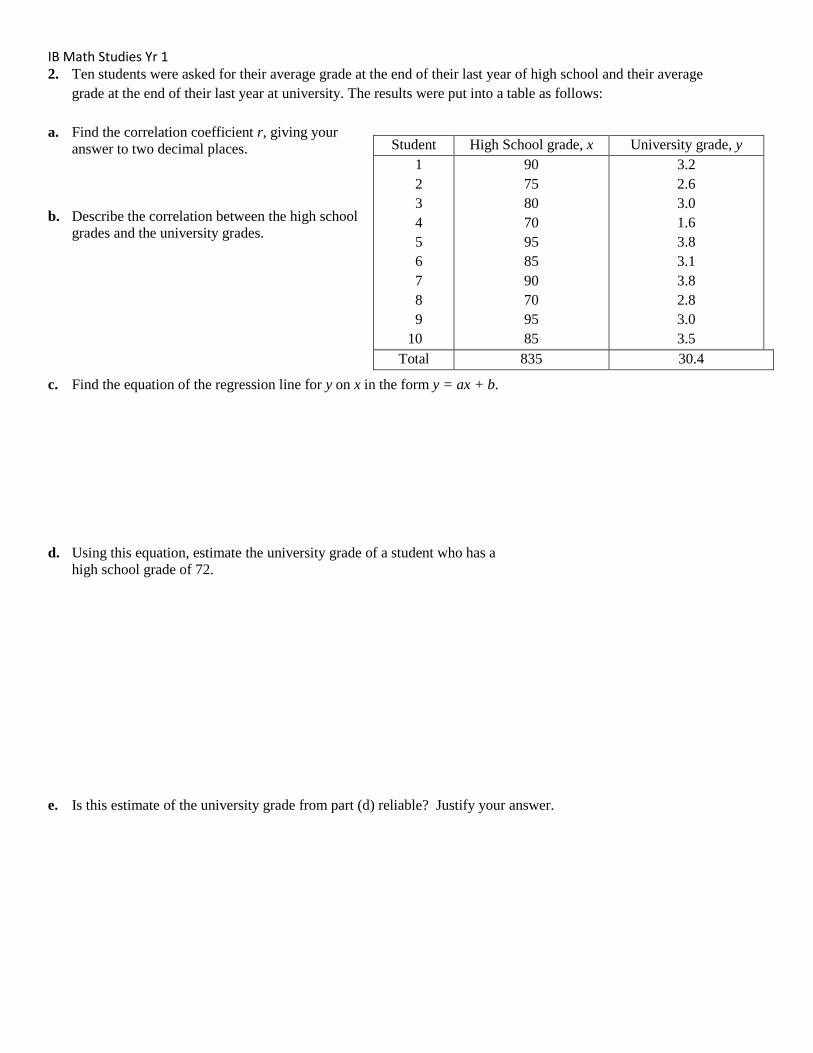
IB Math Studies Yr 1 2. Ten students were asked for their average grade at the end of their last year of high school and their average
grade at the end of their last year at university. The results were put into a table as follows:
a. Find the correlation coefficient r, giving your
answer to two decimal places.
b. Describe the correlation between the high school
grades and the university grades.
c. Find the equation of the regression line for y on x in the form y = ax + b.
d. Using this equation, estimate the university grade of a student who has a
high school grade of 72.
e. Is this estimate of the university grade from part (d) reliable? Justify your answer.
Student High School grade, x University grade, y
1
2
3
4
5
6
7
8
9
10
90
75
80
70
95
85
90
70
95
85
3.2
2.6
3.0
1.6
3.8
3.1
3.8
2.8
3.0
3.5
Total 835 30.4

IB Math Studies Yr 1