Lesson 1 – Introduction to Functions - WordPress.com 12, 2014 · Lesson 1 – Introduction to...
26
Page 1 Lesson 1 – Introduction to Functions Throughout this class, we will be looking at various Algebraic Functions and the characteristics of each. Before we begin, we need to review the concept of what a Function is and look at the rules that a Function must follow. We also need to investigate the different ways that we can represent a Function. It is important that we go beyond simple manipulation and evaluation of these Functions by examining their characteristics analyzing their behavior. Looking at the Functions modeled as Graphs, Tables and Sets of Ordered Pairs is critical to accomplishing that goal. Lesson Topics: Section 1.1 What is a function? Definition of function Independent and Dependent Variables Section 1.2 Multiple Representations of Functions Sets of ordered pairs (input, output) Tables Graphs Vertical Line Test Behavior of Graphs Section 1.3 Function Notation Function evaluation Working with input and output Multiple Representations Graphs and tables with a graphing calculator Section 1.4 Domain and Range Definitions Multiple Representations Restricting Domain and Range (calculator) Section 1.5 Applications of Functions Criteria for a good graph Practical Domain and Range
Transcript of Lesson 1 – Introduction to Functions - WordPress.com 12, 2014 · Lesson 1 – Introduction to...

Page 1
Lesson 1 – Introduction to Functions Throughout this class, we will be looking at various Algebraic Functions and the characteristics of each. Before we begin, we need to review the concept of what a Function is and look at the rules that a Function must follow. We also need to investigate the different ways that we can represent a Function. It is important that we go beyond simple manipulation and evaluation of these Functions by examining their characteristics analyzing their behavior. Looking at the Functions modeled as Graphs, Tables and Sets of Ordered Pairs is critical to accomplishing that goal. Lesson Topics:
Section 1.1 What is a function?
§ Definition of function § Independent and Dependent Variables
Section 1.2 Multiple Representations of Functions § Sets of ordered pairs (input, output) § Tables § Graphs § Vertical Line Test § Behavior of Graphs
Section 1.3 Function Notation
§ Function evaluation § Working with input and output § Multiple Representations § Graphs and tables with a graphing calculator
Section 1.4 Domain and Range § Definitions § Multiple Representations § Restricting Domain and Range (calculator)
Section 1.5 Applications of Functions § Criteria for a good graph § Practical Domain and Range

Page 2
Lesson 1 Checklist
Component Required? Y or N Comments Due Score
Mini-Lesson
Online Homework
Online Quiz
Online Test
Practice Problems
Lesson Assessment

Name: _____________________________ Date: ________________
Page 3
Mini-Lesson 1
Section 1.1 – What is a Function? Intermediate Algebra is a study of functions and their characteristics. In this class, we will study LINEAR, EXPONENTIAL, LOGARITHMIC, QUADRATIC, RATIONAL, & RADICAL functions. Before we learn the specifics of these functions, we need to review/learn the language and notation of FUNCTIONS. What is a Function?
The concept of “function” is one that is very important in mathematics. The use of this term is very specific and describes a particular relationship between two quantities: an input quantity and an output quantity. Specifically, a relationship between two quantities can be defined as function if it is the case that “each input value is associated with only one output value”. Why Do We Care About Functions? Imagine that you are a nurse working the emergency room of a hospital. A very sick person arrives. You know just the medicine needed but you are unsure the exact dose. First, you determine the patient’s weight (200 pounds). Then you look at the table to the right and see the given dosage information:
Weight in lbs. mL of Medicine
200 10
200 100 You are immediately confused and very concerned. How much medicine do you give? 10 ml or 100 ml? One amount could be too much and the other not enough. How do you choose the correct amount? What you have here is a situation that does NOT define a function (and would not occur in real life). In this case, for the input value 200 lbs, there are two choices for the output value. If you have a function, you will not have to choose between output values for a given input. In the real case of patients and medicine, the dosage charts are based upon functions.
A More Formal Definition of Function:
A FUNCTION is a rule that assigns a single, unique output value to each input value.

Lesson 1 – Introduction to Functions Mini-Lesson
Page 4
Problem 1 MEDIA EXAMPLE – Do The Data Represent A Function?
The table below gives the height H, in feet, of a golf ball t seconds after being hit.
t = Time (in seconds) H = Height (in feet) 0 0 1 80 2 128 3 144 4 128 5 80 6 0
a) Identify the input quantity (include units)._________________________________________ Identify the input variable._________________________________________________ Identify the output quantity (include units).________________________________________ Identify the output variable._________________________________________________ b) Write the data as a set of ordered pairs. c) Interpret the meaning of the ordered pair (3, 144). d) Is height of the golf ball a function of time? Why or why not? e) Is time a function of the height of the golf ball? Why or why not?
Lesson 1 – Introduction to Functions Mini-Lesson
Page 5
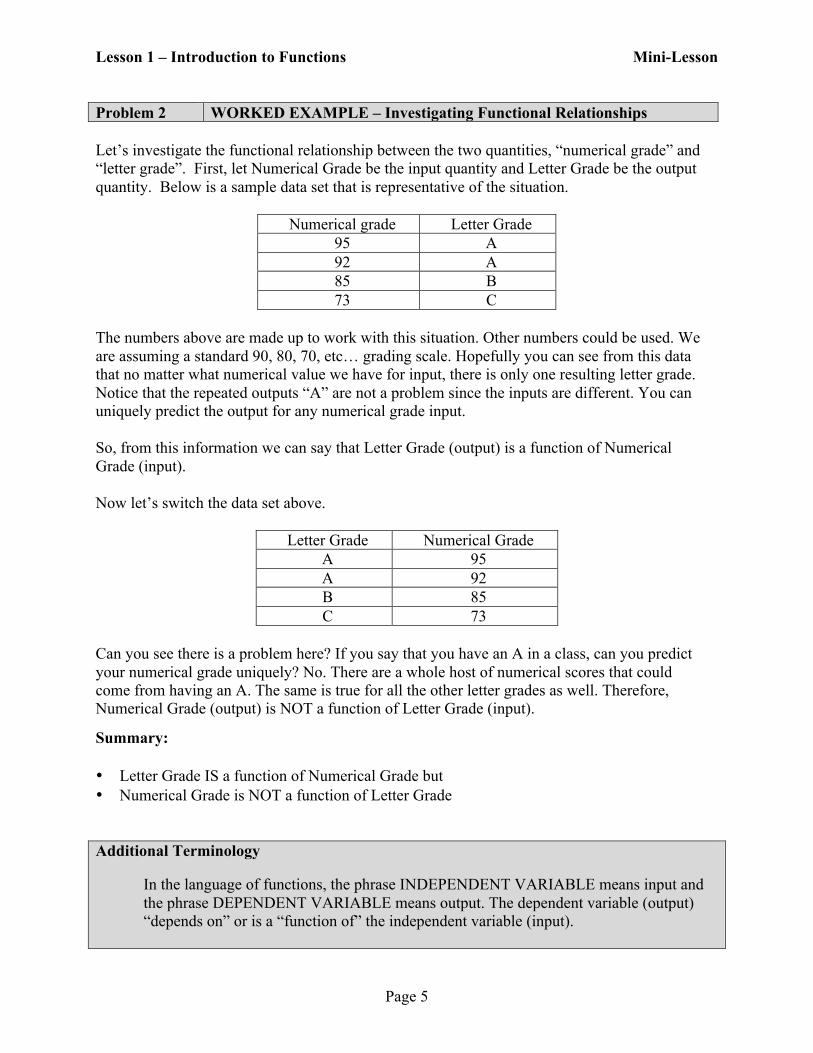
Problem 2 WORKED EXAMPLE – Investigating Functional Relationships Let’s investigate the functional relationship between the two quantities, “numerical grade” and “letter grade”. First, let Numerical Grade be the input quantity and Letter Grade be the output quantity. Below is a sample data set that is representative of the situation.
Numerical grade Letter Grade 95 A 92 A 85 B 73 C
The numbers above are made up to work with this situation. Other numbers could be used. We are assuming a standard 90, 80, 70, etc… grading scale. Hopefully you can see from this data that no matter what numerical value we have for input, there is only one resulting letter grade. Notice that the repeated outputs “A” are not a problem since the inputs are different. You can uniquely predict the output for any numerical grade input. So, from this information we can say that Letter Grade (output) is a function of Numerical Grade (input). Now let’s switch the data set above.
Letter Grade Numerical Grade A 95 A 92 B 85 C 73
Can you see there is a problem here? If you say that you have an A in a class, can you predict your numerical grade uniquely? No. There are a whole host of numerical scores that could come from having an A. The same is true for all the other letter grades as well. Therefore, Numerical Grade (output) is NOT a function of Letter Grade (input).
Summary: • Letter Grade IS a function of Numerical Grade but • Numerical Grade is NOT a function of Letter Grade Additional Terminology
In the language of functions, the phrase INDEPENDENT VARIABLE means input and the phrase DEPENDENT VARIABLE means output. The dependent variable (output) “depends on” or is a “function of” the independent variable (input).

Lesson 1 – Introduction to Functions Mini-Lesson
Page 6
Problem 3 YOU TRY – Do The Data Represent A Function? The table below gives the value of a car n years after purchase
n = Time (in years) V = Value (in dollars) 0 32540 1 28310 2 24630 3 21428 4 18642 5 16219 6 14110
a) Identify the input quantity (include units)._________________________________________ Identify the output quantity (include units).________________________________________ b) Identify the dependent variable._________________________________________________ Identify the independent variable.________________________________________________ c) Interpret the meaning of the ordered pair (2, 24630). d) Is the value of the car a function of time? Why or why not?

Lesson 1 – Introduction to Functions Mini-Lesson
Page 7
Section 1.2 – Multiple Representations of Functions
Problem 4 MEDIA EXAMPLE – Determine Functional Relationships Using Multiple Representations
SETS OF ORDERED PAIRS (input, output) Which of the following represent functional relationships? {(-3, 2), (5, 0), (4, -7)} {(0, 2), (5, 1), (5, 4)} {(-3, 2), (5, 2), (4, 2)} TABLES Which of the following represent functional relationships?
x y x y x y 2 52 3 128 0 4 4 41 11 64 1 4 4 30 24 2 4 7 19 38 16 3 4
GRAPHS Which of the following represent functional relationships?
THE VERTICAL LINE TEST • If all vertical lines intersect the graph of a relation at only one point, the relation is also
a function. One and only one output value exists for each input value. • If any vertical line intersects the graph of a relation at more than one point, the relation
“fails” the test and is NOT a function. More than one output value exists for some (or all) input value(s).

Lesson 1 – Introduction to Functions Mini-Lesson
Page 8
Problem 5 WORKED EXAMPLE – Determine Functional Relationships Using
Multiple Representations The table below shows 3 different representations for two relationships. Determine which relationship defines a function.
Functions Not Functions
Set of Ordered
Pairs
{(-7, 6), (-3, 3), (1, 8), (5, 8), (11, 0)}
No input value is repeated in an ordered pair.
{(8, 3), (6, 1), (8, -1), (6, 11), (2, -5)}
Two of the listed input values (6 & 8) are associated with more than one output
value.
Table
x -4 -2 0 1 5 y 8 3 5 3 10
OR x y -4 8 -2 3 0 5 1 3 5 10
All input values are associated with
one, unique output value.
x 0 1 1 4 4 y 0 1 -1 2 -2
OR x y 0 0 1 1 1 -1 4 2 4 -2
Two of the listed input values (1 & 4)
are associated with more than one output value.
Graph
No vertical line intersects the graph in more than one point.
We say the graph PASSES the VERTICAL LINE TEST.
Vertical lines intersect the graph at more than one point meaning inputs are
repeated with different outputs. We say that the graph FAILS the
VERTICAL LINE TEST.

Lesson 1 – Introduction to Functions Mini-Lesson
Page 9
Problem 6 YOU TRY – Determine Functional Relationships Using Multiple Representations
Which of the following represent functional relationships?
A
{(4, 1), (7, 1), (-3, 1), (5, 1)}
B
C x y 5 4 5 6 5 8 5 1
D
E
{(3, 5), (3, 6), (8, 1), (5, 4)}
F x y 0 2 3 2 5 3 11 5
Problem 7 MEDIA EXAMPLE – Does the Statement Describe A Function? Explain your choice for each of the following. Remember when the word “function” is used, it is in a purely MATHEMATICAL sense, not in an everyday sense. a) Is the number of children a person has a function of their income? b) Is your weekly pay a function of the number of hours you work each week? (Assume you
work at an hourly rate job with no tips).

Lesson 1 – Introduction to Functions Mini-Lesson
Page 10
Problem 8 WORKED EXAMPLE – Behavior of Functions
A function is: • INCREASING if the outputs get larger, • DECREASING if the outputs get smaller, • CONSTANT if the outputs do not change.
NOTE: We read graphs just like we read a book…from left to right.
a) The following functions are INCREASING
x y 0 4 1 6 2 12 3 24
b) The following functions are DECREASING
x y 0 10 1 5 2 0 3 -5
c) The following functions are CONSTANT
x y 0 4 1 4 2 4 3 4

Lesson 1 – Introduction to Functions Mini-Lesson
Page 11
Section 1.3 – Function Notation FUNCTION NOTATION is used to indicate a functional relationship between two quantities as follows:
Function Name (INPUT) = OUTPUT
So, the statement f (x) = y would refer to the function f , and correspond to the ordered pair (x,y), where x is the input variable, and y is the output variable.
Function Evaluation: To evaluate a function at a particular value of the input variable, replace each occurrence of the input variable with the given value and compute the result. Note: Use of ( ) around your input value, especially if the input is negative, can help achieve correct results.
Problem 9 MEDIA EXAMPLE – Function Evaluation Given f (x) = 2x – 5, evaluate f (2), f (–1), f (x + 1) and f (–x).

Lesson 1 – Introduction to Functions Mini-Lesson
Page 12
Problem 10 WORKED EXAMPLE – Function Evaluation If f (x) = 5x2 – 3x – 10, find f (2) and f (–1).
f (2) = 5(2)2 – 3(2) – 10 f (–1) = 5(–1)2 – 3(–1) – 10 = 5(4) – 6 – 10 = 5(1) + 3 – 10 = 20 – 6 – 10 = 5 + 3 – 10 = 14 – 10 = 8 – 10 = 4 = –2
When working with FUNCTIONS, there are two main questions we will ask and solve as follows:
• Given a particular INPUT value, what is the corresponding OUTPUT value? • Given a particular OUTPUT value, what is the corresponding INPUT value?
Problem 11 MEDIA EXAMPLE – Working with Input and Output Given f (x) = 2x + 5, determine each of the following. Write your answers as ordered pairs. GIVEN INPUT FIND OUTPUT Find f (0)
Find f (–2)
GIVEN OUTPUT FIND INPUT Find x if f (x) = 7
Find x if f (x) = –11
Lesson 1 – Introduction to Functions Mini-Lesson
Page 13
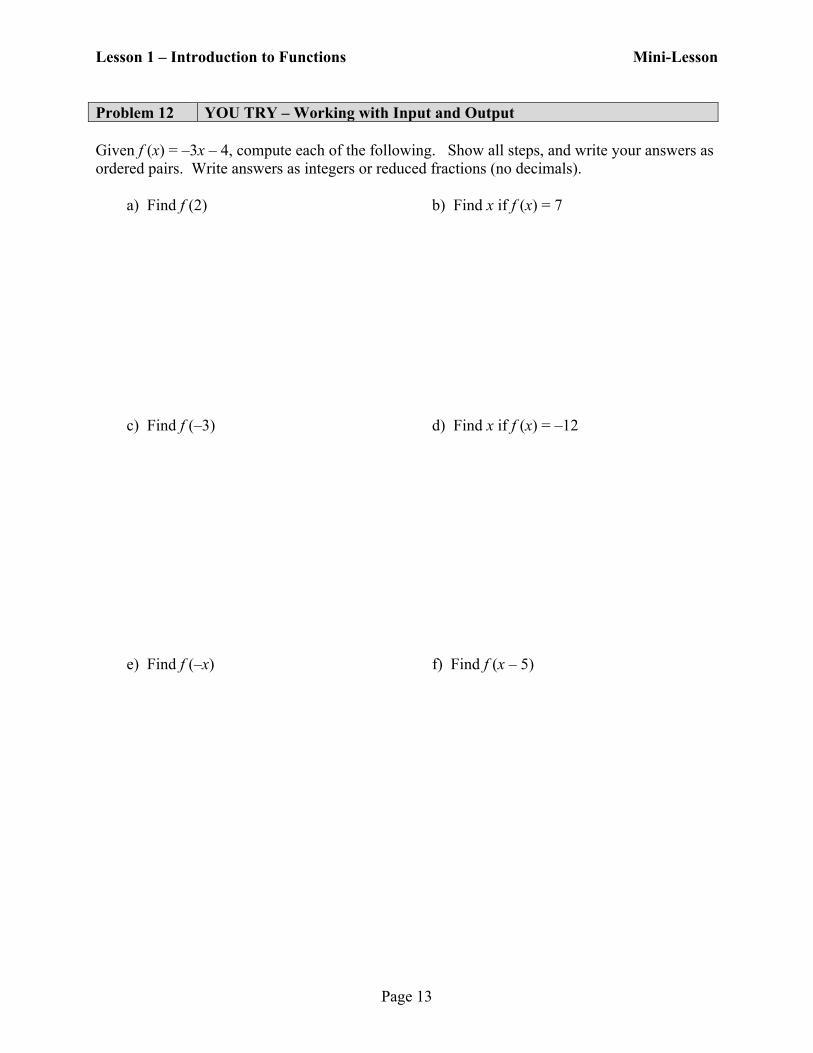
Problem 12 YOU TRY – Working with Input and Output
Given f (x) = –3x – 4, compute each of the following. Show all steps, and write your answers as ordered pairs. Write answers as integers or reduced fractions (no decimals).
a) Find f (2)
b) Find x if f (x) = 7
c) Find f (–3)
d) Find x if f (x) = –12
e) Find f (–x)
f) Find f (x – 5)

Lesson 1 – Introduction to Functions Mini-Lesson
Page 14
Problem 13 MEDIA EXAMPLE – Working with Function Notation Using a Set of Ordered Pairs
The function g(x) is shown below
g = {(1, 3), (5, 2), (8, 3), (6, -5)} g(1) = __________ Find x if g(x) = -5. x = __________
Find x if g(x) = 3. x = _____________________ Problem 14 MEDIA EXAMPLE – Working with Function Notation Using a Table The function V(n) is shown below gives the value, V, of an investment (in thousands of dollars) after n months.
n 1 2 3 4 V(n) 2.31 3.02 5.23 3.86
Identify the input quantity (include units).________________________________ Identify the output quantity (include units).________________________________ Write a sentence explaining the meaning of the statement V(1) = 2.31. Determine V(3) and write a sentence explaining its meaning.
For what value of n is V(n) = 3.02? Interpret your answer in a complete sentence.

Lesson 1 – Introduction to Functions Mini-Lesson
Page 15
Problem 15 MEDIA EXAMPLE – Working with Function Notation Using a Graph The function D(t) below shows a person’s distance from home as a function of time.
Identify the input quantity (include units).________________________________ Identify the output quantity (include units).________________________________ Write a sentence explaining the meaning of the statement D(15) = 10.
Determine D(0) and write a sentence explaining its meaning.
For what value of t is D(t) = 0? Interpret your answer in a complete sentence.

Lesson 1 – Introduction to Functions Mini-Lesson
Page 16
Problem 16 MEDIA EXAMPLE – Using Your Graphing Calculator to create a table and Graph of a Function
Consider the function y = 5 – 2x a) Use your graphing calculator to complete the table below
x 0 3 7 9 12
y
b) Use your graphing calculator to sketch the graph of y = 5 – 2x.
Use the standard viewing window (ZOOMà6) xmin= -10, xmax=10, ymin=-10, ymax=10 , Draw what you see on your calculator screen.
c) Use your graphing calculator to sketch the graph of y = 5 – 2x.
Use viewing window xmin= 0, xmax= 3, ymin= 0, ymax= 5 , Draw what you see on your calculator screen.

Lesson 1 – Introduction to Functions Mini-Lesson
Page 17
Section 1.4 – Domain and Range
The DOMAIN of a function is the set of all possible values for the input quantity. The RANGE of a function is the set of all possible values for the output quantity
Problem 17 MEDIA EXAMPLE – Domain and Range, Multiple Representations
SET OF ORDERED PAIRS Determine the domain and range of the function P(x) = {(2, 3), (4, –5), (6, 0), (8, 5)} Domain: ________________________________________________ Range: _________________________________________________ TABLE Determine the domain and range of the function R(t) defined below.
t 0 2 5 8 11 R(t) 23 54 66 87 108
Domain: ________________________________________________ Range: _________________________________________________ GRAPH Determine the domain and range of the function g(x) defined below.
Domain of g(x) Inequality Notation
Interval Notation
Range of g(x): Inequality Notation
Interval Notation

Lesson 1 – Introduction to Functions Mini-Lesson
Page 18
Problem 18 MEDIA EXAMPLE – Restricting the Domain and Range (Calculator) Graph the following function on your graphing calculator restricting the input window to Xmin = -5 and Xmax = 5 and draw an accurate sketch here [Go to Y= and type in the equation. Then go to Window and enter -5 for Xmin and 5 for Xmax. Leave Ymin at -10 and Ymax at 10]. Indicate the domain and range given the window above.
a) y = x – 1 Domain:_____________________________
Range:______________________________
b) If the input and output are not restricted as above, indicate the domain and range for this function.
Domain:
Range:

Lesson 1 – Introduction to Functions Mini-Lesson
Page 19
Problem 19 YOU TRY – Domain and Range, Multiple Representations
Find the domain and range for the functions below. Use proper notation for your domain/range responses. a) Set of ordered pairs
D(r) = {(7, 8), (8, 12), (11, 21)}
Domain: ____________________________ Range: _____________________________
b) Table of values
n A(n) 3 51 6 42 8 33
Domain: ____________________________ Range: _____________________________
c) Graph
Domain of f(x) Inequality Notation
Interval Notation
Range of f(x): Inequality Notation
Interval Notation

Lesson 1 – Introduction to Functions Mini-Lesson
Page 20
Section 1.5 – Applications of Functions
Criteria for a GOOD GRAPH: 1. The horizontal axis should be properly labeled with the name and units of the input quantity.
2. The vertical axis should be properly labeled with the name and units of the output quantity.
3. Use an appropriate scale. • Start at or just below the lowest value. • End at or just above the highest value. • Scale the graph so the adjacent tick marks are equal distance apart. • Use numbers that make sense for the given data set. • The axes meet at (0,0) Use a “//” between the origin and the first tick mark if the
scale does not begin at 0.
4. All points should be plotted correctly, and the graph should be neat and uncluttered.
Problem 20 MEDIA EXAMPLE – Understanding Applications of Functions Suppose that the cost to fill your 15-gallon gas tank is determined by the function C(g) = 3.29g where C is the output (cost in $) and g is the input (gallons of gas). a) Draw a GOOD graph of this function in the space below. Provide labels for your axes. You
may use the graphing feature of your calculator to help you.

Lesson 1 – Introduction to Functions Mini-Lesson
Page 21
b) Use the Table feature of your graph and identify the first and last ordered pairs that are on the graph (based on the information above). [2nd>Graph will take you to the table]. Include both ordered pairs and function notation.
c) What is the INPUT quantity (including units) for this function? Name the smallest and
largest possible input quantity then use this information to identify the PRACTICAL DOMAIN.
d) What is the OUTPUT quantity (including units) for this function? Name the smallest and
largest possible output quantity then use this information to identify the PRACTICAL RANGE.
Practical Domain: The PRACTICAL DOMAIN of a function is the set of all possible input values that are realistic for a given problem. Practical Range: The PRACTICAL RANGE of a function is the set of all possible output values that are realistic for a given problem.
Lesson 1 – Introduction to Functions Mini-Lesson
Page 22
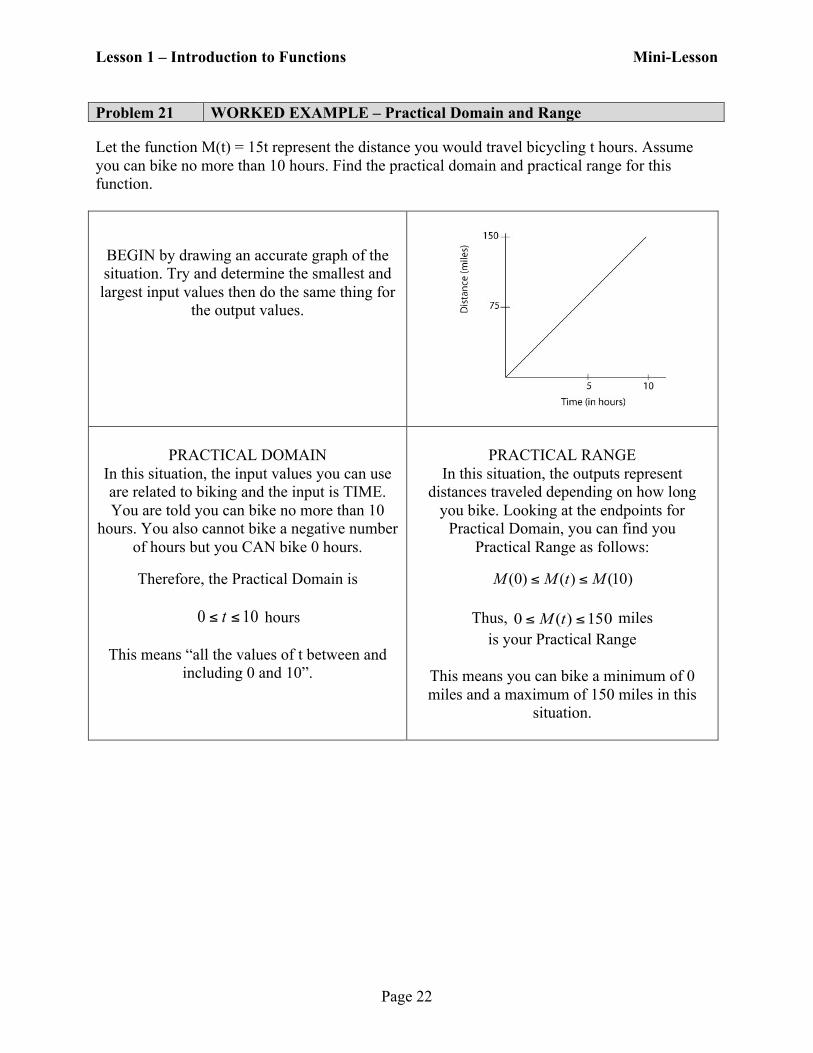
Problem 21 WORKED EXAMPLE – Practical Domain and Range Let the function M(t) = 15t represent the distance you would travel bicycling t hours. Assume you can bike no more than 10 hours. Find the practical domain and practical range for this function.
BEGIN by drawing an accurate graph of the situation. Try and determine the smallest and largest input values then do the same thing for
the output values.
PRACTICAL DOMAIN
In this situation, the input values you can use are related to biking and the input is TIME. You are told you can bike no more than 10
hours. You also cannot bike a negative number of hours but you CAN bike 0 hours.
Therefore, the Practical Domain is
100 ≤≤ t hours
This means “all the values of t between and including 0 and 10”.
PRACTICAL RANGE
In this situation, the outputs represent distances traveled depending on how long
you bike. Looking at the endpoints for Practical Domain, you can find you
Practical Range as follows:
)10()()0( MtMM ≤≤
Thus, 150)(0 ≤≤ tM miles is your Practical Range
This means you can bike a minimum of 0 miles and a maximum of 150 miles in this
situation.

Lesson 1 – Introduction to Functions Mini-Lesson
Page 23
Problem 22 YOU TRY – Applications of Functions A local towing company charges $3.25 per mile driven plus a base fee of $30.00. They tow a maximum of 25 miles. a) Let C represent the total cost of any tow and x represent miles driven. Using correct and
formal function notation, write a function that represents total cost as a function of miles driven.
b) Identify the practical domain of this function by filling in the blanks below.
Minimum miles towed ≤ x ≤ Maximum miles towed
Practical Domain: _____________ ≤ x ≤ ______________ c) Identify the practical range of this function by filling in the blanks below.
Minimum Cost ≤ C(x) ≤ Maximum Cost
Practical Range: _____________ ≤ C(x) ≤ ______________ d) Write a complete sentence to explain the meaning of C(60) = 225 in words.
e) Use your function from part a) to find C(15). Write your answer as ordered pair then explain
its meaning in a complete sentence. f) Use your function from part a) to determine the value of x when C(x) = 30. Write your
answer as ordered pair then explain its meaning in a complete sentence.

Lesson 1 – Introduction to Functions Mini-Lesson
Page 24
Problem 23 YOU TRY – Applications of Functions
The value V (in dollars) of a washer/dryer set decreases as a function of time t (in years). The function V(t) = –100t + 1200 models this situation. You own the washer/dryer set for 12 years. a) Identify the input quantity (including units) and the input variable. b) Identify the output quantity (including units) and the output variable. c) Fill in the table below.
t 0 6 12
V(t)
d) Draw a GOOD graph of this function in the space below. Provide labels for your axes. Plot
and label the ordered pairs from part c). You may use the graphing feature of your calculator to help you.

Lesson 1 – Introduction to Functions Mini-Lesson
Page 25
e) A washer/dryer set that is worth $400 would be how old? Hint: This is a GIVEN OUTPUT FIND INPUT question. You must show work. f) After 2 years, how much would the washer/dryer set be worth? Hint: This is a GIVEN INPUT FIND OUTPUT question. You must show work. g) What is the practical domain for V(t)? Inequality notation: ____________________________________________
Interval notation: ____________________________________________ h) What is the practical range for V(t)? Inequality notation: ____________________________________________
Interval notation: ____________________________________________

Lesson 1 – Introduction to Functions Mini-Lesson
Page 26