Lenovo Group Limited - investor.lenovo.com · Lenovo Services. Software & Peripherals • Sales up...
29
© 2008 Lenovo Lenovo Group Limited 2007/08 Q3 Results January 31, 2008
Transcript of Lenovo Group Limited - investor.lenovo.com · Lenovo Services. Software & Peripherals • Sales up...

© 2008 Lenovo
Lenovo Group Limited2007/08 Q3 Results
January 31, 2008

© 2008 Lenovo
Wong Wai MingSenior Vice President & Chief Financial Officer

© 2008 Lenovo 3
0.0
0.5
1.0
1.5
2.0
2.5
FY07 Q3 FY07 Q4 FY08 Q1 FY08 Q2 FY08 Q3
Lenovo Q3 FY07/08 Results Highlights
• PC unit shipment, up 22% YTY
• WW Market share 7.5%, up 0.4 pts YTY
• Sales US$4,602 million, up 15% YTY
• Pretax income US$190 million, up 198% YTY
• Basic EPS 1.93 US cents, up 188% YTY
0
1,000
2,000
3,000
4,000
5,000
FY07 Q3 FY07 Q4 FY08 Q1 FY08 Q2 FY08 Q3
Sales (US$mn) Basic EPS (US cents)

© 2008 Lenovo 4
Financial Summary
* Finance income, finance cost and share of profits of associated companies
US$mn % Y/Y Q/Q US$mn %Sales 4,602 + 15.1% + 3.8% 12,960
Gross Profit 702 15.2% + 1.7 pts + 0.1 pts 1,954 15.1%Operating Expenses (521) 11.3% - 0.5 pts - 1.1 pts (1,531) 11.8%Other income, net 9 11Operating profit before restructuring 190 4.1% + 184.0% + 58.0% 434 3.3%
Other non-operating income* 2 5Restructuring cost (2) (48)Pre-tax Income 190 4.1% + 197.8% + 54.5% 391 3.0%
Profit Attributable to Shareholders 172 3.7% + 197.5% + 63.2% 344 2.7%EPS (US cents)
- Basic 1.93 + 188.1% + 58.2% 3.95- Diluted 1.76 + 175.0% + 57.1% 3.63
YTD 2007/08Q3 2007/08

© 2008 Lenovo 5
Condensed Balance Sheet
As at As at US$ mn Dec 31, 2007 Mar 31, 2007
Non-current assets 2,516 2,388 Property, plant and equipment 361 326 Intangible assets 1,871 1,868 Others 284 194
Current assets 4,639 3,061 Cash and cash equivalents 2,158 1,064 Account receivables and others 1,984 1,617 Inventory 483 358 Tax recoverable 14 22
Current liabilities 4,795 3,526 Short-term bank loans 62 18 Account payables and others 4,720 3,499 Current portion of non-current liabilities 13 9
Net current liabilities 156 465
Non-current liabilities 734 789
Total equity 1,626 1,134

© 2008 Lenovo 6
Cash and Working Capital
* Excluding restructuring charges
US$mn Q3 2007/08 Q3 2006/07 Q2 2007/08
EBITDA* 244 128 210
Cash Reserves 2,158 1,431 1,882Total Bank Borrowings 162 114 181Net Cash Reserves 1,996 1,317 1,701
Days Inventory 10 10 9
Days Receivable 24 24 24
Days Payable 62 62 62
Cash Conversion Cycle -28 days -28 days -29 days

© 2008 Lenovo 7
Geography Summary (Excluding restructuring charge)
• All geographies posted double-digit YTY sales growth• QTQ and YTY improvement on group’s overall segment profit margin
Q3 08 Y/Y Q/Q Q3 08 Q3 07 Q2 08 Q3 08 Q3 07 Q2 08
Greater China 1,828 15.5% 0.1% 114 81 102 6.2% 5.1% 5.6%
Americas 1,151 10.4% -2.6% 31 (3) 21 2.6% -0.3% 1.8%
EMEA 1,088 19.1% 22.8% 61 15 44 5.5% 1.6% 5.0%
AP (ex GC) 535 16.3% -0.8% (2) 5 8 -0.4% 1.0% 1.5%
Total 4,602 15.1% 3.8% 204 98 175 4.4% 2.4% 4.0%
Segment OperatingProfit Margin
SalesUS$mn
Segment Operating ProfitUS$mn
© 2008 Lenovo 8
0
500
1,000
1,500
2,000
FY07 Q3 FY07 Q4 FY08 Q1 FY08 Q2 FY08 Q3
26.1%
27.2%28.5%
24.6%
27.2%
27.8%28.6%
25.1%
27.4%28.8%
29.0%
15%
25%
35%
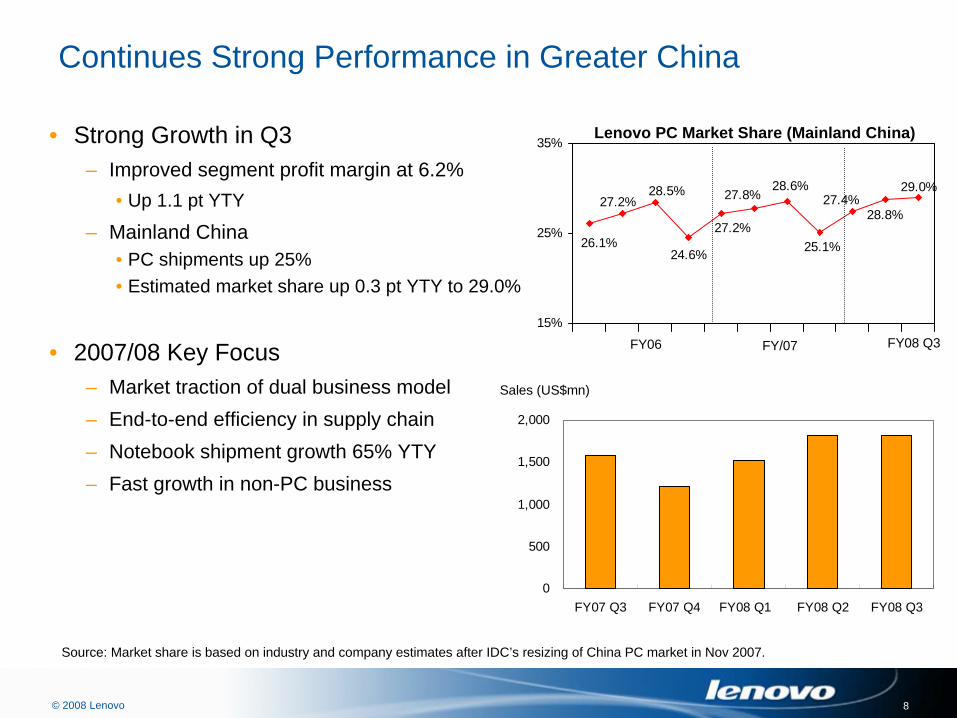
Continues Strong Performance in Greater China
• Strong Growth in Q3 – Improved segment profit margin at 6.2%
• Up 1.1 pt YTY
– Mainland China• PC shipments up 25%• Estimated market share up 0.3 pt YTY to 29.0%
• 2007/08 Key Focus– Market traction of dual business model– End-to-end efficiency in supply chain – Notebook shipment growth 65% YTY– Fast growth in non-PC business
FY06 FY/07
Lenovo PC Market Share (Mainland China)
Source: Market share is based on industry and company estimates after IDC’s resizing of China PC market in Nov 2007.
FY08 Q3
Sales (US$mn)

© 2008 Lenovo 9
Americas & EMEA
• Americas– Q3 PC shipments up 15% YTY– Historical record high shipments – Gained shares in the U.S. for four consecutive quarters– Expanded roll-out of transaction model and strengths in desktop shipments
• EMEA– Q3 PC shipments up 24% YTY– Historical record high shipments – Benefited from the robust PC market and strengthened currency– Double-digit sales growth for four consecutive quarters
0
200
400
600
800
1,000
1,200
FY07 Q3 FY07 Q4 FY08 Q1 FY08 Q2 FY08 Q3
Sales (US$mn)Sales (US$mn) Americas EMEA
0200400600800
1,0001,2001,400
FY07 Q3 FY07 Q4 FY08 Q1 FY08 Q2 FY08 Q3

© 2008 Lenovo 10
Asia Pacific (ex. Greater China)
• Asia Pacific (ex. Greater China)– Q3 PC shipments up 20% YTY– Transaction model roll-out gains traction– Shipments growth driven by India and ASEAN
Sales (US$mn) Asia Pacific (ex. GC)
0
100
200
300
400
500
600
FY07 Q3 FY07 Q4 FY08 Q1 FY08 Q2 FY08 Q3

© 2008 Lenovo 11
Notebook and Desktop Q3 2007/08
• US$1.8 billion, up 8% YTY• 40% of total
• US$2.6 billion, up 24% YTY• 56% of total
Notebook
Sales
Unit Growth YTY • 38% • Gained share worldwide
• 12% • Gained share worldwide
• Share gain in EMEA and Asia • Solid margin
Comments • Driven by China, EMEA and Asia• Enhanced competitiveness
Desktop
ThinkCentre A61e (Ultra Small Form Factor)
Tianyi F41A-PT (Snow Mountain)

© 2008 Lenovo 12
Mobile Handset Q3 2007/08
• Held #4 place in China with 5.9% market share
• Unit shipments down 31% YTY
• Sales down 26% YTY to US$108 million
P990P705S7i716

© 2008 Lenovo 13
Disposal of Mobile Handset Business
• The Disposal Proposal
– Sell 100% to a private equity group led by Hony Capital
– Consideration: US$100 million
– Gain on disposal: approx. US$66 million
i966
i389

© 2008 Lenovo 14
Outlook
• Confident to deliver higher than market growth
• Invest to drive sustained future growth
• Increased focus on operational efficiencies

© 2008 Lenovo
William AmelioPresident & Chief Executive Officer

© 2008 Lenovo 16
2. Supply Chain
3. Desktop Competitiveness
1. Transaction Model Roll-out
4. Brands
Strategic Initiatives

© 2008 Lenovo 17
Strategic Initiative #1: Transaction Model Roll-out
• Strong performance in Q3– WW Transaction sales +22% YTY– Shipments +28%– Strong profitability– Notebook volume +60%– Market share gains in all geographies
• Continued success of the roll-out– Volume, sales & profitability growth– Growing faster than overall market
• Germany: volume +52% YTY• France: volume +45% YTY• US: volume +37% YTY• Latin America: volume +86% YTY

© 2008 Lenovo 18
Relationship Model
• Sustained growth & profitability– Volume +15% YTY– Sales +12% YTY– All geographies profitable
• 4th consecutive quarter
• Strategic focus driving growth– Fully integrated business mgmt. system– Enhanced sales capacity

© 2008 Lenovo 19
• Overall cost and efficiency improvements– 13% YTY cost per box savings– Double-digit material cost reductions
• 14% YTY increase in worldwide serviceability– Desktop performance outside China improved 97%– 18% increase in worldwide notebook performance
• Lean Six Sigma initiatives US$2M in business value
• New Poland plant announced November 27
Strategic Initiative #2: Supply Chain Upgrade

© 2008 Lenovo 20
• YTY WW share gain for 10 consecutive quarters
• 4th consecutive quarter of profitability
• Shipments up 12% YTY
• Sales up 10%
Strategic Initiative #3: Desktop Competitiveness
7.7%8.2%8.2%
6.5%7.2%
7.6%7.2%
6.0%7.0%7.4%
6.9%
0%1%2%3%4%5%6%7%8%9%
10%
FY06Q1
FY06Q2
FY06Q3
FY06Q4
FY07Q1
FY07Q2
FY07Q3
FY07Q4
FY08Q1
FY08Q2
FY08Q3
500
1,000
1,500
2,000
2,500
3,000
3,500
4,000
Units '000Share
Lenovo Desktop YTY WW Share Gain
• Key milestones – Desktop serviceability record highs– PC Magazine “Desktop of the Year”
– ThinkCentre M55e– Launched industry firsts in monitors
Volume
Market Share

© 2008 Lenovo 21
Services, Software & Peripherals
• Contract signings up 62% YTY• Customer satisfaction remains high
– 4-Star Service Desk Certification (HDI)– #1 in Break/Fix (TBR)– #1 in External Phone Support (TBR)
Lenovo Services
Software & Peripherals• Sales up 18%
– Strong growth in China market– Continued high overall attach rate– Expanded routes to market– New or growing alliance partnerships
• LANDesk, Utimaco, Avaya

© 2008 Lenovo 22
• Worldwide brand metrics ahead of plan in Q3
• Sponsorships– Olympics
• 1 Year Countdown• Google/Olympic Torch Bearer
– Formula One • Brazil & China races• Strong full-year coverage
• Successful Product Launches– ThinkStation launch – workstation market– IdeaPad launch – consumer market
• Coming Up….the Ideas Campaign
Strategic Initiative #4: Brand Building

© 2008 Lenovo 23
Strategic Focus
• Execute against strategic initiatives
• Build upon base; grow core business
• Offer new products and services– Consumer (IdeaPad)
– Workstations
– Servers
• Penetrate new markets– Brazil, India, Turkey, Russia
• Improve operational efficiency
• Unlock additional value

© 2008 Lenovo
Yang YuanqingChairman of the Board

© 2008 Lenovo 25

© 2008 Lenovo
Appendix
• Sales Breakdown• Income Statement• Cash Flow Statement

© 2008 Lenovo 27
Others*1.6%
Desktop40.1%
MobileHandset
2.4%
Notebook55.9%
Sales Breakdown (Q3 2007/08)
Americas25.0%
EMEA23.6%
AsiaPacific Ex
GC11.7%
GreaterChina39.7%
Balanced Geographic Mix Strong Notebook Mix
* Others include servers, printers, digital products, etc.
(39.6%)
(26.1%)
(22.8%)
(11.5%)
(42.7%)
(52.0%)
(1.6%)(3.7%)
Q3 2006/07 figures are in bracket

© 2008 Lenovo 28
Consolidated Income Statement
* restated
2007/08 2007/08 2006/07 2006/07US$ Million Q3 YTD Q3* YTD*Sales 4,602 12,960 3,998 11,174Cost of sales (3,900) (11,006) (3,456) (9,655)Gross profit 702 1,954 542 1,519Other income, net 9 11 (5) 10Selling and distribution expenses (302) (898) (287) (851)Administrative expenses (174) (452) (130) (357)Research and development expenses (67) (187) (63) (170)Other operating expenses 20 (42) 7 (24)Operating profit 188 386 64 127Finance income 15 36 8 19Finance costs (13) (31) (8) (26)Share of profits of associated companies 0 0 0 2Profit before taxation 190 391 64 122Taxation (17) (46) (6) (21)Profit for the period 173 345 58 101Profit attributable to:Shareholders of the Company 172 344 58 101Minority interests 1 1 - -
173 345 58 101Dividend 35 27Earnings per share- Basic 1.93 US cents 3.95 US cents 0.67 US cents 1.17 US cents- Diluted 1.76 US cents 3.63 US cents 0.64 US cents 1.14 US cents

© 2008 Lenovo 29
Condensed Consolidated Cash Flow Statement
2007/08 2006/07US$ Million Q3 Q3
Net cash generated from operating activities 375 434
Net cash used in investing activities (46) (68)
Net cash used in financing activities (47) (40)
Increase in cash and cash equivalents 282 326
Effect of foreign exchange rate changes (6) 3
Cash and cash equivalents at the beginning of the period 1,882 1,101
Cash and cash equivalents at the end of the period 2,158 1,430