Lendlease Group 2019 Half Year Results – Replacement Appendix … · For personal use only Mob:...
62
25 February 2019 Lendlease Corporation Limited ABN 32 000 226 228 and Lendlease Responsible Entity Limited ABN 72 122 883 185 AFS Licence 308983 as responsible entity for Lendlease Trust ABN 39 944 184 773 ARSN 128 052 595 Level 14, Tower Three, International Towers Sydney Telephone +61 2 9236 6111 Exchange Place, 300 Barangaroo Avenue Facsimile +61 2 9252 2192 Barangaroo NSW 2000 Australia lendlease.com Lendlease Group 2019 Half Year Results – Replacement Appendix Further to our announcement lodged today attaching the Lendlease Group HY19 Results Announcement, Presentation and Appendix, Lendlease Group advises there is a correction to be made to slide 47 of the Appendix. The Completion date for the WestConnex 3A M4-M5 Link Project was shown as FY24 but should be shown as FY23. Attached is a revised copy of the Appendix. The only change in this document from the version lodged earlier today is the correction referred to above. Ends FOR FURTHER INFORMATION, PLEASE CONTACT: Investors: Media: Justin McCarthy Stephen Ellaway Mob: 0422 800 321 Mob: 0417 851 287 For personal use only
Transcript of Lendlease Group 2019 Half Year Results – Replacement Appendix … · For personal use only Mob:...

25 February 2019
Lendlease Corporation Limited ABN 32 000 226 228 andLendlease Responsible Entity Limited ABN 72 122 883 185 AFS Licence 308983as responsible entity for Lendlease Trust ABN 39 944 184 773 ARSN 128 052 595
Level 14, Tower Three, International Towers Sydney Telephone +61 2 9236 6111Exchange Place, 300 Barangaroo Avenue Facsimile +61 2 9252 2192Barangaroo NSW 2000 Australia lendlease.com
Lendlease Group 2019 Half Year Results – Replacement Appendix
Further to our announcement lodged today attaching the Lendlease Group HY19 Results Announcement,Presentation and Appendix, Lendlease Group advises there is a correction to be made to slide 47 of theAppendix.
The Completion date for the WestConnex 3A M4-M5 Link Project was shown as FY24 but should beshown as FY23.
Attached is a revised copy of the Appendix. The only change in this document from the version lodgedearlier today is the correction referred to above.
Ends
FOR FURTHER INFORMATION, PLEASE CONTACT:
Investors: Media:Justin McCarthy Stephen EllawayMob: 0422 800 321 Mob: 0417 851 287
For
per
sona
l use
onl
y

Artist’s impression: Paya Lebar Quarter, Singapore
For
per
sona
l use
onl
y
hugr311
Text Box
This is the replacement Appendix for the 2019 half year results referred to in Lendlease Group's ASX announcement of 25 February 2019

Artist’s impression: Victoria Harbour, Melbourne
For
per
sona
l use
onl
y

The Development segment is involved in the development of
communities, inner city mixed use developments, apartments,
retirement, commercial assets, and social and economic
infrastructure
• Development margins
• Development management fees received from external
co-investors
• Origination fees for the facilitation of infrastructure projects
The Construction segment provides project management,
design and construction services, predominantly in the
defence, mixed use, commercial and residential sectors
• Project management and construction management fees
• Construction margin
The Investments segment includes a leading wholesale
investment management platform and also includes the
Group’s ownership interests in property and infrastructure co-
investments, Retirement Living and US Military Housing
• Fund, asset and property management fees
• Yields and capital growth on investments, and returns from
the Group’s Retirement investment and US Military
Housing operationsFor
per
sona
l use
onl
y

$7.9b Development pipeline1
$6.2b Construction backlog
$0.4b FUM
$0.4b Investments
$5.4b Development pipeline1
$0.8b Construction backlog
$8.0b FUM
$0.4b Investments
$30.1b Development pipeline1
$1.2b Construction backlog
$1.6b FUM
1. Remaining estimated development end value.
2. Construction backlog excluding Engineering and Services is $14.8b.
3. Australia construction backlog excluding Engineering and Services is $6.6b.
$31.1b Development pipeline1
$13.2b Construction backlog3
$24.1b FUM
$2.8b Investments
For
per
sona
l use
onl
y

1. World Urbanization Prospects: The 2018 Revision, United Nations.
2. Remaining estimated development end value.
3. Urbanisation development projects with end value >$1b.
4. McKinsey Global Institute: Bridging Infrastructure Gaps – Has the World Made
Progress? October 2017. Includes some Group Research calculations.
5. Cumulative data from FY12 to FY18.
6. Asset & Wealth Management Revolution: Embracing Exponential Change, PwC 2017.
7. Lendlease managed Australian Prime Property Fund Commercial ranked first out of
874 respondents in the 2018 Global Real Estate Sustainability Benchmark.
8. Taskforce on Climate-related Financial Disclosure (TCFD).
9. World Population Prospects: The 2017 Revision, United Nations.
10. RE: Tech: Real Estate Tech Annual Report 2017.
By 2030, over 60% of the world’s
population is expected to live in
urban areas1
• $59.3b urbanisation pipeline2
• 20 major urbanisation projects3 across 10
gateway cities
Global infrastructure spending is
estimated to rise to an average of
US$5.1 trillion per year between now
and 20354
• c.$10b PPPs secured5
• Emerging telecommunications
infrastructure business
Global assets under management
are forecast to rise from US$85
trillion in 2016 to US$145 trillion by
20256
• 17.8% annual growth in funds under
management since FY14
With over two thirds of the world’s
population living in urban areas by
20501, the built environment faces
increasing challenges
• For a second year in a row our APPF
Commercial fund is rated as worlds best
for Sustainability by GRESB7
• Endorsed the recommendations of the
TCFD8, climate is a key consideration
influencing our strategy
Internationally, people aged 60+ are
projected to grow three times faster
than the overall population (2.4% vs
0.8% pa) in average annual terms
between 2015 and 20509
• Operate one of the largest Retirement
Living businesses in Australia
• Seeking to establish a scale platform in
China. In FY18 secured first senior living
project in Shanghai
Global venture capital investment in
real estate technology has grown
from US$1.8b in 2015 to US$12.6b in
201710
• A pioneer of new delivery technologies
e.g. Cross Laminated Timber, digital
design, pre-fab, online sales channels; a
leader in new safety initiativesFor
per
sona
l use
onl
y

In FY18 the Lendlease Board endorsed the recommendations of the Task Force on Climate-related Financial
Disclosure (TCFD)
The TCFD provides a voluntary framework for climate-related risk disclosures for use by companies to inform
investors, lenders, insurers and interested stakeholders
Continues to achieve highest AAA ESG rating and described as an “Industry Leader” in the green building
space
MSCI is an independent provider of research-driven insights and tools for institutional investors
Lendlease’s 2nd Reconciliation Action Plan (RAP) achieved ‘Elevate’ status from Reconciliation Australia
The RAP programme enables organisations to set goals and aspirations in support of the national
reconciliation movement. An Elevate RAP, is the highest independent rating a RAP programme can receive
from Reconciliation Australia
Signatory and active participant since April 2014
UN Global Compact is a voluntary initiative based on CEO commitments to implement universal sustainability
principles and to take steps to support UN goals
Signatory since FY08
The PRI is the world’s leading proponent of responsible investment working to understand the investment
implications of environmental, social and governance (ESG) factors
Australia Prime Property Fund Commercial rated worlds best by GRESB in 20181. Rated as the number one
fund four out of the last five years
GRESB is an investor driven organisation assessing the sustainability performance of real asset sector
portfolios and assets
1. Lendlease managed Australian Prime Property Fund Commercial ranked first out of 874 respondents in the 2018 Global Real Estate Sustainability Benchmark.
For
per
sona
l use
onl
y

Artist’s impression: Clippership Wharf, Boston
For
per
sona
l use
onl
y

$m HY18 HY19
Revenue from contracts with customers1 8,632.7 7,679.7
Other revenue1 58.5 82.0
Cost of sales (7,778.0) (7,699.8)
Gross profit 913.2 61.9
Share of profit of equity accounted investments 7.0 193.5
Other income 378.0 207.9
Other expenses (628.0) (441.7)
Results from operating activities 670.2 21.6
Finance revenue 6.1 9.3
Finance costs (52.1) (61.9)
Net finance costs (46.0) (52.6)
Profit/(loss) before tax 624.2 (31.0)
Income tax (expense)/benefit (198.5) 46.7
Profit after tax 425.7 15.7
Profit after tax attributable to:
Members of Lendlease Corporation Limited 314.4 (90.7)
Unitholders of Lendlease Trust 111.2 106.4
Profit after tax attributable to securityholders 425.6 15.7
External non controlling interests 0.1 -
Profit after tax 425.7 15.7
Earnings per Stapled Security cents 72.9 2.8
1. HY18 balances have been reclassified to align the presentation of comparative information to disclosures required under AASB 15 Revenue from Contracts with Customers which
has been adopted from 1 July 2018. $58.5m has been reclassified from Revenue from contracts with customers to Other revenue.
For
per
sona
l use
onl
y

$m HY18 FY18 HY19
Current Assets
Cash and cash equivalents 1,545.2 1,177.1 1,088.1
Loans and receivables 2,127.0 2,670.2 2,196.0
Inventories 1,713.4 2,369.2 2,862.8
Other financial assets 2.4 6.7 9.8
Current tax assets - - 0.2
Other assets 105.2 91.0 107.4
Total current assets 5,493.2 6,314.2 6,264.3
Non Current Assets
Loans and receivables 742.4 787.8 715.8
Inventories 3,171.3 3,177.1 3,176.6
Equity accounted investments 2,268.0 2,626.6 3,191.2
Investment properties 557.4 278.2 375.5
Other financial assets 1,430.8 1,547.8 1,497.0
Deferred tax assets 148.9 120.0 111.5
Property, plant and equipment 424.7 464.7 470.1
Intangible assets 1,407.2 1,421.4 1,435.8
Defined benefit plan asset 80.8 154.7 142.2
Other assets 67.3 71.1 77.6
Total non current assets 10,298.8 10,649.4 11,193.3
Total assets 15,792.0 16,963.6 17,457.6
$m HY18 FY18 HY19
Current Liabilities
Trade and other payables 4,719.6 5,769.5 5,826.9
Provisions 421.9 329.9 322.5
Borrowings and financing arrangements 249.6 474.8 -
Current tax liabilities 9.8 10.4 -
Other financial liabilities 8.8 3.4 5.8
Total current liabilities 5,409.7 6,588.0 6,155.2
Non Current Liabilities
Trade and other payables 1,915.3 1,530.7 1,363.3
Provisions 55.2 67.8 47.4
Borrowings and financing arrangements 1,542.9 1,883.7 3,364.1
Other financial liabilities 0.6 0.7 0.9
Deferred tax liabilities 439.2 478.5 419.9
Total non current liabilities 3,953.2 3,961.4 5,195.6
Total liabilities 9,362.9 10,549.4 11,350.8
Net assets 6,429.1 6,414.2 6,106.8
Equity
Issued capital 1,296.8 1,296.8 1,296.8
Treasury securities (44.1) (44.1) (61.1)
Reserves (14.1) 61.0 125.9
Retained earnings 3,857.5 3,855.1 3,427.1
Total equity attributable to members
of Lendlease Corporation Limited 5,096.1 5,168.8 4,788.7Total equity attributable to unitholders of
Lendlease Trust 1,203.1 1,244.5 1,317.1Total equity attributable to
securityholders 6,299.2 6,413.3 6,105.8
External non controlling interests 129.9 0.9 1.0
Total equity 6,429.1 6,414.2 6,106.8
For
per
sona
l use
onl
y

$m HY18 HY19Cash Flows from Operating Activities
Cash receipts in the course of operations 9,272.3 8,070.8
Cash payments in the course of operations (8,879.1) (8,861.5)
Interest received 6.6 5.8
Interest paid (79.0) (85.2)
Dividends/distributions received 36.3 62.9
Income tax paid in respect of operations (16.7) (17.0)
Net cash provided by/(used in) operating activities 340.4 (824.2)
Cash Flows from Investing Activities
Sale/redemption of investments 63.9 228.1
Acquisition of investments (191.5) (201.4)
Acquisition of/capital expenditure on investment properties (149.5) (18.1)
Net loan repayments from/(to) associates and joint ventures 381.3 (19.8)
Disposal of consolidated entities (net of cash disposed and transaction costs) 430.4 232.3
Disposal of property, plant and equipment 4.8 7.3
Acquisition of property, plant and equipment (39.7) (46.9)
Acquisition of intangible assets (14.9) (24.1)
Net cash provided by investing activities 484.8 157.4
Cash Flows from Financing Activities
Proceeds from borrowings 711.7 3,031.2
Repayment of borrowings (1,074.9) (2,090.6)
Dividends/distributions paid (183.9) (190.2)
Payments for on market buyback of stapled securities - (174.1)
Payments for on market buyback of stapled securities - Dividend Reinvestment Plan - (10.5)
Increase in capital of non controlling interest 21.6 -
Other financing activities (7.4) (0.1)
Net cash (used in)/provided by financing activities (532.9) 565.7
Other Cash Flow Items
Effect of foreign exchange rate movements on cash and cash equivalents 3.7 12.1
Net increase/(decrease) in cash and cash equivalents 296.0 (89.0)
Cash and cash equivalents at beginning of financial period 1,249.2 1,177.1
Cash and cash equivalents at end of financial period 1,545.2 1,088.1
For
per
sona
l use
onl
y

903
5,293 5,744
1,114
2,414
862
Operatingcash flow
Interest andtax paid
Netinvestment
intodevelopment
inventory
Adjustmentfrom investing
cash flow
Underlyingoperatingcash flow
EBITDA
1,255
377
1,659
1,254913
(164)
1,193
9671,055
1,202 1,245
FY14 FY15 FY16 FY17 FY18 HY19
• Lendlease has delivered underlying operating cash
flow of $5.3b from FY14 to HY19
• This represents 92% of Group EBITDA over the period.
Balance relates to a combination of factors including:
– Investment revaluations
– Retirement DMF accruals
– Construction working capital movements
Total conversion against EBITDA of 92%
1. Refer to Financial and Operational Metrics data file for full reconciliation.
2. Movement in development properties inventory, less movement in deferred land payments.
3. Reallocation reflects cash proceeds from sell down of development entities and realised gains on sale of assets not reflected in operating cash flow.
83
• Underlying operating cash flow has been included to
provide a more accurate cash comparator against
Group EBITDA
• $1.1b has been paid in interest and tax
• Since FY14, $2.4b (46%) of the Group’s underlying
operating cash flow has been reinvested into development
inventories2
• $0.9b has been generated from the sell down of
deconsolidated development entities and realised net gain
on sales of assets (classified as statutory investing cash
flow)3
92% conversion
against EBITDA
Cash
conversion105% 39% 157% 104% 73% (197%)
Group
EBITDA
Underlying
Operating
cash flow
For
per
sona
l use
onl
y

$m Statutory Adjustments Underlying
Cash Flows from Operating Activities
Cash receipts in the course of operations 8,070.8 - 8,070.8
Cash payments in the course of operations (8,861.5) 264.51 (8,597.0)
Dividends/distributions received 62.9 - 62.9
Deconsolidation of development entities - 232.32 232.3
Realised gains on sale of assets - 67.03 67.0
Interest received 5.8 (5.8) -
Interest paid (85.2) 85.2 -
Income tax paid in respect of operations (17.0) 17.0 -
Net cash used in operating activities (824.2) 660.2 (164.0)
Cash Flows from Investing Activities
Sale/redemption of investments 228.1 (67.0)3 161.1
Acquisition of investments (201.4) - (201.4)
Acquisition of/capital expenditure on investment
properties(18.1) - (18.1)
Net loan repayments to associates and joint
ventures(19.8) - (19.8)
Disposal of consolidated entities (net of cash
disposed and transaction costs)232.3 (232.3)2 -
Disposal of property, plant and equipment 7.3 - 7.3
Acquisition of property, plant and equipment (46.9) - (46.9)
Acquisition of intangible assets (24.1) - (24.1)
Net investment into development inventory - (264.5)1 (264.5)
Net cash provided by/(used in) investing
activities157.4 (563.8) (406.4)
1. Net investment into development
inventory
Growth in development properties inventory
(net of deferred land payments) is
reclassified as an investing activity
2. Cash proceeds from sell down of
development entities
The proceeds on sale of deconsolidated
development entities is reclassified as an
operating activity, to align with the treatment
of cash flows prior to deconsolidation
3. Realised gains on sale of assets
Lendlease is an active investment manager,
with revaluations included in EBITDA.
Accordingly, gains on disposal (including
crystallised revaluations) are reclassified as
an operating activity
• Underlying operating cash flow is
derived by adjusting statutory cash flows to
better reflect operating cash generated by
the Group from its operating model prior to:
– Payment of interest and tax
– Reinvestment in the Group’s pipeline
For
per
sona
l use
onl
y

1. Engineering and Services.
2. Return on Invested Capital (ROIC) is calculated using the annualised Profit after Tax divided by the arithmetic average of beginning and half year end invested capital.
3. HY19 EBITDA margin for total Construction was (5.4%).
3.6
3.0
5.1
3.4
Development Investments
HY18 HY19
443.0383.1
147.4
(173.5)
260.8 273.2
111.4(473.7)
Development Investments Construction(ex E&S)
Engineeringand Services
HY18 HY19
18.8% 16.5%
3.0%
(11.3%)
7.5%13.6%
2.1%
(31.1%)
Development Investments Construction(ex E&S)
Engineeringand Services
HY18 HY19ROIC EBITDA margin3
312.8258.5
92.3(128.3)
179.7 226.0
75.7(339.4)
Development Investments Construction(ex E&S¹)
Engineeringand Services
HY18 HY19
For
per
sona
l use
onl
y

Revenue ($m) EBITDA ($m) Profit after Tax ($m) Invested capital ($b)
HY18 HY19 HY18 HY19 HY18 HY19 HY18 FY18 HY19
Development 2,028.8 870.4 443.0 260.8 312.8 179.7 3.6 4.3 5.1
Investments 218.5 164.2 383.1 273.2 258.5 226.0 3.0 3.3 3.4
Construction (ex E&S) 4,896.9 5,190.8 147.4 111.4 92.3 75.7
Corporate1 16.7 20.8 (79.4) (88.6) (109.7) (126.3)
Group (ex E&S) 7,160.9 6,246.2 894.1 556.8 553.9 355.1
Engineering and Services 1,536.4 1,524.8 (173.5) (473.7) (128.3) (339.4)
Total Group 8,697.3 7,771.0 720.6 83.1 425.6 15.7
Revenue ($m) EBITDA ($m) Profit after Tax ($m) Invested capital ($b)
HY18 HY19 HY18 HY19 HY18 HY19 HY18 FY18 HY19
Australia (ex E&S)2 3,871.2 2,848.2 758.8 334.2 514.5 258.4 4.1 4.4 4.4
Asia 254.2 238.1 26.9 137.5 16.0 94.9 0.8 0.9 1.1
Europe 483.6 716.2 70.0 60.7 53.9 52.4 0.9 1.2 1.5
Americas 2,535.2 2,422.9 117.8 113.0 79.2 75.7 0.8 1.0 1.1
Corporate1 16.7 20.8 (79.4) (88.6) (109.7) (126.3)
Group (ex E&S) 7,160.9 6,246.2 894.1 556.8 553.9 355.1
Engineering and Services 1,536.4 1,524.8 (173.5) (473.7) (128.3) (339.4)
Total Group 8,697.3 7,771.0 720.6 83.1 425.6 15.7
1. Comprises Group Services and Group Treasury costs. HY19 EBITDA: Group Services ($74.2m) and Group Treasury ($14.4m). HY18 EBITDA: Group Services ($68.9m) and Group
Treasury ($10.5m).
2. Invested capital is inclusive of Engineering and Services.
For
per
sona
l use
onl
y

$m Revenue EBITDA
HY18 HY19 HY18 HY19
Development
Australia 1,844.4 594.9 384.0 71.1
Asia 4.5 9.2 7.7 100.7
Europe 132.7 223.4 59.8 31.3
Americas 47.2 42.9 (8.5) 57.7
Total Development 2,028.8 870.4 443.0 260.8
Construction
Australia (ex E&S) 1,861.8 2,149.5 107.4 64.7
Asia 228.7 200.0 0.5 3.5
Europe 343.1 486.4 10.3 19.1
Americas 2,463.3 2,354.9 29.2 24.1
Construction (ex E&S) 4,896.9 5,190.8 147.4 111.4
Engineering and Services 1,536.4 1,524.8 (173.5) (473.7)
Total Construction 6,433.3 6,715.6 (26.1) (362.3)
Investments
Australia 165.0 103.8 267.4 198.4
Asia 21.0 28.9 18.7 33.3
Europe 7.8 6.4 (0.1) 10.3
Americas 24.7 25.1 97.1 31.2
Total Investments 218.5 164.2 383.1 273.2
Total Operating
Australia (ex E&S) 3,871.2 2,848.2 758.8 334.2
Asia 254.2 238.1 26.9 137.5
Europe 483.6 716.2 70.0 60.7
Americas 2,535.2 2,422.9 117.8 113.0
Operating (ex E&S) 7,144.2 6,225.4 973.5 645.4
Engineering and Services 1,536.4 1,524.8 (173.5) (473.7)
Total Operating 8,680.6 7,750.2 800.0 171.7
443.0
147.4
(173.5)
383.1
260.8
111.4(473.7)
273.2
Development Construction(ex E&S)
Engineeringand Services
Investments
HY18 HY19
758.8
(173.5) 26.9 70.0117.8
334.2
(473.7)
137.560.7
113.0
Australia(ex E&S)
Engineeringand Services
Asia Europe Americas
HY18 HY19
For
per
sona
l use
onl
y

£m1 Revenue EBITDA
HY18 HY19 HY18 HY19
Development 78.3 122.9 35.3 17.2
Construction 202.4 267.5 6.1 10.5
Investments 4.6 3.5 (0.1) 5.7
Total Operating 285.3 393.9 41.3 33.4
US$m Revenue EBITDA
HY18 HY19 HY18 HY19
Development 36.8 30.9 (6.6) 41.5
Construction 1,921.4 1,695.5 22.8 17.4
Investments 19.3 18.1 75.7 22.5
Total Operating 1,977.5 1,744.5 91.9 81.4
SGDm¹ Revenue EBITDA
HY18 HY19 HY18 HY19
Development 4.8 9.1 8.2 99.6
Construction 242.4 198.0 0.5 3.5
Investments 22.3 28.6 19.8 33.0
Total Operating 269.5 235.7 28.5 136.1
1. Major currency in region.
8.2 0.519.8 28.5
99.6
3.5
33.0
136.1
Development Construction Investments Total Operating
HY18 HY19
35.3
6.1(0.1)
41.3
17.210.5
5.7
33.4
Development Construction Investments Total Operating
HY18 HY19
(6.6)
22.8
75.791.9
41.5
17.4 22.5
81.4
Development Construction Investments Total Operating
HY18 HY19
For
per
sona
l use
onl
y

Local Foreign HY181 FY182 HY193
AUD USD 0.78 0.77 0.72
AUD GBP 0.59 0.57 0.55
AUD SGD 1.06 1.04 0.99
Local Foreign HY184 FY185 HY196
AUD USD 0.78 0.74 0.70
AUD GBP 0.58 0.56 0.55
AUD SGD 1.04 1.01 0.96
1. Average foreign exchange rate for the half year 2018.
2. Average foreign exchange rate for the full year 2018.
3. Average foreign exchange rate for the half year 2019.
4. Spot foreign exchange rate at 31 December 2017.
5. Spot foreign exchange rate at 30 June 2018.
6. Spot foreign exchange rate at 31 December 2018.
For
per
sona
l use
onl
y

$m EBITDA Net interest D&A1 PBT Tax PAT
Australia
Development 71.1 (1.6) (1.5) 68.0 (20.3) 47.7
Construction (409.0) 0.8 (15.4) (423.6) 127.3 (296.3)
Investments 198.4 - (2.8) 195.6 (28.0) 167.6
Total Australia (139.5) (0.8) (19.7) (160.0) 79.0 (81.0)
Asia
Development 100.7 - (0.1) 100.6 (32.4) 68.2
Construction 3.5 - (0.3) 3.2 (0.4) 2.8
Investments 33.3 - - 33.3 (9.4) 23.9
Total Asia 137.5 - (0.4) 137.1 (42.2) 94.9
Europe
Development 31.3 3.4 (1.1) 33.6 (6.1) 27.5
Construction 19.1 (0.4) (0.9) 17.8 (3.6) 14.2
Investments 10.3 0.1 (0.1) 10.3 0.4 10.7
Total Europe 60.7 3.1 (2.1) 61.7 (9.3) 52.4
Americas
Development 57.7 - (1.6) 56.1 (19.8) 36.3
Construction 24.1 0.1 (1.8) 22.4 (6.8) 15.6
Investments 31.2 - (0.7) 30.5 (6.7) 23.8
Total Americas 113.0 0.1 (4.1) 109.0 (33.3) 75.7
Corporate
Group Services (74.2) (0.1) (35.2) (109.5) 33.8 (75.7)
Group Treasury (14.4) (54.9) - (69.3) 18.7 (50.6)
Total Corporate (88.6) (55.0) (35.2) (178.8) 52.5 (126.3)
Total Group 83.1 (52.6) (61.5) (31.0) 46.7 15.7
1. Depreciation and amortisation.
For
per
sona
l use
onl
y

HY18 FY18 HY19
Net debt $m 249.7 1,181.8 2,276.3
Borrowings to total equity plus borrowings % 21.8 26.9 35.5
Net debt to total tangible assets, less cash % 1.9 8.2 15.2
Interest cover1 times 12.5 10.7 8.1
Average cost of debt % 4.8 4.8 4.2
Average debt maturity years 5.4 4.6 4.0
Average debt mix fixed: floating ratio 88:12 86:14 59:41
Undrawn facilities $m 2,313.2 1,827.1 1,019.6
1. EBITDA plus interest income, divided by interest finance costs, including capitalised finance costs. HY19 EBITDA has been adjusted to exclude the $500m pre-tax impact from
losses expected to be incurred on underperforming Engineering projects.
For
per
sona
l use
onl
y

1. Values are shown at amortised cost.
2. Values are shown at gross facility value.
1,050
543 582 567
311 304
1,800
543727
567
311 304
Syndicated MultiOption Facility
UK Bond Issue Club RevolvingCredit Facility
US $ Reg. S notes Singapore BondS$300m
Australian mediumterm notes
Drawn Facility
900 900
546
727571
313
225
80
FY20 FY21 FY22 FY23 FY26 FY27 FY28 FY29
Syndicated Multi Option Facility UK Bond Issue Club Revolving Credit Facility US $ Reg. S notes
Singapore Bond S$300m Australian medium term notes Undrawn
For
per
sona
l use
onl
y

Date
HY19 results released to market / interim distribution declared 25 February 2019
Securities quoted ex distribution on the Australian Securities Exchange 1 March 2019
Interim distribution record date 4 March 2019
Interim distribution payable 20 March 2019
FY19 results released to market / final distribution declared 19 August 2019
Annual General Meetings 20 November 2019
For
per
sona
l use
onl
y

Artist’s impression: The Exchange, Darling Square, Sydney
For
per
sona
l use
onl
y

Urbanisation
20 major projects in
10 gateway cities
Communities
15 communities
projects across
Australia
Telco
Infrastructure
Infrastructure
Development
Military
Housing
Apartments Commercial CommunitiesUS Telco
Towers
Australian
Infrastructure
Development
US Military
Housing
Portfolio
Target
1,000 - 2,000
settlements
per annum
Target
2 - 3 buildings
commenced
per annum
Target
3,000 - 4,000
settlements
per annum
Development
marginOrigination fees
Development
fees
31,180 units
$34.5b
1,977,000 sqm
$24.8b
51,361 lots
$15.1b
188 tower
pipeline on
balance sheet
Periodic bids for
PPP projects
Periodic bids for
major projects
1. Revised target for FY19 and beyond following reclassification of internal construction margin to the Development segment. Through-cycle target based on rolling three to five year
timeline.
2. Remaining estimated development end value.
Bu
sin
ess
Retu
rns
an
d M
etr
ics
Pip
elin
e2
For
per
sona
l use
onl
y

• Involved in the development of communities, inner city mixed use
developments, apartments, retirement, commercial assets, and social
and economic infrastructure
• Financial returns are generated via development margins,
development management fees received from external co-investors
and origination fees for the facilitation of infrastructure projects
HY18 HY19
% Operating EBITDA (ex E&S)1 % 46 40
ROIC % 18.8 7.5
Invested capital $b 3.6 5.1
• Apartments for sale settlements3: 145 units
Profit contribution from Elephant Park apartments
Skew to H2 with c.1,500 apartments expected to settle
• Communities settlements: 908 lots, down 49%
We anticipate annual settlements in FY19 to be below the
target range
• Profit contribution from Paya Lebar Quarter: $111.5m
Practical completion of 83,000 sqm office component
Revenue on residential apartments recognised on percent
complete
• US residential investment partnership: $72.5m profit
Three buildings across Southbank, Chicago and Clippership
Wharf, Boston
• Profit on Barangaroo South retail following stabilisation of a number of
assets and shift to Investments segment
• Profit contribution from completion of 25 King4, Brisbane
• US telecommunication towers – expect H2 skew to FY19 completions
• Two new major urbanisation projects secured
Victoria Cross, Sydney: $1.1b5
Lakeshore East, Chicago: $2.1b5
o First phase of residential for rent and residential for sale
delivered in partnership with FSS
• 845 West Madison, Chicago into delivery: $0.5b5
• Post balance date origination
Preferred partner for Birmingham Smithfield $2.7b
Preferred partner for Thamesmead Waterfront $14.5b
• $74.5b development pipeline6, up 31%
23 major apartment buildings in delivery across seven gateway
cities
o 3,004 units presold in delivery: $3.4b
o 1,985 units for rent in delivery: $1.8b5
3,266 communities lots presold: $0.9b
359,000 sqm of commercial space in delivery across eight
major buildings
Remaining secured pipeline
o 26,191 apartment units: $29.6b6
o 1,618,000 sqm of commercial space: $19.9b6
1. Operating EBITDA including Engineering and Services is $171.7m, excluding
Engineering and Services is $645.4m.
2. Comparative period the half year ended 31 December 2017.
3. On adoption of AASB 15 from 1 July 2018, the recognition point of revenue (and
associated units) on residential for sale development properties changed to
settlement in Australia, Europe and Americas.
4. Forward sold in FY17, profit on completion.
5. Total estimated development end value.
6. Remaining estimated development end value.
For
per
sona
l use
onl
y

1. Remaining estimated development end value.
2. FY18 and HY19 exclude Australian Retirement pipeline which is now included in the Investments segment following the Retirement Living transaction.
3. Includes $0.1b of Infrastructure pipeline.
Urbanisation
Pipeline
28%
8%
51%
13%
$59.3b
Australia Asia Europe Americas
12.7 12.1 11.5 14.7 15.1 15.1
25.032.8 37.3 34.6
55.9 59.337.744.9
48.8 49.3
71.1³74.5³
FY14 FY15 FY16 FY17 FY18 HY19
Communities² Urbanisation
31.5
6.213.2
5.8
56.7
31.1
5.4
30.1
7.9
74.5
Australia Asia Europe Americas Total
HY18 HY19
384.0
7.7
59.8
(8.5)
443.0
71.1100.7
31.357.7
260.8
Australia Asia Europe Americas Total
HY18 HY19
For
per
sona
l use
onl
y

1. On adoption of AASB 15 from 1 July 2018, the recognition point of revenue (and associated units) on residential for sale development properties changed to settlement in Australia,
Europe and Americas.
2. Following inclusion of Australian Retirement Living sales in the Investments segment, rounding of $1m was removed from NSW.
HY18 HY19
Units $m Units $m
QLD 717 145 173 33
NSW 379 149 294 65
VIC 587 127 357 83
SA 49 6 43 7
WA 48 11 41 9
Total 1,780 438 908 197
HY18 HY19
Units $m Units $m
QLD 557 119 313 72
NSW 260 1012 121 66
VIC 773 189 413 112
SA 47 8 61 9
WA 89 22 35 7
Total 1,726 439 943 266
Units $m
Total Australia 8 7
Elephant Park - West Grove (Buildings 1 and 2) 129 108
Wandsworth - Victoria Drive 7 13
Other 1 1
Total Europe 137 122
Total settlements 145 129
For
per
sona
l use
onl
y
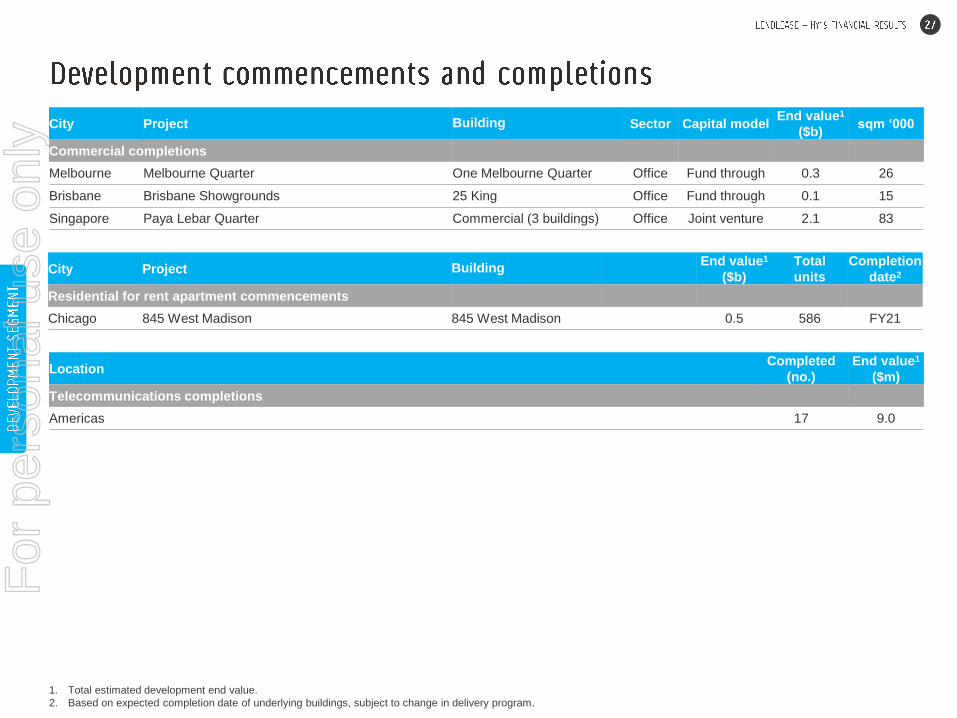
City Project Building Sector Capital modelEnd value1
($b)sqm ‘000
Commercial completions
Melbourne Melbourne Quarter One Melbourne Quarter Office Fund through 0.3 26
Brisbane Brisbane Showgrounds 25 King Office Fund through 0.1 15
Singapore Paya Lebar Quarter Commercial (3 buildings) Office Joint venture 2.1 83
1. Total estimated development end value.
2. Based on expected completion date of underlying buildings, subject to change in delivery program.
City Project BuildingEnd value1
($b)
Total
units
Completion
date2
Residential for rent apartment commencements
Chicago 845 West Madison 845 West Madison 0.5 586 FY21
LocationCompleted
(no.)
End value1
($m)
Telecommunications completions
Americas 17 9.0
For
per
sona
l use
onl
y

0.7 0.8 0.8
0.50.5
1.01.2
1.3
0.5 - - 1.8
HY18 FY18 Commence-ments
Completions FX andOther
HY19
Europe Americas
1. Includes 100% of revenue from joint venture projects.
2. On adoption of AASB 15 from 1 July 2018, the recognition point of revenue (and
associated units) on residential for sale development properties changed to settlement
in Australia, Europe and Americas.
663 663 663
850 8501,322
1,513 1,513
586 - (114)1,985
HY18 FY18 Commence-ments
Completions Other³ HY19
Europe Americas
1,769 1,801 1,820
210 386 412
1,2281,243 1,230
88100 1213,295
3,530198 (145) 3,583
HY18 FY18 Sales Settlements² HY19
Australia Asia Europe Americas
1,894 1,918 1,933
226 464 538865
885 861113169 2833,098
3,436238 (129) 70 3,615
HY18 FY18 Sales Settlements² FX andOther
HY19
Australia Asia Europe Americas
3. Clippership Wharf - Building 4 has been repurposed as an apartment for sale product.
4. Total estimated development end value.
For
per
sona
l use
onl
y

1. Includes 100% of revenue from joint venture projects.
2. On adoption of AASB 15 from 1 July 2018, the recognition point of revenue (and associated units) on residential for sale development properties changed to settlement in Australia.
3,842
3,231
943 (908)
3,266
HY18 FY18 Sales Settlements² HY19
949
813
266 (198)
881
HY18 FY18 Sales Settlements² HY19
For
per
sona
l use
onl
y

1. Major buildings in delivery only, reflecting total presales of $3.4b.
2. The recognition point of revenue on residential for sale development properties is settlement in Australia, Europe and Americas. Delivery date is subject to change in delivery
program.
3. Customer origin is not available for presold units on apartment buildings in Americas.
Apartment
Presales
by Customer
67%
22%
11%
Local China Other offshore38%
8%
4%
6%
3%
11%
16%
11%
3%
19% 18%
Sydney Melbourne Singapore London New York Boston
H2 FY19 FY20 FY21
For
per
sona
l use
onl
y

2 - 3
buildings
commenced
3,004 presold units and 1,985 units for rent across 23 major apartment buildings3 in delivery, with expected delivery H2 FY19 to FY21
8 major buildings6 in delivery, with expected completion H2 FY19 to FY22
1. Remaining estimated development end value. Includes Infrastructure.
2. Subject to market conditions.
3. Refer to the Apartments Settlement Profile on page 33 for a breakdown of the major buildings.
4. Presales balance on major buildings in delivery only.
5. Total estimated development end value of c.$1.8b, with c.$0.3b realised to date.
6. Refer to the Commercial Buildings Completion Profile on page 34 for a breakdown of the major buildings.
7. Total estimated development end value of c.$6.1b, with c.$1.2b realised to date.
8. Includes Asian retirement development units.
Target
annual
turnover2
3,000 - 4,000
settlements
1,000 - 2,000
settlements
$74.5 billionTotal pipeline1
3,004 Unitspresold⁴
1,985 Units for rent 26,191 Units remaining 31,180 Units
359,000 sqm in delivery 1,618,000 sqm remaining 1,977,000 sqm
$4.9b⁷ in delivery $19.9b remaining $24.8b
3,266 Lotspresold
48,095 Lots remaining 51,361 Lots
$0.9b presold $14.2b remaining $15.1b
$3.4b presold⁴
$1.5b⁵for rent
$29.6b remaining $34.5b
For
per
sona
l use
onl
y

1. Includes forecast commencement dates, subject to change in delivery program.
2. Based on expected completion date of underlying buildings, subject to change in delivery program.
3. Floor space measured as Net Lettable Area.
4. Remaining estimated development end value.
Region ProjectProject
secured
Delivery
commenced1
Completion
date2
Residential
backlog
units
Commercial
backlog
sqm ‘0003
Remaining
end value
($b)4
Land payment
model
Australia Barangaroo South, Sydney FY09 FY12 FY24 808 16 3.7 Staged payment
Victoria Harbour, Melbourne FY01 FY04 FY27 2,331 47 2.5 Land management
Melbourne Quarter FY13 FY16 FY25 1,488 123 2.2 Land management
Brisbane Showgrounds FY09 FY11 FY33 2,280 67 2.2 Land management
Circular Quay Tower, Sydney FY12 FY17 FY22 - 57 1.8 Upfront payment
Darling Square, Sydney FY13 FY13 FY19 967 5 1.4 Staged payment
Waterbank, Perth FY13 FY20 FY29 1,301 12 1.3 Land management
Victoria Cross, Sydney FY19 FY22 FY25 - 58 1.1 Staged payment
Asia The Lifestyle Quarter, Kuala Lumpur FY14 FY17 FY26 2,326 122 3.1 Staged payment
Paya Lebar Quarter, Singapore FY15 FY16 FY20 429 29 1.7 Upfront payment
Europe Euston Station, London FY18 FY26 FY40+ 2,000 400 10.5 Land management
Silvertown Quays, London FY18 FY20 FY32 3,000 440 6.4 Land management
Milano Santa Giulia, Milan FY18 FY19 FY35 2,558 253 3.8 Land management
Elephant Park, London FY10 FY12 FY25 1,921 13 2.9 Staged payment
International Quarter London FY10 FY14 FY26 - 199 2.6 Land management
High Road West, London FY18 FY19 FY29 2,501 14 2.0 Land management
The Timberyard, Deptford, London FY14 FY16 FY24 1,132 7 1.2 Upfront payment
Americas Lakeshore East, Chicago FY19 FY19 FY26 1,208 2 2.1 Staged payment
Southbank, Chicago FY15 FY16 FY26 1,880 2 2.0 Upfront payment
30 Van Ness, San Francisco FY17 FY21 FY24 358 25 1.4 Upfront payment
Other urbanisation projects 2,692 86 3.4
Total urbanisation 31,180 1,977 59.3
For
per
sona
l use
onl
y

1. Closing presales balance as at 31 December 2018.
2. On adoption of AASB 15 from 1 July 2018, the recognition point of revenue (and associated units) on residential for sale development properties changed to settlement in Australia,
Europe and Americas. Delivery date is subject to change in delivery program.
3. Project information subject to joint venture confidentiality.
4. Affordable housing units presold within apartment for rent buildings.
5. Based on expected completion date of underlying buildings, subject to change in delivery program. Not indicative of cash or profit recognition.
6. Following the sell down to First State Super, ownership has decreased to 50.1% for Cooper at Southbank and 50.0% for Clippership Wharf Buildings 1 and 2.
City Project BuildingTotal
unitsOwnership Presold
Units
presold1
Presales1
($b)
Delivery
date2
Residential for sale apartments
Sydney Darling SquareDarling North, Harbour Place and
Trinity House577 100% 100% 577 0.8 FY19
Darling Rise, Barker House and
Arena390 100% 100% 390 0.5 FY19
Melbourne Victoria Harbour Collins Wharf 1 321 100% 91% 292 0.3 FY19
London Wandsworth Victoria Drive (remaining sections) 61 50% 7% 4 - FY19
New York Fifth Avenue 277 Fifth Avenue 130 40% -3 -3 -3 FY19
Boston Clippership Wharf Building 3 80 100% 100% 80 0.1 FY19
Melbourne Melbourne Quarter East Tower 719 50% 77% 552 0.4 FY20
Singapore Paya Lebar Quarter Residential (3 Buildings) 429 30% 96% 412 0.5 FY20
London Elephant ParkWest Grove (Buildings 1 and 2)
(remaining sections)405 100% 78% 317 0.4
FY19
FY20
London Deptford Cedarwood Square 203 100% 85% 173 0.1 FY20
London Elephant Park East Grove and Park Central North4 166 100% 100% 166 0.1 FY21
City Project BuildingTotal
unitsOwnership
Delivery
date5
Residential for rent apartments
Chicago Southbank Cooper at Southbank 452 50%6 FY19
Boston Clippership Wharf Buildings 1 and 2 284 50%6 FY19
London Elephant Park East Grove and Park Central North 663 20% FY21
Chicago 845 West Madison 845 West Madison 586 37.5% FY21For
per
sona
l use
onl
y

1. Floor space measured as Net Lettable Area.
2. Based on expected completion date of underlying buildings, subject to change in delivery program. Not indicative of cash or profit recognition.
3. A funding model structured through a forward sale to a capital partner resulting in staged payments prior to building completion.
4. Build, Own, Operate, Transfer.
City Project Capital model sqm '0001 Building Completion date2
Melbourne Victoria Harbour Fund through3 39 839 Collins Street FY19
Sydney Barangaroo South Fund through3 11 Daramu House FY20
Singapore Paya Lebar Quarter Joint venture 29 Retail FY20
London International Quarter London Fund through3 26 Commercial building FY20
Melbourne Melbourne Quarter Fund through3 50 Two Melbourne Quarter FY21
MelbourneMelbourne Connect (formerly University of
Melbourne Innovation Precinct)BOOT4 27 Melbourne Connect FY21
Sydney Circular Quay Tower Joint venture 55 Circular Quay Tower FY22
Kuala Lumpur The Lifestyle Quarter Joint venture 122 Retail FY22
Total 359
For
per
sona
l use
onl
y

City Project # Buildings Sector sqm ‘0001 H2 FY19 FY20 FY21 FY22 FY23
Melbourne Melbourne Quarter 2 Office/Retail 69
Sydney Victoria Cross 1 Office 58
Brisbane Brisbane Showgrounds 1 Office 30
Milan Milano Santa Giulia 6 Office/Retail 191
London International Quarter London 5 Office 173
San Francisco 30 Van Ness 1 Office 25
Total 16 546
1. Floor space measured as Net Lettable Area.
City Project Units H2 FY19 FY20 FY21 FY22 FY23
London Elephant Park 118
London The Timberyard, Deptford 251
London High Road West 687
London Silvertown Quays 450
Chicago Southbank 631
Chicago Lakeshore East 503
Total 2,640
For
per
sona
l use
onl
y

Project Location Land payment modelCompletion
date1
Residential
backlog land
lots2
Commercial
backlog
sqm ‘0003
Communities
Yarrabilba QLD Staged payment FY47 14,190 2,005
Elliot Springs QLD Land management FY61 10,635 1,050
Springfield Lakes QLD Land management FY26 3,340 22
Shoreline QLD Land management FY34 2,890 95
Calderwood Valley NSW Land management FY36 3,640 152
Gilead NSW Staged payment FY32 1,590 96
Bingara Gorge NSW Land management FY26 1,160 79
St Marys - Jordan Springs NSW Upfront payment FY22 835 296
The New Rouse Hill NSW Land management FY21 450 -
Atherstone VIC Land management FY25 3,420 86
Harpley VIC Land management FY27 2,630 358
Aurora VIC Staged payment FY26 2,100 145
Blakes Crossing SA Upfront payment FY20 200 17
Alkimos WA Land management FY26 1,225 28
Alkimos Vista WA Land management FY24 560 -
Horizon Uptown Americas Upfront payment FY33 1,617 -
Other Communities 1 -
Subtotal 50,483 4,429
Retirement Asia 878
Total 51,361 4,429
1. The expected financial year in which the last land lot will be settled. Based on expected completion of underlying land lots, subject to change in delivery program.
2. Estimated backlog (including Retirement units) includes the total number of units in Group owned, Joint Venture and managed projects. The actual number of units for any particular
project can vary as planning approvals are obtained.
3. Net developable land in relation to master-planned urban communities. The actual land area for any particular project can vary as planning approvals are obtained.
For
per
sona
l use
onl
y

1. Typical funding models used across segment examples.
2. Based on apartment projects delivered 100% on-balance sheet.
3. Only where Construction and / or Investments segments are engaged to play a role in the project.
Communities
Urbanisation
Apartments for Sale Forward sale Joint venture structure
Project
examples
• St Marys - Jordan Springs,
Sydney
• Yarrabilba, Brisbane
• Darling Square, Sydney
• Elephant Park, London
• Office: Daramu House,
Barangaroo South, Sydney
• Residential for rent: Cooper
at Southbank, Chicago and
Clippership Wharf
Buildings 1 and 2, Boston
• Paya Lebar Quarter,
Singapore
• Circular Quay Tower,
Sydney
Land
funding1
• Land ownership
• Land management
• Staged payments
• Land management
• Staged payments
• Land management
• Staged payments
• Land ownership via joint
venture (including project
financing)
Production
funding1 • 100% on-balance sheet• Largely 100% on-balance
sheet
• Capital partner progress or
staged payments
• Funded via joint venture
(including project financing)
P&L returns
• Development profit on sold
product at settlement from
1 July 2018
• Development profit on sold
product at settlement from
1 July 2018
• Construction margin on
settlement2
• Development profit typically
upfront at time of sale
• Development management
fees, construction margin3
and investment
management fees3 during
delivery
• Development profit tied to
equity interests
• Development management
fees, construction margin3
and investment
management fees3
(including performance
fees) during delivery
Cash returns
(Development
only)
• On settlement • On settlement• Over life of project during
delivery
• Linked to cash equity
returns or sell down of
investment typically post
practical completion
For
per
sona
l use
onl
y

1. Options are not discrete rather are on a continuum. Combinations of multiple options are therefore possible. Where agreements are in place with local or central government,
contributions to social infrastructure, affordable housing or other costs may be provided in addition to or in lieu of direct land value.
Land payment
modelUpfront payment Staged payment Land management
OptionOutright land
purchaseFixed payments
Discretionary draw
downResidual land value Overage
When pricing is
finalisedUpfront Upfront Upfront
On draw down
of each phase
At development
completion
Payment / draw
down timingUpfront Staged
On draw down
of each phase
On draw down
of each phase
At development
completion
Description • Land acquired and
fully transferred to
the Developer
upfront
• Land price and timing agreed upfront
• Transfer of land plots may occur upfront, or, be staged to match payment schedule
• Land price agreed upfront at either a fixed value or percentage of end value
• Draw down of land plots at Developer discretion within longstop dates
• Developer return metrics agreed upfront
• Land value calculated at phase draw down; referral to independent expert if required
• Draw down of land plots at Developer discretion within sunset dates
• Developer earns a priority return, above which overage is shared with the Land Owner
• May include a fixed minimum amount payable to the Land Owner in advance
More price certainty to
land owner
More development risk and
value share to land owner
1 2 3 4 5
For
per
sona
l use
onl
y

Image: 25 King, Brisbane
For
per
sona
l use
onl
y

Reg
ion
Rev
en
ue last
6 m
on
ths
Backlo
g
realisati
on
Backlo
g
rev
en
ue
Construction (excl. Engineering and Services) Engineering Services
Australia Asia Europe Americas Australia Australia
$2.1b $0.2b $0.5b $2.4b $1.1b $0.4b
H2 FY19 27%
FY20 37%
Post FY20 36%
H2 FY19 39%
FY20 53%
Post FY20 8%
H2 FY19 44%
FY20 45%
Post FY20 11%
H2 FY19 33%
FY20 42%
Post FY20 25%
H2 FY19 27%
FY20 33%
Post FY20 40%
$6.6b $0.8b $1.2b $6.2b $5.0b $1.6b
1. Revised target for FY19 and beyond following the decision that Engineering and Services is non-core.
2. Construction backlog excluding Engineering and Services is $14.8b.
For
per
sona
l use
onl
y

• Provides project management, design and construction services,
predominantly in the defence, mixed use, commercial and residential
sectors
• Financial returns are generated via project management and
construction management fees, in addition to construction margin
Construction
(ex E&S)Construction
HY18 HY19 HY18 HY19
% Operating EBITDA1 % 15 18
EBITDA margin % 3.0 2.1 (0.4) (5.4)
New Work Secured $b 5.4 4.3 8.8 6.7
Backlog Revenue $b 15.8 14.8 22.4 21.4
• EBITDA loss of $362.3m, impacted by the Engineering provision
Building
Global: Diversity by sector, client and region
Revenue of $5.2b
EBITDA of $111.4m, EBITDA margin 2.1%
Australia: Consistently solid profit contribution
Revenue of $2.1b, EBITDA margin 3.0%
Asia: Focus remains on internal pipeline
Revenue down 13% to $0.2b, EBITDA margin 1.8%
Europe: Contribution from higher margin contracts in the period
Revenue up 42% to $0.5b, EBITDA margin 3.9%
Americas: Activity moderating, internal pipeline growing
Revenue down 4% to $2.4b, EBITDA margin 1.0%
Engineering and Services
• HY19 EBITDA loss of $473.7m includes a $500m pre-tax impact from
expected losses on underperforming projects
• Revenue of $1.5b
• Construction segment will comprise Building businesses only in future
periods
• Strategic review of Engineering and Services
Not critical for future success of integrated business model
Best interests of clients, employees and securityholders to
consider alternatives
Building
• Diversity by sector, client and region
• New work secured of $4.3b
Australia $2.2b, Americas $1.8b
• Backlog revenue of $14.8b
Australia $6.6b, Americas $6.2b
• Preferred bidder status of c.$10b including
Australia: Circular Quay Tower, multiple Defence contracts
Asia: The Lifestyle Quarter - Residential
Europe: Birmingham Commonwealth Games – Athletes Village
Engineering and Services
• New work secured of $2.4b
• Backlog revenue of $6.6b
Engineering $5.0b and Services $1.6b
1. Operating EBITDA including Engineering and Services is $171.7m, excluding
Engineering and Services is $645.4m.
2. Comparative period the half year ended 31 December 2017.
For
per
sona
l use
onl
y

6.1
10.5
HY18 HY19
22.8
17.4
HY18 HY19
1. Major currency in region.
HY18 HY19
Construction (ex E&S) 147.4 111.4
Construction (26.1) (362.3)
HY18 HY19
Construction (ex E&S) 3.0% 2.1%
Construction (0.4%) (5.4%)
107.4
(173.5) 0.5 10.3 29.264.7
(473.7) 3.5 19.1 24.1
Australia(ex E&S)
Engineeringand Services
Asia Europe Americas
HY18 HY19
5.8%
(11.3%)
0.2%3.0% 1.2%3.0%
(31.1%)
1.8% 3.9%1.0%
Australia(ex E&S)
Engineeringand Services
Asia Europe Americas
HY18 HY19
For
per
sona
l use
onl
y

1. Construction backlog revenue in Australia excluding Engineering and Services is $6.6b, $6.6b (31%) for Engineering and Services.
2. Includes all Construction projects with backlog greater than $100m, which represents 79% ($17.0b) of secured backlog.
13%
29%58%
Lendlease Corporate Government
Major Project2
Backlog
Revenue
13.2 13.7 15.2 15.7 15.2 14.8
3.0 3.6
5.5 4.9 5.9 6.6 16.2 17.3
20.7 20.6 21.1 21.4
FY14 FY15 FY16 FY17 FY18 HY19
Construction (ex E&S) Engineering and Services
31%
23%8%
11%
13%
8%6%
Transport Residential Hotel/Entertainment
Defence Commercial Social Infrastructure
Other
Major Project2
Backlog
Revenue
Backlog
Revenue 62%
4%
5%
29%
$21.4b
Australia¹ Asia Europe Americas
For
per
sona
l use
onl
y

$b Australia Asia Europe Americas Total
HY18 HY19 HY18 HY19 HY18 HY19 HY18 HY19 HY18 HY19
Building 2.8 2.2 0.1 0.2 1.0 0.1 1.5 1.8 5.4 4.3
Engineering 3.0 2.0 3.0 2.0
Services 0.4 0.4 0.4 0.4
Total new work secured revenue 6.2 4.6 0.1 0.2 1.0 0.1 1.5 1.8 8.8 6.7
1. Total revenue to be earned from projects secured during the period, rounded to the nearest $100m.
2. Current period backlog revenue is the total revenue expected to be earned from projects in future financial periods, based on the average foreign exchange rate for that period.
Although backlog revenue is realised over several periods, the average foreign exchange rate for the current period has been applied to the closing backlog revenue balance in its
entirety, as the average rates for later years cannot be predicted.
3. Australia excluding Engineering and Services has a backlog realisation of 27% H2 FY19, 37% FY20 and 36% post FY20.
4. Construction excluding Engineering and Services has a backlog realisation of 31% H2 FY19, 41% FY20 and 28% post FY20.
$b Australia Asia Europe Americas Total
HY18 HY193 HY18 HY19 HY18 HY19 HY18 HY19 HY18 HY194
Building 7.2 6.6 0.6 0.8 1.5 1.2 6.5 6.2 15.8 14.8
Engineering 5.0 5.0 5.0 5.0
Services 1.6 1.6 1.6 1.6
Total backlog revenue 13.8 13.2 0.6 0.8 1.5 1.2 6.5 6.2 22.4 21.4
Backlog realisation (%)
Next 6 months 29 27 41 39 20 44 36 33 31 30
6 - 18 months 38 35 9 53 42 45 34 42 36 38
Beyond 18 months 33 38 50 8 38 11 30 25 33 32
Total backlog realisation 100 100 100 100 100 100 100 100 100 100
For
per
sona
l use
onl
y

1. Ratio calculated as new work secured over revenue realised to the nearest million.
2. Construction backlog revenue in Australia excluding Engineering and Services is $6.6b, $6.6b for Engineering and Services.
22.421.1
6.7 (6.7)
0.3 21.4
Book to bill¹: 1.0
HY18 FY18 New worksecured
Revenuerealised
FX andOther
HY19
1.5 1.50.1 (0.5)
0.1 1.2
Book to bill¹: 0.2
HY18 FY18 New worksecured
Revenuerealised
FX andOther
HY19
6.5 6.3
1.8 (2.4)
0.5 6.2
Book to bill¹: 0.8
HY18 FY18 New worksecured
Revenuerealised
FX andOther
HY19
13.812.4
4.6 (3.7)
(0.1) 13.2²
Book to bill¹: 1.3
HY18 FY18 New worksecured
Revenuerealised
Other HY19
For
per
sona
l use
onl
y

1. Disclosure of major projects is subject to client approval. This could impact the projects available for disclosure.
2. Backlog revenue as at 31 December 2018 for the projects listed totals $4.9b, representing 74% of total Australia Building backlog revenue.
3. Contract types are Managing Contractor (MC), Lump Sum (LS), Design and Construct (D&C) and Construction Management (CM).
4. Based on expected completion date of underlying buildings, subject to change in delivery program.
5. Excludes new commercial buildings, pedestrian connections and retail space as these are commercial in confidence.
Project LocationContract
type3
Contract value
($m)
Secured
date
Completion
date4 Sector
Crown Sydney Hotel Resort NSW MC 1,079.4 FY15 FY21 Hotel/Entertainment
New Air Combat Capability - RAAF Williamtown NSW MC 853.9 FY15 FY19 Defence
AIR 7000 Phase 2B SA MC 470.0 FY16 FY20 Defence
Victoria Cross Integrated Station Development NSW D&C 465.5 FY19 FY24 Transport
Osborne Naval Shipbuilding Project (Surface Ships) SA MC 448.2 FY18 FY20 Defence
New Air Combat Capability - RAAF Tindal NT MC 429.5 FY16 FY20 Defence
HMAS Cerberus - Delivery Phase VIC MC 426.8 FY18 FY25 Defence
ADF Air Traffic Control Complex Infrastructure Project National MC 384.9 FY16 FY20 Defence
Sydney Metro Martin Place Integrated Station Development NSW D&C 378.65 FY19 FY24 Social Infrastructure
Melbourne Connect (formerly Carlton Connect Initiative) VIC D&C 307.6 FY18 FY21 Other
Sunshine Plaza Redevelopment QLD LS 307.1 FY17 FY19 Other
Western Sydney Stadium NSW LS 288.3 FY17 FY19 Hotel/Entertainment
60 Martin Place NSW LS 281.5 FY16 FY20 Commercial
Melbourne Quarter - Two Melbourne Quarter VIC D&C 278.5 FY18 FY21 Commercial
130 Lonsdale Street VIC D&C 277.6 FY18 FY20 Commercial
Darling Square - Darling North, Harbour Place and Trinity House NSW CM 277.6 FY16 FY19 Residential
Melbourne Quarter - East Tower VIC D&C 275.1 FY18 FY20 Residential
Stage 2 Garden Island Critical Works Delivery Phase NSW MC 268.0 FY19 FY25 Defence
Gosford Hospital Redevelopment NSW LS 253.3 FY16 FY19 Social Infrastructure
Land 121 Stage 2 Unit Sustainment Facilities National MC 253.1 FY16 FY20 Defence
Victoria Harbour - 839 Collins Street VIC LS 251.3 FY17 FY19 Commercial
Australian National University Union Court Redevelopment ACT D&C 247.5 FY18 FY19 Social Infrastructure
Growler Airbourne Attack Facility Phase 1 & 2 Project QLD/NT MC 239.4 FY16 FY20 Defence
Rod Laver Arena VIC MC 225.5 FY16 FY20 Hotel/Entertainment
Joan Kirner Women's and Children's Hospital VIC MC 209.3 FY16 FY20 Social Infrastructure
Darling Square - Darling Rise, Barker House and Arena NSW CM 196.7 FY17 FY19 Residential
Silverwater Correctional Facility Expansion NSW D&C 196.5 FY18 FY21 Social Infrastructure
BaptistCare SAHF NSW D&C 184.6 FY17 FY20 Residential
Monash University Technology Education Building VIC D&C 153.3 FY19 FY20 Social Infrastructure
Goulburn Valley Health (previously Hospital) Shepparton Redevelopment VIC MC 149.4 FY18 FY21 Social Infrastructure
Delamere Air Weapons Range & Growler Mobile Threat Training Emitter NT MC 134.4 FY17 FY19 Defence
South Coast Correctional Centre Nowra NSW LS 133.8 FY17 FY19 Social Infrastructure
Cessnock Correctional Facility Expansion NSW D&C 106.2 FY18 FY20 Social Infrastructure
For
per
sona
l use
onl
y

1. Disclosure of major projects is subject to client approval. This could impact the projects available for disclosure.
2. Backlog revenue as at 31 December 2018 for the projects listed totals $4.5b, representing 90% of the total Australia Engineering backlog revenue.
3. Contract types are Managing Contractor (MC), Design and Construct (D&C), Alliance (ALL) and Construction Only (CON).
4. Based on expected completion date of infrastructure, subject to change in delivery program.
5. Contract value is subject to commercial in confidence and not available for disclosure.
6. As per Jun-18 disclosure. Latest project details are commercial in confidence.
Project LocationContract
type3
Contract value
($m)Secured date
Completion
date4Sector
Melbourne Metro Tunnel Project VIC D&C 1,746.7 FY18 FY24 Transport
NorthConnex M1 / M2 Tunnel NSW D&C 1,313.3 FY15 FY20 Transport
WestConnex 3A M4-M5 Link NSW D&C n/a5 FY19 FY23 Transport
Northern Connector SA D&C 885.0 FY16 FY20 Transport
Gateway Upgrade North QLD D&C 692.0 FY16 FY19 Transport
Caulfield to Dandenong VIC ALL 564.0 FY16 FY20 Transport
Kingsford Smith Drive6 QLD D&C 500.6 FY16 FY20 Transport
Northern Road 2 NSW CON 394.6 FY17 FY20 Transport
Gawler Rail Electrification SA D&C 304.8 FY18 FY20 Transport
Woolgoolga to Ballina - Section 10 & 116 NSW CON 273.0 FY18 FY19 Transport
Northern Road 3 NSW D&C 215.0 FY16 FY20 Transport
Ballarat Line Upgrade VIC ALL 212.3 FY18 FY20 Transport
Stage 1 Garden Island Delivery Phase NSW MC 200.7 FY18 FY22 Defence
Southern Program Alliance VIC ALL 197.8 FY18 FY21 Transport
Gateway / Pacific Motorway Merge QLD D&C 151.8 FY18 FY20 Transport
For
per
sona
l use
onl
y

Project LocationContract
type3
Contract value
($m)
Secured
date
Completion
date4Sector
Elephant Park - West Grove London D&C 393.3 FY16 FY20 Residential
Elephant Park - Park Central North London D&C 288.9 FY18 FY21 Residential
1 Triton Square London D&C 263.3 FY17 FY20 Commercial
Elephant Park - East Grove London D&C 244.4 FY18 FY21 Residential
International Quarter London - Building 3 London D&C 193.4 FY17 FY20 Commercial
245 Hammersmith Road London D&C 187.3 FY17 FY19 Commercial
Manchester New Square Manchester D&C 150.5 FY18 FY21 Residential
Google European HQ London CM 132.6 FY18 FY21 Commercial
The Timberyard, Deptford - Cedarwood Square London D&C 122.0 FY17 FY20 Residential
Project LocationContract
type3
Contract value
($m)
Secured
date
Completion
date4Sector
Paya Lebar Quarter Singapore GMP 860.5 FY16 FY20 Commercial and Residential
The Lifestyle Quarter – Retail Kuala Lumpur MC 521.9 FY18 FY22 Commercial
1. Disclosure of major projects is subject to client approval. This could impact the projects available for disclosure.
2. Backlog revenue as at 31 December 2018 for the projects listed totals $664m (Asia) and $1.0b (Europe), representing 80% (Asia) and 83% (Europe) of total backlog revenue for
these regions.
3. Contract types are Managing Contractor (MC), Guaranteed Maximum Price (GMP), Design and Construct (D&C) and Construction Management (CM).
4. Based on expected completion date of underlying buildings, subject to change in delivery program.
For
per
sona
l use
onl
y

Project LocationContract
type3
Contract value
($m)
Secured
date
Completion
date4Sector
Jacob K. Javits Convention Center New York LS 867.4 FY17 FY21 Hotel/Entertainment
520 Park Avenue New York GMP 443.0 FY14 FY19 Residential
New York Methodist Hospital New York CM 435.4 FY16 FY19 Social Infrastructure
277 Fifth Avenue New York CM 298.7 FY17 FY19 Residential
Clippership Wharf Boston GMP 260.9 FY16 FY20 Residential
Avalon - 1865 Broadway New York CM 257.1 FY16 FY19 Residential
Half and N Street Washington, D.C. GMP 165.1 FY17 FY20 Residential
1. Disclosure of major projects is subject to client approval. This could impact the projects available for disclosure.
2. Backlog revenue as at 31 December 2018 for the projects listed totals $1.0b, representing 16% of total Americas backlog revenue.
3. Contract types are Guaranteed Maximum Price (GMP), Lump Sum (LS) and Construction Management (CM).
4. Based on expected completion date of underlying buildings, subject to change in delivery program.
For
per
sona
l use
onl
y

Artist’s impression: Sunshine Plaza Mall, Maroochydore
For
per
sona
l use
onl
y

Ownership EarningsCapital intensive activities
Co-investment
positions in
managed funds
$1.7b
Retirement
Living
$1.4b
US Military
Housing
$209.3m
US Telco
Infrastructure
$163.0m
Distributions
and capital
growth
Equity
investment
returns
Equity
investment
returns
Income and
capital growth
High quality
assets,
diversified
across sectors
and geography
Occupancy
rate, turnover
rate, growth
rate, discount
rate and opex
Occupancy
rate, growth
rate, discount
rate and opex
Number of
operators per
tower, lease
term, growth
rate and
discount rate
Operating EarningsCapital light activities
Funds
Management
Platform
$34.1b
FUM
Retail Asset
Management
$13.3b AUM
Military
Housing
$13.3b AUM
52,595 units
Funds
management
fees
% of FUM
Property and
development
management
fees
% of value
driver
Asset, property
and
development
management
fees
% of SPV
revenue
FUM growth
and opex
Asset
performance,
leasing and
development
activity, AUM
growth and
opex
Rent growth,
development
activity and
opex
1. Through-cycle target based on rolling three to five year timeline.
Inv
este
d c
ap
ital
Retu
rns a
nd
Metr
ics
Valu
e d
riv
ers
FU
M / A
ssets
Retu
rns a
nd
Metr
ics
Valu
e d
riv
ers
For
per
sona
l use
onl
y

• Ownership earnings $203.6m
Co-investments
o Income driven by higher returns from Australian office
portfolio
o Revaluations from strong leasing and asset markets in
Australia and Asia
o Capital partner acquired c.10% of Lendlease’s interest in
Tower One, Barangaroo South
Retirement Living
o Uplift in resales across the portfolio following industry
recovery and introduction of alternative contract types
o 75% ownership in HY19, 100% for five months in HY18
Equity returns on US Military Housing portfolio
• Operating earnings of $69.6m
FUM growth driving higher base fees
Retail AUM of $13.3b, up 4%
US Military Housing AUM of $13.3b
• Well positioned to deliver future recurring earnings
• Integrated business model key source of growth
• Capital partner initiatives in HY19 to drive future growth: US
residential investment partnership; third party capital raised across the
platform
• Ownership earnings
$1.7b co-invested in funds, capital partner alignment
$1.4b of capital in Retirement investment
Investment in US Military Housing and US telecommunications
infrastructure
• Operating earnings
FUM of $34.1b, c.150 institutional investors
o $0.6b from new residential for rent asset class
c.$2.9b4 of additional secured future FUM across the Group’s
development projects in delivery
Further opportunities from development pipeline yet to enter
delivery
$13.3b of retail assets under management
52,595 US Military Housing units under management, AUM of
$13.3b
HY18 HY19
% Operating EBITDA (ex E&S)1 % 39 42
ROIC % 16.5 13.6
Invested capital $b 3.0 3.4
Co-investment revaluations $m 92.4 76.5
Co-investment revaluations / Operating EBITDA2 % 11.6 11.4
• Owns and/or manages investments including a leading wholesale
investment management platform and also includes the Group’s
ownership interests in property and infrastructure co-investments,
Retirement Living and US Military Housing
• Financial returns include fund, asset and property management fees,
yields and capital growth on investments, and returns from the
Group’s Retirement investment and US Military Housing operations
1. Operating EBITDA including Engineering and Services is $171.7m, excluding
Engineering and Services is $645.4m.
2. EBITDA has been adjusted to exclude the $500m pre-tax impact from losses
expected to be incurred on underperforming Engineering projects.
3. Comparative period the half year ended 31 December 2017.
4. Secured future FUM from funds or mandates with development projects in delivery.
For
per
sona
l use
onl
y

1. Returns derived from investments, the Group’s Retirement investment, US Military Housing equity investment and infrastructure investment.
2. Earnings primarily derived from the investment management platform and the management of US Military Housing operations.
3. The Group’s assessment of market value of ownership interests. Total invested capital in the segment of $3.4b in HY19.
4. Includes the Group’s investments in US Military Housing and infrastructure.
51% 51% 48%
39% 39% 38%
10% 10% 14%
3.1 3.4 3.6
HY18 FY18 HY19
Co-investments Retirement ownership Infrastructure⁴
80% 80% 79%
10% 11% 11%
10% 9% 10%
3.1 3.4 3.6
HY18 FY18 HY19
Australia Asia Americas
267.4
18.7 (0.1)
97.1
383.1
198.4
33.3 10.3
31.2
273.2
Australia Asia Europe Americas Total
HY18 HY19
319
64
203
70
Ownership interests¹ Operating earnings²
HY18 HY19
For
per
sona
l use
onl
y

1. The Group’s assessment of market value.
2. Compound Annual Growth Rate.
16.3
21.323.6
26.1
30.1
34.1
FY14 FY15 FY16 FY17 FY18 HY19
CAGR² of 17.8%
Funds Under
Management
44%
49%
3%2% 2%
$34.1b
Retail Office Industrial Residential Other
71%
23%
5%
1%
$34.1b
Australia Asia Europe Americas
Funds Under
ManagementFor
per
sona
l use
onl
y

1. The Group's assessment of market value.
28.330.1
2.7 (0.5) 1.2 0.6 34.1
HY18 FY18 Additions Divest-ments
Revaluations FX andOther
HY19
21.222.4
1.1 (0.5) 0.7 0.4 24.1
HY18 FY18 Additions Divest-ments
Revaluations Other HY19
5.76.3
1.0 -0.5 0.2 8.0
HY18 FY18 Additions Divest-ments
Revaluations FX andOther
HY19
1.4 1.4
0.2 - - - 1.6
HY18 FY18 Additions Divest-ments
Revaluations FX andOther
HY19
For
per
sona
l use
onl
y

1. The Group's assessment of market value.
2. Reported 70% joint venture share only.
Australia FUM Fund type Asset classFY18
($b)
HY19
($b)
Australian Prime Property Fund Retail Core Retail 5.4 5.8
Australian Prime Property Fund Commercial Core Office 4.6 5.0
Lendlease International Towers Sydney Trust Core Office 4.1 4.4
Managed Investment Mandates Core Various 3.6 4.0
Lendlease One International Towers Sydney Trust Core Office 2.5 2.6
Australian Prime Property Fund Industrial Core Industrial 0.9 1.0
Lendlease Sub Regional Retail Fund Core Retail 0.6 0.6
Lendlease Public Infrastructure Investment Company Core Social Infrastructure 0.4 0.4
Lendlease Real Estate Partners New Zealand Core Retail 0.3 0.3
Total Australia 22.4 24.1
Asia FUM Fund type Asset classFY18
($b)
HY19
($b)
Managed Investment Mandate Value Add Retail and Office 1.92 3.4
Lendlease Asian Retail Investment Fund Core Retail 2.5 2.6
Parkway Parade Partnership Limited Core Plus Retail 1.4 1.5
Lendlease Jem Partners Fund Limited Core Retail 0.5 0.5
Total Asia 6.3 8.0
Europe FUM Fund type Asset classFY18
($b)
HY19
($b)
Lendlease Retail LP Core Retail 1.3 1.3
Lendlease Residential Investment Partnership Core Residential 0.1 0.3
Total Europe 1.4 1.6
Americas FUM Fund type Asset classFY18
($b)
HY19
($b)
Lendlease Americas Residential Partnership Value Add Residential - 0.4
Total Americas - 0.4
For
per
sona
l use
onl
y

APPFR2 APPFC3 APPFI4 LLITST5 LLOITST6 ARIF7 1
(Somerset)
ARIF7 3
(Jem)PPPL8 LLRP9
Total assets $b 5.8 5.0 1.0 4.4 2.6 0.8 1.6 1.5 1.3
Gearing % 17.7 5.7 5.9 13.7 18.7 59.6 42.3 35.8 -
Co-investment % 1.7 8.0 10.8 15.0 2.5 14.4 20.1 6.1 -
Co-investment $m 77.3 362.0 94.1 555.8 52.0 42.1 191.1 42.0 -
Region Aus Aus Aus Aus Aus Asia Asia Asia Eur
Asset class Retail Office Industrial Office Office Retail Retail Retail Retail
Number of assets no. 11 21 33 4 1 1 1 1 2
Occupancy % 97.8 92.7 100.0 89.1 97.3 98.8 99.9 99.8 94.1
Weighted average cap rate % 4.9 5.0 6.5 4.8 4.7 4.5 4.4 5.0 6.3
1. Does not comprise Lendlease’s complete Funds Management Platform.
2. Australian Prime Property Fund Retail.
3. Australian Prime Property Fund Commercial.
4. Australian Prime Property Fund Industrial.
5. Lendlease International Towers Sydney Trust (Barangaroo South T2 and T3, International House and Towns Place Car Park).
6. Lendlease One International Towers Sydney Trust (Barangaroo South T1).
7. Lendlease Asian Retail Investment Fund.
8. Parkway Parade Partnership Limited.
9. Lendlease Retail LP.
For
per
sona
l use
onl
y

Australia co-investmentsHY19 Lendlease interest
(%)
FY18
($m)
HY19
($m)
Lendlease International Towers Sydney Trust 15.0 515.1 555.8
Australian Prime Property Fund Commercial 8.0 292.0 362.0
Australian Prime Property Fund Industrial 10.8 74.6 94.1
Craigieburn Central 25.0 80.7 80.9
Australian Prime Property Fund Retail 1.7 76.4 77.3
Lendlease One International Towers Sydney Trust 2.5 246.0 52.0
Lendlease Public Infrastructure Investment Company 10.0 40.7 39.6
Lendlease Sub Regional Retail Fund 9.9 38.6 37.2
Lendlease Real Estate Partners New Zealand 5.3 9.9 10.2
Lendlease Communities Fund 1 20.8 1.1 1.1
Total Australia 1,375.1 1,310.1
Asia co-investmentsHY19 Lendlease interest
(%)
FY18
($m)
HY19
($m)
Lendlease Asian Retail Investment Fund (ARIF)
ARIF 1 (313@somerset) 14.4 38.7 42.1
ARIF 2 (Setia City Mall) 37.5 27.1 27.8
ARIF 3 (Jem) 20.1 172.8 191.1
313@somerset 25.0 89.1 96.0
Parkway Parade Partnership Limited 6.1 39.8 42.0
Total Asia 367.5 399.0
Americas FY18 HY19
US Military Housing, invested equity $m 195.5 209.3
Telecommunications infrastructure, invested equity $m 118.5 163.0
Telecommunications towers no. 221 238
1. The Group's assessment of market value of ownership interests.
For
per
sona
l use
onl
y

1. The Group's assessment of market value.
2. Gross Lettable Area.
HY19 GLA2
sqm '000
FY18
($b)
HY19
($b)
Australia 749.4 7.3 7.6
Asia 285.9 4.6 4.9
Europe 141.7 0.8 0.8
Total 1,177.0 12.7 13.3
AUM
($b)Housing units Lodging units Total units
Avg portfolio life
(years)
Total 13.3 40,095 12,500 52,595 37
For
per
sona
l use
onl
y

HY18 HY19
Long term growth rate % 3.5 3.5
Discount rate % 12.3 12.3
Average length of stay - ILUs years 11.5 11.5
Number of established units no. 12,664 12,782
Units resold no. 325 402
Development2
Pipeline3 no. 5,040 4,038
Pipeline $b 2.0 1.6
Sales/Settlements no. 40 76
Sales/Settlements $m 19.4 39.5
1. 100% of Retirement Living business.
2. HY18 figures have been included for comparative purposes; pipeline, sales and
settlements for HY18 were reported in the Development segment.
3. Includes aged care beds.
1,229 1,303
1,359
HY18 FY18 HY19
4,0863,337
2,931
1,636
525 267
26
17
12
10
42
VIC NSW QLD WA SA ACT
Units Villages
For
per
sona
l use
onl
y

This document (including the appendix) has been prepared and is issued by Lendlease Corporation Limited (ACN 000 226 228)
(Lendlease) in good faith. Neither Lendlease (including any of its controlled entities), nor Lendlease Trust (together referred to as the
Lendlease Group) makes any representation or warranty, express or implied, as to the accuracy, completeness, adequacy or reliability
of any statements, estimates, opinions or other information contained in this document (any of which may change without notice). To
the maximum extent permitted by law, Lendlease, the Lendlease Group and their respective directors, officers, employees and agents
disclaim all liability and responsibility (including without limitation any liability arising from fault or negligence) for any direct or indirect
loss or damage which may be suffered, howsoever arising, through use or reliance on anything contained in or omitted from this
document.
This document has been prepared without regard to the specific investment objectives, financial situation or needs of any recipient of
this presentation. Each recipient should consult with, and rely solely upon, their own legal, tax, business and/or financial advisors in
connection with any decision made in relation to the information contained in this presentation.
Prospective financial information and forward looking statements, if any, have been based on current expectations about future events
and are subject to risks, uncertainties and assumptions that could cause actual results to differ materially from the expectations
expressed in or implied from such information or statements.
Lendlease Group’s statutory results are prepared in accordance with International Financial Reporting Standards (IFRS). This
document also includes material that is not included in Lendlease Group’s statutory results and contains non-IFRS measures. Material
that is not included in Lendlease Group’s statutory results has not been subject to audit. Lendlease Group’s auditors, KPMG, performed
agreed upon procedures to ensure consistency of this document with Lendlease Group’s statutory results, other publicly disclosed
material and management reports.
A reference to HY19 refers to the half year period ended 31 December 2018 unless otherwise stated. All figures are in AUD unless
otherwise stated.For
per
sona
l use
onl
y