Leisure Service Review Research 2014 - Wakefield … documents/LR4.4 Wakefield Leisure...
96
Brackenhill, St George’s Place, York, YO24 1DT 01904 632039 Dephna House, 24-26 Arcadia Ave, London, N3 2JU 0208 8191397 www.qaresearch.co.uk Company registration: 3186539 Leisure Service Review Research 2014 For Wakefield Metropolitan District Council 19 September 2014
Transcript of Leisure Service Review Research 2014 - Wakefield … documents/LR4.4 Wakefield Leisure...
Brackenhill, St George’s Place,
York, YO24 1DT
01904 632039
Dephna House, 24-26 Arcadia Ave,
London, N3 2JU
0208 8191397
www.qaresearch.co.uk
Company registration: 3186539
Leisure Service Review
Research 2014 For Wakefield Metropolitan District Council
19 September 2014

WMDC –Leisure Service Review Research, September 2014
Page 2
Contents 1. Conclusions ....................................................................................................................................................................................... 4 2. Background and Objectives......................................................................................................................................................... 10 3. Methodology ................................................................................................................................................................................... 11
3.1 Face-to-face Sample Survey ............................................................................................................................................... 11 3.2 Self Completion Survey ....................................................................................................................................................... 11 3.3 Reading this Report ............................................................................................................................................................. 11
4. Sample Profile ................................................................................................................................................................................. 12 4.1 Face-to-face Survey .............................................................................................................................................................. 12 4.2 Self Completion Survey ....................................................................................................................................................... 14
5. Key findings ..................................................................................................................................................................................... 16 5.1 Likelihood to recommend .................................................................................................................................................. 16 5.2 Propensity to use Leisure Centre and Swimming Pools ............................................................................................. 20
5.2.1 Leisure and swimming pools use .................................................................................................................................. 20 5.2.2 Reasons for using facility use most often ................................................................................................................... 27
5.3 Activity Levels ....................................................................................................................................................................... 28 5.3.1 Frequency of taking activity ........................................................................................................................................... 28 5.3.2 Types of activity undertaken during a typical week ................................................................................................. 31 5.3.3 Activities currently do and would like to do in future ........................................................................................... 33 5.3.4 Facilities required for activities currently do and would like to do in future.................................................... 46
5.4 Aspire membership .............................................................................................................................................................. 48 5.5 Wakefield Leisure Services ................................................................................................................................................ 50
5.5.1 The principles of Wakefield Leisure Service ............................................................................................................. 50 5.5.2 Agreement with statements about Wakefield Leisure Services ........................................................................... 51 5.5.3 Willingness to travel ....................................................................................................................................................... 58 5.5.4 Acceptance of an organisation other than the Council running a pool in the South East ............................ 60 5.5.5 Reason for believing the leisure service is not for them ........................................................................................ 61
5.6 A new pool in the South East ............................................................................................................................................ 62 5.6.1 Preferred location for a new pool in the South East .............................................................................................. 62
5.7 The Five Towns Area .......................................................................................................................................................... 64 5.7.1 Preferred option for the Five Towns area................................................................................................................. 64 5.7.2 Likelihood of visiting new leisure facility in the different possible locations ..................................................... 66 5.7.3 Importance of locating a new facility close to other sporting facilities............................................................... 68
5.8 Encouraging people to use leisure centres and swimming pools .............................................................................. 69 6. Appendix .......................................................................................................................................................................................... 79
6.1.2 Face-to-face Survey .............................................................................................................................................................. 79 6.1.2 Self-completion Survey ........................................................................................................................................................ 93
Project number: STAKE04-6780
This research has been carried out in
compliance with the
International standard ISO 20252
Title: WMBC – Leisure Services Review
Location: S:\ProjectFiles\W\WakefieldMDC\STAKE04-
6780_Wakefield_MDC_Leisure_Review_Research\Reports\Wakefiel
d_Leisure_Service_Review_(Final_Report)__V3F.doc
Date: 19 September 2014
Report status: Final
Authors: Michael Fountain
WMDC –Leisure Service Review Research, September 2014
Page 3
List of Figures
Figure 1. Sample profile (face-to-face) – wards ........................................................................................................................................................................ 12 Figure 2. Sample profile (face-to-face) – gender, age and ethnicity ..................................................................................................................................... 13 Figure 3. Sample profile (face-to-face) – other demographics .............................................................................................................................................. 13 Figure 4. Sample profile (self-completion) – wards ................................................................................................................................................................. 14 Figure 5. Sample profile (self-completion) – Area.................................................................................................................................................................... 14 Figure 6. Sample profile (self-completion) – gender, age and ethnicity.............................................................................................................................. 15 Figure 7. Sample profile (self-completion) – other demographics ....................................................................................................................................... 15 Figure 8. Likelihood to recommend a Wakefield Council leisure facility (NPS) ............................................................................................................. 16 Figure 9. Likelihood to recommend a non-Wakefield Council run leisure facility (NPS)............................................................................................. 17 Figure 10. Likelihood to recommend a Wakefield Council facility (self-completion) ...................................................................................................... 18 Figure 11. Likelihood to recommend a non-Wakefield Council run facility (self-completion) ..................................................................................... 19 Figure 12. Types of leisure centres and swimming pools ever use ....................................................................................................................................... 20 Figure 13. Specific leisure centres and swimming pools ever use .......................................................................................................................................... 22 Figure 14. Types of leisure centres and swimming pools ever use (self-completion) ...................................................................................................... 24 Figure 15. Types of leisure centres and swimming pools ever use (self-completion) – by Area .................................................................................. 25 Figure 16. Specific leisure centres and swimming pools ever use (self-completion) ........................................................................................................ 26 Figure 17. Reasons for using facility used most often ............................................................................................................................................................... 27 Figure 18. Frequency of taking moderate and vigorous activity ............................................................................................................................................. 28 Figure 19. Frequency of taking moderate activity (self-completion) ..................................................................................................................................... 30 Figure 20. Activities take part in during a typical week ............................................................................................................................................................ 31 Figure 21. Indoor activities currently do or would like to do ................................................................................................................................................ 33 Figure 22. Indoor activities currently do or would like to do – top 3 mentions .............................................................................................................. 35 Figure 23. Indoor activities currently do or would like to do (self-completion) ............................................................................................................... 36 Figure 24. Indoor activities currently do or would like to do (self-completion) – by five towns (1) .......................................................................... 37 Figure 25. Indoor activities currently do or would like to do (self-completion) – by Area (2) .................................................................................... 38 Figure 26. Outdoor activities currently do or would like to do ............................................................................................................................................ 40 Figure 27. Outdoor activities currently do or would like to do – top 3 mentions .......................................................................................................... 42 Figure 28. Outdoor activities currently do or would like to do (self-completion)........................................................................................................... 43 Figure 29. Outdoor activities currently do or would like to do (self-completion)- by five towns (1) ........................................................................ 44 Figure 30. Outdoor activities currently do or would like to do (self-completion)- by Area (2) .................................................................................. 45 Figure 31. Activities currently do or would like to do – facilities required ........................................................................................................................ 46 Figure 32. Types of facility required by types of leisure centres used .................................................................................................................................. 47 Figure 33. Usage and awareness of Aspire ................................................................................................................................................................................... 48 Figure 34. Usage and awareness of Aspire (Self-completion) ................................................................................................................................................. 49 Figure 35. Agreement with the principles of Wakefield Leisure Service ............................................................................................................................. 50 Figure 36. Agreement with statements about leisure services in Wakefield ...................................................................................................................... 51 Figure 37. Agreement with statements about leisure services (Self-completion) ............................................................................................................. 55 Figure 38. Willingness to travel ....................................................................................................................................................................................................... 58 Figure 39. Willingness to travel (Self-completion) ..................................................................................................................................................................... 59 Figure 40. Acceptance of an organisation other than the Council running the pool ....................................................................................................... 60 Figure 41. Reasons for not feeling the leisure service is not for respondent ..................................................................................................................... 61 Figure 42. Preferred location for new pool in the South East ................................................................................................................................................ 62 Figure 43. Preferred option for the Five Towns area ............................................................................................................................................................... 64 Figure 44. Preferred option for the Five Towns area – by Five Towns ............................................................................................................................... 65 Figure 45. Likelihood of visiting new facility in different locations ........................................................................................................................................ 66 Figure 46. Likelihood of visiting new facility in different locations – by five towns .......................................................................................................... 67 Figure 47. Importance of a new facility being located near other sports facilities ............................................................................................................ 68 Figure 48. Facilities that would encourage use of a leisure centre or swimming pool .................................................................................................... 69 Figure 49. Facilities that would encourage use - by level of ‘moderate activity’ .............................................................................................................. 71 Figure 50. Facilities that would encourage use of a leisure centre/ pool (self-completion) ........................................................................................... 73 Figure 51. Facilities to encourage use of a leisure centre/pool (self-completion) – by Area (the 8 most frequently mentioned) ................ 75 Figure 52. Facilities to encourage use of a leisure centre/pool (self-completion) – by Area (the 8 least frequently mentioned) ................. 76 Figure 53. Preferred days and times of day for participation – summary (self-completion) .......................................................................................... 77 Figure 54. Preferred days and times of day for participation (self-completion)................................................................................................................. 78
WMDC –Leisure Service Review Research, September 2014
Page 4
1. Conclusions
Unless otherwise stated, the conclusions below are based on data from the face-to-face sample survey.
Conclusion 1: SATISFACTION - Generally, residents seem more favourable towards leisure facilities
operated by the Council than those operated by others, although many were unable or unwilling to
say whether they’d recommend either type of facility.
The Net Promoter Score (NPS) for leisure centres and swimming pools that are ‘run by Wakefield Council in your local
area’ was 33% and this is a similar figure to that recorded amongst facility users and members in research undertaken
for Wakefield Council in 20121, where the NPS was 27%. It also remains a higher figure than the national average
recorded in the same research (25%), suggesting that residents are relatively satisfied with the existing provision.
Scores for Council run facilities also compare favourably to those’ that are run by private companies and other
organisations’, where an NPS of -6% was recorded, which means that these facilities are creating more Detractors
than Promoters. These findings suggest that respondents are generally more favourable towards Council run facilities
than those run by others.
However, when asked to recommend both types of facilities many respondents opted to offer ‘no opinion’ or simply
said that they ‘don’t know’ and this is likely to reflect the fact that only 27% said that they ever use leisure facilities
(whether operated by the Council or by others). Given this, it is fair to assume that the assessment provided by
some respondents when deciding whether to recommend facilities or not is based on perceptions rather than
experience.
There is some evidence within the research to suggest that the most active respondents and those most likely to
undertake ‘vigorous physical activity’ on multiple occasions each week may be less inclined to use a Wakefield Council
run leisure centre or swimming pool, as 68% of those that use a non-Council run facility most often said they take
this level of activity, compared to 38% amongst those that use a Wakefield Council run one. This suggests that the
current provision of leisure facilities by the Council might not meet the needs of the most active residents. That said,
many of those that take high levels of ‘vigorous physical activity’ undertake activities each week that don’t necessarily
require a leisure centre or swimming pool such as ‘cycling’ (14%) and ‘rambling (walking)’ (22%), so the provision of
facilities may be less relevant.
Conclusion 2: USAGE - Although the research was not designed to measure the proportion of the
population that is active, the findings highlight differences between respondents in terms of the
frequency of taking activity and the types of activities undertaken.
When assessing activity levels in this research, there are two important factors that need to be considered;
Firstly, a quota target was placed on the number of respondents who take part in ‘moderate physical activity’ ‘3
or more times a week’, which was designed to ensure that analysis could be undertaken amongst this sub-
group. This means that the face-to-face research does not necessarily provide an updated assessment of this
level of activity amongst the district’s population.
Secondly, the proportion of respondents that indicated they take part in ‘swimming’ each week (12%) is
higher than the actual proportion recorded via usage figures supplied by Wakefield Council (6%), suggesting
that there may be some degree of over-claim regarding this activity. Additionally, ‘swimming’ was mentioned
more by respondents living in Castleford (25%) or Pontefract and Knottingley (20%), suggesting that this
over-claim is driven by respondents from these areas where there is a threat of closure to the local pools.
As expected, respondents are more likely to take part in ‘moderate physical activity’ than they are to take part in
‘vigorous physical activity’, but no difference in the frequency of taking ‘vigorous physical activity’ was recorded between
1 ‘Wakefield NPS Survey’ the Retention People.
WMDC –Leisure Service Review Research, September 2014
Page 5
age groups, with similar proportions of each stating that they do this ‘3 or more times a week’ (16-34: 48%, 35-54:
46%, 55+: 46%). In part this is explained by the types of activities people take part in which differ by age, with
‘walking (not rambling)’ mentioned more by older people (16-34: 15%, 35- 54: 14%, 55+: 30%) along with ‘gardening’
(16-34: 0%, 35-54: 1%, 55+: 5%). In contrast, younger respondents were more likely to mention ‘football’ (16-34: 11%,
35-54: 4%, 55+: 1%) and ‘cycling’ (16-34: 7%, 35-54: 13%, 55+: 3%). It seems that people simply modify how they take
exercise as they grow older. Consequently, the types of activities different age groups take part in reflect, at least in
part, different requirements for leisure facilities and this is reflected throughout this research.
Moreover, males were more likely than females to say they take ‘vigorous physical activity’ on ‘3 or more times a week’
(50% vs. 43%). There are likely to be a number of reasons for this difference, but it is possible that it’s driven, at
least in part, by contrasting requirements for facilities. This is because differences exist between males and females
regarding the types of activities they currently take part in or would like to in future; females were more likely than
males to mention ‘swimming’ (34% vs. 20%), ‘yoga/pilates’ (11% vs. 1%), ‘ice skating’ (10% vs. 3%) and ‘dance classes such
as ballroom, Zumba’ (12% vs. 2%) all of which require a sports hall, pool or rink. In contrast, males were more likely
to mention ‘gym’ (19% vs. 13%), ‘weight training’ (10% vs. 3%) along with ‘football’ (6% vs. 1%) and consequently more
likely to require a gym or pitch. Confirming this, the research indicates that females are more likely than males to
require sports halls for their preferred activities (30% vs. 20%) and swimming pools (33% vs. 20%), while they are
less likely to require pitches (9%) vs. 22%) and the availability of these facilities may be driving different levels of
usage to some degree. Supporting this, the Review of Leisure Services undertaken by Deloitte in January 2014
highlighted an ‘undersupply’ in the district of sports halls and a ‘latent demand’ for health and fitness facilities in the
Five Towns area.
Additionally, respondents that use a leisure centre or swimming pool operated by Wakefield Council were
significantly more likely than those that use one operated by someone else to say that there are no outdoor
activities that they currently do or would like to do in future (31% vs. 18%). This difference was not apparent when
respondents were asked to consider indoor activities and so it might suggest that some using facilities not operated
by the Council are doing so because they require better or specific outdoor facilities, although the only difference in
the outdoor activities mentioned by these groups is that those that use a non-Council facility most often were more
likely to mention ‘cycling’ (23% vs. 9%) and this activity may be driving this difference to some degree.
Conclusion 3: RANGE OF OFFER - The research provides evidence that there is a desire to provide a
leisure hub and that this would be likely to encourage usage of leisure centres.
There is strong interest amongst all respondents in providing non-sporting facilities at leisure centres and pools and
the majority (62%) were able to mention at least one non-sporting facility that would encourage them to visit a
leisure centre or swimming pool more often and the average number mentioned was 2.9. Moreover, when asked to
consider the possibility of a new leisure centre in the Five Towns area, the majority (52%) did think that this was
‘important’ to be located close to ‘other sport and leisure facilities’. Consequently, the survey suggests that residents
would welcome a ‘leisure hub’, where a range of sporting and non-sporting facilities are available and that this is
generally more likely to encourage visits to leisure facilities.
Amongst respondents that use a leisure centre or swimming pool, those that said the one they use most often was
one run by Wakefield Council were more likely to mention that non-sporting facilities would encourage them to use
leisure centres and swimming pools more often (86% vs. 68%), further suggesting that there would be value in the
Council incorporating these facilities as a means of increasing visits to its leisure centres and pools.
Conclusion 4: ASPIRE - Relatively low rates of Aspire membership suggest that more could be done
to promote the benefits of this scheme to residents and to existing users of Council run leisure
facilities.
One-in-twenty indicated that they had an Aspire membership (5%) and most of those that are not members had not
heard of this scheme (61%), so there is clearly scope to improve take-up levels, by raising levels of awareness and
understanding of what the scheme offers in the first instance.
WMDC –Leisure Service Review Research, September 2014
Page 6
Notably, only 17% of those who said that the leisure centre or swimming pool they use most often was one
operated by Wakefield Council said they had an Aspire membership and only 28% of those without this membership
said they’d heard of it, highlighting a clear opportunity to increase membership amongst users.
More positively, there is evidence to suggest that Sun Lane Leisure is driving take up of the scheme, as 33% of those
using Sun Lane Leisure most often said they were members. Reflecting this, take-up of the membership was
significantly higher amongst all respondents living in Wakefield Central (10%) where Sun Lane is based. The relative
success of the scheme amongst users of Sun Lane, given marketing is no different, suggests the quality of the offer is
driving up levels of activity and Aspire Membership.
Conclusion 5: APPROPRIATE OFFER - While residents don’t necessarily have to feel that the leisure
service is aimed at them to use it, the evidence suggests that increasing the proportion that feel it is
aimed at them will in turn increase usage.
It’s reassuring that the majority ‘disagreed’ that ‘the leisure service is not aimed at people like me’ (56%), but it should be
noted that more than one-in-ten ‘agreed’ this was the case (13%). The evidence suggests that feeling the service is
aimed at you is likely to encourage usage, as 81% of
those that said they use the ‘...nearest leisure centre or swimming pool run by Wakefield Council’ disagreed that ‘the leisure
service is not aimed at people like me’. That said, one-in-ten (10%) agreed, suggesting that residents don’t necessarily
have to feel the service is aimed at them to use. Findings from the self-completion survey, where a third (33%) of
respondents who indicated that they’d recommend Wakefield Council run facilities actually agreed that ‘the leisure
service is not aimed at people like me’, also suggest that residents don’t have to feel it’s aimed at them to look
favourably towards the service. However, ensuring that people feel the service is for them is likely to encourage
usage and where people don’t feel that it is, this is usually driven by concerns about being too old or it being too
expensive, suggesting that there would be value in communications messages around these issues in particular.
Conclusion 6: SUPPORT FOR SERVICE PRINCIPLES - Respondents have a clear idea of how they’d
like leisure services to be delivered in the future, wanting good buildings, a range of activities and
supportive staff
With 90% agreement, there is unanimous support for the principles of the Leisure Service, including offering ‘a range
of activities from different sites’, along with ‘buildings which are fit for purpose and efficient and flexible enough to
accommodate a wide variety of needs’ and for ‘welcoming staff which encourage, inspire, and support people and groups to
be active’.
Conclusion 7: SUPPORT FOR CONSIDERATION OF ALTERNATIVE DELIVERY MODELS -
Residents are also open to the provision of services from locations other than leisure centres and
evidence suggests that it would be acceptable for this to be done by communities themselves and
organisations other than the Council.
Respondents want to see a leisure service that isn’t only focussed on leisure centres and they ‘agree’ that it should
be delivered ‘from other locations such as parks, sports clubs and schools’ (78%) and ‘tailored to meet the needs of individual
communities’ (76%).
There was also support for the idea that the service ‘should continually assess usage and cost of its services’ and that it
should ‘stop providing those activities which are not increasing the number of people taking part in them’ (65%). It was
actually respondents that said they take ‘vigorous physical activity’ ‘3 or more times a week’ that were more likely to
‘agree’ with this statement than those that do so ‘2 or less times or never’ (70% vs. 61%), perhaps suggesting that those
that are least likely to exercise vigorously would prefer to see a wider range of activities/facilities available.
The findings also provide a strong case for helping communities to deliver services, as 83% of respondents ‘agreed’
that they want support for communities ‘now, so that they can help to deliver leisure services themselves in future’. More
specifically, this idea was supported particularly by the respondents aged 16-24 (87%) and by those with children
(86%). Additionally, amongst respondents who ever use a leisure centre or pool, there was almost unanimous
WMDC –Leisure Service Review Research, September 2014
Page 7
support amongst those that use a Wakefield Council facility most often (96%) and this was significantly higher than
amongst those that use a leisure centre or swimming pool operated by someone else (88%). Support for delivering
leisure services in this way was highest amongst respondents in the Area of Pontefract and Knottingley (95%) and
this was true for both of these towns (98% and 89% respectively).
Also, when asked to consider provision in the South East specifically, the majority of respondents (63%) felt that it
would be acceptable for ‘an organisation other than the Council to run the pool if this saved the Council a significant amount
of money’, suggesting that the idea of other organisations running services is likely to be acceptable in other areas of
the district.
Conclusion 8: SUPPORT FOR LEISURE DESTINATION - There is support for providing a service
that attracts users from outside the district.
Generally, respondents support the idea of a leisure destination, with 63% agreeing that the service should ‘attract
people from outside the district to use its facilities’, although differences in support for this idea exist between the Areas
of the district. Specifically, it’s notable that agreement was highest amongst those living in the Areas of Pontefract
and Knottingley (79%), Wakefield Rural (72%), Wakefield North West (67%) and Wakefield Central (67%), but
lowest amongst those living in Castleford (48%), Normanton and Featherstone (51%) and South East (50%).
However, despite these variations, findings show that almost half of each Area, at least, supported the idea of
attracting people into the district to use leisure services.
Conclusion 9: SUPPORT FOR QUALITY OVER QUANTITY - There is support for delivering services
from fewer buildings, although variations exist between the different Areas of the district.
Generally, respondents were more likely to agree than disagree that ‘access to a high quality leisure centres is more
important to me than the number of buildings the service operates’ (47% vs. 21%) and this was an idea supported more by
younger people 16-34: (61%), working respondents (52%) and those with children (54%). Agreement with this idea
was also higher in the Areas of Castleford (64%), Pontefract (70%) and Knottingley (50%) and Wakefield Central
(57%), and there were high levels of agreement amongst those living in the town of Featherstone specifically (75%).
Conclusion 10: WILLINGNESS TO TRAVEL - There are mixed views amongst respondents as to
their willingness to travel to access quality leisure centres.
Broadly equal proportions ‘agreed’ that they would be ‘willing to travel to get access to better quality leisure centres’
(35%) as ‘disagreed’ (38%), although variations in propensity to travel were recorded amongst different groups;
As might be expected respondents who ‘agreed’ that ‘access to a high quality leisure centres is more important to
me than the number of buildings the service operates’ were more likely than those that ‘disagreed’ to be ‘...willing
to travel...’ (58% vs. 19%). Seemingly, people will travel to access a quality leisure offer.
Respondents were more likely to indicate that they’d travel if they were aged 16-34: (51%) and in line with
this, if they had children (45%) and if they were ‘working’ (46%). It is these groups that are most open to
delivering services from fewer buildings, so this is to be expected.
Also, if respondents already use a leisure centre or swimming pool, then they were more likely to ‘agree’
that they’d be willing to travel than if they did not (57% vs. 27%). Essentially, this means that those who are
non-users of leisure centres are less inclined to travel to use them, although this does mean that one-in-four
would be willing to travel to do so.
Finally, some differences between Areas were recorded, with respondents most likely to ‘agree’ they’d be
willing to travel if they lived in Wakefield Rural (44%) or Pontefract (63%) and Knottingley (40%). In contrast,
respondents were least likely to want to travel if they lived in the South East (17%) and Normanton and
Featherstone (27%), although respondents in Featherstone were more likely to ‘agree’ than those in
Normanton (53% vs. 13%). Respondents living in Castleford fell somewhere in the middle (35%).

WMDC –Leisure Service Review Research, September 2014
Page 8
Conclusion 11: SOUTH EAST LOCATION – From across the district the majority of respondents
(67%) do not have a preference for where a new pool in the South East should be located.
Amongst all respondents, 40% indicated that they have ‘no preference’ and a further 27% said that they ‘don’t know’
when asked to choose from a short list of possible locations for a new pool in the South East area. Generally,
amongst respondents in the district as a whole, there is more support for the new pool to be located in the broad
area of ‘Minsthorpe’ (19%) rather than ‘Hemswoth’ (10%), but views amongst respondents living in the South East
were mixed and generally reflected a desire for the pool to be located closest to them.
As might be expected, respondents living in the South East were more likely to have a preference and differences
were recorded between wards in this Area. Specifically, more than nine-out-of-ten respondents living in the closest
wards to Minsthorpe (namely Ackworth, North Elmsall and Upton and South Elmsall and South Kirkby) expressed a
preference for ‘the broad Minsthorpe area’ (91%). In contrast, the majority of respondents living in Hemsworth (of
which there were 55) wanted to see the new pool located in ‘the broad area of Hemsworth’ (54%) and a further third
selected ‘a specific location in Hemsworth’ (33%).
As previously noted, when asked to consider the new pool in the South East the majority of all respondents felt that
it would be acceptable for ‘an organisation other than the Council to run the pool if this saved the Council a significant
amount of money’ (63%) and this figure increased to 71% amongst those living in the South East, perhaps because
South East respondents are already comfortable with this concept due to the gym provision offered to the public by
Minsthorpe Academy. However, the research does not provide any data to confirm, or otherwise, this idea.
Conclusion 12: FIVE TOWNS OPTION - The favoured option for future provision in the Five Towns
isn’t conclusive and differences in preferences amongst respondents living in each of the towns in this
area are evident.
Amongst all respondents in the district, respondents were significantly more likely to choose the option to ‘continue
running the existing swimming pools at Castleford, Pontefract and Knottingley for as long as they are affordable...’ than they
were to choose to ‘close Castleford Pool, Pontefract Pool and the pool at Knottingley Sports Centre (but not the other
facilities there) now and build a single centrally located leisure centre...’ (43% vs. 31%).
However, differences are apparent when preferences are analysed amongst respondents living in each of the specific
towns of the Five Towns area;
The majority of respondents chose the option to ‘continue running the existing swimming pools...’ in Castleford
(66%) and Knottingley (67%) rather than to ‘...build a single centrally located leisure centre...’ (19% and 17%
respectively), perhaps reflecting the fact that under the proposal to build a new leisure centre the swimming
pools in these towns would close.
Amongst respondents in Pontefract, where the proposal would involved the closure of Pontefract Pool, half
(50%) chose the option to ‘...build a single centrally located leisure centre..., although a third chose the
option to ‘continue running the existing swimming pools...’ (33%). Due to small sample sizes statistically
speaking, the proportion of Pontefract respondents choosing to ‘...build a single centrally located leisure
centre...’ isn’t significantly higher than the proportion choosing to ‘continue running the existing swimming
pools...’, so caution must be taken when considering this result.
In contrast, respondents in Featherstone were most likely to choose the option to ‘...build a single centrally
located leisure centre...’ (46%), although a third said that they actually had ‘no preference’ (34%) and this may
also reflect the fact that no change is proposed to Featherstone pool, so choosing this option effectively
means a new modern facility would be provided without the loss of the local pool.
The majority of respondents in Normanton preferred the option to ‘continue running the existing swimming
pools...’ (60%), although why this was the preference rather than the provision of a new pool is not clear,
given that Normanton pool would remain open if a new pool were to be built.
WMDC –Leisure Service Review Research, September 2014
Page 9
Wakefield Rural was the only one of the seven Areas where preference was to ‘...build a single centrally
located leisure centre...’ (46%) rather than to ‘continue running the existing swimming pools...’ (25%). This was one
of the two Areas (along with Pontefract and Knottingley) where respondents were most likely to agree that
they’d be willing to travel to access ‘...better quality leisure centres’ and respondents in this Area were also
more likely to travel to access a leisure centre already. It seems that residents in this Area are more willing
to travel to access facilities, as might be expected in a predominantly rural area.
Conclusion 13: FIVE TOWNS LOCATION - Based on their likelihood to travel to it, amongst all
respondents, no clear preference for where a new leisure centre in the Five Towns area should be
located was recorded.
Amongst the total sample, almost equal proportions indicated they’d travel to one in ‘the broad area of
Glasshoughton/around Xscape’ (30%) or ‘the broad area of Pontefract Park/Prince of Wales Colliery site’ (27%), but
respondents were less likely to indicate they’d travel to a new centre in ‘the broad area of Knottingley’ (18%).
Differences in likelihood to travel to each site were recorded amongst respondents in each of the five towns,
although generally respondents were more likely to say that they’d travel to a centre if it was located near to them;
In Pontefract, 84% of respondents were ‘likely’ to travel to ‘...Pontefract Park/Prince of Wales Colliery site’, while
68% would travel to ‘...Glasshoughton/around Xscape’ and 56% to ‘...Knottingley’.
In Castleford, half would travel to ‘...Glasshoughton/around Xscape’ (50%), but only around one-in-five would
travel to ‘...Pontefract Park/Prince of Wales Colliery site’ (22%) or ‘...Knottingley’ (19%).
In Knottingley itself, 87% would travel to ‘...Knottingley’ compared to 49% to ‘...Pontefract Park/Prince of Wales
Colliery site’ and 47% to ‘...Glasshoughton/around Xscape’.
Featherstone respondents were most likely to say they’d travel to ‘...Glasshoughton/around Xscape’ (75%) and
the majority would also travel to ‘...Pontefract Park/Prince of Wales Colliery site’ (68%), while 49% would travel
to ‘...Knottingley’.
Normanton respondents were the least likely to travel to any of these sites, with 18% indicating they’d travel
to ‘...Glasshoughton/around Xscape’, but only 5% prepared to travel to ‘...Pontefract Park/Prince of Wales Colliery
site’ and 3% to ‘...Knottingley’.

WMDC –Leisure Service Review Research, September 2014
Page 10
2. Background and Objectives
Wakefield Council is currently undertaking a Leisure Review to determine the future of leisure services in the
district. Stage 1 of the review included an assessment of the district’s leisure centres by Deloittes and the main
conclusions of this review were as follows;
That “while the level of swimming provision in the district (in terms of water space) is good, the demand analysis has
indicated a need for additional sports halls and health and fitness space”
The South East of the district is underserved and there is a strong case for a new pool to replace the closed
Minsthorpe Pool.
Approval was subsequently given for a programme of consultation to inform the decision making process over future
provision of leisure services and to inform Leisure Services Management and Regeneration Economic Growth
Overview and Scrutiny.
The report covers findings from the consultation.
WMDC –Leisure Service Review Research, September 2014
Page 11
3. Methodology
Although the consultation undertaken by Wakefield Council involved a broad programme of consultation, there
were three distinct elements to the consultation involving Qa Research, as follows;
A quantitative survey amongst a representative sample of residents in the district
A self-completion survey made available to residents from across the district
Recruitment of four focus groups carried out by Wakefield Council officers.
Findings from the face-to-face survey and the self-completion survey are outlined in this report.
3.1 Face-to-face Sample Survey
To gather the views of a representative sample of residents a sample survey as carried out. Fieldwork was
undertaken face-to-face, on-street at suitable locations across the district using CAPI (Computer Assisted Personal
Interviewing). To ensure that the final achieved sample was representative, quotas were set on gender, age and
ward and a minimum quota was set on ethnicity.
In addition, a quota was set on the level of ‘moderate physical activity’ respondents take and to ensure that c.40% of
the final sample were classified as being ‘inactive’. This quota was based on the proportion identified within the
population by the Lifestyle Survey undertaken by Wakefield Council. Interviewing was carried out between 1 July
and 11th August 2014.
To ensure the final reported sample was representative, weighting was applied at analysis to correct for any
demographic and Ward differences.
3.2 Self Completion Survey
To gather the views of the wider public in the district, a short (4 page) paper questionnaire was designed to capture
local information about usage and need.
The questionnaire was made available to anyone who wished to complete it and distributed to libraries, leisure
centres, pools and other access points for residents. Consequently, the sample for the self-completion survey was
entirely self-selecting and no quotas were placed on recruitment.
To compliment the paper-based survey a parallel online survey was hosted by Wakefield Council and made available
to residents via the council website. Findings from this survey have been merged with the paper survey and are
reported together in this report. In total, 872 completed self-completion surveys were returned and have been
included in the analysis outlined in this report.
3.3 Reading this Report
This report contains findings from both the face-to-face and self completion surveys. Data from the self-completion
surveys have been used to support the findings from the face-to-face sample survey and a clear distinction between
the two data sets has been made within the report. All charts and tables have been labelled as either ‘face-to-face’ or
‘self-completion’ indicating if the data is from the face-to-face sample survey or self-completion survey (paper &
online) respectively.
Please note that the findings from the self-completion survey should be treated with caution as the sample is by definition self-
selecting and therefore not necessarily representative of the population of the district or of leisure service users.
WMDC –Leisure Service Review Research, September 2014
Page 12
n % n % n %
Airedale and Ferry Fryston 11,702 4% 41 4% 45 4%
Castleford Central and Glasshoughton 12,762 5% 61 6% 49 5%
Altofts and Whitwood 13,346 5% 40 4% 51 5%
Featherstone 12,974 5% 50 5% 49 5%
Normanton 13,084 5% 55 5% 50 5%
Knottingley 11,247 4% 49 5% 43 4%
Pontefract North 12,799 5% 34 3% 49 5%
Pontefract South 12,387 5% 56 6% 47 5%
Ackworth, North Elmsall and Upton 13,160 5% 74 7% 50 5%
Hemsworth 12,495 5% 55 5% 48 5%
South Elmsall and South Kirkby 14,145 5% 55 5% 54 5%
Wakefield East 12,537 5% 33 3% 48 5%
Wakefield North 12,875 5% 58 6% 49 5%
Wakefield West 12,202 5% 37 4% 46 5%
Horbury and South Ossett 12,423 5% 38 4% 47 5%
Ossett 13,199 5% 51 5% 50 5%
Stanley and Outwood East 12,547 5% 55 5% 48 5%
Wrenthorpe and Outwood West 12,081 5% 38 4% 46 5%
Crofton, Ryhill and Walton 12,522 5% 37 4% 48 5%
Wakefield Rural 14,204 5% 55 5% 54 5%
Wakefield South 11,106 4% 39 4% 42 4%
265,797 1,011 1,011
Ward Unweighted Sample Weighted SampleAdults 16+ population
(Census 2011)
4. Sample Profile
The following sections detail the profile of respondents from each of the two surveys.
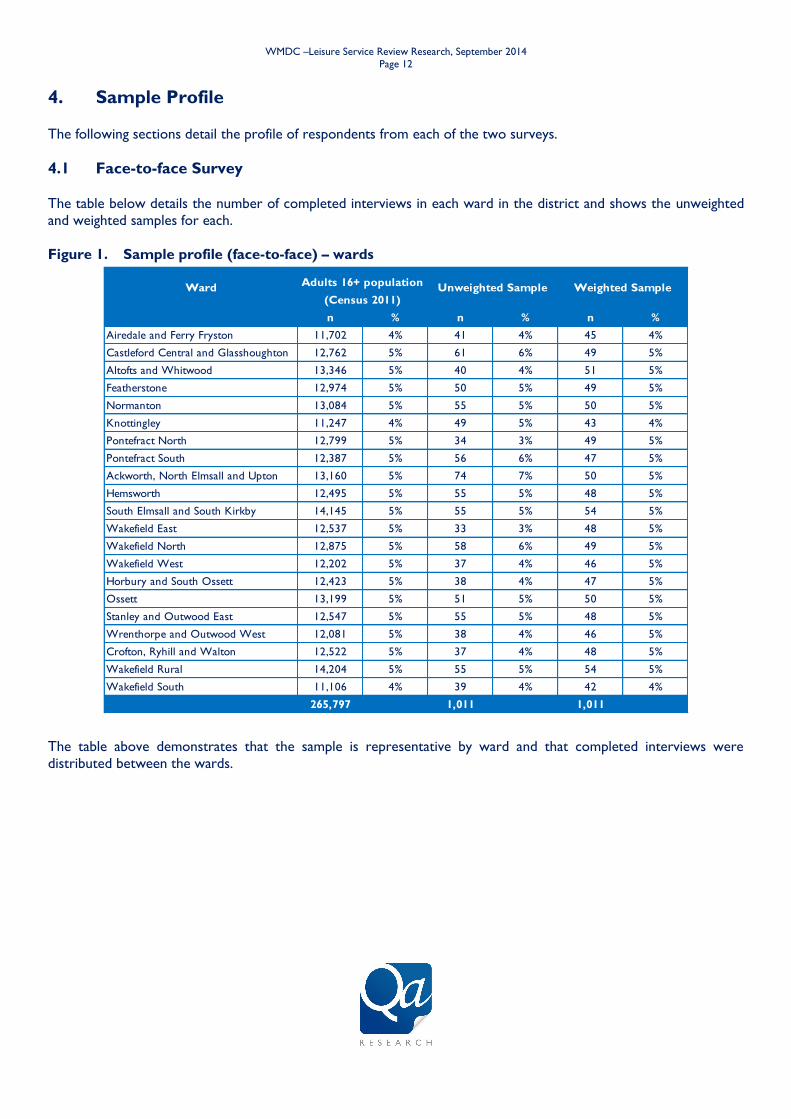
4.1 Face-to-face Survey
The table below details the number of completed interviews in each ward in the district and shows the unweighted
and weighted samples for each.
Figure 1. Sample profile (face-to-face) – wards
The table above demonstrates that the sample is representative by ward and that completed interviews were
distributed between the wards.
WMDC –Leisure Service Review Research, September 2014
Page 13
n % n % n %
Male 129,319 49% 448 44% 495 49%
Female 136,478 51% 563 56% 516 51%
16 to 24 35,507 13% 117 12% 123 12%
25 to 34 39,370 15% 157 16% 160 16%
35 to 44 46,714 18% 143 14% 175 17%
45 to 54 47,790 18% 156 15% 189 19%
55 to 64 41,274 16% 77 8% 62 6%
65+ 55,142 20% 353 35% 296 29%
Not stated/prefer not to say - - 8 1% 5 0%
NET: White 255,422 96% 975 96% 970 96%
NET: BME 10,375 4% 35 3% 40 4%
Not stated/prefer not to say - - 1 <1% 1 <1%
265,797 1,011 1,011
Demographics
Unweighted Sample Weighted Sample
Adults 16+ population
(Census 2011)
n % n %
Disabled 141 14% 113 11%
Not disabled 870 86% 898 89%
NET: Working 441 44% 487 48%
Employee in full-time job (30 hours plus per week) 289 29% 334 33%
Employee in part-time job (under 30 hours per week) 145 14% 148 15%
Self employed; full or part time 7 1% 6 1%
NET: Not working 567 56% 520 51%
Full-time education at school, college or university 28 3% 28 3%
Unemployed and available for work 54 5% 65 6%
Unemployed due to long term illness 45 4% 42 4%
Full-time carer for a disabled person (paid/ unpaid) 13 1% 15 1%
Wholly retired from work 338 33% 285 28%
Looking after the home 89 9% 87 9%
Not stated/prefer not to say 3 <1% 3 <1%
No children at home 639 63% 605 60%
NET: Any children 369 36% 402 40%
Not stated/prefer not to say 3 <1% 4 <1%
1,011 1,011
DemographicsUnweighted Sample Weighted Sample
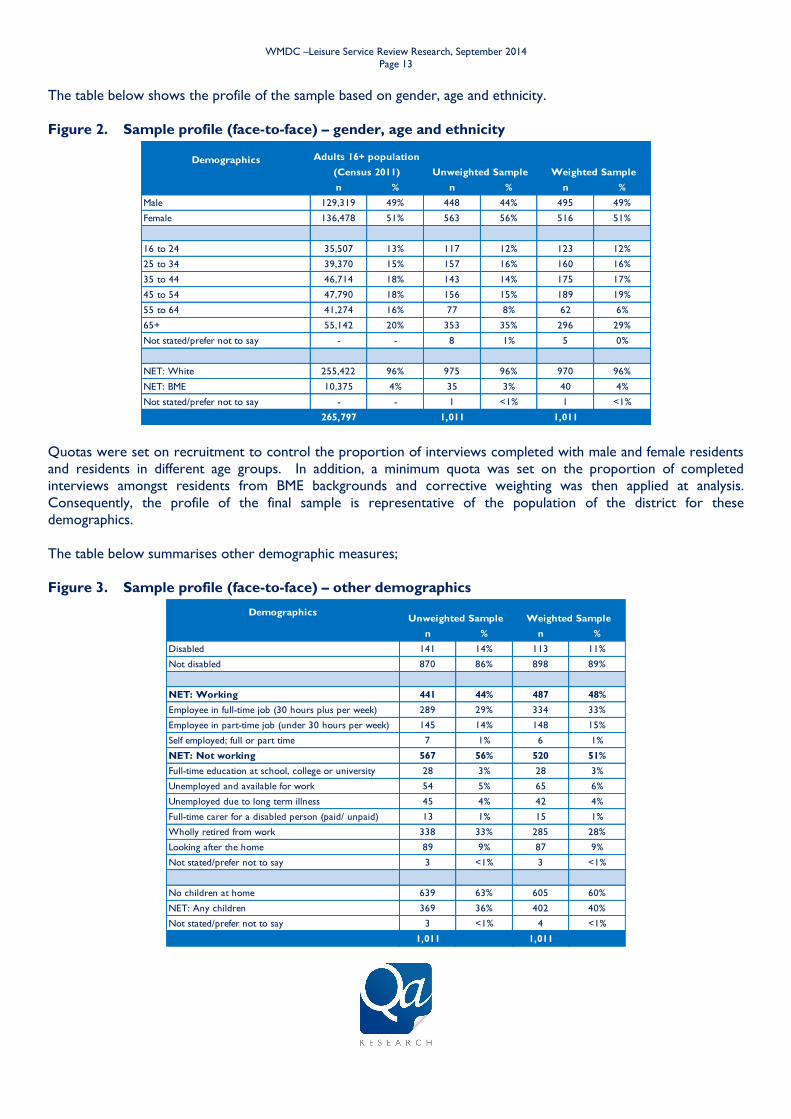
The table below shows the profile of the sample based on gender, age and ethnicity.
Figure 2. Sample profile (face-to-face) – gender, age and ethnicity
Quotas were set on recruitment to control the proportion of interviews completed with male and female residents
and residents in different age groups. In addition, a minimum quota was set on the proportion of completed
interviews amongst residents from BME backgrounds and corrective weighting was then applied at analysis.
Consequently, the profile of the final sample is representative of the population of the district for these
demographics.
The table below summarises other demographic measures;
Figure 3. Sample profile (face-to-face) – other demographics
WMDC –Leisure Service Review Research, September 2014
Page 14
n % n %
Airedale and Ferry Fryston 11,702 4% 32 4%
Castleford Central and Glasshoughton 12,762 5% 58 8%
Altofts and Whitwood 13,346 5% 74 10%
Featherstone 12,974 5% 29 4%
Normanton 13,084 5% 40 5%
Knottingley 11,247 4% 53 7%
Pontefract North 12,799 5% 63 9%
Pontefract South 12,387 5% 66 9%
Ackworth, North Elmsall and Upton 13,160 5% 40 5%
Hemsworth 12,495 5% 15 2%
South Elmsall and South Kirkby 14,145 5% 18 2%
Wakefield East 12,537 5% 16 2%
Wakefield North 12,875 5% 24 3%
Wakefield West 12,202 5% 27 4%
Horbury and South Ossett 12,423 5% 35 5%
Ossett 13,199 5% 18 2%
Stanley and Outwood East 12,547 5% 22 3%
Wrenthorpe and Outwood West 12,081 5% 33 4%
Crofton, Ryhill and Walton 12,522 5% 34 5%
Wakefield Rural 14,204 5% 21 3%
Wakefield South 11,106 4% 22 3%
Outside district - - 84 -
Invalid postcode - - 13 -
No postcode given - - 35 -
265,797 872
WardAdults 16+ population
(Census 2011)Unweighted Sample
n % n %
Castleford 24,464 9% 90 12%
Normanton and Featherstone 39,404 15% 143 19%
Pontefract and Knottingley 39,800 15% 182 25%
South East 36,433 14% 73 10%
Wakefield Central 37,614 14% 67 9%
Wakefield North West 50,250 19% 108 15%
Wakefield Rural 37,832 14% 77 10%
265,797 740
AreaAdults 16+ population
(Census 2011)Unweighted Sample
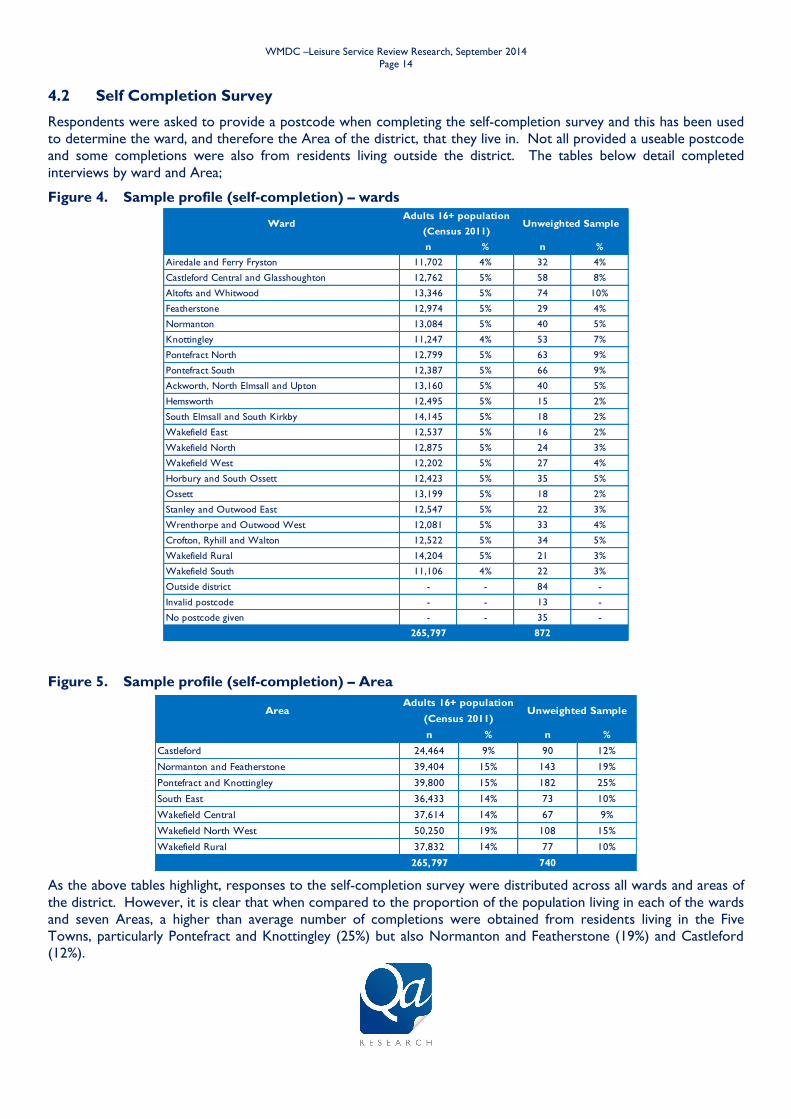
4.2 Self Completion Survey
Respondents were asked to provide a postcode when completing the self-completion survey and this has been used
to determine the ward, and therefore the Area of the district, that they live in. Not all provided a useable postcode
and some completions were also from residents living outside the district. The tables below detail completed
interviews by ward and Area;
Figure 4. Sample profile (self-completion) – wards
Figure 5. Sample profile (self-completion) – Area
As the above tables highlight, responses to the self-completion survey were distributed across all wards and areas of
the district. However, it is clear that when compared to the proportion of the population living in each of the wards
and seven Areas, a higher than average number of completions were obtained from residents living in the Five
Towns, particularly Pontefract and Knottingley (25%) but also Normanton and Featherstone (19%) and Castleford
(12%).

WMDC –Leisure Service Review Research, September 2014
Page 15
n % n %
Male 129,319 49% 249 35%
Female 136,478 51% 465 65%
16-24 35,507 13% 34 5%
25-34 39,370 15% 112 16%
35-44 46,714 18% 155 22%
45-54 47,790 18% 136 19%
55-64 41,274 16% 132 19%
65+ 55,142 20% 134 19%
NET: White 255,422 96% 689 98%
NET: BME 10,375 4% 14 2%
Base: All Valid responses (Wakefield district residents only)
Adults 16+ population
(Census 2011)Demographics
Unweighted Sample
n %
Disabled 141 14%
Not disabled 870 86%
NET: Working 515 59%
Employee in full-time job (30 hours plus per week) 341 39%
Employee in part-time job (under 30 hours per week) 129 15%
Self employed; full or part time 45 5%
NET: Not working 314 36%
Full-time education at school, college or university 21 2%
Unemployed and available for work 12 1%
Unemployed due to long term illness 25 3%
Full-time carer for a disabled person (paid/ unpaid) 16 2%
Wholly retired from work 202 23%
Looking after the home 26 3%
Other 12 1%
Not stated/prefer not to say 43 5%
No children at home 444 51%
NET: Any children 365 42%
Not stated/prefer not to say 63 7%
Base: All self-completion respondents 872
DemographicsUnweighted Sample
Accordingly, fewer completions were obtained from residents living in the others Areas, including the South East
(10%) and one-in-ten were from residents living outside the district (10%).
The table below shows the profile of the sample based on gender, age and ethnicity. To enable a comparison with
the resident population of the district, data is only shown for respondents to the self-completion survey who lived in
the district;
Figure 6. Sample profile (self-completion) – gender, age and ethnicity
The table above highlights that respondents to the self-completion survey came from a good spread of age groups,
although when compared to the population as a whole fewer were completed by those aged 16-24 (5%). Self-
completion respondents were also more likely to be female (65%) and from white backgrounds (98%). Further
demographics are detailed below;
Figure 7. Sample profile (self-completion) – other demographics
WMDC –Leisure Service Review Research, September 2014
Page 16
28%
15%10%
31%
15%
59%
30%
11%
1%
Promoters (Score 9-10) Passives (Score 7-8) Detractors (Score 0-6) Never used/no opinion Don't know
Q8a. On a scale of 0 to 10 with 0 being 'not at all' and 10 'very likely', how likely would you be to
recommend to family and friends the leisure centres and swimming pools that are run by Wakefield
Council in your local area?
All respondents Ever used WMDC leisure centre or pool
Source: Qa Research 2014 Base: All face-to-face respondents (1,011), All ever use a WMDC facility (173)
5. Key findings
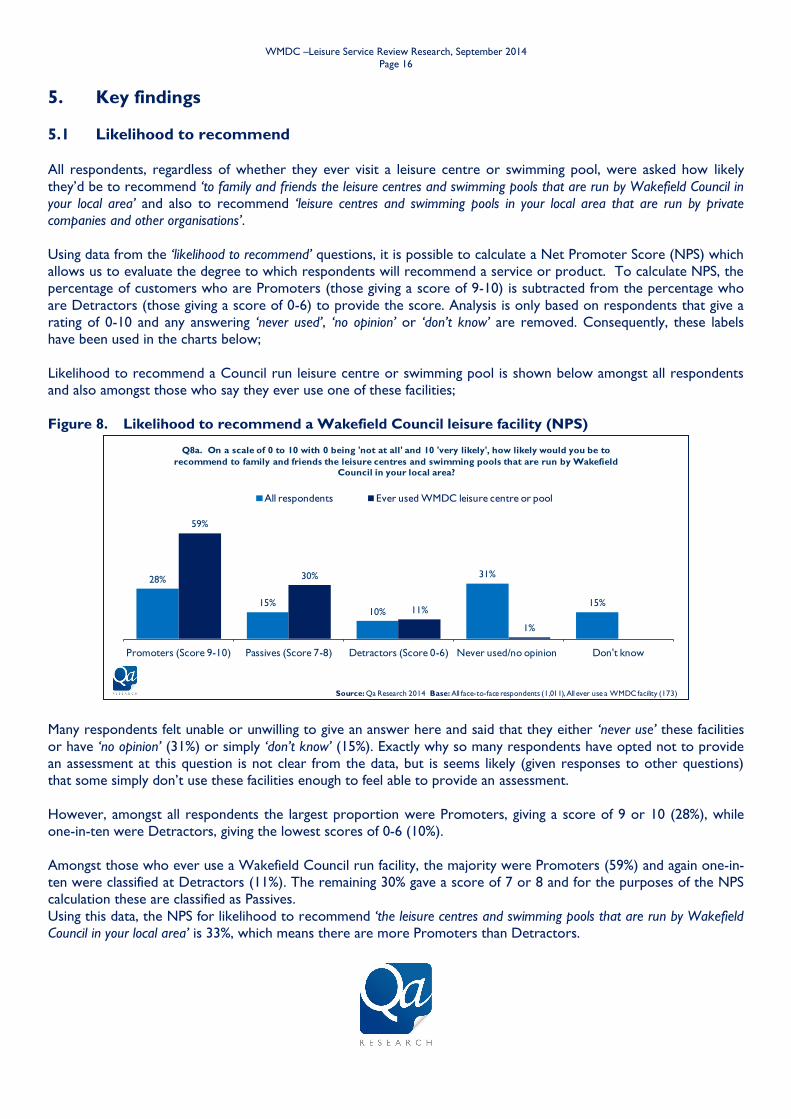
5.1 Likelihood to recommend
All respondents, regardless of whether they ever visit a leisure centre or swimming pool, were asked how likely
they’d be to recommend ‘to family and friends the leisure centres and swimming pools that are run by Wakefield Council in
your local area’ and also to recommend ‘leisure centres and swimming pools in your local area that are run by private
companies and other organisations’.
Using data from the ‘likelihood to recommend’ questions, it is possible to calculate a Net Promoter Score (NPS) which
allows us to evaluate the degree to which respondents will recommend a service or product. To calculate NPS, the
percentage of customers who are Promoters (those giving a score of 9-10) is subtracted from the percentage who
are Detractors (those giving a score of 0-6) to provide the score. Analysis is only based on respondents that give a
rating of 0-10 and any answering ‘never used’, ‘no opinion’ or ‘don’t know’ are removed. Consequently, these labels
have been used in the charts below;
Likelihood to recommend a Council run leisure centre or swimming pool is shown below amongst all respondents
and also amongst those who say they ever use one of these facilities;
Figure 8. Likelihood to recommend a Wakefield Council leisure facility (NPS)
Many respondents felt unable or unwilling to give an answer here and said that they either ‘never use’ these facilities
or have ‘no opinion’ (31%) or simply ‘don’t know’ (15%). Exactly why so many respondents have opted not to provide
an assessment at this question is not clear from the data, but is seems likely (given responses to other questions)
that some simply don’t use these facilities enough to feel able to provide an assessment.
However, amongst all respondents the largest proportion were Promoters, giving a score of 9 or 10 (28%), while
one-in-ten were Detractors, giving the lowest scores of 0-6 (10%).
Amongst those who ever use a Wakefield Council run facility, the majority were Promoters (59%) and again one-in-
ten were classified at Detractors (11%). The remaining 30% gave a score of 7 or 8 and for the purposes of the NPS
calculation these are classified as Passives.
Using this data, the NPS for likelihood to recommend ‘the leisure centres and swimming pools that are run by Wakefield
Council in your local area’ is 33%, which means there are more Promoters than Detractors.

WMDC –Leisure Service Review Research, September 2014
Page 17
11%8%
13%
47%
21%
47%
18%
9%
17%
9%
Promoters (Score 9-10) Passives (Score 7-8) Detractors (Score 0-6) Never used/no opinion Don't know
Q8b. How likely would you be to recommend leisure centres and swimming pools in your local area
that are run by private companies and other organisations?
All respondents Ever used non-WMDC operated leisure centre or pool
Source: Qa Research 2014 Base: All face-to-face respondents (1,011), All ever use a non-WMDC facility (74)
Comparative Data
The NPS figure recorded here of 33% is comparable to that recorded amongst facility users and
members in research undertaken for Wakefield Council in 20122, where the NPS was 27%. Also
in that research a national average of 25% was recorded, so Wakefield compares favourably.
Note, that bases sizes are not large enough to calculate the NPS score amongst users of each Wakefield Council run facility.
The chart below shows likelihood to recommend a leisure centre or swimming pool operated by ‘private companies
and other organisations’. Findings are shown amongst all respondents and amongst those that ever use this type of
facility;
Figure 9. Likelihood to recommend a non-Wakefield Council run leisure facility (NPS)
Only 74 out of the 1,011 respondents to the survey said they ever use this type of facility, so it’s no surprise that the
majority of all respondents said they ‘never use’ or have ‘no opinion’ (47%) or ‘don’t know’ (21%). Amongst those that
offered an opinion, attitudes were mixed with broadly equal proportions classified as Promoters (11%), Passives (8%)
and Detractors (13%).
Amongst those who have used one of these facilities, many opted not to give an opinion, but respondents were
more likely to be Promoters (47%) than they were to be Detractors (9%).
The NPS score for likelihood to recommend ‘leisure centres and swimming pools in your local area that are run by private
companies and other organisations’ is -6%, which means that these facilities are creating more Detractors than
Promoters.
2 ‘Wakefield NPS Survey’ the Retention People.

WMDC –Leisure Service Review Research, September 2014
Page 18
Sub-group Analysis
Few differences between sub-groups exist for these questions but there were some geographical differences.
Analysis in Section 6.2 highlights that respondents from Pontefract and Knottingley were the most likely to say that
they use their ‘...nearest leisure centre or swimming pool run by Wakefield Council’ and as a result, they were also more
likely to give an opinion about these facilities and only 6% said that they ‘never use’, ‘don’t know’ or have ‘no opinion’
about them. Additionally, this was the only Area were the majority of respondents were Promoters (54%). But
caution must be used when considering these results given the evidence of over claim of usage.
When asked about their likelihood to recommend a leisure centre or swimming pool operated by ‘private companies
and other organisations’, respondents living in the South East, Wakefield Central, Wakefield North West and
Wakefield Rural were the most likely to say they use these types of facilities, but attitudes were mixed towards
them.
For example, the proportion of Promoters and Detractors was the same amongst Wakefield North West
respondents (19% vs. 19%), while respondents were more likely to be Promoters in Wakefield Central (17% vs.
13%) and less likely in Wakefield Rural (8% vs. 21%). It seems likely that these attitudes are driven by the different,
specific facilities used by respondents in these areas which are likely to offer different experiences and facilities.
Self-completion survey;
Both the recommendation questions were included in the self-completion survey and responses
are shown below;
Figure 10. Likelihood to recommend a Wakefield Council facility (self-completion)
58%
19% 16%
6%
67%
19%12%
2%
NET: 9-10 NET: 7-8 NET: 0-6 Never used/no opinion
Q5a. On a scale of 0 to 10 with 0 being 'not at all' and 10 'very likely', how likely would you be to
recommend to family and friends the leisure centres and swimming pools that are run by Wakefield
Council in your local area?
All respondents Ever used WMDC leisure centre or pool
Source: Qa Research 2014 Base: All self-completion respondents (846), All ever use a WMDCfacility (669)
Amongst self-completion survey respondents, who were predominantly users of Wakefield leisure
centres and swimming pools, the majority gave the highest score at this question of 9 or 10 (58%),
while a further 19% gave a score of 7 or 8. Few gave the lowest scores of 0-6 (16%), which would
indicate that they’d be unlikely to recommend Wakefield Council run facilities. Amongst those
that said they use a Wakefield Council run facility most often, two-thirds gave the highest scores
(67%), suggesting that generally these users are happy with the leisure centres and swimming
pools that they use.
WMDC –Leisure Service Review Research, September 2014
Page 19
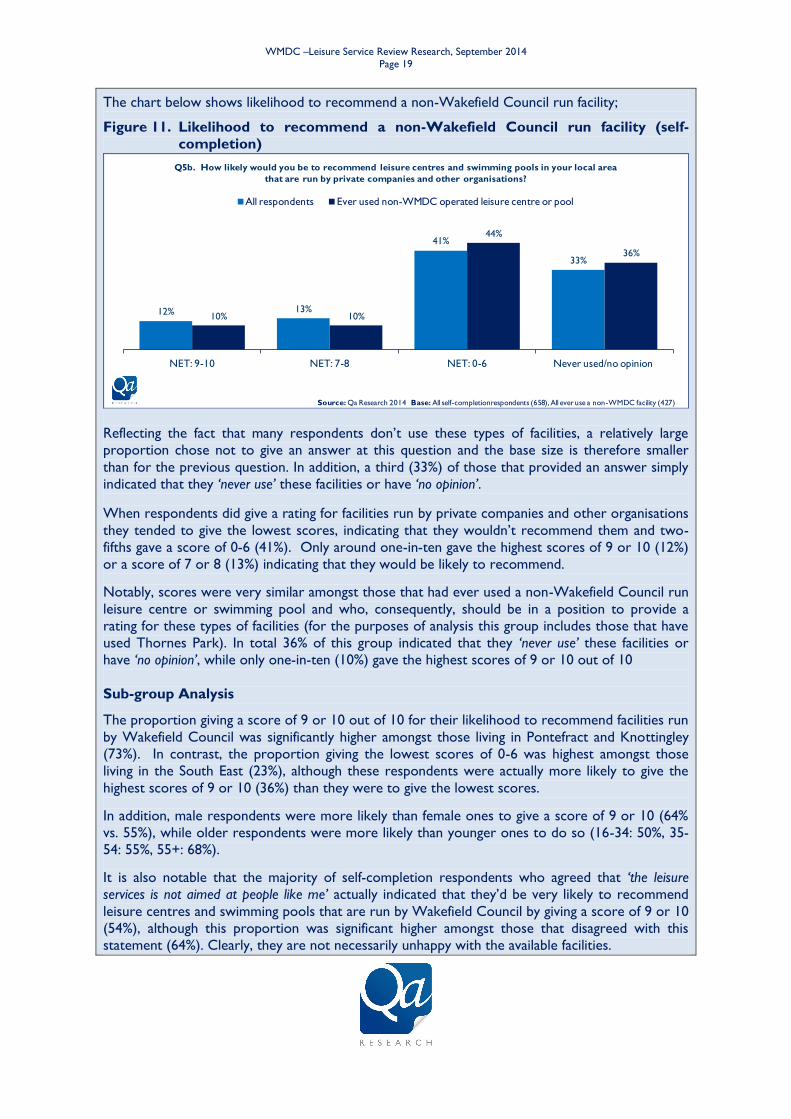
The chart below shows likelihood to recommend a non-Wakefield Council run facility;
Figure 11. Likelihood to recommend a non-Wakefield Council run facility (self-
completion)
12% 13%
41%
33%
10% 10%
44%
36%
NET: 9-10 NET: 7-8 NET: 0-6 Never used/no opinion
Q5b. How likely would you be to recommend leisure centres and swimming pools in your local area
that are run by private companies and other organisations?
All respondents Ever used non-WMDC operated leisure centre or pool
Source: Qa Research 2014 Base: All self-completionrespondents (658), All ever use a non-WMDC facility (427)
Reflecting the fact that many respondents don’t use these types of facilities, a relatively large
proportion chose not to give an answer at this question and the base size is therefore smaller
than for the previous question. In addition, a third (33%) of those that provided an answer simply
indicated that they ‘never use’ these facilities or have ‘no opinion’.
When respondents did give a rating for facilities run by private companies and other organisations
they tended to give the lowest scores, indicating that they wouldn’t recommend them and two-
fifths gave a score of 0-6 (41%). Only around one-in-ten gave the highest scores of 9 or 10 (12%)
or a score of 7 or 8 (13%) indicating that they would be likely to recommend.
Notably, scores were very similar amongst those that had ever used a non-Wakefield Council run
leisure centre or swimming pool and who, consequently, should be in a position to provide a
rating for these types of facilities (for the purposes of analysis this group includes those that have
used Thornes Park). In total 36% of this group indicated that they ‘never use’ these facilities or
have ‘no opinion’, while only one-in-ten (10%) gave the highest scores of 9 or 10 out of 10
Sub-group Analysis
The proportion giving a score of 9 or 10 out of 10 for their likelihood to recommend facilities run
by Wakefield Council was significantly higher amongst those living in Pontefract and Knottingley
(73%). In contrast, the proportion giving the lowest scores of 0-6 was highest amongst those
living in the South East (23%), although these respondents were actually more likely to give the
highest scores of 9 or 10 (36%) than they were to give the lowest scores.
In addition, male respondents were more likely than female ones to give a score of 9 or 10 (64%
vs. 55%), while older respondents were more likely than younger ones to do so (16-34: 50%, 35-
54: 55%, 55+: 68%).
It is also notable that the majority of self-completion respondents who agreed that ‘the leisure
services is not aimed at people like me’ actually indicated that they’d be very likely to recommend
leisure centres and swimming pools that are run by Wakefield Council by giving a score of 9 or 10
(54%), although this proportion was significant higher amongst those that disagreed with this
statement (64%). Clearly, they are not necessarily unhappy with the available facilities.

WMDC –Leisure Service Review Research, September 2014
Page 20
<1%
73%
2%
3%
5%
19%
27%
Don't know
None
Your nearest leisure centre or swimming pool that is not run by Wakefield Council, but is run by a another council, company or
organisation
A leisure centre or swimming pool run by Wakefield Council that is not the nearest one to your home
A leisure centre or swimming pool that is not the nearest one to your home and that is not run by Wakefield Council.
Your nearest leisure centre or swimming pool run by Wakefield Council
NET: Any Leisure centre
Q4. Which of these do you use?
Source: Qa Research 2014 Base: All face-to-face respondents (1,011)
5.2 Propensity to use Leisure Centre and Swimming Pools
This section of the survey explored the facilities used by respondents.
5.2.1 Leisure and swimming pools use
Respondents were asked to describe the type of facilities they use by choosing from a series of statements and
responses are detailed below. Please note that this was a multi-code question meaning that respondents could pick
as many different types of facilities as applied to them.
Figure 12. Types of leisure centres and swimming pools ever use
The list of activities undertaken in an average week highlighted that many of the most popular do not require a visit
to a leisure centre or swimming pool, including walking, cycling and running, so it is perhaps not surprising that the
majority of respondents said they ‘never’ visit leisure centres and swimming pools (73%).
This means that more than one-in-four do (27%) and the average number of mentions here amongst those that use
one of these facilities was 1.1 leisure centres, highlighting that people tend to use only one of these types of facility if
they use any at all.
The most frequently mentioned type was their ‘...nearest leisure centre or swimming pool run by Wakefield Council’
(19%). Few respondents made the effort to visit ‘a leisure centre or swimming pool run by Wakefield Council that is not
the nearest one to your home’ (3%).
One-in-twenty said that they visit ‘a leisure centre or swimming pool that is not the nearest one to your home and that is
not run by Wakefield Council’ (5%).
Only a handful said that they ever visit their ‘...nearest leisure centre or swimming pool that is not run by Wakefield
Council, but is run by another council, company or organisation’ (2%).
WMDC –Leisure Service Review Research, September 2014
Page 21
Sub-group Analysis
Respondents in Wakefield Rural were more likely to mention ‘a leisure centre or swimming pool that is not the nearest
one to your home and that is not run by Wakefield Council...’ (11%).
The lowest proportion of respondents indicating that they use any of these leisure centres or swimming pools was
recorded in the South East (15%), which is likely to reflect the absence of a Council run facility in this Area at the
moment.
As might be expected, younger respondents were more likely to mention ’any leisure centre’ at this question (16-34:
41%, 35-54: 31%, 55+: 12%).
Notably, 43% of those that agreed that they’d be ‘...willing to travel to get access to better quality leisure centres’
mentioned ‘any leisure centre’ at this question but most mentioned they use their ‘...nearest leisure centre or swimming
pool run by Wakefield Council’ (27%) and only relatively few mentioned one ‘... run by Wakefield Council that is not the
nearest one to your home’ (7%) or one ’...that is not the nearest one to your home and that is not run by Wakefield Council...’
(11%) suggesting they may not be as willing to travel as they have indicated.
Reflecting the fact that many activities undertaken by respondents each week do not require a visit to a leisure
centre or swimming pool, it’s notable that there was no difference in mentions of ’any leisure centre’ amongst those
who indicated that they take ‘vigorous physical activity’ ‘3 or more times a week’ compared to those that do so ‘2 or less
times a week or never’ (28% vs. 26%) highlighting that vigorous activity is not necessarily linked to usage of these
facilities. The most frequently mentioned facility amongst both groups was their ‘...nearest leisure centre or swimming
pool run by Wakefield Council’ (21% vs. 17%), but those who take vigorous activity ‘3 or more times a week’ were
significantly more likely to mention one ’...that is not the nearest one to your home and that is not run by Wakefield
Council...’ (9% vs. 2%).
WMDC –Leisure Service Review Research, September 2014
Page 22
<1%
<1%
1%
1%
1%
<1%
<1%
1%
1%
1%
1%
1%
1%
<1%
1%
<1%
2%
2%
2%
3%
3%
4%
5%
5%
10%
10%
19%
19%
<1%
<1%
1%
1%
1%
1%
1%
1%
1%
1%
1%
1%
1%
1%
1%
1%
1%
2%
2%
2%
3%
3%
4%
5%
6%
12%
13%
20%
23%
None
Don't know
Adwick (Doncaster)
Airedale Sports Centre (Airedale/Castleford)
Bannatynes Health Club (Wakefield)
Dewsbury Sports Centre
Doncaster Dome
Fitness Flex (Pontefract)
Glasshoughton Community Centre (Castleford)
Minsthorpe Academy (Minsthoprpe)
Nuffield (Wakefield)
Oasis (Belle Vue/Wakefield)
Total Fitness (Huddersfield)
Fitness 4 less (Doncaster)
Light Waves (Wakefield)
Barnsley
Thornes Club indoor football (Wakefield)
Rothwell Sports and Leisure (Leeds)
Total Fitness (Ossett)
Fit 24 (Wakefield)
Exercise for Less (Wakefield)
Thornes Park Stadium
Featherstone Sports Complex
Normanton Jubillee Pool
Metrodome (Barnsley)
Knottingley Sports Centre and Pool
Castleford Swimming Pool
Pontefract Pool
Sun Lane Leisure
Q5a. Which leisure centre or swimming pools do you use?
Q5b. Leisure centre or swimming pools use most often
- All facilities mentioned by 1% of more -
Q5a - ever use
Q5b - Use most often
Source: Qa Research 2014 Base: All face-to-face respondents who ever use a leisure centre or swimming pool (247)
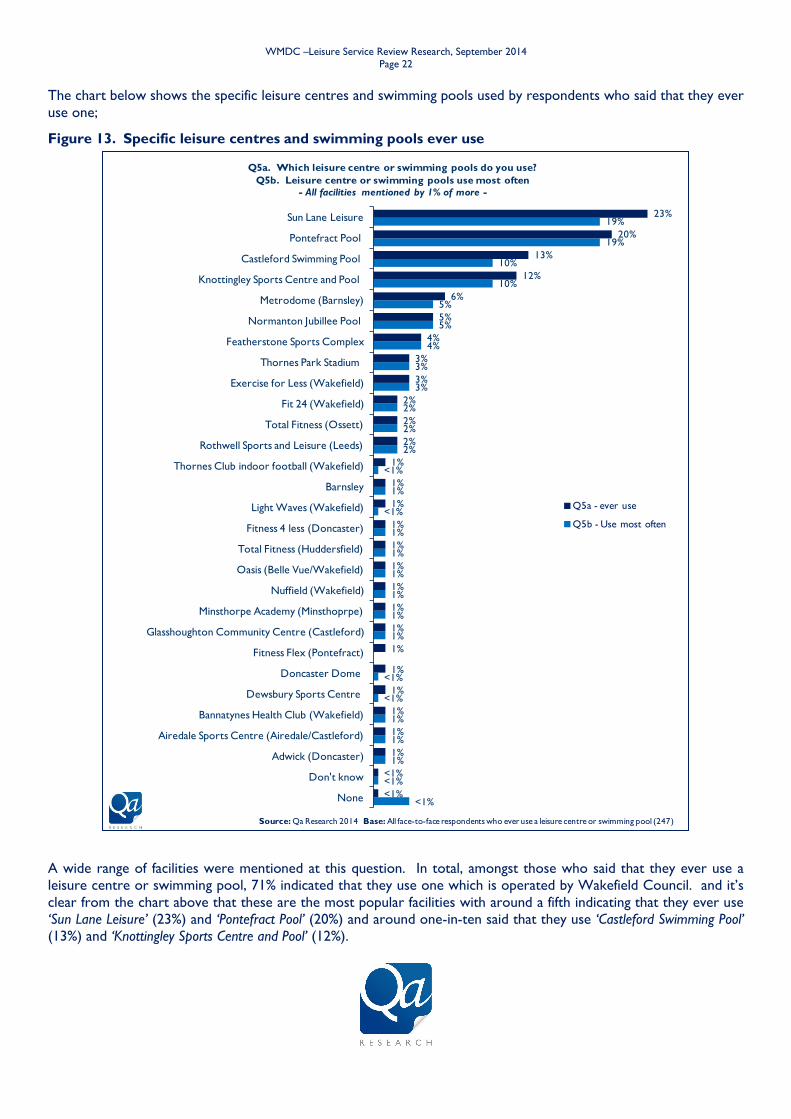
The chart below shows the specific leisure centres and swimming pools used by respondents who said that they ever
use one;
Figure 13. Specific leisure centres and swimming pools ever use
A wide range of facilities were mentioned at this question. In total, amongst those who said that they ever use a
leisure centre or swimming pool, 71% indicated that they use one which is operated by Wakefield Council. and it’s
clear from the chart above that these are the most popular facilities with around a fifth indicating that they ever use
‘Sun Lane Leisure’ (23%) and ‘Pontefract Pool’ (20%) and around one-in-ten said that they use ‘Castleford Swimming Pool’
(13%) and ‘Knottingley Sports Centre and Pool’ (12%).

WMDC –Leisure Service Review Research, September 2014
Page 23
Also, most frequently mentioned facility not operated by Wakefield Council was ‘Metrodome (Barnsley)’ (6%).
When asked to choose the one facility they use most often, a similar pattern was recorded with ‘Sun Lane Leisure’
(19%) and ‘Pontefract Pool’ (19%) mentioned most frequently and in total 66% mentioned a leisure centre or
swimming pool operated by Wakefield Council.
However, a third (34%) of respondents to the survey who ever use leisure centres and swimming pools said that the
one they use most often is not one operated by the Council and respondents mentioned that they use ‘Metrodome
(Barnsley)’ (5%), ‘Exercise for Less (Wakefield)’ (3%), ‘Fit 24 (Wakefield)’ (2%) and ‘Total Fitness’ (Ossett)’ (2%) amongst
many others. This proportion is greater than that recorded at Q4 of the face-to-face survey and suggests that users
may not necessarily know who operates the leisure centres and swimming pools that they use.
Sub-group Analysis
Limited sub-group analysis is possible here due to the small bases size, but respondents living outside the Five Towns
area were more likely than those in it to say that the they use a facility most often that is not operated by the
Council (59% vs. 12%).

WMDC –Leisure Service Review Research, September 2014
Page 24
Self-completion survey;
Usage of leisure centres amongst respondents to the self-completion survey is detailed below;
Figure 14. Types of leisure centres and swimming pools ever use (self-completion)
9%
9%
9%
32%
70%
91%
None
Your nearest leisure centre or swimming pool that is not run by Wakefield Council, but is run by a another council, company or
organisation
A leisure centre or swimming pool that is not the nearest one to your home and that is not run by Wakefield Council.
A leisure centre or swimming pool run by Wakefield Council that is not the nearest one to your home
Your nearest leisure centre or swimming pool run by Wakefield Council
NET: Any Leisure centre
Q3. Which of these do you use?
Source: Qa Research 2014 Base: All self-completion respondents - valid responses (859)
As the chart above indicates, generally speaking, the self-completion survey was completed by
residents that use leisure centres and swimming pools, with more than nine-out-of-ten indicating
that they do (91%).
Moreover, respondents predominantly said that they use facilities provided by Wakefield Council
and this was mainly their ‘...nearest leisure centre or swimming pool’ (70%), although more than a
third also mentioned using ‘a leisure centre or swimming pool run by Wakefield Council that is not the
nearest one to your home’ (30%).
Around one-in-ten said that they visit ‘a leisure centre or swimming pool that is not the nearest one to
your home and that is not run by Wakefield Council’ (9%) and their ‘...nearest leisure centre or swimming
pool that is not run by Wakefield Council, but is run by another council, company or organisation’ (9%).
Therefore, overwhelmingly, this is a sample of residents that use Wakefield Council run facilities.
Sub-group Analysis
As was the case amongst face-to-face respondents, those that agreed that they’d be ‘...willing to
travel to get access to better quality leisure centres’ were most likely to mention that they use their
‘...nearest leisure centre or swimming pool run by Wakefield Council’ (68%) and they were less likely to
mention one ‘... run by Wakefield Council that is not the nearest one to your home’ (31%) or one ’...that
is not the nearest one to your home and that is not run by Wakefield Council...’ (10%) or their ‘... nearest
leisure centre or swimming pool that is not run by Wakefield Council, but is run by another council,
company or organisation’. This suggests they may not be as willing to travel as they have indicated.
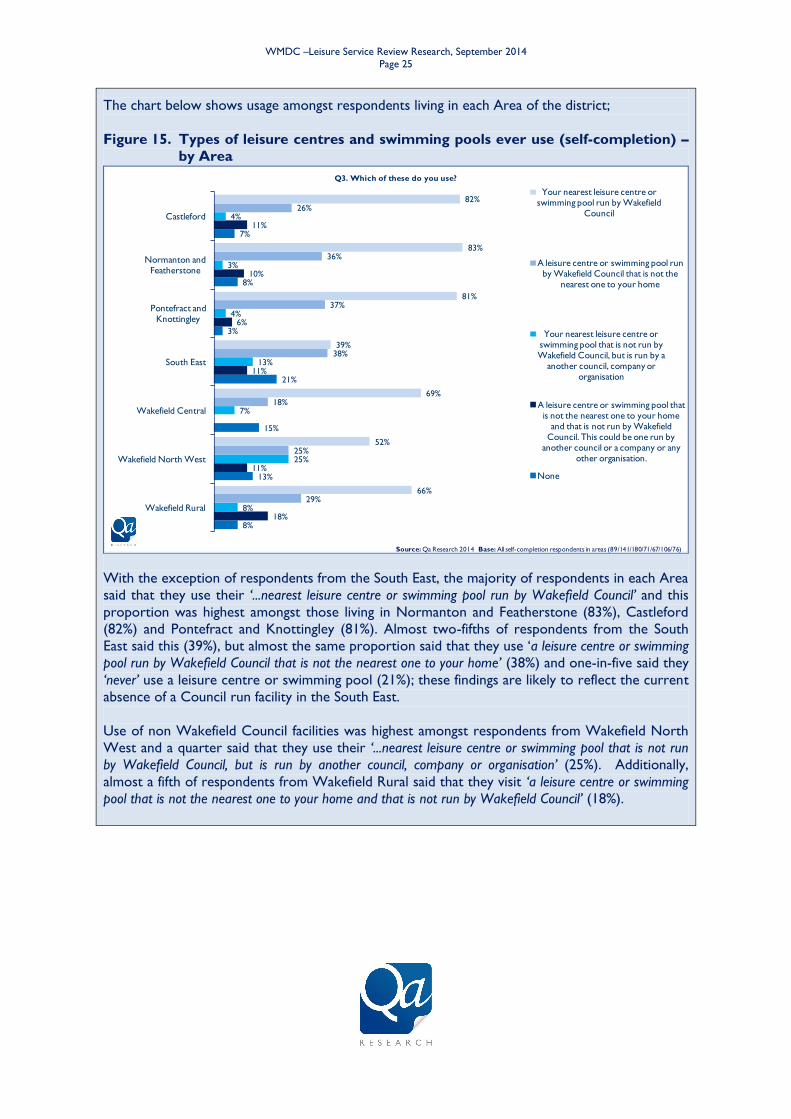
WMDC –Leisure Service Review Research, September 2014
Page 25
The chart below shows usage amongst respondents living in each Area of the district;
Figure 15. Types of leisure centres and swimming pools ever use (self-completion) –
by Area
8%
13%
15%
21%
3%
8%
7%
18%
11%
11%
6%
10%
11%
8%
25%
7%
13%
4%
3%
4%
29%
25%
18%
38%
37%
36%
26%
66%
52%
69%
39%
81%
83%
82%
Wakefield Rural
Wakefield North West
Wakefield Central
South East
Pontefract and Knottingley
Normanton and Featherstone
Castleford
Q3. Which of these do you use?
Your nearest leisure centre or swimming pool run by Wakefield
Council
A leisure centre or swimming pool run by Wakefield Council that is not the
nearest one to your home
Your nearest leisure centre or swimming pool that is not run by Wakefield Council, but is run by a
another council, company or organisation
A leisure centre or swimming pool that is not the nearest one to your home
and that is not run by Wakefield Council. This could be one run by
another council or a company or any other organisation.
None
Source: Qa Research 2014 Base: All self-completion respondents in areas (89/141/180/71/67/106/76)
With the exception of respondents from the South East, the majority of respondents in each Area
said that they use their ‘...nearest leisure centre or swimming pool run by Wakefield Council’ and this
proportion was highest amongst those living in Normanton and Featherstone (83%), Castleford
(82%) and Pontefract and Knottingley (81%). Almost two-fifths of respondents from the South
East said this (39%), but almost the same proportion said that they use ‘a leisure centre or swimming
pool run by Wakefield Council that is not the nearest one to your home’ (38%) and one-in-five said they
‘never’ use a leisure centre or swimming pool (21%); these findings are likely to reflect the current
absence of a Council run facility in the South East.
Use of non Wakefield Council facilities was highest amongst respondents from Wakefield North
West and a quarter said that they use their ‘...nearest leisure centre or swimming pool that is not run
by Wakefield Council, but is run by another council, company or organisation’ (25%). Additionally,
almost a fifth of respondents from Wakefield Rural said that they visit ‘a leisure centre or swimming
pool that is not the nearest one to your home and that is not run by Wakefield Council’ (18%).
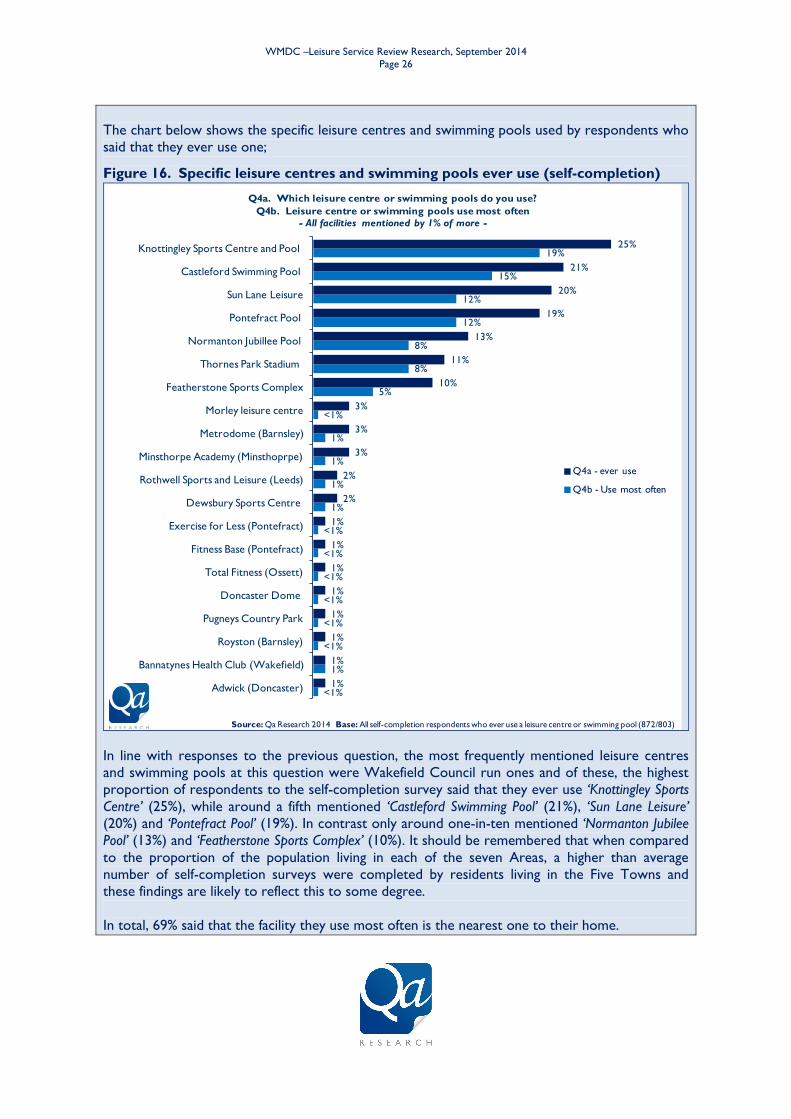
WMDC –Leisure Service Review Research, September 2014
Page 26
The chart below shows the specific leisure centres and swimming pools used by respondents who
said that they ever use one;
Figure 16. Specific leisure centres and swimming pools ever use (self-completion)
<1%
1%
<1%
<1%
<1%
<1%
<1%
<1%
1%
1%
1%
1%
<1%
5%
8%
8%
12%
12%
15%
19%
1%
1%
1%
1%
1%
1%
1%
1%
2%
2%
3%
3%
3%
10%
11%
13%
19%
20%
21%
25%
Adwick (Doncaster)
Bannatynes Health Club (Wakefield)
Royston (Barnsley)
Pugneys Country Park
Doncaster Dome
Total Fitness (Ossett)
Fitness Base (Pontefract)
Exercise for Less (Pontefract)
Dewsbury Sports Centre
Rothwell Sports and Leisure (Leeds)
Minsthorpe Academy (Minsthoprpe)
Metrodome (Barnsley)
Morley leisure centre
Featherstone Sports Complex
Thornes Park Stadium
Normanton Jubillee Pool
Pontefract Pool
Sun Lane Leisure
Castleford Swimming Pool
Knottingley Sports Centre and Pool
Q4a. Which leisure centre or swimming pools do you use?
Q4b. Leisure centre or swimming pools use most often- All facilities mentioned by 1% of more -
Q4a - ever use
Q4b - Use most often
Source: Qa Research 2014 Base: All self-completion respondents who ever use a leisure centre or swimming pool (872/803)
In line with responses to the previous question, the most frequently mentioned leisure centres
and swimming pools at this question were Wakefield Council run ones and of these, the highest
proportion of respondents to the self-completion survey said that they ever use ‘Knottingley Sports
Centre’ (25%), while around a fifth mentioned ‘Castleford Swimming Pool’ (21%), ‘Sun Lane Leisure’
(20%) and ‘Pontefract Pool’ (19%). In contrast only around one-in-ten mentioned ‘Normanton Jubilee
Pool’ (13%) and ‘Featherstone Sports Complex’ (10%). It should be remembered that when compared
to the proportion of the population living in each of the seven Areas, a higher than average
number of self-completion surveys were completed by residents living in the Five Towns and
these findings are likely to reflect this to some degree.
In total, 69% said that the facility they use most often is the nearest one to their home.
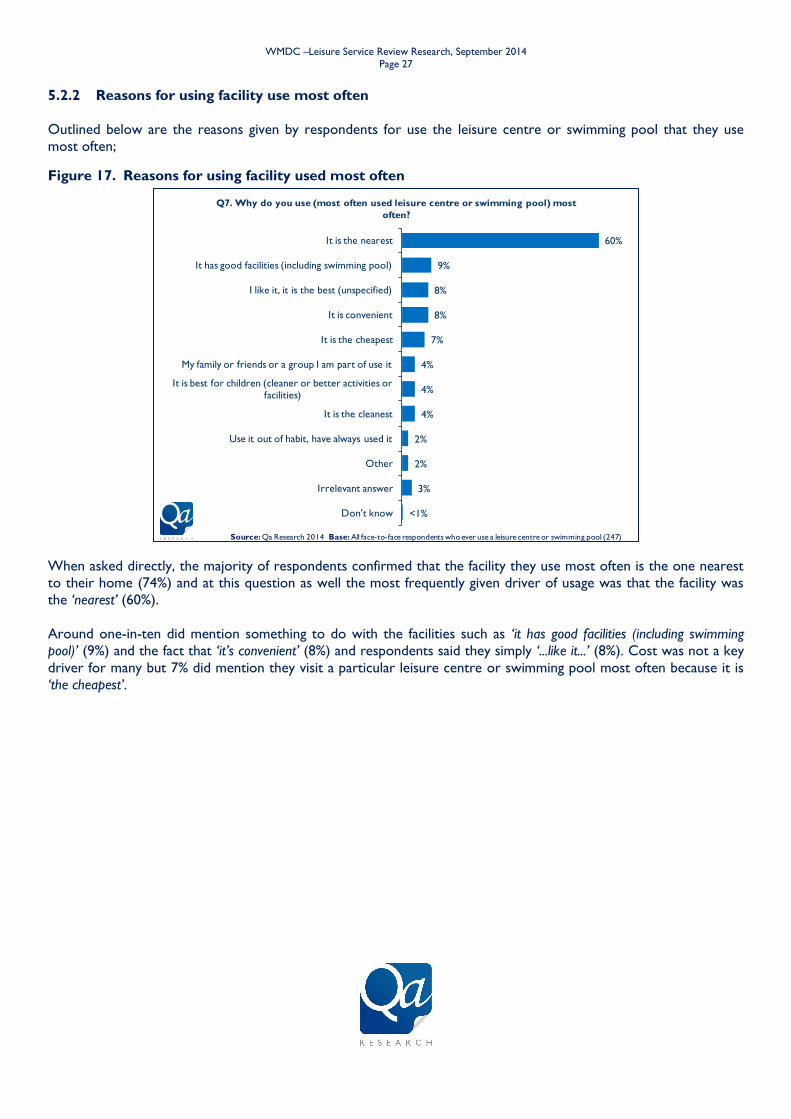
WMDC –Leisure Service Review Research, September 2014
Page 27
<1%
3%
2%
2%
4%
4%
4%
7%
8%
8%
9%
60%
Don't know
Irrelevant answer
Other
Use it out of habit, have always used it
It is the cleanest
It is best for children (cleaner or better activities or facilities)
My family or friends or a group I am part of use it
It is the cheapest
It is convenient
I like it, it is the best (unspecified)
It has good facilities (including swimming pool)
It is the nearest
Q7. Why do you use (most often used leisure centre or swimming pool) most
often?
Source: Qa Research 2014 Base: All face-to-face respondents whoever use a leisure centre or swimming pool (247)
5.2.2 Reasons for using facility use most often
Outlined below are the reasons given by respondents for use the leisure centre or swimming pool that they use
most often;
Figure 17. Reasons for using facility used most often
When asked directly, the majority of respondents confirmed that the facility they use most often is the one nearest
to their home (74%) and at this question as well the most frequently given driver of usage was that the facility was
the ‘nearest’ (60%).
Around one-in-ten did mention something to do with the facilities such as ‘it has good facilities (including swimming
pool)’ (9%) and the fact that ‘it’s convenient’ (8%) and respondents said they simply ‘...like it...’ (8%). Cost was not a key
driver for many but 7% did mention they visit a particular leisure centre or swimming pool most often because it is
‘the cheapest’.
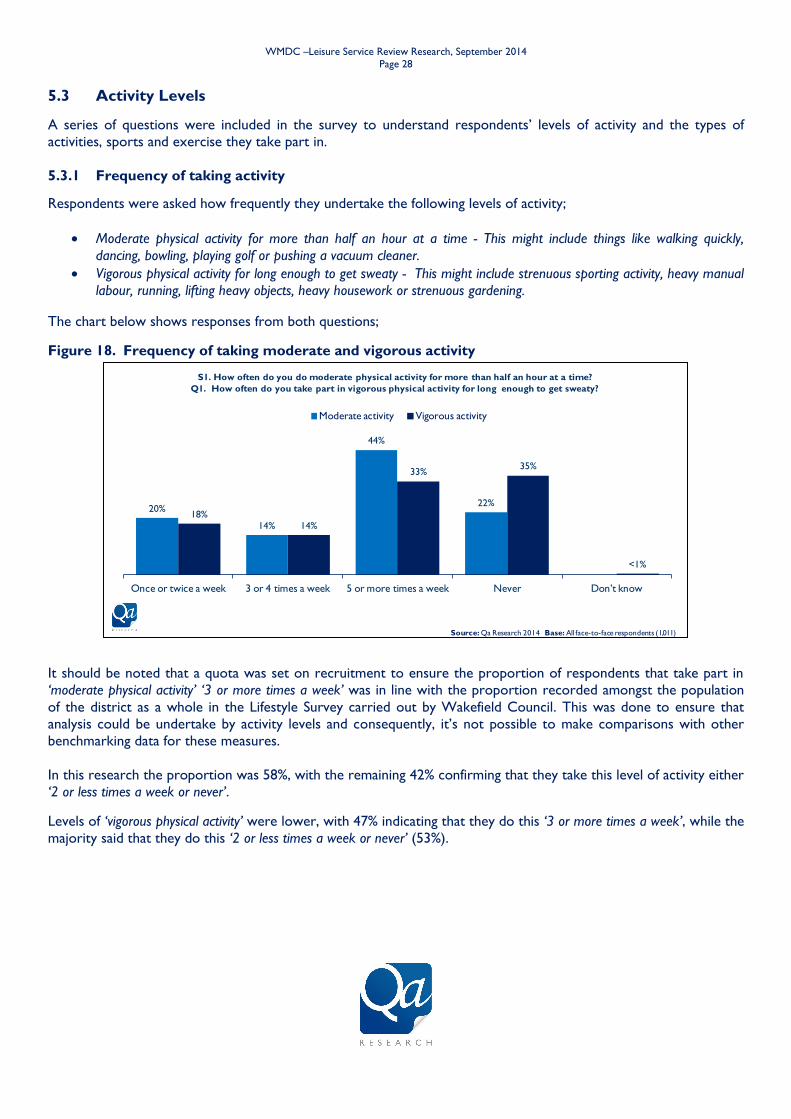
WMDC –Leisure Service Review Research, September 2014
Page 28
20%
14%
44%
22%18%
14%
33%35%
<1%
Once or twice a week 3 or 4 times a week 5 or more times a week Never Don’t know
S1. How often do you do moderate physical activity for more than half an hour at a time?
Q1. How often do you take part in vigorous physical activity for long enough to get sweaty?
Moderate activity Vigorous activity
Source: Qa Research 2014 Base: All face-to-face respondents (1,011)
5.3 Activity Levels
A series of questions were included in the survey to understand respondents’ levels of activity and the types of
activities, sports and exercise they take part in.
5.3.1 Frequency of taking activity
Respondents were asked how frequently they undertake the following levels of activity;
Moderate physical activity for more than half an hour at a time - This might include things like walking quickly,
dancing, bowling, playing golf or pushing a vacuum cleaner.
Vigorous physical activity for long enough to get sweaty - This might include strenuous sporting activity, heavy manual
labour, running, lifting heavy objects, heavy housework or strenuous gardening.
The chart below shows responses from both questions;
Figure 18. Frequency of taking moderate and vigorous activity
It should be noted that a quota was set on recruitment to ensure the proportion of respondents that take part in
‘moderate physical activity’ ‘3 or more times a week’ was in line with the proportion recorded amongst the population
of the district as a whole in the Lifestyle Survey carried out by Wakefield Council. This was done to ensure that
analysis could be undertake by activity levels and consequently, it’s not possible to make comparisons with other
benchmarking data for these measures.
In this research the proportion was 58%, with the remaining 42% confirming that they take this level of activity either
‘2 or less times a week or never’.
Levels of ‘vigorous physical activity’ were lower, with 47% indicating that they do this ‘3 or more times a week’, while the
majority said that they do this ‘2 or less times a week or never’ (53%).
WMDC –Leisure Service Review Research, September 2014
Page 29
Sub-group Analysis
There were no significant differences in the frequency of taking either type of activity between different age groups,
with the majority indicating that they take part in ‘moderate physical activity’ on ‘3 or more times a week’ (16-34: 62%,
35-54: 55%, 55+: 57%) but that they take part in ‘vigorous physical activity’ either ‘2 or less times a week or never’ (16-34:
52%, 35-54: 53%, 55+: 54%).
Notably, males were more likely than females to say they take ‘vigorous physical activity’ on ‘3 or more times a week’
(50% vs. 43%). The research indicates that, in the district as a whole, females are more likely than males to require
sports halls for their preferred activities (30% vs. 20%) and swimming pools (33% vs. 20%), while they are less likely
to require pitches (9%) vs. 22%) and the availability of these facilities may be driving different levels of usage to some
degree. Supporting this, the Review of Leisure Services undertaken by Deloitte in January 2014 highlighted an
‘undersupply’ in the district of sports halls and a ‘latent demand’ for health and fitness facilities in the Five Towns area.
Additionally, amongst respondents who ever use a leisure centre or swimming pool, those that most often use one
that is not operated by Wakefield Council were more likely that those who use one that is operated by the Council
to say that they take vigorous physical activity’ on ‘3 or more times a week’ (68% vs. 38%). It was also the case
respondents who agreed that ‘the leisure service is not aimed at people like me’ were less likely to undertake this level
of activity ‘3 or more times a week’ (35%). These findings suggest that the facilities provided by the Council may not
fully meet the needs of many of the most active residents.
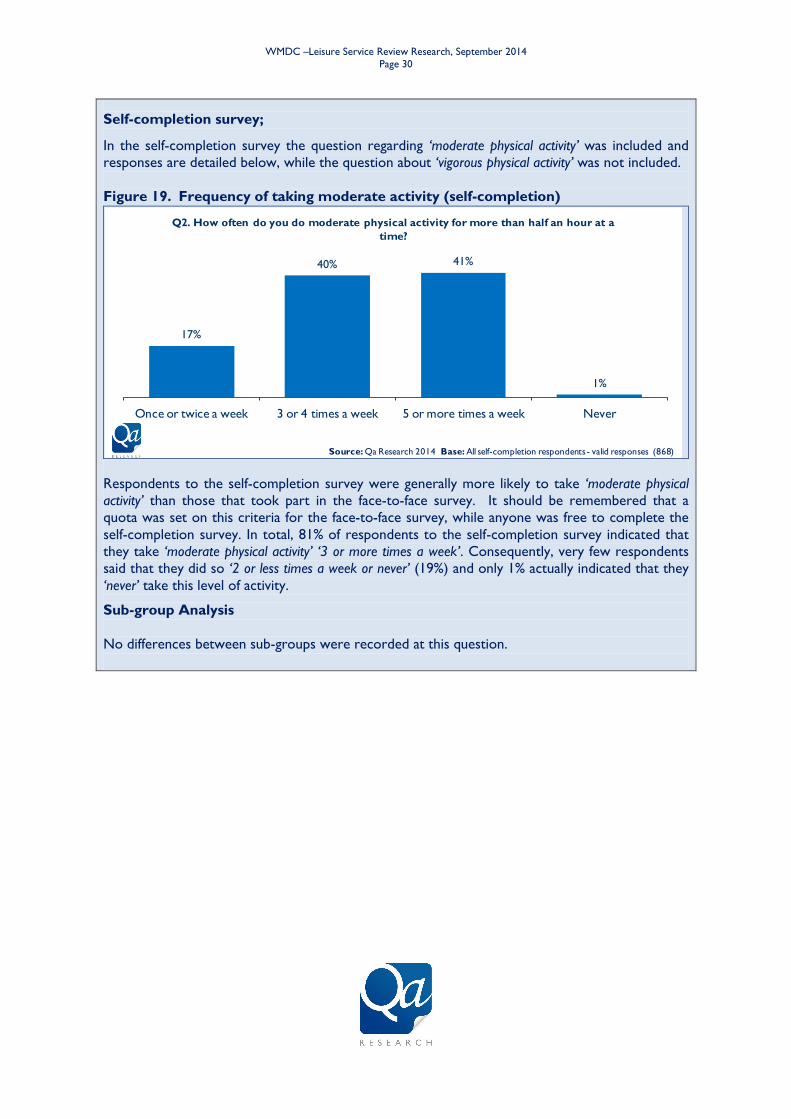
WMDC –Leisure Service Review Research, September 2014
Page 30
Self-completion survey;
In the self-completion survey the question regarding ‘moderate physical activity’ was included and
responses are detailed below, while the question about ‘vigorous physical activity’ was not included.
Figure 19. Frequency of taking moderate activity (self-completion)
17%
40% 41%
1%
Once or twice a week 3 or 4 times a week 5 or more times a week Never
Q2. How often do you do moderate physical activity for more than half an hour at a
time?
Source: Qa Research 2014 Base: All self-completion respondents - valid responses (868)
Respondents to the self-completion survey were generally more likely to take ‘moderate physical
activity’ than those that took part in the face-to-face survey. It should be remembered that a
quota was set on this criteria for the face-to-face survey, while anyone was free to complete the
self-completion survey. In total, 81% of respondents to the self-completion survey indicated that
they take ‘moderate physical activity’ ‘3 or more times a week’. Consequently, very few respondents
said that they did so ‘2 or less times a week or never’ (19%) and only 1% actually indicated that they
‘never’ take this level of activity.
Sub-group Analysis
No differences between sub-groups were recorded at this question.

WMDC –Leisure Service Review Research, September 2014
Page 31
30%
1%
1%
1%
1%
1%
1%
1%
1%
2%
2%
3%
5%
8%
8%
10%
12%
20%
21%
None
Manual work
Dancing
Rugby league
Bowls (lawn and indoor)
Boxing
Yoga
Zumba
Cleaning and housework
Golf
Gardening
Weight training
Football
Running
Cycling
Gym
Swimming
Walking (not rambling)
Rambling (walking)
Q2. What, if any, activities, sports or exercise do you take part in
during an average week? Please tell me the FIVE you do most
often
Source: Qa Research 2014 Base: All face-to-face respondents (1,011)
5.3.2 Types of activity undertaken during a typical week
All respondents were then asked to outline the activities, sports and exercise they take part in during an average
week and responses were as follows;
Figure 20. Activities take part in during a typical week
When asked what activities they take part in, almost a third said they take part in ‘none’ (30%) but around a fifth
mentioned ‘rambling (walking)’ (21%) and ‘walking (not rambling)’ (20%), while around one-in-ten mentioned ‘swimming’
(12%), ‘gym’ (10%), ‘cycling’ (8%) and ‘running’ (8%).
Note, that the relatively high proportion of respondents mentioning ‘rambling (walking)’ suggests that many may have
viewed this as including activities such as dog walking or short local walks rather than dedicated trips to the
countryside for this purpose.

WMDC –Leisure Service Review Research, September 2014
Page 32
Comparative data;
In Wave 6 of the Active People Survey (APS6) undertaken by Sport England (April 2011-April
2012), which is the wave where Wakefield Council have the most detailed breakdown, suggest
11.5% of residents are undertaking gym and 7% are undertaking swimming.
The proportion mentioning here that they swim each week is higher than the actual proportion
recorded via usage figures supplied by Wakefield Council (6%) or the APS6, suggesting that there
may be some degree of over-claim regarding this activity. Additionally, ‘swimming’ was mentioned
more by respondents living in Castleford (25%) or Pontefract and Knottingley (20%), suggesting
that this over-claim may be driven by respondents from these areas where there is a threat of
closure to the local pools.
Sub-group Analysis
Older respondents were more likely to mention ‘none’ at this question (16-34: 24%, 35-54: 28%, 55+: 37%) and there
were some clear differences in the types of activities undertaken between different age groups with ‘walking (not
rambling)’ mentioned more by older people (16-34: 15%, 35-54: 14%, 55+: 30%) along with ‘gardening’ (16-34: 0%, 35-
54: 1%, 55+: 5%). In contrast, younger respondents were more likely to mention ‘football’ (16-34: 11%, 35-54: 4%,
55+: 1%) and ‘cycling’ (16-34: 7%, 35-54: 13%, 55+: 3%).
In addition, ‘swimming’ was mentioned more by respondents living in Castleford (25%) or Pontefract and Knottingley
(20%) than it was by those in Normanton and Featherstone (13%), South East (8%), Wakefield Central (9%),
Wakefield North West (9%) and Wakefield Rural (9%).
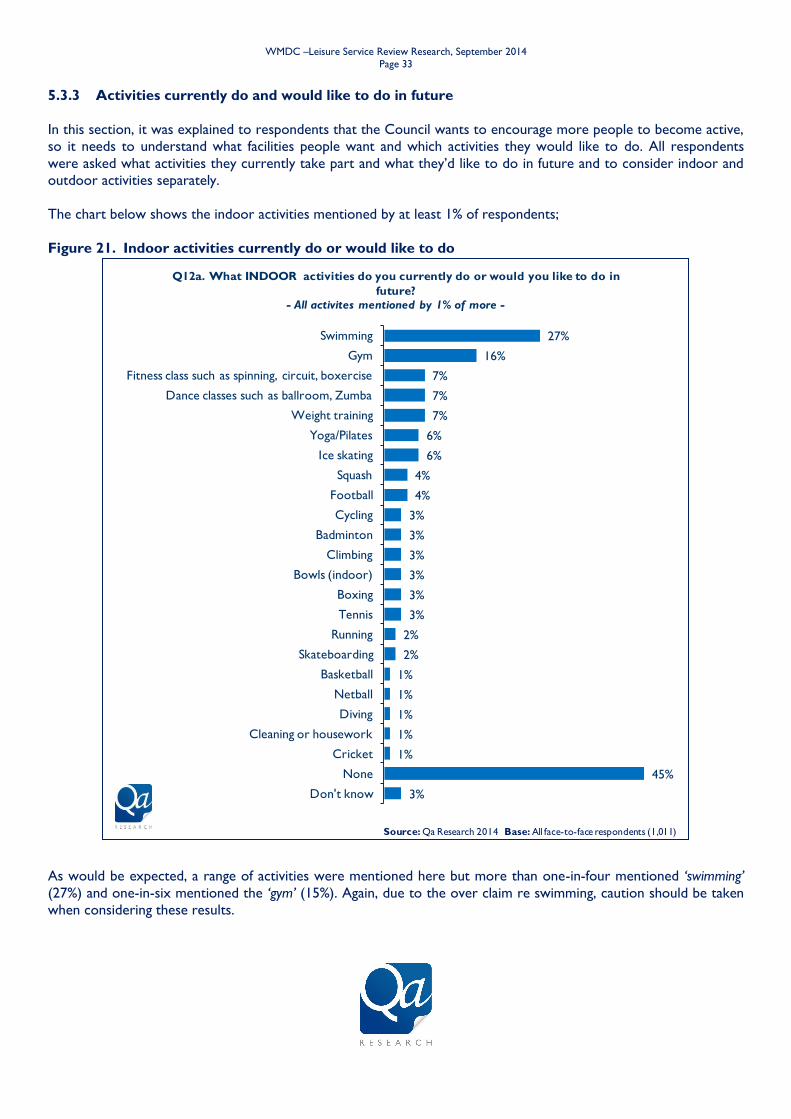
WMDC –Leisure Service Review Research, September 2014
Page 33
3%
45%
1%
1%
1%
1%
1%
2%
2%
3%
3%
3%
3%
3%
3%
4%
4%
6%
6%
7%
7%
7%
16%
27%
Don't know
None
Cricket
Cleaning or housework
Diving
Netball
Basketball
Skateboarding
Running
Tennis
Boxing
Bowls (indoor)
Climbing
Badminton
Cycling
Football
Squash
Ice skating
Yoga/Pilates
Weight training
Dance classes such as ballroom, Zumba
Fitness class such as spinning, circuit, boxercise
Gym
Swimming
Q12a. What INDOOR activities do you currently do or would you like to do in
future?
- All activites mentioned by 1% of more -
Source: Qa Research 2014 Base: All face-to-face respondents (1,011)
5.3.3 Activities currently do and would like to do in future
In this section, it was explained to respondents that the Council wants to encourage more people to become active,
so it needs to understand what facilities people want and which activities they would like to do. All respondents
were asked what activities they currently take part and what they’d like to do in future and to consider indoor and
outdoor activities separately.
The chart below shows the indoor activities mentioned by at least 1% of respondents;
Figure 21. Indoor activities currently do or would like to do
As would be expected, a range of activities were mentioned here but more than one-in-four mentioned ‘swimming’
(27%) and one-in-six mentioned the ‘gym’ (15%). Again, due to the over claim re swimming, caution should be taken
when considering these results.
WMDC –Leisure Service Review Research, September 2014
Page 34
Sub-group Analysis
Notably, the majority of those that said they do ‘moderate physical activity’ either ‘2 or less times or never’ answered
‘none’ to this question (54%), but the most frequently mentioned activities amongst this group were ‘swimming’ (21%),
‘gym’ (11%), ‘fitness class such as spinning, circuit, boxercise’ (8%), ‘dance classes such as ballroom, Zumba’ (7%) and ‘ice
skating’ (7%) suggesting that these would be the best activities to focus on providing to encourage participation
amongst those that are least likely to take physical activity.
Differences exist between different demographic groups and in particular, females were more likely than males to
mention ‘swimming’ (34% vs. 20%), ‘yoga/pilates’ (11% vs. 1%), ‘ice skating’ (10% vs. 3%) and ‘dance classes such as
ballroom, Zumba’ (12% vs. 2%). In contrast, males were more likely to mention ‘gym’ (19% vs. 13%), ‘weight training’
(10% vs. 3%) and ‘football’ (6% vs. 1%).
Also, as expected, many differences exist between different age groups and overall participation and desire to
participate in indoor activities declines as respondents get older with younger respondents less likely to say ‘none’ at
this question (16-34: 31%, 35-54: 40%, 55+: 63%). ‘swimming’ was the most frequently mentioned activity amongst all
age groups (16-34: 37%, 35-54: 29%, 55+: 17%). But again due to the over claim in relation to swimming in this
survey, caution should be taken when considering these results.
Respondents that agreed with the statement ‘access to high quality leisure centres is more important to me than the
number of buildings the service’ were more likely than those that disagreed to mention an indoor activity at this
question and less likely to say that there were ‘none’ they did or wanted to do in future (31% vs. 54%). Essentially,
this means that those that agree that high quality leisure centres are important are the more likely to use indoor
facilities.
It is also worth noting that while half of respondents who agreed that ‘the leisure service is not aimed at people like me’
didn’t mention any indoor activity at this question (50%) and a few said they ‘don’t know’ (1%), this means that almost
half did mentioned something. This suggests that a feeling that the service isn’t for them may simply reflect
unhappiness with the facilities it offers or some other aspects of the service (e.g. the costs, atmosphere, location
etc.), rather than a rejection of the types of activities available.

WMDC –Leisure Service Review Research, September 2014
Page 35
1%
1%
1%
1%
1%
1%
2%
2%
2%
3%
4%
4%
4%
4%
5%
5%
5%
6%
8%
9%
9%
10%
13%
27%
50%
Cricket
Walking (not rambling)
Exercise at home (sit ups, press ups)
Skateboarding
Diving
Netball
Cleaning or housework
Basketball
Running
Tennis
Squash
Climbing
Boxing
Something else
Cycling
Badminton
Bowls (indoor)
Football
Yoga/Pilates
Fitness class such as spinning, circuit, boxercise
Ice skating
Weight training
Dance classes such as ballroom, Zumba
Gym
Swimming
Q12b. Of the ones you've mentioned, can you tell me the top THREE that
you'd like to do in future, starting with the one you'd like to do most?
- All activites mentioned by 1% of more -
Source: Qa Research 2014 Base: All face-to-face respondents mentioning an activity at Q12a (479)
All respondents who mentioned at least one activity that they did or would like to do were asked to pick their top 3
from the list of activities they mentioned and responses are shown below;
Figure 22. Indoor activities currently do or would like to do – top 3 mentions
The data above simply reinforces the popularity of ‘swimming’ which was mentioned by the majority (50%) of those
that answered this question. But again due to the over claim in relation to swimming in this survey, caution should be
taken when considering these results.
It also highlights the popularity of the ‘gym’ (27%) and ‘weight training’ (10%) as well as classes including ‘dance classes
such as ballroom, Zumba’ (13%) and ‘fitness class such as spinning, circuit, boxercise’ (9%) as well as ‘yoga/pilates’ (8%).
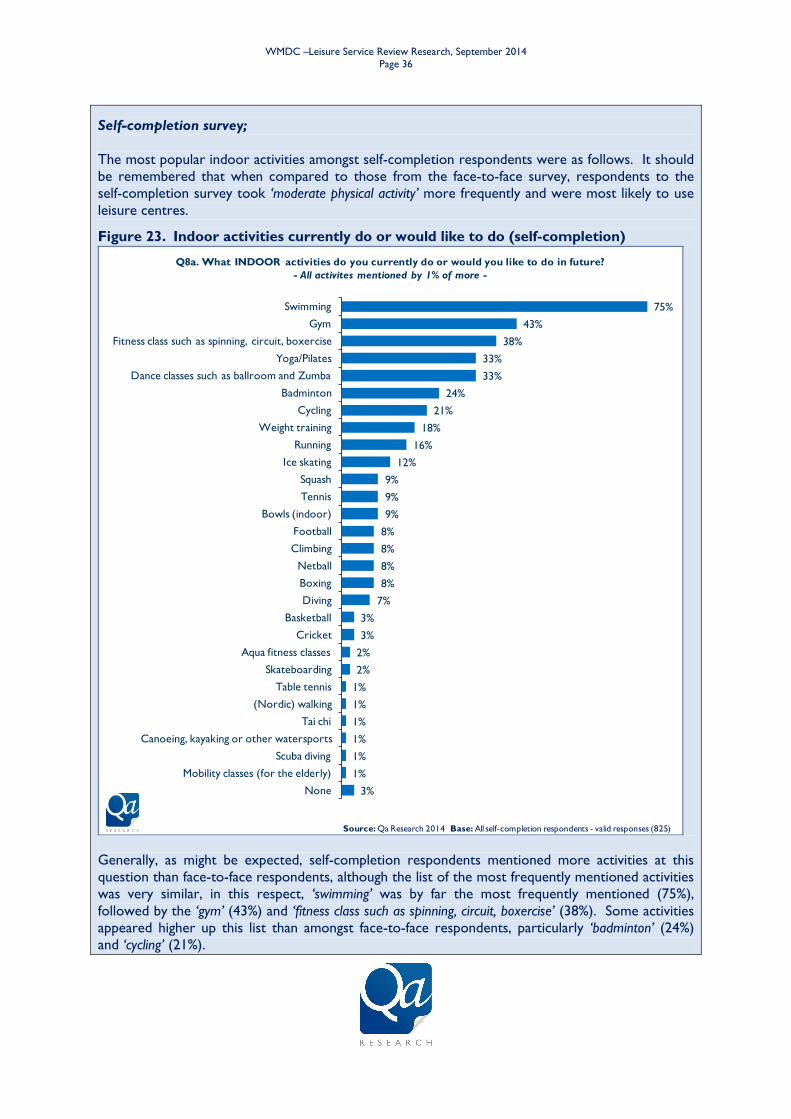
WMDC –Leisure Service Review Research, September 2014
Page 36
Self-completion survey;
The most popular indoor activities amongst self-completion respondents were as follows. It should
be remembered that when compared to those from the face-to-face survey, respondents to the
self-completion survey took ‘moderate physical activity’ more frequently and were most likely to use
leisure centres.
Figure 23. Indoor activities currently do or would like to do (self-completion)
3%
1%
1%
1%
1%
1%
1%
2%
2%
3%
3%
7%
8%
8%
8%
8%
9%
9%
9%
12%
16%
18%
21%
24%
33%
33%
38%
43%
75%
None
Mobility classes (for the elderly)
Scuba diving
Canoeing, kayaking or other watersports
Tai chi
(Nordic) walking
Table tennis
Skateboarding
Aqua fitness classes
Cricket
Basketball
Diving
Boxing
Netball
Climbing
Football
Bowls (indoor)
Tennis
Squash
Ice skating
Running
Weight training
Cycling
Badminton
Dance classes such as ballroom and Zumba
Yoga/Pilates
Fitness class such as spinning, circuit, boxercise
Gym
Swimming
Q8a. What INDOOR activities do you currently do or would you like to do in future?
- All activites mentioned by 1% of more -
Source: Qa Research 2014 Base: All self-completion respondents - valid responses (825)
Generally, as might be expected, self-completion respondents mentioned more activities at this
question than face-to-face respondents, although the list of the most frequently mentioned activities
was very similar, in this respect, ‘swimming’ was by far the most frequently mentioned (75%),
followed by the ‘gym’ (43%) and ‘fitness class such as spinning, circuit, boxercise’ (38%). Some activities
appeared higher up this list than amongst face-to-face respondents, particularly ‘badminton’ (24%)
and ‘cycling’ (21%).

WMDC –Leisure Service Review Research, September 2014
Page 37
When asked to choose the top three activities they most like to do in future, self-completion
respondents generally chose the same activities and the order of mentions was very similar. But,
when asked to focus on only three activities in this way, the importance of ‘swimming’ to
respondents was highlighted even further with 70% mentioning this, a figure more than double the
next most frequently mentioned activities which were ‘fitness class such as spinning, circuit, boxercise’
(28%) and the ‘gym’ (28%).
Sub-group Analysis
Some differences between respondents in different parts of the district were recorded here and the
tables below show the top 10 activities mentioned in each of the five towns;
Figure 24. Indoor activities currently do or would like to do (self-completion) – by five
towns (1)
Castleford Normanton Featherstone Pontefract Knottingley
Top 10 activities mentioned in each town
Swimming 69% Swimming 71% Swimming 77% Swimming 84% Swimming 84%
Gym 45% Dance
classes 63% Gym 54% Gym 38% Gym 63%
Fitness class 34% Fitness class 47% Fitness class 54% Yoga/Pilates 35% Fitness class 51%
Dance classes 29% Gym 39% Yoga/Pilates 42% Dance
classes 29%
Weight
training 31%
Yoga/Pilates 21% Yoga/Pilates 37% Dance
classes 38%
Fitness
class. 29%
Dance
classes 29%
Cycling 20% Cycling 26% Weight
training 27% Badminton 28% Yoga/Pilates 27%
Badminton 17% Badminton 24% Badminton 19% Cycling 21% Badminton 20%
Running 13% Weight
training 18% Cycling 19% Running 14% Running 16%
Bowls
(indoor) 11% Ice skating 16% Ice skating 19%
Weight
training 14% Cycling 14%
Football 10%
Climbing,
Netball,
Running,
Tennis
All
13% Running 19% Squash 13% Football 14%
Base: All
respondents (87)
(38)
(26)
(124)
(51)
In each of the five towns the most frequently mentioned indoor activities were consistent and
‘swimming’ was mentioned most often as an activity that respondents do or would like to do in
future. But again due to the over claim in relation to swimming in this survey, caution should be
taken when considering these results.

WMDC –Leisure Service Review Research, September 2014
Page 38
The table below shows findings from the other Areas;
Figure 25. Indoor activities currently do or would like to do (self-completion) – by
Area (2)
South East Wakefield Central Wakefield North West Wakefield Rural
Top 10 activities mentioned in each Area
Swimming 87% Gym 52% Swimming 64% Swimming 74%
Gym 48% Swimming 50% Gym 43% Yoga/Pilates 37%
Fitness class
such as spinning,
circuit,
boxercise
45%
Fitness class
such as
spinning,
circuit,
boxercise
44%
Fitness class
such as
spinning,
circuit,
boxercise
40% Gym 34%
Yoga/Pilates 36% Cycling 31% Yoga/Pilates 37% Badminton 32%
Dance classes
such as
ballroom and
Zumba
33%
Dance classes
such as
ballroom and
Zumba
31% Badminton 30%
Dance classes
such as
ballroom and
Zumba
30%
Badminton 27% Yoga/Pilates 29%
Dance classes
such as
ballroom and
Zumba
29%
Fitness class
such as
spinning,
circuit,
boxercise
30%
Weight training 24% Weight training 24% Cycling 20% Weight
training 26%
Cycling 19% Running 21% Running 20% Cycling 21%
Ice skating 19% Badminton 19% Football 17% Ice skating 21%
Climbing 13% Netball 13% Ice skating 17% Tennis 19%
Base: All
respondents (67)
(62)
(105)
(73)
With the exception of Wakefield Central, ‘swimming’ was the most frequently mentioned activity in
each of these areas and in fact, the highest proportion in any Area mentioning ‘swimming’ was
recorded amongst respondents in the South East (87%).
Notably, respondents in Wakefield Central were equally likely to mention the ‘gym’ (52%) as they
were to mention ‘swimming’ (50%), while ‘football’ was mentioned by a relatively high proportion in
Wakefield North West (17%) and ‘tennis’ by a high proportion in Wakefield Rural (19%).
WMDC –Leisure Service Review Research, September 2014
Page 39
Differences were also apparent amongst different demographic groups and in particular
participation in ‘dance classes such as ballroom and Zumba’ was something done by females more than
males (46% vs. 9%), as is ‘ice skating’ (15% vs. 6%), ‘netball’ (11% vs. 1%) and ‘yoga/pilates’ (44% vs.
14%) amongst others. In contrast, males prefer ‘cycling’ (26% vs. 18%), ‘football’ (16% vs. 4%) and
‘weight training’ (27% vs. 14%).
Inevitably, numerous differences between age groups were recorded here, with most activities
mentioned more frequently by younger respondents, with the exception of ‘bowls (indoor)’ (16-34:
4%, 35-54: 7%, 55+: 14%) and ‘aqua fitness classes’ (16-34: 1%, 35-54: 1%, 55+: 4%).
Finally, respondents who indicated that they’d be unlikely to recommend a Wakefield Council run
leisure centre or swimming pool by giving a score of 0-6 out of 10 were more likely to mention
some activities than those giving a score of 7-8 or 9-10. This included ‘badminton’ (36%, 25% and
20% respectively), ‘climbing’ (14%, 5% and 7% respectively) and ‘ice skating’ (23%, 11% and 9%
respectively). It is possible that current provision of these activities is impacting on likelihood to
recommend amongst these respondents.
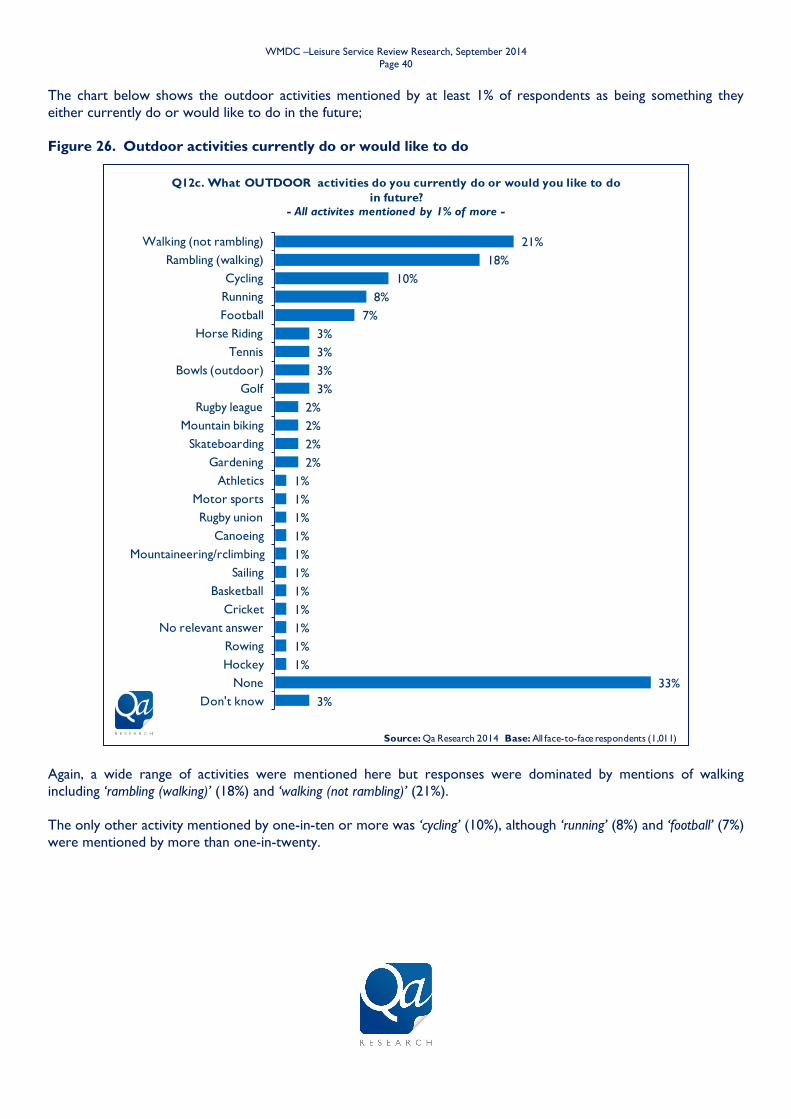
WMDC –Leisure Service Review Research, September 2014
Page 40
3%
33%
1%
1%
1%
1%
1%
1%
1%
1%
1%
1%
1%
2%
2%
2%
2%
3%
3%
3%
3%
7%
8%
10%
18%
21%
Don't know
None
Hockey
Rowing
No relevant answer
Cricket
Basketball
Sailing
Mountaineering/rclimbing
Canoeing
Rugby union
Motor sports
Athletics
Gardening
Skateboarding
Mountain biking
Rugby league
Golf
Bowls (outdoor)
Tennis
Horse Riding
Football
Running
Cycling
Rambling (walking)
Walking (not rambling)
Q12c. What OUTDOOR activities do you currently do or would you like to do
in future?
- All activites mentioned by 1% of more -
Source: Qa Research 2014 Base: All face-to-face respondents (1,011)
The chart below shows the outdoor activities mentioned by at least 1% of respondents as being something they
either currently do or would like to do in the future;
Figure 26. Outdoor activities currently do or would like to do
Again, a wide range of activities were mentioned here but responses were dominated by mentions of walking
including ‘rambling (walking)’ (18%) and ‘walking (not rambling)’ (21%).
The only other activity mentioned by one-in-ten or more was ‘cycling’ (10%), although ‘running’ (8%) and ‘football’ (7%)
were mentioned by more than one-in-twenty.
WMDC –Leisure Service Review Research, September 2014
Page 41
Sub-group analysis
Many of the differences noted between sub-groups for indoor activities were noted for outdoor activities as well.
For example, the majority of those that said they do ‘moderate physical activity’ either ‘2 or less times or never’
answered ‘none’ to this question (57%), but the most popular activities amongst this group were ‘rambling (walking)’
(13%), ‘cycling’ (6%) and ‘running’ (6%).
Also, females were more likely than males to mention ‘walking (not rambling)’ (24% vs. 18%) and ‘horse riding’ (5% vs.
1%). In contrast, males were more likely than females to mention ‘cycling’ (16% vs. 5%), ‘football’ (13% vs. 2%) and
‘running’ (11% vs. 6%).
Again, older respondents were more likely to say ‘none’ at this question than younger ones (16-34: 23%, 35-54: 33%,
55+: 41%). However, while the majority of those aged 55+ said they didn’t currently take part in, and weren’t
interested in taking part in, any indoor activity this was not the case for outdoor activity and it would seem that
these activities are more popular or accessible to older residents.
Interestingly, respondents that use a leisure centre or swimming pool operated by Wakefield Council were
significantly more likely than those that use one operated by someone else to say ‘none’ at this question (31% vs.
18%). This difference was not apparent when respondents were asked to consider indoor activities and so it might
suggest that some using facilities not operated by the Council are doing so because they require better or specific
outdoor facilities. The only difference in the outdoor activities mentioned by these groups is that those that use a
non-Council facility most often were more likely to mention ‘cycling’ (23% vs. 9%) and this may be driving this
difference to some degree.
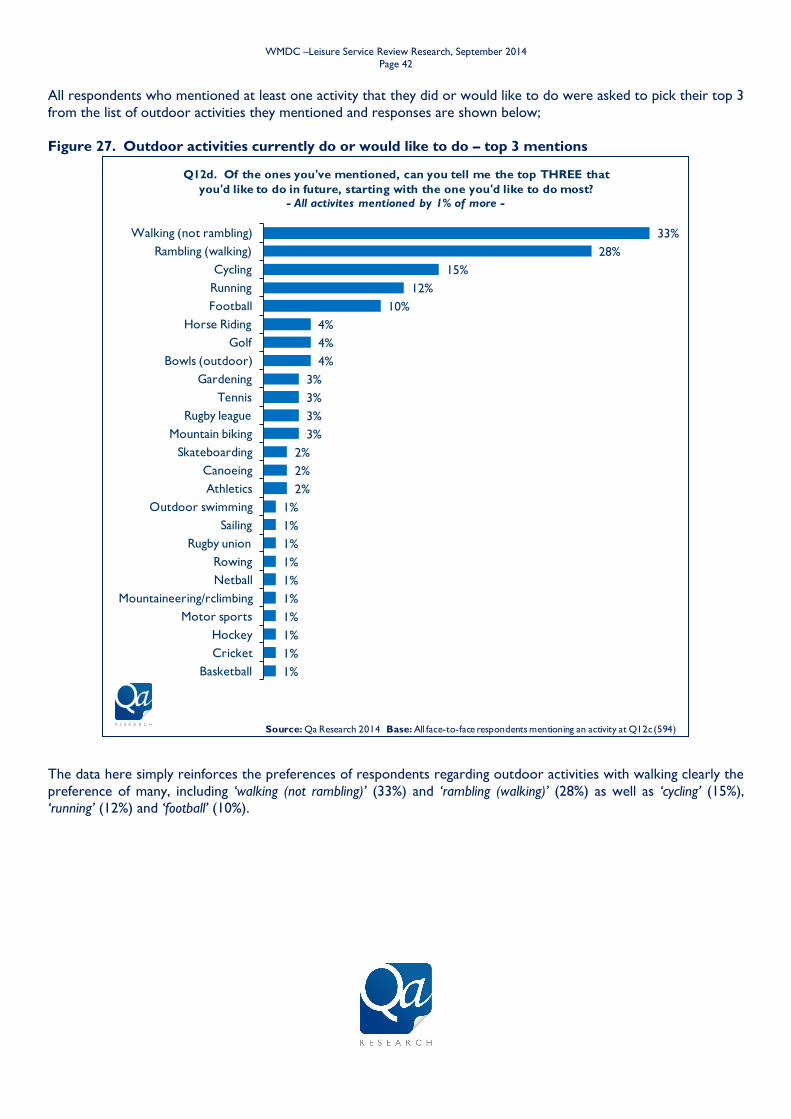
WMDC –Leisure Service Review Research, September 2014
Page 42
1%
1%
1%
1%
1%
1%
1%
1%
1%
1%
2%
2%
2%
3%
3%
3%
3%
4%
4%
4%
10%
12%
15%
28%
33%
Basketball
Cricket
Hockey
Motor sports
Mountaineering/rclimbing
Netball
Rowing
Rugby union
Sailing
Outdoor swimming
Athletics
Canoeing
Skateboarding
Mountain biking
Rugby league
Tennis
Gardening
Bowls (outdoor)
Golf
Horse Riding
Football
Running
Cycling
Rambling (walking)
Walking (not rambling)
Q12d. Of the ones you've mentioned, can you tell me the top THREE that
you'd like to do in future, starting with the one you'd like to do most?
- All activites mentioned by 1% of more -
Source: Qa Research 2014 Base: All face-to-face respondents mentioning an activity at Q12c (594)
All respondents who mentioned at least one activity that they did or would like to do were asked to pick their top 3
from the list of outdoor activities they mentioned and responses are shown below;
Figure 27. Outdoor activities currently do or would like to do – top 3 mentions
The data here simply reinforces the preferences of respondents regarding outdoor activities with walking clearly the
preference of many, including ‘walking (not rambling)’ (33%) and ‘rambling (walking)’ (28%) as well as ‘cycling’ (15%),
‘running’ (12%) and ‘football’ (10%).
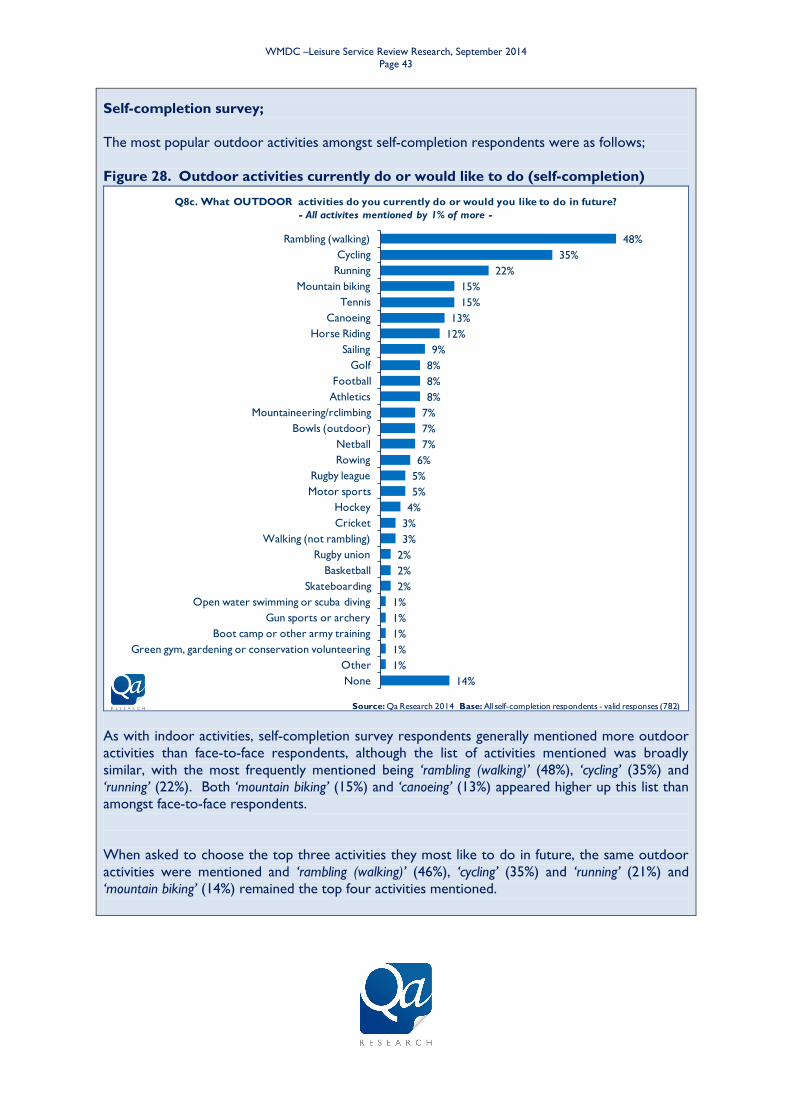
WMDC –Leisure Service Review Research, September 2014
Page 43
Self-completion survey;
The most popular outdoor activities amongst self-completion respondents were as follows;
Figure 28. Outdoor activities currently do or would like to do (self-completion)
14%
1%
1%
1%
1%
1%
2%
2%
2%
3%
3%
4%
5%
5%
6%
7%
7%
7%
8%
8%
8%
9%
12%
13%
15%
15%
22%
35%
48%
None
Other
Green gym, gardening or conservation volunteering
Boot camp or other army training
Gun sports or archery
Open water swimming or scuba diving
Skateboarding
Basketball
Rugby union
Walking (not rambling)
Cricket
Hockey
Motor sports
Rugby league
Rowing
Netball
Bowls (outdoor)
Mountaineering/rclimbing
Athletics
Football
Golf
Sailing
Horse Riding
Canoeing
Tennis
Mountain biking
Running
Cycling
Rambling (walking)
Q8c. What OUTDOOR activities do you currently do or would you like to do in future?
- All activites mentioned by 1% of more -
Source: Qa Research 2014 Base: All self-completion respondents - valid responses (782)
As with indoor activities, self-completion survey respondents generally mentioned more outdoor
activities than face-to-face respondents, although the list of activities mentioned was broadly
similar, with the most frequently mentioned being ‘rambling (walking)’ (48%), ‘cycling’ (35%) and
‘running’ (22%). Both ‘mountain biking’ (15%) and ‘canoeing’ (13%) appeared higher up this list than
amongst face-to-face respondents.
When asked to choose the top three activities they most like to do in future, the same outdoor
activities were mentioned and ‘rambling (walking)’ (46%), ‘cycling’ (35%) and ‘running’ (21%) and
‘mountain biking’ (14%) remained the top four activities mentioned.
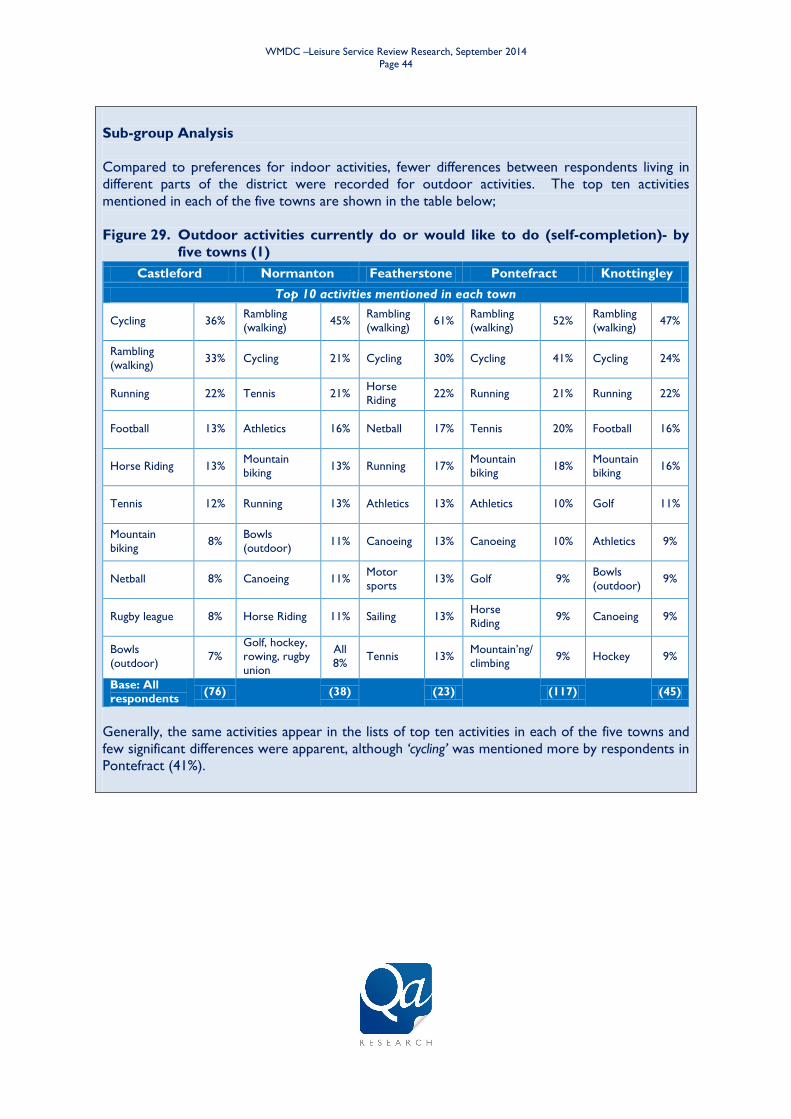
WMDC –Leisure Service Review Research, September 2014
Page 44
Sub-group Analysis
Compared to preferences for indoor activities, fewer differences between respondents living in
different parts of the district were recorded for outdoor activities. The top ten activities
mentioned in each of the five towns are shown in the table below;
Figure 29. Outdoor activities currently do or would like to do (self-completion)- by
five towns (1)
Castleford Normanton Featherstone Pontefract Knottingley
Top 10 activities mentioned in each town
Cycling 36% Rambling
(walking) 45%
Rambling
(walking) 61%
Rambling
(walking) 52%
Rambling
(walking) 47%
Rambling
(walking) 33% Cycling 21% Cycling 30% Cycling 41% Cycling 24%
Running 22% Tennis 21% Horse
Riding 22% Running 21% Running 22%
Football 13% Athletics 16% Netball 17% Tennis 20% Football 16%
Horse Riding 13% Mountain
biking 13% Running 17%
Mountain
biking 18%
Mountain
biking 16%
Tennis 12% Running 13% Athletics 13% Athletics 10% Golf 11%
Mountain
biking 8%
Bowls
(outdoor) 11% Canoeing 13% Canoeing 10% Athletics 9%
Netball 8% Canoeing 11% Motor
sports 13% Golf 9%
Bowls
(outdoor) 9%
Rugby league 8% Horse Riding 11% Sailing 13% Horse
Riding 9% Canoeing 9%
Bowls
(outdoor) 7%
Golf, hockey,
rowing, rugby
union
All
8% Tennis 13%
Mountain’ng/
climbing 9% Hockey 9%
Base: All
respondents (76)
(38)
(23)
(117)
(45)
Generally, the same activities appear in the lists of top ten activities in each of the five towns and
few significant differences were apparent, although ‘cycling’ was mentioned more by respondents in
Pontefract (41%).
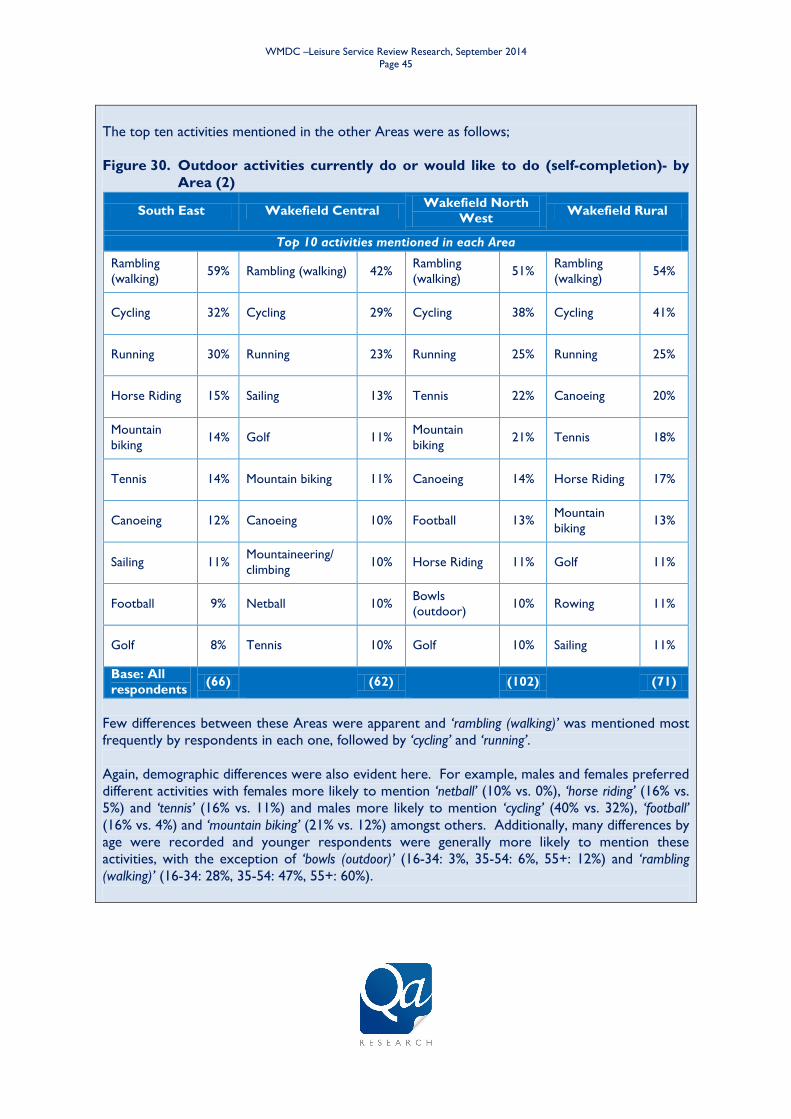
WMDC –Leisure Service Review Research, September 2014
Page 45
The top ten activities mentioned in the other Areas were as follows;
Figure 30. Outdoor activities currently do or would like to do (self-completion)- by
Area (2)
South East Wakefield Central Wakefield North
West Wakefield Rural
Top 10 activities mentioned in each Area
Rambling
(walking) 59% Rambling (walking) 42%
Rambling
(walking) 51%
Rambling
(walking) 54%
Cycling 32% Cycling 29% Cycling 38% Cycling 41%
Running 30% Running 23% Running 25% Running 25%
Horse Riding 15% Sailing 13% Tennis 22% Canoeing 20%
Mountain
biking 14% Golf 11%
Mountain
biking 21% Tennis 18%
Tennis 14% Mountain biking 11% Canoeing 14% Horse Riding 17%
Canoeing 12% Canoeing 10% Football 13% Mountain
biking 13%
Sailing 11% Mountaineering/
climbing 10% Horse Riding 11% Golf 11%
Football 9% Netball 10% Bowls
(outdoor) 10% Rowing 11%
Golf 8% Tennis 10% Golf 10% Sailing 11%
Base: All
respondents (66)
(62)
(102)
(71)
Few differences between these Areas were apparent and ‘rambling (walking)’ was mentioned most
frequently by respondents in each one, followed by ‘cycling’ and ‘running’.
Again, demographic differences were also evident here. For example, males and females preferred
different activities with females more likely to mention ‘netball’ (10% vs. 0%), ‘horse riding’ (16% vs.
5%) and ‘tennis’ (16% vs. 11%) and males more likely to mention ‘cycling’ (40% vs. 32%), ‘football’
(16% vs. 4%) and ‘mountain biking’ (21% vs. 12%) amongst others. Additionally, many differences by
age were recorded and younger respondents were generally more likely to mention these
activities, with the exception of ‘bowls (outdoor)’ (16-34: 3%, 35-54: 6%, 55+: 12%) and ‘rambling
(walking)’ (16-34: 28%, 35-54: 47%, 55+: 60%).
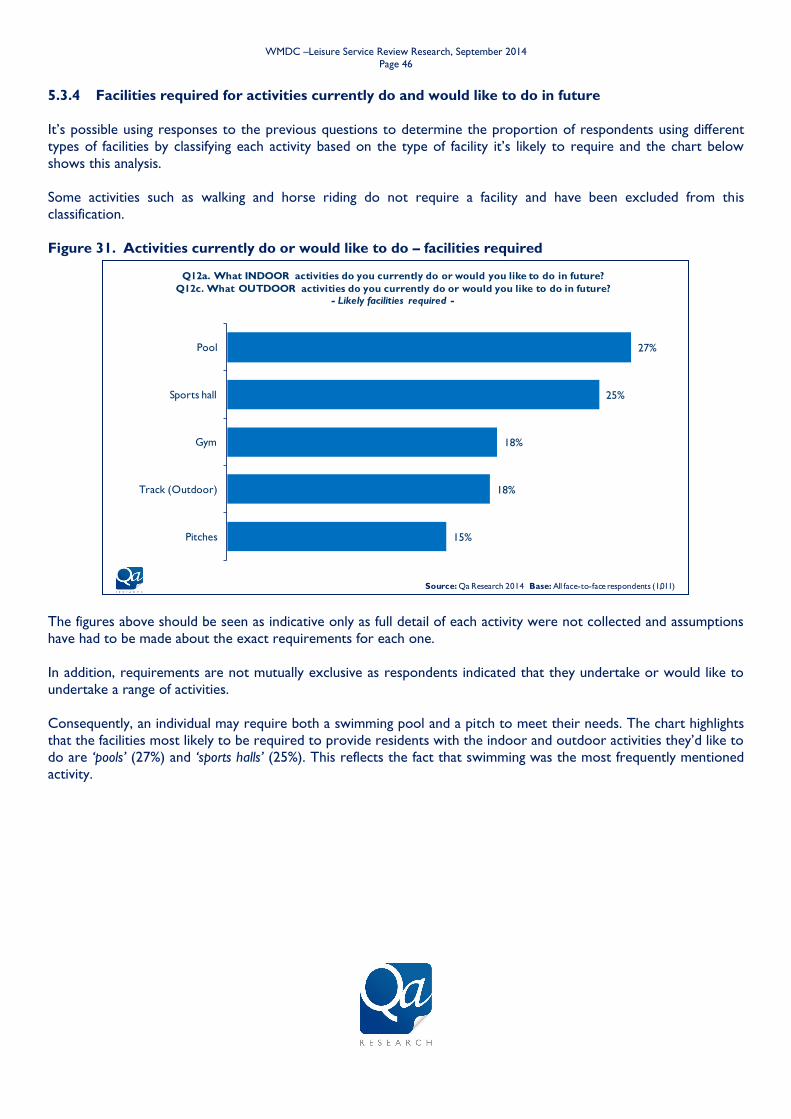
WMDC –Leisure Service Review Research, September 2014
Page 46
15%
18%
18%
25%
27%
Pitches
Track (Outdoor)
Gym
Sports hall
Pool
Q12a. What INDOOR activities do you currently do or would you like to do in future?
Q12c. What OUTDOOR activities do you currently do or would you like to do in future?
- Likely facilities required -
Source: Qa Research 2014 Base: All face-to-face respondents (1,011)
5.3.4 Facilities required for activities currently do and would like to do in future
It’s possible using responses to the previous questions to determine the proportion of respondents using different
types of facilities by classifying each activity based on the type of facility it’s likely to require and the chart below
shows this analysis.
Some activities such as walking and horse riding do not require a facility and have been excluded from this
classification.
Figure 31. Activities currently do or would like to do – facilities required
The figures above should be seen as indicative only as full detail of each activity were not collected and assumptions
have had to be made about the exact requirements for each one.
In addition, requirements are not mutually exclusive as respondents indicated that they undertake or would like to
undertake a range of activities.
Consequently, an individual may require both a swimming pool and a pitch to meet their needs. The chart highlights
that the facilities most likely to be required to provide residents with the indoor and outdoor activities they’d like to
do are ‘pools’ (27%) and ‘sports halls’ (25%). This reflects the fact that swimming was the most frequently mentioned
activity.

WMDC –Leisure Service Review Research, September 2014
Page 47
n % n % n % n % n % n %
Pool 164 60% 112 15% 125 64% 19 58% 11 55% 24 44%
Sports hall 126 46% 131 18% 92 47% 18 55% 14 70% 18 33%
Gym 109 40% 76 10% 69 36% 7 21% 5 25% 35 65%
Track (Outdoor) 72 26% 108 15% 49 25% 5 15% 7 35% 22 41%
Pitches 63 23% 88 12% 45 23% 11 33% 3 15% 13 24%
Base: 245 173 29 20 49
NET: Use
any
Q12a/Q12c.
Facilities required Use none
764
Q4. Which of these (leisure centres and swimming pools) do you use?
...not nearest
to home and
not run by
Wakefield
Council.
...nearest
one that is
not run by
Wakefield
Council
...one run by
Wakefield
Council that
is not the
nearest
...nearest
one run by
Wakefield
Council
The table below shows the requirements for different types of sports and leisure facilities amongst respondents who
indicated they currently use each different type of leisure centre;
Figure 32. Types of facility required by types of leisure centres used
Respondents could say that they use as many types of leisure centres from this list as they liked, but most mentioned using
only one type and the base size for some of these centres is low, so this analysis should be seen as indicative.
Given the low number of users of leisure centres not operated by the Council, this data is not conclusive. However,
there is a suggestion that respondents using non-Council operated leisure centres are more likely to require certain
facilities, particularly ‘track (outdoor)’ and to a lesser degree a ‘gym’ and ‘sports hall’.
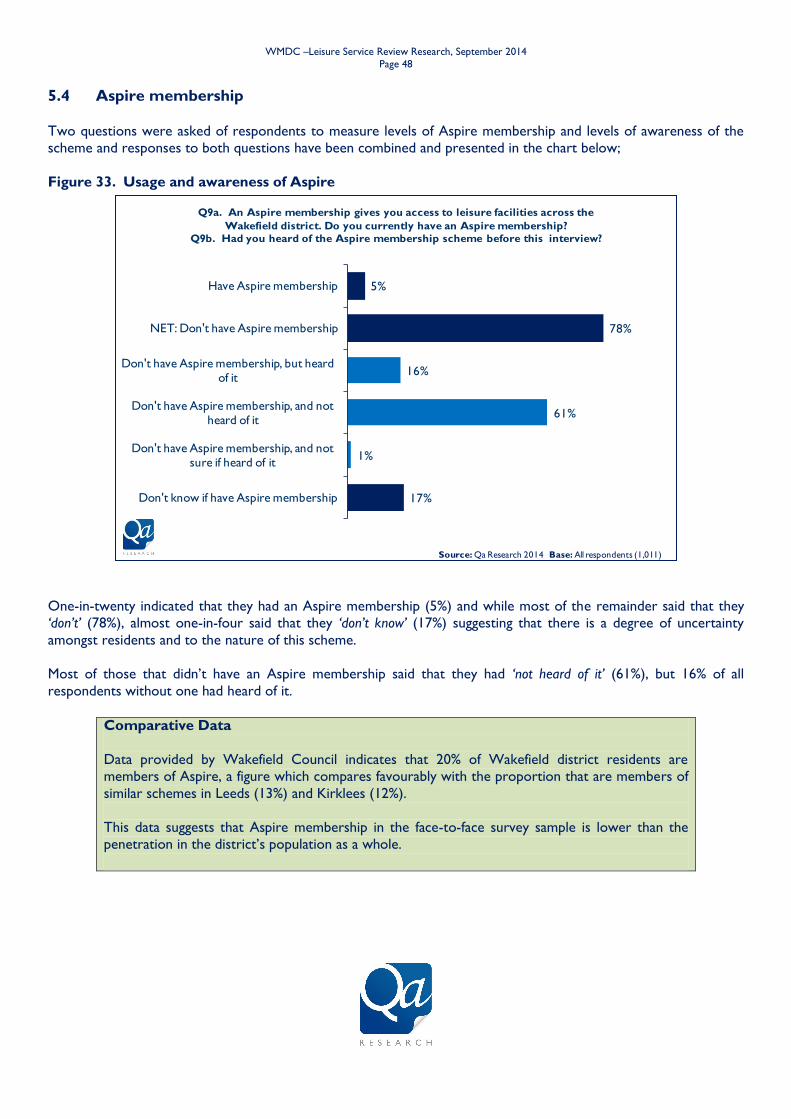
WMDC –Leisure Service Review Research, September 2014
Page 48
17%
1%
61%
16%
78%
5%
Don't know if have Aspire membership
Don't have Aspire membership, and not sure if heard of it
Don't have Aspire membership, and not heard of it
Don't have Aspire membership, but heard of it
NET: Don't have Aspire membership
Have Aspire membership
Q9a. An Aspire membership gives you access to leisure facilities across the
Wakefield district. Do you currently have an Aspire membership?
Q9b. Had you heard of the Aspire membership scheme before this interview?
Source: Qa Research 2014 Base: All respondents (1,011)
5.4 Aspire membership
Two questions were asked of respondents to measure levels of Aspire membership and levels of awareness of the
scheme and responses to both questions have been combined and presented in the chart below;
Figure 33. Usage and awareness of Aspire
One-in-twenty indicated that they had an Aspire membership (5%) and while most of the remainder said that they
‘don’t’ (78%), almost one-in-four said that they ‘don’t know’ (17%) suggesting that there is a degree of uncertainty
amongst residents and to the nature of this scheme.
Most of those that didn’t have an Aspire membership said that they had ‘not heard of it’ (61%), but 16% of all
respondents without one had heard of it.
Comparative Data
Data provided by Wakefield Council indicates that 20% of Wakefield district residents are
members of Aspire, a figure which compares favourably with the proportion that are members of
similar schemes in Leeds (13%) and Kirklees (12%).
This data suggests that Aspire membership in the face-to-face survey sample is lower than the
penetration in the district’s population as a whole.
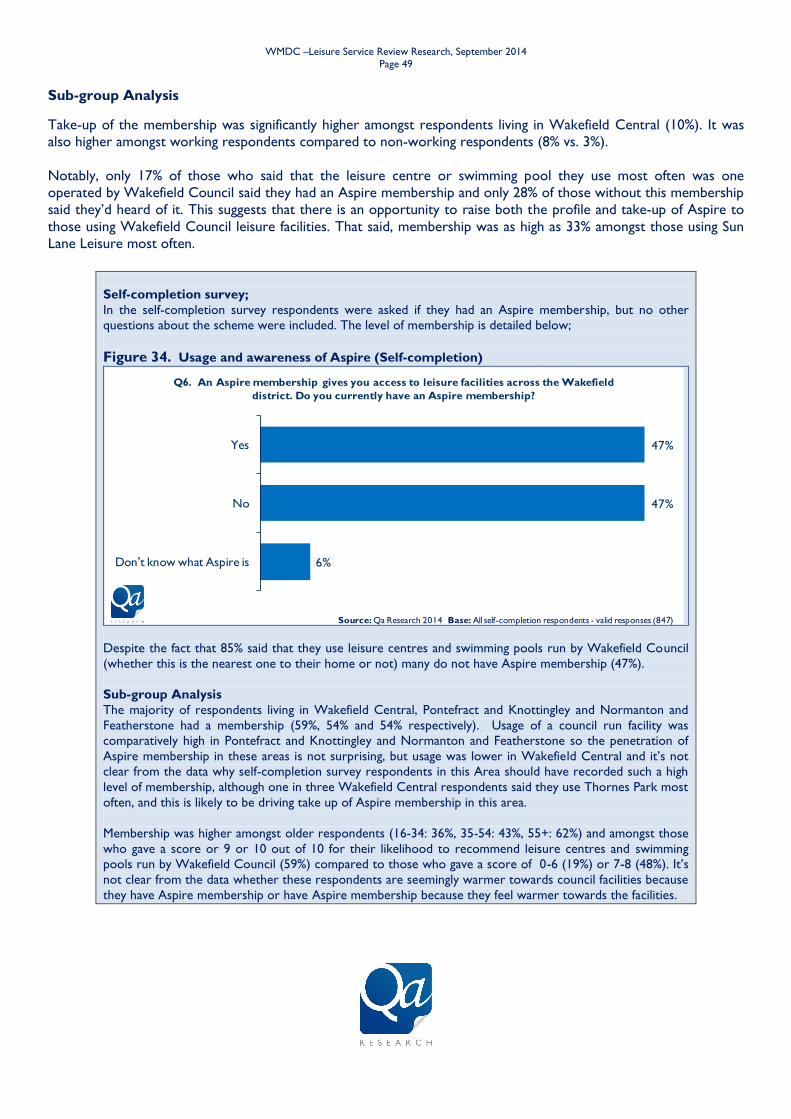
WMDC –Leisure Service Review Research, September 2014
Page 49
Sub-group Analysis
Take-up of the membership was significantly higher amongst respondents living in Wakefield Central (10%). It was
also higher amongst working respondents compared to non-working respondents (8% vs. 3%).
Notably, only 17% of those who said that the leisure centre or swimming pool they use most often was one
operated by Wakefield Council said they had an Aspire membership and only 28% of those without this membership
said they’d heard of it. This suggests that there is an opportunity to raise both the profile and take-up of Aspire to
those using Wakefield Council leisure facilities. That said, membership was as high as 33% amongst those using Sun
Lane Leisure most often.
Self-completion survey;
In the self-completion survey respondents were asked if they had an Aspire membership, but no other
questions about the scheme were included. The level of membership is detailed below;
Figure 34. Usage and awareness of Aspire (Self-completion)
6%
47%
47%
Don't know what Aspire is
No
Yes
Q6. An Aspire membership gives you access to leisure facilities across the Wakefield
district. Do you currently have an Aspire membership?
Source: Qa Research 2014 Base: All self-completion respondents - valid responses (847)
Despite the fact that 85% said that they use leisure centres and swimming pools run by Wakefield Council
(whether this is the nearest one to their home or not) many do not have Aspire membership (47%).
Sub-group Analysis
The majority of respondents living in Wakefield Central, Pontefract and Knottingley and Normanton and
Featherstone had a membership (59%, 54% and 54% respectively). Usage of a council run facility was
comparatively high in Pontefract and Knottingley and Normanton and Featherstone so the penetration of
Aspire membership in these areas is not surprising, but usage was lower in Wakefield Central and it’s not
clear from the data why self-completion survey respondents in this Area should have recorded such a high
level of membership, although one in three Wakefield Central respondents said they use Thornes Park most
often, and this is likely to be driving take up of Aspire membership in this area.
Membership was higher amongst older respondents (16-34: 36%, 35-54: 43%, 55+: 62%) and amongst those
who gave a score or 9 or 10 out of 10 for their likelihood to recommend leisure centres and swimming
pools run by Wakefield Council (59%) compared to those who gave a score of 0-6 (19%) or 7-8 (48%). It’s
not clear from the data whether these respondents are seemingly warmer towards council facilities because
they have Aspire membership or have Aspire membership because they feel warmer towards the facilities.
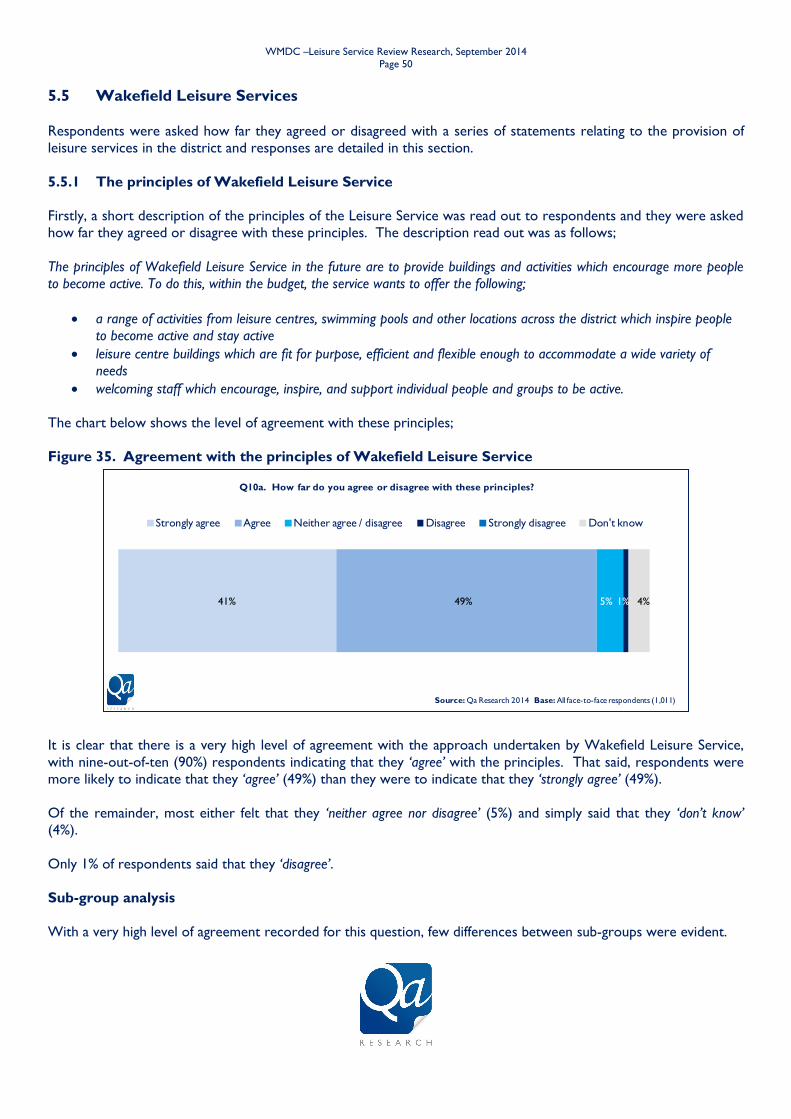
WMDC –Leisure Service Review Research, September 2014
Page 50
41% 49% 5% 1% 4%
Q10a. How far do you agree or disagree with these principles?
Strongly agree Agree Neither agree / disagree Disagree Strongly disagree Don't know
Source: Qa Research 2014 Base: All face-to-face respondents (1,011)
5.5 Wakefield Leisure Services
Respondents were asked how far they agreed or disagreed with a series of statements relating to the provision of
leisure services in the district and responses are detailed in this section.
5.5.1 The principles of Wakefield Leisure Service
Firstly, a short description of the principles of the Leisure Service was read out to respondents and they were asked
how far they agreed or disagree with these principles. The description read out was as follows;
The principles of Wakefield Leisure Service in the future are to provide buildings and activities which encourage more people
to become active. To do this, within the budget, the service wants to offer the following;
a range of activities from leisure centres, swimming pools and other locations across the district which inspire people
to become active and stay active
leisure centre buildings which are fit for purpose, efficient and flexible enough to accommodate a wide variety of
needs
welcoming staff which encourage, inspire, and support individual people and groups to be active.
The chart below shows the level of agreement with these principles;
Figure 35. Agreement with the principles of Wakefield Leisure Service
It is clear that there is a very high level of agreement with the approach undertaken by Wakefield Leisure Service,
with nine-out-of-ten (90%) respondents indicating that they ‘agree’ with the principles. That said, respondents were
more likely to indicate that they ‘agree’ (49%) than they were to indicate that they ‘strongly agree’ (49%).
Of the remainder, most either felt that they ‘neither agree nor disagree’ (5%) and simply said that they ‘don’t know’
(4%).
Only 1% of respondents said that they ‘disagree’.
Sub-group analysis
With a very high level of agreement recorded for this question, few differences between sub-groups were evident.
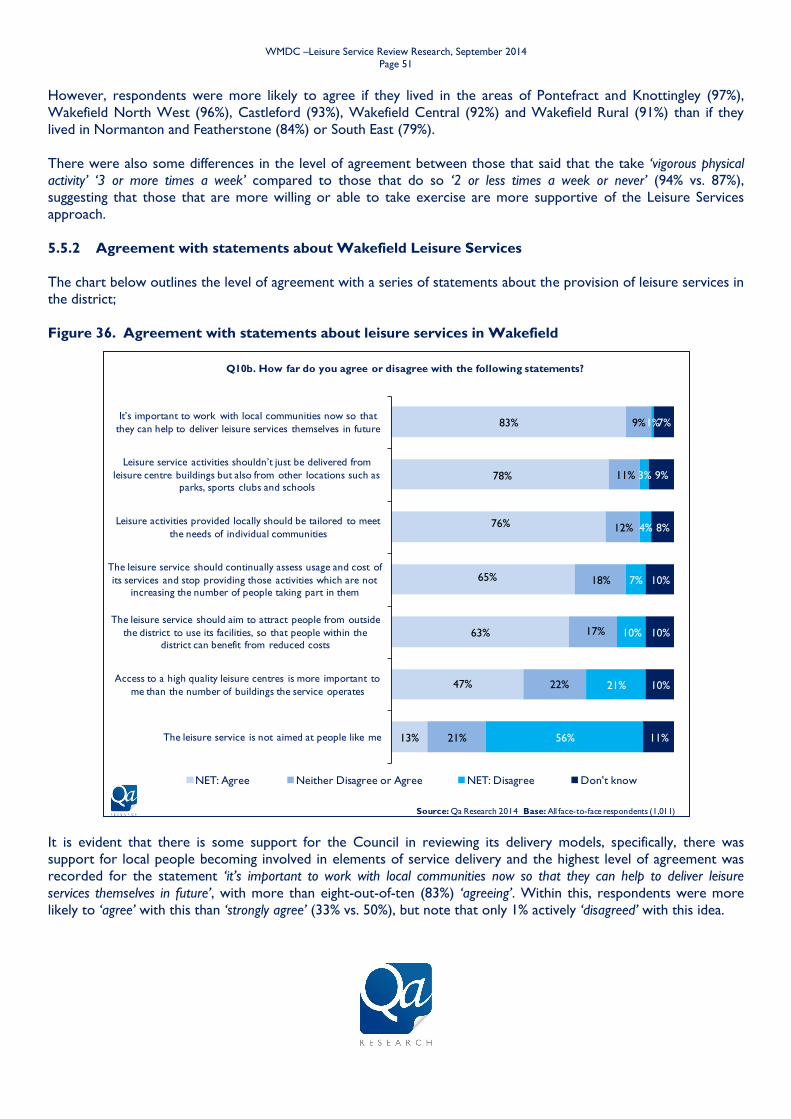
WMDC –Leisure Service Review Research, September 2014
Page 51
13%
47%
63%
65%
76%
78%
83%
21%
22%
17%
18%
12%
11%
9%
56%
21%
10%
7%
4%
3%
1%
11%
10%
10%
10%
8%
9%
7%
The leisure service is not aimed at people like me
Access to a high quality leisure centres is more important to
me than the number of buildings the service operates
The leisure service should aim to attract people from outside
the district to use its facilities, so that people within the district can benefit from reduced costs
The leisure service should continually assess usage and cost of
its services and stop providing those activities which are not
increasing the number of people taking part in them
Leisure activities provided locally should be tailored to meet
the needs of individual communities
Leisure service activities shouldn’t just be delivered from
leisure centre buildings but also from other locations such as
parks, sports clubs and schools
It’s important to work with local communities now so that
they can help to deliver leisure services themselves in future
Q10b. How far do you agree or disagree with the following statements?
NET: Agree Neither Disagree or Agree NET: Disagree Don't know
Source: Qa Research 2014 Base: All face-to-face respondents (1,011)
However, respondents were more likely to agree if they lived in the areas of Pontefract and Knottingley (97%),
Wakefield North West (96%), Castleford (93%), Wakefield Central (92%) and Wakefield Rural (91%) than if they
lived in Normanton and Featherstone (84%) or South East (79%).
There were also some differences in the level of agreement between those that said that the take ‘vigorous physical
activity’ ‘3 or more times a week’ compared to those that do so ‘2 or less times a week or never’ (94% vs. 87%),
suggesting that those that are more willing or able to take exercise are more supportive of the Leisure Services
approach.
5.5.2 Agreement with statements about Wakefield Leisure Services
The chart below outlines the level of agreement with a series of statements about the provision of leisure services in
the district;
Figure 36. Agreement with statements about leisure services in Wakefield
It is evident that there is some support for the Council in reviewing its delivery models, specifically, there was
support for local people becoming involved in elements of service delivery and the highest level of agreement was
recorded for the statement ‘it’s important to work with local communities now so that they can help to deliver leisure
services themselves in future’, with more than eight-out-of-ten (83%) ‘agreeing’. Within this, respondents were more
likely to ‘agree’ with this than ‘strongly agree’ (33% vs. 50%), but note that only 1% actively ‘disagreed’ with this idea.
WMDC –Leisure Service Review Research, September 2014
Page 52
Additionally, just less than eight-out-of-ten agreed with the idea of using local facilities as well as dedicated leisure
centres to deliver local leisure services, with 78% indicating that they ‘agreed’ that ‘leisure service activities shouldn’t just
be delivered from leisure centre buildings but also from other locations such as parks, sports clubs and schools’. Most of the
remainder said they ‘don’t know’ (9%) or ‘neither agree nor disagree’ (11%) with this statement and only 3% actually
‘disagreed’.
Also the majority of respondents also ‘agreed’ with the two statements that relate to how the Wakefield Leisure
Service operates. Specifically, around three-quarters ‘agreed’ that ‘the leisure service should continually assess usage and
cost of its services and stop providing those activities which are not increasing the number of people taking part in them’
(65%)
There is also support for the concept of a leisure destination but not at the expense of fulfilling the needs of local
communities. Almost two-thirds (63%) of residents agree that ‘the leisure service should aim to attract people from
outside the district to use its facilities, so that people within the district can benefit from reduced costs’ (63%).
But It is also clear from the findings above that there is a good deal of support amongst respondents for a local
leisure service that is community focussed. Supporting this, around three-quarters ‘agreed’ that ‘leisure activities
provided locally should be tailored to meet the needs of individual communities’ (76%), clearly suggesting that there may be
different needs and requirements amongst different groups of the local population.
Moreover the type of service available now, as opposed to a destination offer is relevant to local communities as the
majority ‘disagreed’ that ‘the leisure service is not aimed at people like me’ (56%), but it should be noted that more than
one-in-ten ‘agreed’ this was the case (13%).
Finally, the widest range of views was recorded when respondents were asked to consider access to leisure services.
Respondents were more likely to ‘agree’ than ‘disagree’ that ‘access to a high quality leisure centres is more important to
me than the number of buildings the service operates’ (47% vs. 21%), but this does mean that a fifth of respondents
actively disagreed with this approach, although most said they ‘disagree’ (15%) rather than they ‘strongly disagree’ (5%).
Sub-group Analysis
Alternative delivery models
It appears that younger respondents are slightly more accepting of working with local communities to deliver leisure
services, as agreement that ‘it’s important to work with local communities now so that they can help to deliver leisure
services themselves in future’ was higher amongst those aged 16-34 (87%) compared to those aged 55+ (81%) and in
line with this amongst those with children compared to those without (86% vs. 81%).
Similarly, younger respondents were also more likely to agree that ‘leisure service activities shouldn’t just be delivered
from leisure centre buildings but also from other locations such as parks, sports clubs and schools’ (16-34: 83%, 35-54: 79%,
55+: 73%).
Additionally, respondents that ever use a leisure centre or swimming pool were more likely than those that do not
to ‘agree’ with all of these statements;
‘it’s important to work with local communities now so that they can help to deliver leisure services themselves in
future’ (93% vs. 79%)
‘leisure service activities shouldn’t just be delivered from leisure centre buildings but also from other locations such as
parks, sports clubs and schools’ (92% vs. 73%).
WMDC –Leisure Service Review Research, September 2014
Page 53
Also, for two of these statements agreement was higher amongst those that use a Wakefield Council facility most
often, compared to those that use a leisure centre or swimming pool operated by someone else;
‘it’s important to work with local communities now so that they can help to deliver leisure services themselves in
future’ (96% vs. 88%)
Compared to those in other Areas, respondents living in Pontefract and Knottingley were most likely to ‘agree’ that
‘it’s important to work with local communities now so that they can help to deliver leisure services themselves in future’ (98%
and 89% respectively) and that ‘leisure service activities shouldn’t just be delivered from leisure centre buildings but also
from other locations such as parks, sports clubs and schools’ (97% and 89% respectively).
While no difference between the different age groups was recorded in the proportion that ‘agreed’ that ‘the leisure
service should continually assess usage and cost of its services and stop providing those activities which are not increasing the
number of people taking part in them’, it was notable that younger respondents were more likely to ‘disagree’ (16-34:
11%, 35-54: 7%, 55+: 5%), suggesting that they are less inclined to believe that the service should be results
orientated in this way.
Additionally, respondents that said they take ‘vigorous physical activity’ ‘3 or more times a week’ were more likely to
‘agree’ with this statement than those that do so ‘2 or less times or never’ (70% vs. 61%), perhaps suggesting that those
that are least likely to exercise vigorously would prefer to see a wider range of activities/facilities available.
Leisure Destination
Fewer differences were recorded when considering the statement ‘the leisure service should aim to attract people from
outside the district to use its facilities, so that people within the district can benefit from reduced costs’.
However, it’s notable that agreement was highest amongst those living in Pontefract and Knottingley (79%),
Wakefield Rural (72%), Wakefield North West (67%) and Wakefield Central (67%), but lowest amongst those living
in Castleford (48%), Normanton and Featherstone (51%) and South East (50%).
That said younger respondents were more likely to agree that ‘leisure activities provided locally should be tailored to
meet the needs of individual communities’ (16-34, 80%; 35-54, 76%; 55+, 73%).
Similarly, respondents that ever use a leisure centre or swimming pool were more likely than those that do not to
‘agree’ that ‘leisure activities provided locally should be tailored to meet the needs of individual communities’ (88% vs 72%).
Quality vs Quantity
Generally, as noted above, the statement ‘access to a high quality leisure centres is more important to me than the number
of buildings the service operates’ recorded lower levels of agreement than many of the other statements and
agreement here was higher amongst younger respondents (16-34: 61%, 35-54: 48%, 55+: 36%). In line with this,
agreement was higher amongst demographic groups that correlate with younger ages, including working respondents
compared to non-working ones (52% vs. 42%) and those with children compared to those without (54% vs. 43%).
The majority of respondents ‘agreed’ with this statement in the Areas of Castleford (64%), Pontefract and
Knottingley (64%) and Wakefield Central (57%). More specifically, respondents in the town of Pontefract were
significantly more likely to agree than those in Knottingley (70% vs. 50%) and those in Featherstone were more likely
to agree than respondents in Normanton (75% vs. 19%).
While respondents in all the other Areas were more likely to ‘agree’ than ‘disagree’ with this statement, the highest
level of disagreement was recorded amongst those living in Wakefield Rural (35%), Wakefield North West (27%)
and Normanton and Featherstone (22%).

WMDC –Leisure Service Review Research, September 2014
Page 54
The leisure service is not aimed at people like me
Only around one-in-ten ‘agreed’ that ‘the leisure service is not aimed at people like me’ and this was driven more by
older respondents (16-34: 6%, 35-54: 11%, 55+: 19%).
Generally, respondents who are more active were more likely to agree with this statement and specifically, those
who said they take ‘vigorous physical activity’ ‘3 or more times a week’ were more likely to agree than those that do so
‘2 or less times or never’ (16% vs. 9%). Note, that this means that almost one-in-ten of those that take vigorous activity
on a multiple occasions each week feel the service is not for them.
Intriguingly, one-in-ten (10%) of those that said they use the ‘...nearest leisure centre or swimming pool run by Wakefield
Council’ said that they felt the service wasn’t for them as did more than one-in-twenty (7%) of those that use a
Wakefield Council leisure centre or swimming pool most often, although this was a smaller proportion than use a
leisure centre of swimming pool operated by someone else most often (14%).
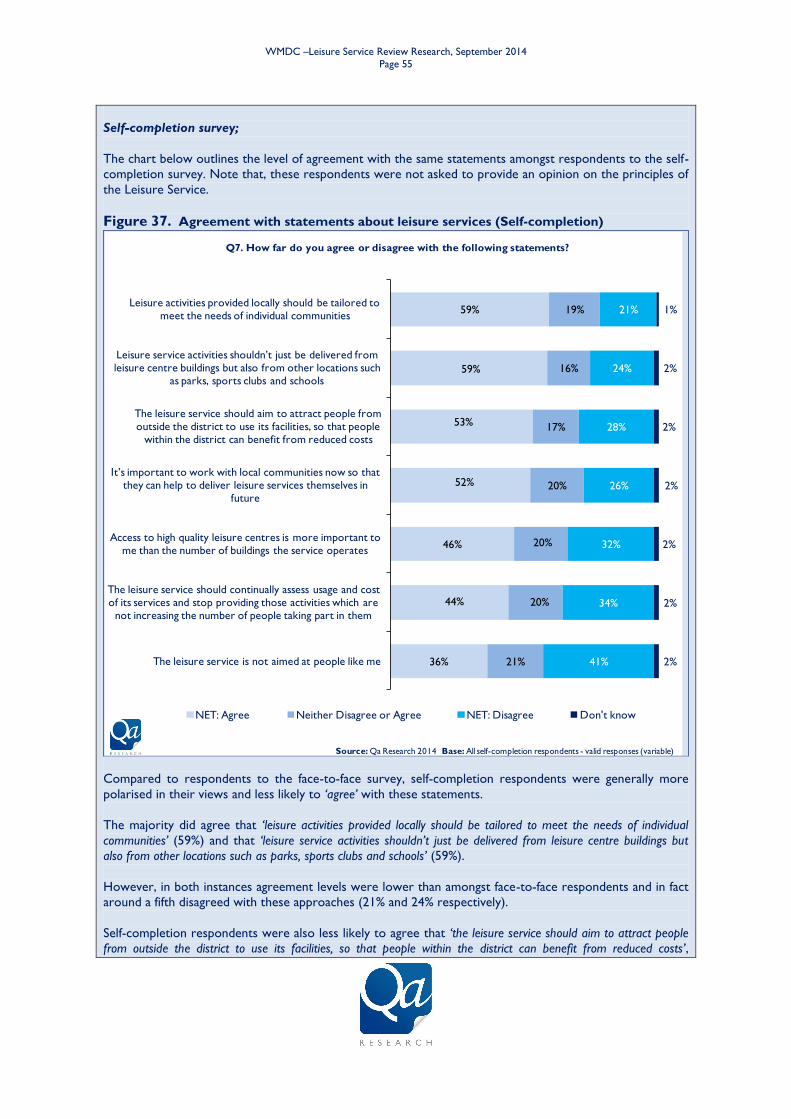
WMDC –Leisure Service Review Research, September 2014
Page 55
Self-completion survey;
The chart below outlines the level of agreement with the same statements amongst respondents to the self-
completion survey. Note that, these respondents were not asked to provide an opinion on the principles of
the Leisure Service.
Figure 37. Agreement with statements about leisure services (Self-completion)
36%
44%
46%
52%
53%
59%
59%
21%
20%
20%
20%
17%
16%
19%
41%
34%
32%
26%
28%
24%
21%
2%
2%
2%
2%
2%
2%
1%
The leisure service is not aimed at people like me
The leisure service should continually assess usage and cost of its services and stop providing those activities which are
not increasing the number of people taking part in them
Access to high quality leisure centres is more important to me than the number of buildings the service operates
It’s important to work with local communities now so that they can help to deliver leisure services themselves in
future
The leisure service should aim to attract people from outside the district to use its facilities, so that people
within the district can benefit from reduced costs
Leisure service activities shouldn’t just be delivered from leisure centre buildings but also from other locations such
as parks, sports clubs and schools
Leisure activities provided locally should be tailored to meet the needs of individual communities
Q7. How far do you agree or disagree with the following statements?
NET: Agree Neither Disagree or Agree NET: Disagree Don't know
Source: Qa Research 2014 Base: All self-completion respondents - valid responses (variable)
Compared to respondents to the face-to-face survey, self-completion respondents were generally more
polarised in their views and less likely to ‘agree’ with these statements.
The majority did agree that ‘leisure activities provided locally should be tailored to meet the needs of individual
communities’ (59%) and that ‘leisure service activities shouldn’t just be delivered from leisure centre buildings but
also from other locations such as parks, sports clubs and schools’ (59%).
However, in both instances agreement levels were lower than amongst face-to-face respondents and in fact
around a fifth disagreed with these approaches (21% and 24% respectively).
Self-completion respondents were also less likely to agree that ‘the leisure service should aim to attract people
from outside the district to use its facilities, so that people within the district can benefit from reduced costs’,
WMDC –Leisure Service Review Research, September 2014
Page 56
although the majority agreed with this idea (53%), and they were much less likely to agree that ‘it’s important
to work with local communities now so that they can help to deliver leisure services themselves in future’ (52%).
Here, more than one-in-four actively disagreed with these two statements (28% and 26% respectively),
highlighting that there were much less consistent views regarding the delivery of leisure services amongst
self-completion respondents.
Furthermore, while 46% agreed that ‘access to high quality leisure centres is more important to me than the
number of buildings the service operates’, 32% disagreed that this was the case. A similar situation was
apparent when considering whether the leisure service should ‘...stop providing those activities which are not
increasing the number of people taking part in’ which 44% agreed with and 34% said that they disagreed with.
Despite higher levels of usage, more self-completion respondents than face-to-face respondents agreed that
‘the leisure service is not aimed at people like me’ (36% vs. 13%), although it should be noted that self-
completion survey respondents were actually more likely to disagree (41%) with this statement.
Sub-group Analysis
Providing services in the community
Few differences were recorded between different sub-groups for the two statements relating to providing
services in the community and, generally, the majority of all groups agreed that ‘it’s important to work with
local communities now so that they can help to deliver leisure services themselves in future’ and that ‘leisure activities
provided locally should be tailored to meet the needs of individual communities’.
However, although the majority of self-completion survey respondents agreed that ‘it’s important to work
with local communities now so that they can help to deliver leisure services themselves in future’, this was mainly
driven by responses from those living in Wakefield North West (65%), the South East (61%) and Wakefield
Rural (55%). In contrast, almost equal proportions of respondents living in Castleford disagreed with this
statement as agreed (42% vs. 40%).
Delivering leisure services
Here, of the seven Areas it was only amongst respondents in Wakefield Central that the majority agreed
that ‘the leisure service should continually assess usage and cost of its services and stop providing those activities
which are not increasing the number of people taking part in them’ (57%), although respondents in each of the
other Areas were more likely to agree than disagree with this. Additionally, males were significantly more
likely than females to agree that this should be the case (40% vs. 31%) and respondents who disagreed that
they’d be ‘...willing to travel to get access to better quality leisure services’ were more likely to disagree than
agree with this statement (43% vs. 37%).
However, those that agreed that they’d be ‘...willing to travel...’ were more likely to agree than disagree (53%
vs. 29%). It’s not clear from the data why this difference exists, but it’s possible that those respondents who
are most willing to travel would like to see more streamlined provision of activities by the Leisure Service
and they may consider that fewer activities would provide a higher quality product.
Respondents in all Areas were more likely to agree than disagree that ‘the leisure service should aim to attract
people from outside the district to use its facilities, so that people within the district can benefit from reduced costs’,
but agreement was significantly higher amongst those in Wakefield North West (63%), while disagreement
was higher amongst those in Pontefract and Knottingley (36%). It is also notable that although respondents
in each age group were generally more likely to agree than disagree older respondents were more inclined
to disagree with this idea (16-34: 20%, 35-54: 25%, 55+: 36%).
WMDC –Leisure Service Review Research, September 2014
Page 57
Number of facilities
Responses to the statement ‘access to a high quality leisure centres is more important to me than the number of
buildings the service operates’ highlighted some differences between respondents living in each Area. The
majority agreed with this idea in Wakefield Central (58%) and Wakefield North West (58%). Respondents
were more likely to agree than disagree in the Areas of Normanton and Featherstone (48% vs. 30%),
Castleford (40% vs. 36%) and Wakefield Rural (49% vs. 27%). In contrast, respondents in Pontefract and
Knottingley were more likely to disagree (43%) than they were to agree (35%). At least in part, this is likely
to reflect the fact that one of the proposals for the provision of leisure services in the five towns area in
future includes the closure of Pontefract Pool and the pool at Knottingley Sports Centre (but not the other
facilities there), although details of the proposals and the associated questions were not included in the self-
completion survey.
Generally, differences by age were recorded here as well. Half of those aged 16-34 (50%) and 35-54 (50%)
agreed with this statement, but respondents aged 55+ were as likely to disagree (40%) as they were to
agree (40%). This mirrors the findings of the face-to-face survey and highlights further that older residents
are generally less in favour of rationalising the number of buildings, reflecting that they are also less willing
to travel to access leisure services.
Generally, respondents who were most likely to recommend facilities run by Wakefield Council by giving a
score of 9 or 10 out of 10 were more likely than those giving lower scores to indicate that they disagreed
with this idea. Specifically, while the majority of those that gave a score of 0-6 or 7-8 agreed (65% and 50%
respectively), 43% of those giving a score of 9-10 agreed but 37% actually disagreed. It would seem that the
biggest advocates of Wakefield Council run facilities are most likely to have mixed feelings about reducing
the number of buildings, although they are slightly more likely to support this idea than not support it.
The leisure service is not aimed at people like me
As noted above, more self-completion respondents than face-to-face respondents agreed that ‘the leisure
service is not aimed at people like me’ and the majority of respondents in Wakefield Central agreed with this
statement (55%).
Findings suggest that agreement with this statement does not necessarily signify overall unhappiness with the
provision of services, as a third of respondents who indicated that they’d recommend Wakefield Council
run facilities actually agreed that ‘the leisure service is not aimed at people like me’ (33%).
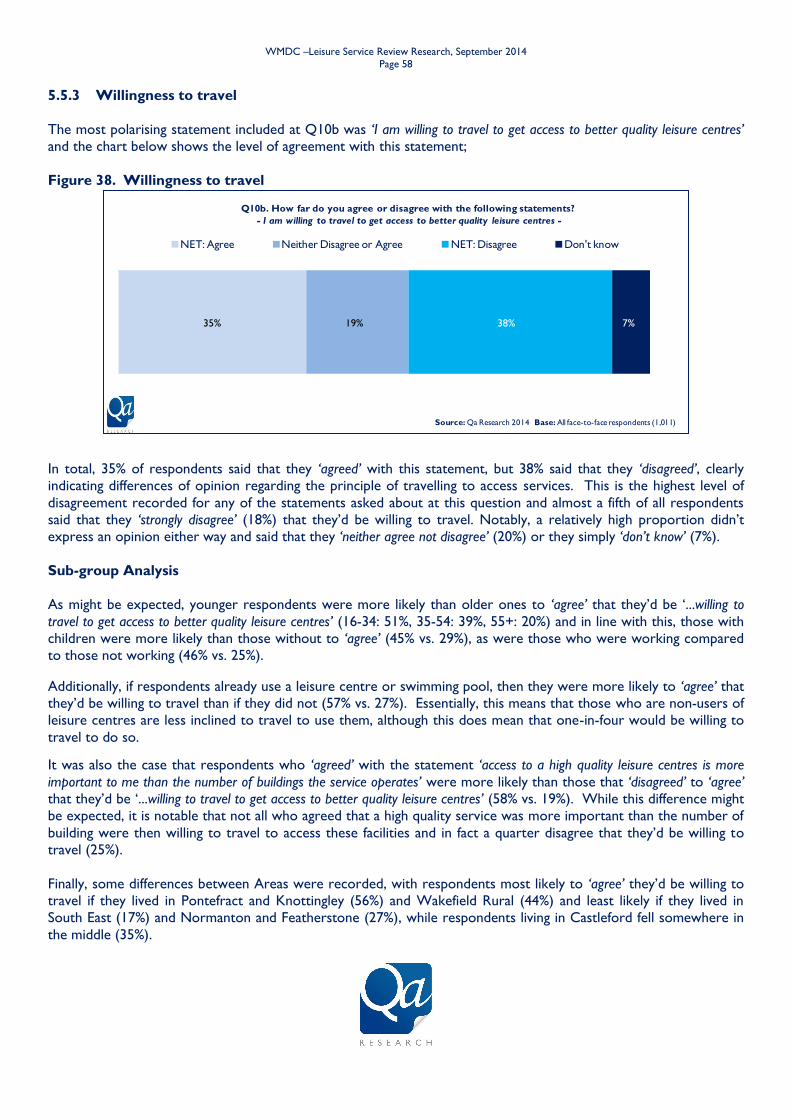
WMDC –Leisure Service Review Research, September 2014
Page 58
35% 19% 38% 7%
Q10b. How far do you agree or disagree with the following statements?
- I am willing to travel to get access to better quality leisure centres -
NET: Agree Neither Disagree or Agree NET: Disagree Don't know
Source: Qa Research 2014 Base: All face-to-face respondents (1,011)
5.5.3 Willingness to travel
The most polarising statement included at Q10b was ‘I am willing to travel to get access to better quality leisure centres’
and the chart below shows the level of agreement with this statement;
Figure 38. Willingness to travel
In total, 35% of respondents said that they ‘agreed’ with this statement, but 38% said that they ‘disagreed’, clearly
indicating differences of opinion regarding the principle of travelling to access services. This is the highest level of
disagreement recorded for any of the statements asked about at this question and almost a fifth of all respondents
said that they ‘strongly disagree’ (18%) that they’d be willing to travel. Notably, a relatively high proportion didn’t
express an opinion either way and said that they ‘neither agree not disagree’ (20%) or they simply ‘don’t know’ (7%).
Sub-group Analysis
As might be expected, younger respondents were more likely than older ones to ‘agree’ that they’d be ‘...willing to
travel to get access to better quality leisure centres’ (16-34: 51%, 35-54: 39%, 55+: 20%) and in line with this, those with
children were more likely than those without to ‘agree’ (45% vs. 29%), as were those who were working compared
to those not working (46% vs. 25%).
Additionally, if respondents already use a leisure centre or swimming pool, then they were more likely to ‘agree’ that
they’d be willing to travel than if they did not (57% vs. 27%). Essentially, this means that those who are non-users of
leisure centres are less inclined to travel to use them, although this does mean that one-in-four would be willing to
travel to do so.
It was also the case that respondents who ‘agreed’ with the statement ‘access to a high quality leisure centres is more
important to me than the number of buildings the service operates’ were more likely than those that ‘disagreed’ to ‘agree’
that they’d be ‘...willing to travel to get access to better quality leisure centres’ (58% vs. 19%). While this difference might
be expected, it is notable that not all who agreed that a high quality service was more important than the number of
building were then willing to travel to access these facilities and in fact a quarter disagree that they’d be willing to
travel (25%).
Finally, some differences between Areas were recorded, with respondents most likely to ‘agree’ they’d be willing to
travel if they lived in Pontefract and Knottingley (56%) and Wakefield Rural (44%) and least likely if they lived in
South East (17%) and Normanton and Featherstone (27%), while respondents living in Castleford fell somewhere in
the middle (35%).
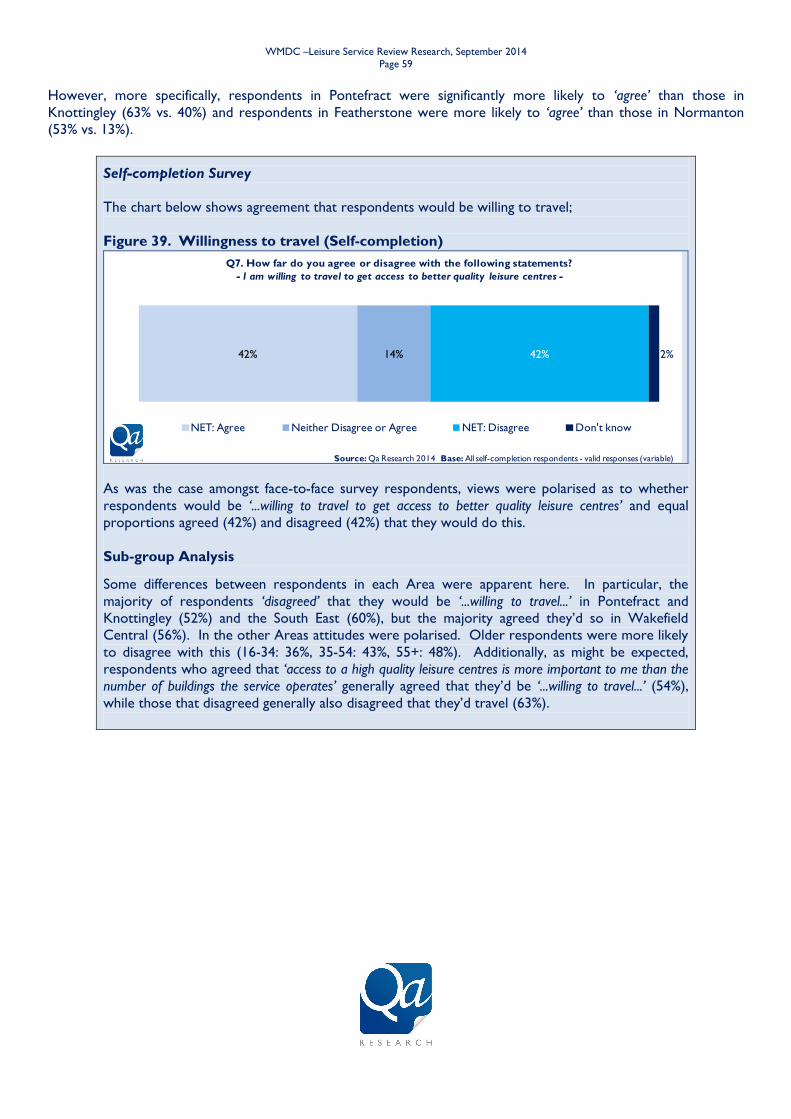
WMDC –Leisure Service Review Research, September 2014
Page 59
However, more specifically, respondents in Pontefract were significantly more likely to ‘agree’ than those in
Knottingley (63% vs. 40%) and respondents in Featherstone were more likely to ‘agree’ than those in Normanton
(53% vs. 13%).
Self-completion Survey
The chart below shows agreement that respondents would be willing to travel;
Figure 39. Willingness to travel (Self-completion)
42% 14% 42% 2%
Q7. How far do you agree or disagree with the following statements?
- I am willing to travel to get access to better quality leisure centres -
NET: Agree Neither Disagree or Agree NET: Disagree Don't know
Source: Qa Research 2014 Base: All self-completion respondents - valid responses (variable)
As was the case amongst face-to-face survey respondents, views were polarised as to whether
respondents would be ‘...willing to travel to get access to better quality leisure centres’ and equal
proportions agreed (42%) and disagreed (42%) that they would do this.
Sub-group Analysis
Some differences between respondents in each Area were apparent here. In particular, the
majority of respondents ‘disagreed’ that they would be ‘...willing to travel...’ in Pontefract and
Knottingley (52%) and the South East (60%), but the majority agreed they’d so in Wakefield
Central (56%). In the other Areas attitudes were polarised. Older respondents were more likely
to disagree with this (16-34: 36%, 35-54: 43%, 55+: 48%). Additionally, as might be expected,
respondents who agreed that ‘access to a high quality leisure centres is more important to me than the
number of buildings the service operates’ generally agreed that they’d be ‘...willing to travel...’ (54%),
while those that disagreed generally also disagreed that they’d travel (63%).

WMDC –Leisure Service Review Research, September 2014
Page 60
63%
17% 19%
1%
Yes No Don't know NET: Other
Q15. Can I just check, would it be acceptable for an organisation other than the Council to
run the pool if this saved the Council a significant amount of money?
Source: Qa Research 2014 Base: All face-to-face respondents (1,011),
5.5.4 Acceptance of an organisation other than the Council running a pool in the South East
In the section towards the end of the survey regarding the possibility of a new pool in the South East, respondents
were also asked to how acceptable it would be for ‘an organisation other than the Council to run the pool if this saved the
Council a significant amount of money’. Responses are shown in the chart below;
Figure 40. Acceptance of an organisation other than the Council running the pool
The majority of respondents did feel that this would be acceptable (63%), although one-in-five said that they ‘don’t
know’ (19%) to this question suggesting that they might require more detail before being able to decide either way.
Overall, 17% rejected this proposal out of hand and said ‘no’ to this question.
Sub-group analysis
In total 71% of respondents living in the South East said ‘yes’ to this question and high levels of agreement were also
recorded amongst those living in Wakefield North West (79%), Wakefield Central (72%), Wakefield Rural (70%).
Only 55% of Castleford respondents said ‘yes’, although 40% said ‘don’t know’ and this idea was polarising amongst
respondents living in Normanton and Featherstone with 37% saying ‘yes’ and 38% saying ‘no’ and also in Pontefract
and Knottingley where 49% said ‘yes’ and 45% said ‘no’.
Amongst all respondents, those who use a Wakefield Council run leisure centre or swimming pool most often were
significantly more likely than those that use one run by another organisation to say ‘no’ to this proposal (23% vs.
11%), although the majority of both groups said that this would be acceptable to them (64% vs. 71%).
Additionally, respondents who were most likely to indicate that they would ‘recommend to family and friends the
leisure centres and swimming pools that are run by Wakefield Council in your local area’ by giving a score of 9-10 out of 10
were more likely those that gave a score of 0-6 to say ‘no’ at this question (20% vs. 7%). This suggests that some of
the service’s biggest advocates would be uncomfortable with the prospect of a change of management, although it
should be stressed that the majority of all these groups said ‘yes’ (63%, 61% and 65% respectively).

WMDC –Leisure Service Review Research, September 2014
Page 61
3%
10%
3%
2%
4%
4%
7%
8%
8%
15%
37%
Don't know
Other
Irrelevant answer
Do not have time
Use free facilities instead (e.g. running on road)
I would feel embarrassed or out of place
There are no local leisure facilities
Don't want to, do not like exercise
Have a health problem, illness, disability or injury
It's too expensive
Too old
Q11. Why do you think the leisure service is not aimed at people like you?
Source: Qa Research 2014 Base: All face-to-face respondents who agree that the leisure service is not aimed at them (125)
5.5.5 Reason for believing the leisure service is not for them
All respondents who agreed that the ‘the leisure service is not aimed at people like me’ were asked why they felt this
was the case. This was a completely open question and similar verbatim comments have been coded into themes for
analysis and are outlined in the chart below;
Figure 41. Reasons for not feeling the leisure service is not for respondent
As the sub-group analysis suggests, age is a big reason why people feel the service is not for them and the most
frequently mentioned answer here was that the respondent felt they were ‘too old’ (37%).
As well as age, there were references to a physiological problem such as having ‘...a health problem, illness, disability or
injury’ (8%) and a similar proportion freely admitted that they ‘don’t want to, do not like exercise’ (8%).
Cost also played a part and 15% made some reference to the service being ‘...too expensive’.
Sub-group Analysis
No sub-group analysis is possible due to the small base size.

WMDC –Leisure Service Review Research, September 2014
Page 62
3%
5%
1%
91%
92%
27%
40%
<1%
2%
3%
10%
19%
33%
Don't know
No preference
In a specfic location in Minsthorpe
In a specific location in Hemsworth
Another location
In the broad area of Hemsworth
In the broad Minsthorpe area
NET: Any preference
Q14. With this in mind, which of these do you feel is the best option for where the new
pool should be built?
Full district
Ackworth, North Elmsall and Upton & South Elmsall and South Kirkby
Source: Qa Research 2014 Base: All face-to-face respondents (1,011) / all in Ackworth,North Elmsall and Upton& South Emlsall and South Kirkby (129)
5.6 A new pool in the South East
All respondents, regardless of where they lived, were asked to consider the situation in the South East of the district
and the following was read to respondents to explain the situation;
The pool at Minsthorpe has already had to close following a serious structural defect and it was not financially viable to re-
open this pool.
A decision has been taken by the Council to build a new pool in the South East, and it is considering a number of options.
Then, respondents were asked to outline what they thought was the best option for where the new pool should be
built from a list of options read out to them.
5.6.1 Preferred location for a new pool in the South East
The chart below shows responses amongst all respondents and amongst those living in the wards closest to the
pool, namely Ackworth, North Elmsall and Upton and South Elmsall and South Kirkby;
Figure 42. Preferred location for new pool in the South East
As might be expected many respondents from the district as a whole had ‘no preference’ (40%) for where the new
pool should go and a further 27% simply said that they ‘don’t know’.
When it comes to a preference, ‘the broad Minsthorpe area’ was chosen by almost twice as many respondents as
chose ‘the broad area of Hemsworth’ (19% vs. 10%) amongst everyone in the district.
More than nine-out-of-ten respondents living in the closest wards to Minsthorpe expressed a preference (92%) and
this was overwhelmingly ‘the broad Minsthorpe area’ (91%). That said, one-twenty didn’t have a preference (5%).
WMDC –Leisure Service Review Research, September 2014
Page 63
Sub-group Analysis
The one ward from the South East not included in the previous chart is Hemsworth and amongst all respondents in
the 3 wards of the South East (including Hemsworth) 94% expressed a preference, with the most frequently
mentioned being ‘the broad Minsthorpe area’ (65%). Additionally, 17% mentioned ‘the broad area of Hemsworth’ and
one-in-ten mentioned ‘a specific location in Hemsworth’ (10%).
However, amongst respondents living in the 3 South East wards, all of these mentions of Hemsworth were in fact
from respondents living in Hemsworth (of which there were 55). There is clearly a split in preferred location
between respondents living in the different wards.
A range of answers were given for the ‘specific location in Hemsworth’ but the most frequently given was ‘Hemsworth
High School’ which was mentioned in total by 1% of respondents from the district as a whole and 14% of those in
Hemsworth.
Amongst all respondents, when comparing those who thought that it would be acceptable for ‘an organisation other
than the Council’ to run the new pool in the South East ‘if this saved the Council a significant amount of money’ against
those that thought this was unacceptable, both groups were equally likely to express a preference (38% vs. 39%).
However, respondents who thought this was unacceptable were more likely to choose ‘the broad Minsthorpe area as
their preference’ (31% vs. 19%).
No other notable differences between sub-groups were recorded here.

WMDC –Leisure Service Review Research, September 2014
Page 64
6%
<1%
20%
31%
43%
74%
Don’t know
Refuse to choose an option
No preference
Close Castleford Pool, Pontefract Pool and the pool at Knottingley Sports Centre (but not the other facilities there)
now and build a single centrally located leisure centre...
Continue running the existing swimming pools at Castleford, Pontefract and Knottingley for as long as they are affordable...
NET: Any preference
Q16. With this in mind, which of the following do you feel it would be better for the Council to do?
Source: Qa Research 2014 Base: All face-to-face respondents (1,011)
5.7 The Five Towns Area
All respondents were asked to consider the provision of leisure services in the Five Towns area and the following
context was read out to respondents;
The Council currently runs swimming pools in Pontefract, Castleford and Normanton. It also runs pools in Featherstone
and Knottingley which offer other activities and sports as well as a pool. It is not feasible for the Council to continue running
all the existing leisure centres and swimming pools in the Five Towns area with their current opening hours, as they are
relatively expensive to run and require expensive new equipment or maintenance to keep them open.
Respondents were then asked a series of question about future provision in the Five Towns area.
5.7.1 Preferred option for the Five Towns area
It was explained to respondents that there are two options for future provision of leisure services in the Five Towns
area and the following description of these was read out to them;
Continue running the existing swimming pools at Castleford, Pontefract and Knottingley for as long as they are affordable,
accepting that as the buildings and equipment are old they will eventually fail and there would be no alternative but to
close, as the Council will not be able to continue to run them.
Close Castleford Pool, Pontefract Pool and the pool at Knottingley Sports Centre (but not the other facilities there) and
replace with a single centrally located leisure centre. This new centre would offer a new pool and other sports facilities and
would have the capacity to fulfill current usage demand and likely future demand. It would also be open more hours than
any of the current individual centres can offer. The pools at Normanton and Featherstone and the sports facilities at
Knottingley would not close, so with this option there’d be 3 pools and 3 sports centres in the Five Towns area.
All respondents were asked which of these options they felt it would be better for the Council to do and the chart
below shows responses amongst the total sample;
Figure 43. Preferred option for the Five Towns area
As the previous chart shows, the majority of all respondents did express a preference for one of the options
presented to them (74%).

WMDC –Leisure Service Review Research, September 2014
Page 65
66%
60%
19%
33%
67%
19%
6%
46%50%
17%
9%
16%
34%
16%13%
2% 4%
18%
1% 3%
Castleford Normanton Featherstone Pontefract Knottingley
Q16. With this in mind, which of the following do you feel it would be better for the Council to do?
- by Five Towns -
Continue running the existing swimming pools at Castleford, Pontefract and Knottingley for as long as they are affordable...
Close Castleford Pool, Pontefract Pool and the pool at Knottingley Sports Centre (but not the other facilities there) now and build a single centrally
located leisure centre...
No preference
Refuse to choose an option
Source: Qa Research 2014 Base: All face-to-face respondents in each town(102/55/50//90/49)
Respondents were significantly more likely to choose the option to ‘continue running the existing swimming pools at
Castleford, Pontefract and Knottingley for as long as they are affordable...’ than they were to chose to ‘close Castleford Pool,
Pontefract Pool and the pool at Knottingley Sports Centre (but not the other facilities there) now and build a single centrally
located leisure centre...’ (43% vs. 31%).
It should be noted that around one-in-four of all respondents either said that they had ‘no preference’ (16%) or that
they ‘don’t know’ (5%).
Sub-group Analysis
Amongst all respondents, older respondents were more likely to indicate that they have ‘no preference’ (16-34: 16%,
35-54: 16%, 55+: 28%), reflecting the fact that they are less likely to use leisure centre and swimming pools. While
the youngest respondents were divided on whether they preferred to ‘continue running the existing swimming pools...’
(39%) or the option to ‘...build a single centrally located leisure centre...’ (40%) preference amongst the other age groups
was to ‘continue running the existing swimming pools...’ (35-54: 45%, 55+: 44%).
The chart below shows response to this question amongst respondents in each of the individual five towns;
Figure 44. Preferred option for the Five Towns area – by Five Towns
Clear differences exist between respondents living in the different towns.
The majority of Castleford respondents chose the option to ‘continue running the existing swimming pools...’ (66%), as did
the majority in Normanton (60%) and Knottingley (67%).
In contrast, respondents in Featherstone were most likely to choose the option to ‘...build a single centrally located leisure
centre...’ (46%), although a third said that they actually had ‘no preference’ (34%).
This was also the preferred option amongst respondents in Pontefract (50%), although a third chose the option to
‘continue running the existing swimming pools...’ (33%). Due to small sample size, statistically speaking, the proportion of
Pontefract respondents choosing to ‘...build a single centrally located leisure centre...’ isn’t significantly higher than the
proportion choosing to continue running the existing swimming pools...’, so caution should be taken when considering this
data.
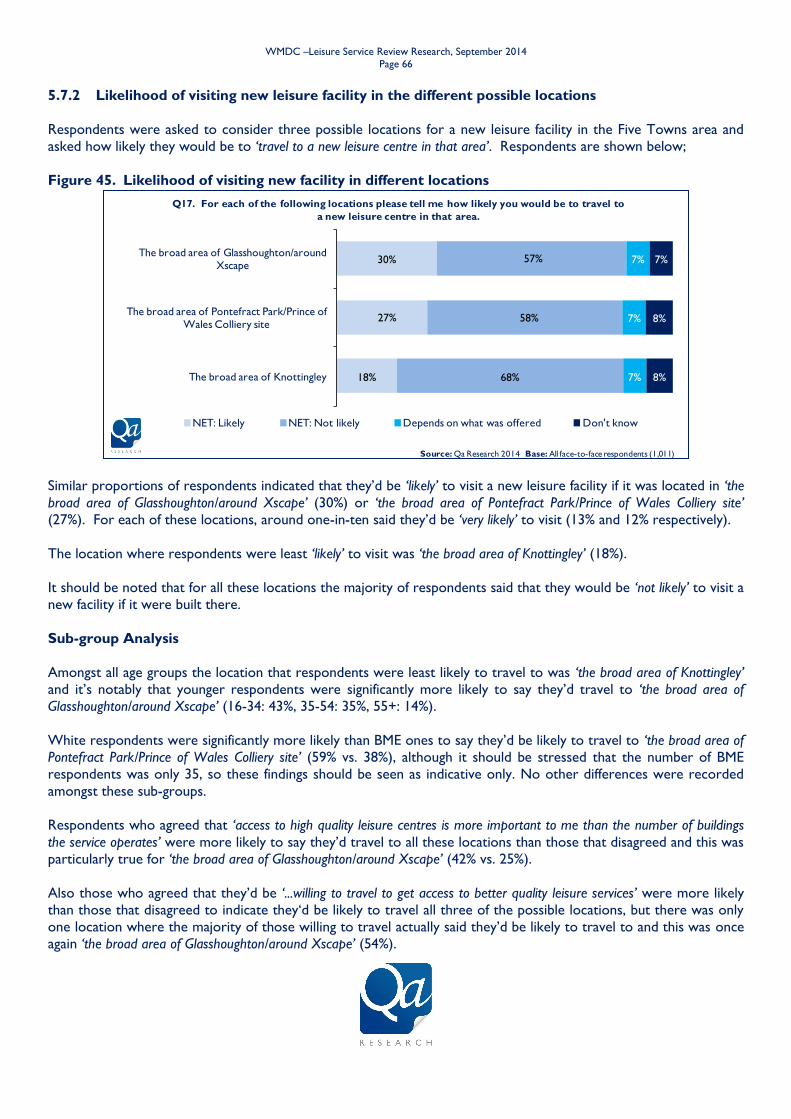
WMDC –Leisure Service Review Research, September 2014
Page 66
18%
27%
30%
68%
58%
57%
7%
7%
7%
8%
8%
7%
The broad area of Knottingley
The broad area of Pontefract Park/Prince of Wales Colliery site
The broad area of Glasshoughton/around Xscape
Q17. For each of the following locations please tell me how likely you would be to travel to
a new leisure centre in that area.
NET: Likely NET: Not likely Depends on what was offered Don't know
Source: Qa Research 2014 Base: All face-to-face respondents (1,011)
5.7.2 Likelihood of visiting new leisure facility in the different possible locations
Respondents were asked to consider three possible locations for a new leisure facility in the Five Towns area and
asked how likely they would be to ‘travel to a new leisure centre in that area’. Respondents are shown below;
Figure 45. Likelihood of visiting new facility in different locations
Similar proportions of respondents indicated that they’d be ‘likely’ to visit a new leisure facility if it was located in ‘the
broad area of Glasshoughton/around Xscape’ (30%) or ‘the broad area of Pontefract Park/Prince of Wales Colliery site’
(27%). For each of these locations, around one-in-ten said they’d be ‘very likely’ to visit (13% and 12% respectively).
The location where respondents were least ‘likely’ to visit was ‘the broad area of Knottingley’ (18%).
It should be noted that for all these locations the majority of respondents said that they would be ‘not likely’ to visit a
new facility if it were built there.
Sub-group Analysis
Amongst all age groups the location that respondents were least likely to travel to was ‘the broad area of Knottingley’
and it’s notably that younger respondents were significantly more likely to say they’d travel to ‘the broad area of
Glasshoughton/around Xscape’ (16-34: 43%, 35-54: 35%, 55+: 14%).
White respondents were significantly more likely than BME ones to say they’d be likely to travel to ‘the broad area of
Pontefract Park/Prince of Wales Colliery site’ (59% vs. 38%), although it should be stressed that the number of BME
respondents was only 35, so these findings should be seen as indicative only. No other differences were recorded
amongst these sub-groups.
Respondents who agreed that ‘access to high quality leisure centres is more important to me than the number of buildings
the service operates’ were more likely to say they’d travel to all these locations than those that disagreed and this was
particularly true for ‘the broad area of Glasshoughton/around Xscape’ (42% vs. 25%).
Also those who agreed that they’d be ‘...willing to travel to get access to better quality leisure services’ were more likely
than those that disagreed to indicate they‘d be likely to travel all three of the possible locations, but there was only
one location where the majority of those willing to travel actually said they’d be likely to travel to and this was once
again ‘the broad area of Glasshoughton/around Xscape’ (54%).
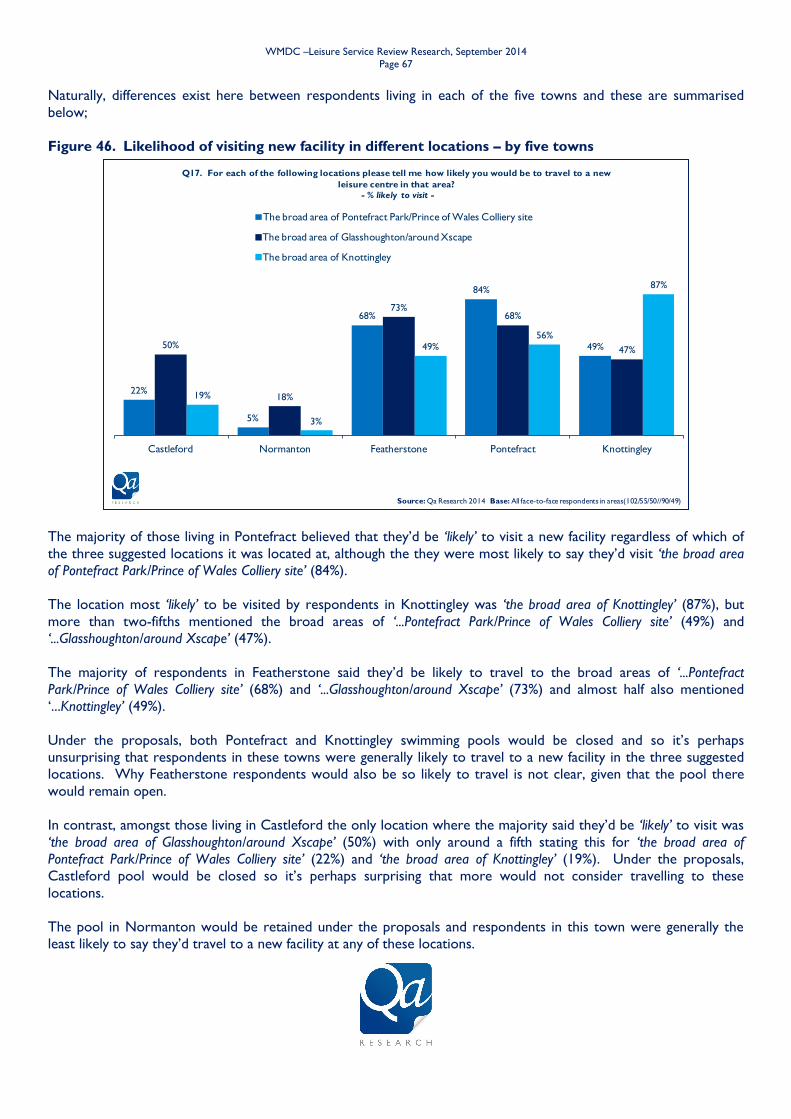
WMDC –Leisure Service Review Research, September 2014
Page 67
22%
5%
68%
84%
49%50%
18%
73%68%
47%
19%
3%
49%56%
87%
Castleford Normanton Featherstone Pontefract Knottingley
Q17. For each of the following locations please tell me how likely you would be to travel to a new
leisure centre in that area?
- % likely to visit -
The broad area of Pontefract Park/Prince of Wales Colliery site
The broad area of Glasshoughton/around Xscape
The broad area of Knottingley
Source: Qa Research 2014 Base: All face-to-face respondents in areas(102/55/50//90/49)
Naturally, differences exist here between respondents living in each of the five towns and these are summarised
below;
Figure 46. Likelihood of visiting new facility in different locations – by five towns
The majority of those living in Pontefract believed that they’d be ‘likely’ to visit a new facility regardless of which of
the three suggested locations it was located at, although the they were most likely to say they’d visit ‘the broad area
of Pontefract Park/Prince of Wales Colliery site’ (84%).
The location most ‘likely’ to be visited by respondents in Knottingley was ‘the broad area of Knottingley’ (87%), but
more than two-fifths mentioned the broad areas of ‘...Pontefract Park/Prince of Wales Colliery site’ (49%) and
‘...Glasshoughton/around Xscape’ (47%).
The majority of respondents in Featherstone said they’d be likely to travel to the broad areas of ‘...Pontefract
Park/Prince of Wales Colliery site’ (68%) and ‘...Glasshoughton/around Xscape’ (73%) and almost half also mentioned
‘...Knottingley’ (49%).
Under the proposals, both Pontefract and Knottingley swimming pools would be closed and so it’s perhaps
unsurprising that respondents in these towns were generally likely to travel to a new facility in the three suggested
locations. Why Featherstone respondents would also be so likely to travel is not clear, given that the pool there
would remain open.
In contrast, amongst those living in Castleford the only location where the majority said they’d be ‘likely’ to visit was
‘the broad area of Glasshoughton/around Xscape’ (50%) with only around a fifth stating this for ‘the broad area of
Pontefract Park/Prince of Wales Colliery site’ (22%) and ‘the broad area of Knottingley’ (19%). Under the proposals,
Castleford pool would be closed so it’s perhaps surprising that more would not consider travelling to these
locations.
The pool in Normanton would be retained under the proposals and respondents in this town were generally the
least likely to say they’d travel to a new facility at any of these locations.
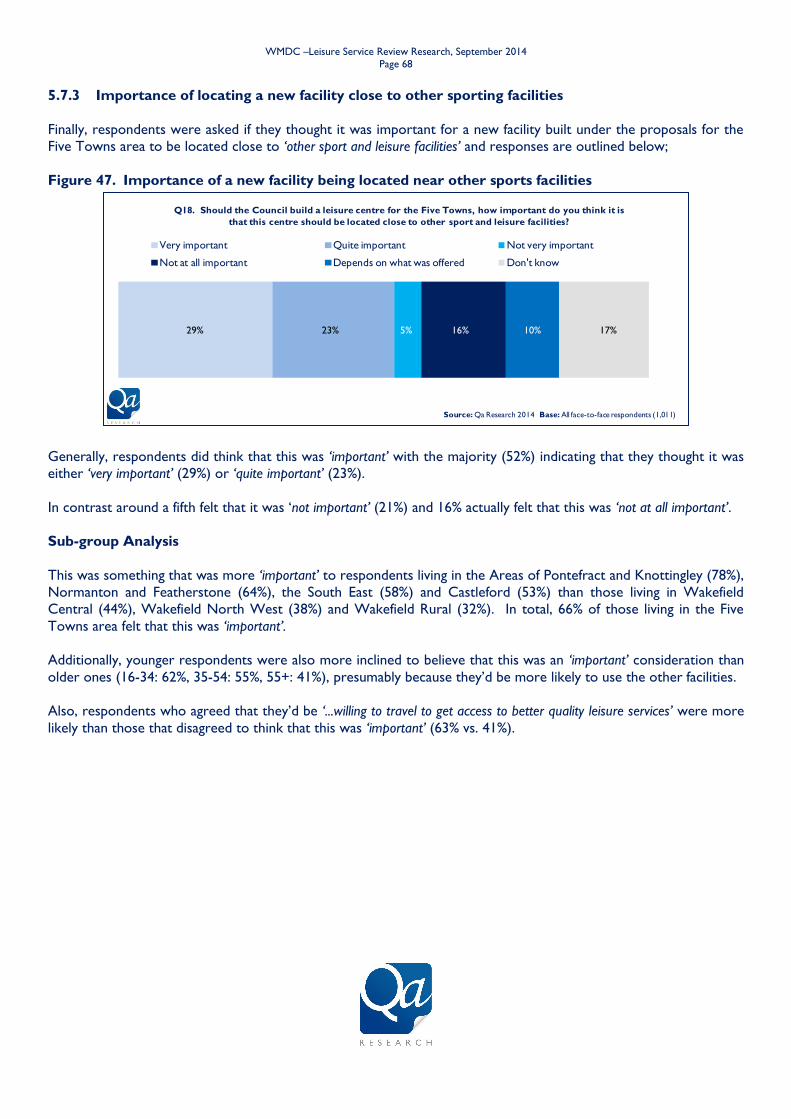
WMDC –Leisure Service Review Research, September 2014
Page 68
29% 23% 5% 16% 10% 17%
Q18. Should the Council build a leisure centre for the Five Towns, how important do you think it is
that this centre should be located close to other sport and leisure facilities?
Very important Quite important Not very important
Not at all important Depends on what was offered Don't know
Source: Qa Research 2014 Base: All face-to-face respondents (1,011)
5.7.3 Importance of locating a new facility close to other sporting facilities
Finally, respondents were asked if they thought it was important for a new facility built under the proposals for the
Five Towns area to be located close to ‘other sport and leisure facilities’ and responses are outlined below;
Figure 47. Importance of a new facility being located near other sports facilities
Generally, respondents did think that this was ‘important’ with the majority (52%) indicating that they thought it was
either ‘very important’ (29%) or ‘quite important’ (23%).
In contrast around a fifth felt that it was ‘not important’ (21%) and 16% actually felt that this was ‘not at all important’.
Sub-group Analysis
This was something that was more ‘important’ to respondents living in the Areas of Pontefract and Knottingley (78%),
Normanton and Featherstone (64%), the South East (58%) and Castleford (53%) than those living in Wakefield
Central (44%), Wakefield North West (38%) and Wakefield Rural (32%). In total, 66% of those living in the Five
Towns area felt that this was ‘important’.
Additionally, younger respondents were also more inclined to believe that this was an ‘important’ consideration than
older ones (16-34: 62%, 35-54: 55%, 55+: 41%), presumably because they’d be more likely to use the other facilities.
Also, respondents who agreed that they’d be ‘...willing to travel to get access to better quality leisure services’ were more
likely than those that disagreed to think that this was ‘important’ (63% vs. 41%).

WMDC –Leisure Service Review Research, September 2014
Page 69
8%
30%
4%
5%
10%
13%
14%
15%
16%
16%
16%
16%
16%
18%
18%
20%
21%
31%
44%
62%
Don't know
None
NET: Something else
Hireable storage for club equipment
Beauty Spa
An App for smartphones/tablets allowing you to search activities/classes and book and pay for them
Baby change facilities
Being able to access other services not provided by the Council such as housing, debt management, etc
A communal space for meeting people
A crèche available so you can pay to leave children for a short time
A function room that can be hired for parties, clubs and meetings or privately provided activities
Family changing rooms
Being able to access other council services like paying parking fines, applying for Blue Badges, etc
Refreshments available in the form of self serve drinks and snacks
Being able to access support services related to being healthy such as healthy eating sessions', stop smoking sessions,' etc
Single sex changing rooms
Wi-Fi
Free Car Park
A café
NET: Any mention
Q13. The council is very keen to understand if other, non-sporting facilities would encourage
people to use leisure centres and swimming pools more often. So which, if any, of these facilities
would make you more likely to visit?
Source: Qa Research 2014 Base: All face-to-face respondents (1,011)
5.8 Encouraging people to use leisure centres and swimming pools
It was explained to respondents that the Council is very keen to understand if other, non-sporting facilities would
encourage people to use leisure centres and swimming pools more often.
Respondents were then asked which facilities, if any, would make them more likely to visit either a leisure centre and
swimming pool and responses are detailed below;
Figure 48. Facilities that would encourage use of a leisure centre or swimming pool
The majority (62%) of respondents were able to mention at least one non-sporting facility that would encourage
them to visit a leisure centre or swimming pool more often and the average number mentioned, by all respondents,
was 2.9.
WMDC –Leisure Service Review Research, September 2014
Page 70
Here, the most frequently mentioned were ‘a cafe’ (44%) and a ‘free car park’ (31%), while a fifth mentioned ‘wi-fi’
(21%). Notably, ‘a cafe’ was a more popular choice than ‘refreshments available in the form of self serve drinks and
snacks’ (18%).
Respondents were more likely to mention ‘single sex changing rooms’ (20%) than ‘family changing rooms’ (16%) and ‘a
crèche available so you can pay to leave children for a short time’ and ‘baby change facilities’ were mentioned by broadly
equal proportions (16% vs. 14%).
‘Being able to access support services related to being healthy such as healthy eating sessions', stop smoking sessions,' etc’ was
mentioned by around a fifth (18%) and there was also support for accessing services including ‘...other council services
like paying parking fines, applying for Blue Badges, etc’ (16%) and ‘...other services not provided by the Council such as
housing, debt management, etc’ (15%).
In addition, ‘a function room that can be hired for parties, clubs and meetings or privately provided activities’ (16%) was as
popular as ‘a communal space for meeting people’ (16%)
The least popular facilities were ‘an App for smartphones/tablets allowing you to search activities/classes and book and pay
for them’ (13%), ‘beauty spa’ (10%) and ‘hireable storage for club equipment’ (5%).
Just less than one-in-twenty mentioned ‘something else’ (4%) at this question and this was primarily comments relating
to leisure centres and swimming pools being ‘...cheaper or free (including concessions for elderly and disabled)’ (2%).
Sub-group Analysis
The range of facilities asked about at this question is broad and some are naturally more likely to appeal more to
some residents than others.
Age is a big factor in this and mentions of ‘none’ were significantly higher amongst older respondents than younger
ones (16-34: 18%, 35-54: 25%, 55+: 43%), with younger respondents generally more likely to mention all of the
facilities at this question but especially ‘wi-fi’ (16-34: 39%, 35-54: 22%, 55+: 6%).
Consequently, mentions of all the facilities were generally higher amongst demographic groups that correlate closely
with age such as those with children and working respondents.
Amongst respondents that use a leisure centre or swimming pool, those that said the leisure centre or swimming
pool they use most often was one run by Wakefield Council were more likely to mention any of these non-sporting
facilities than those that use one operated by someone else (86% vs. 68%).
Nor were respondents who agreed that ‘the leisure service is not aimed at people like me’ more likely than those that
disagreed to mention any of these non-sporting facilities and they were generally less likely to mention any (60% vs.
71%). Therefore, nothing stands out as being more likely to encourage this group to believe the service is for them.
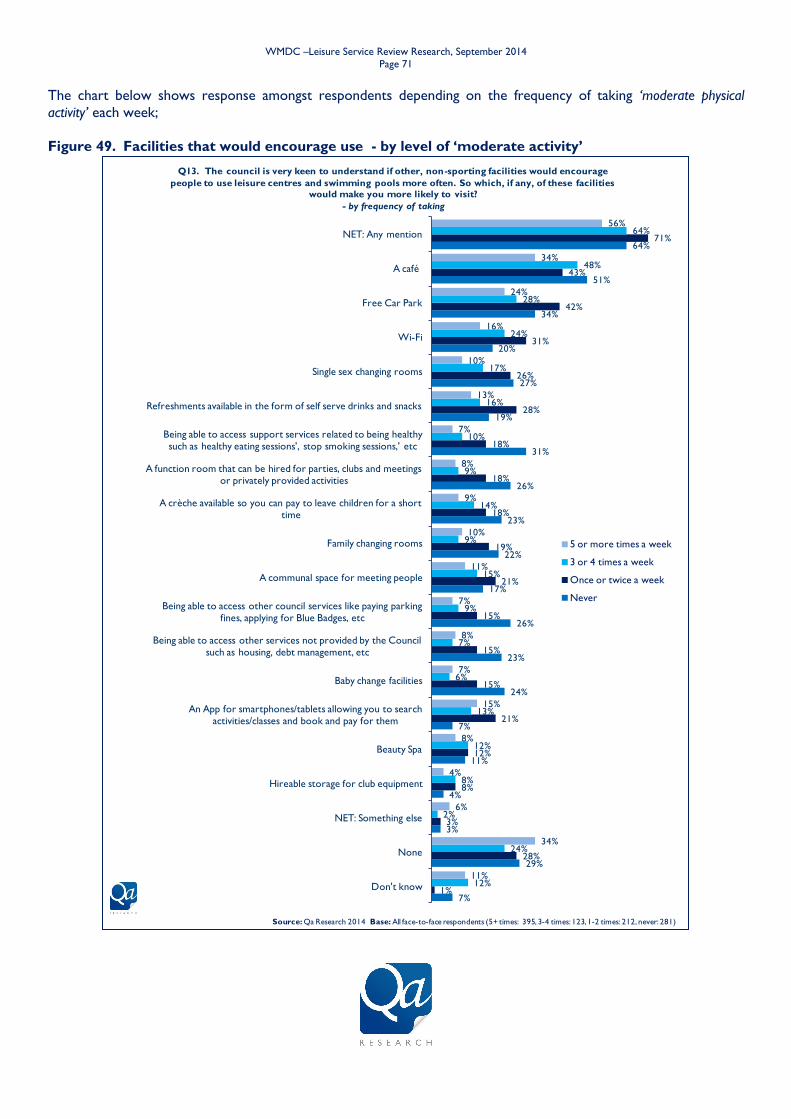
WMDC –Leisure Service Review Research, September 2014
Page 71
7%
29%
3%
4%
11%
7%
24%
23%
26%
17%
22%
23%
26%
31%
19%
27%
20%
34%
51%
64%
1%
28%
3%
8%
12%
21%
15%
15%
15%
21%
19%
18%
18%
18%
28%
26%
31%
42%
43%
71%
12%
24%
2%
8%
12%
13%
6%
7%
9%
15%
9%
14%
9%
10%
16%
17%
24%
28%
48%
64%
11%
34%
6%
4%
8%
15%
7%
8%
7%
11%
10%
9%
8%
7%
13%
10%
16%
24%
34%
56%
Don't know
None
NET: Something else
Hireable storage for club equipment
Beauty Spa
An App for smartphones/tablets allowing you to search activities/classes and book and pay for them
Baby change facilities
Being able to access other services not provided by the Council such as housing, debt management, etc
Being able to access other council services like paying parking fines, applying for Blue Badges, etc
A communal space for meeting people
Family changing rooms
A crèche available so you can pay to leave children for a short time
A function room that can be hired for parties, clubs and meetings or privately provided activities
Being able to access support services related to being healthy such as healthy eating sessions', stop smoking sessions,' etc
Refreshments available in the form of self serve drinks and snacks
Single sex changing rooms
Wi-Fi
Free Car Park
A café
NET: Any mention
Q13. The council is very keen to understand if other, non-sporting facilities would encourage
people to use leisure centres and swimming pools more often. So which, if any, of these facilities
would make you more likely to visit?
- by frequency of taking
5 or more times a week
3 or 4 times a week
Once or twice a week
Never
Source: Qa Research 2014 Base: All face-to-face respondents (5+ times: 395, 3-4 times: 123, 1-2 times: 212, never: 281)
The chart below shows response amongst respondents depending on the frequency of taking ‘moderate physical
activity’ each week;
Figure 49. Facilities that would encourage use - by level of ‘moderate activity’

WMDC –Leisure Service Review Research, September 2014
Page 72
The previous chart highlights that the group most likely to mention at least one of these non-sporting facilities was
those that take ‘moderate physical activity’ ‘once or twice a week’ (71%), suggesting that it would be a comparatively easy
to encourage greater usage amongst these residents. This group was more likely than those others to mention a ‘free
car park’ (42%), ‘wi-fi’ (31%), ‘refreshments available in the form of self serve drinks and snacks’ (28%) and ‘a communal
space for meeting people’ (21%).
Encouraging, the majority of those that said they ‘never’ take ‘moderate physical activity’ were able to mention at least
one thing at this question (64%) and they were more likely than the other groups to mention ‘a cafe’ (51%), ‘a
function room that can be hired for parties, clubs and meetings or privately provided activities’ (26%), ‘single sex changing
rooms’ (27%) and also ‘family changing rooms’ (22%) as well as ‘baby change facilities’ (24%) and ‘a crèche...’ (23%).
For those that ‘never’ take ‘moderate physical activity’, there is also an opportunity to encourage greater usage of
leisure centres and swimming pools by offering access other services, including ‘...support services related to being
healthy such as healthy eating sessions', stop smoking sessions,' etc’ (31%), ‘...other council services like paying parking fines,
applying for Blue Badges, etc’ (26%) and ‘...other services not provided by the Council such as housing, debt management, etc’
(23%).

WMDC –Leisure Service Review Research, September 2014
Page 73
Self-completion survey;
On the self-completion survey an identical question was included to gauge the likely impact of a
range of facilities on usage of a leisure centre or swimming pool and responses were as follows;
Figure 50. Facilities that would encourage use of a leisure centre/ pool (self-
completion)
4%
1%
<1%
<1%
<1%
<1%
<1%
<1%
1%
1%
1%
1%
1%
1%
4%
6%
8%
15%
20%
23%
23%
23%
23%
25%
28%
30%
31%
36%
52%
79%
96%
None
Other
Improved atmosphere i.e. music, air conditioning
Disability facilities
Better spectator seating and in cafe
Sauna and health suite as part of spa
Better maintenance, cleanliness and staffing
Secure cycle parking
Longer opening hours and wider class availability
Improvements to pool
Youth and childrens classes and baby pool
Local or easily and freely accessible
Discounts e.g. for families or the elderly
Improved changing and showering facilites, option for unisex
Being able to access other services not provided by the Council
Hireable storage for club equipment
Being able to access other council services
Baby change facilities
Crèche
Refreshments
Being able to access support services related to being healthy
A communal space for meeting people
A function room that can be hired
Beauty Spa
Family changing rooms
Wi-Fi
An App for smartphones/tablets
Single sex changing rooms
A café
Free Car Park
Net - Any
Q10. The council is very keen to understand if other, non-sporting facilities would encourage people
to use leisure centres and swimming pools more often. So which, if any, of these facilities would make
you more likely to visit?
Source: Qa Research 2014 Base: All self-completion respondents (801)
Almost all (96%) self-completion survey respondents mentioned at least one facility from the list
that would encourage them to use leisure centres and swimming pools more often. This was a
significantly higher proportion than amongst face-to-face respondents (62%) and perhaps reflects
greater usage of leisure centres amongst those who took part in the self-completion survey. Self-
completion respondents also mentioned more activities (4.3 on average) than face-to-face
respondents (2.9 on average), suggesting they have stronger opinions on how leisure centres
should develop for the better.
WMDC –Leisure Service Review Research, September 2014
Page 74
As was the case in the face-to-face survey, the most frequently mentioned facilities were a ‘free car
park’ (79%) and ‘a cafe’ (52%) and ‘single sex changing rooms’ (36%) and ‘wi-fi’ (30%) were also
mentioned by a relatively high proportion. Again, ‘single sex changing rooms’ were mentioned more
frequently than ‘family changing rooms’ (28%)
Notably, self-completion survey respondents were much more likely to mention ‘an App for
smartphones/tablets allowing you to search activities/classes and book and pay for them’ (31%) and this
may reflect the fact that more than nine-out-of-ten said that they currently use a leisure centre or
pool (compared to only around one-in-four face-to-face respondents) and consequently these
users are perhaps more likely to see the value of an App. Similarly, a ‘beauty spa’ (25%) seems to
hold more appeal amongst self-completion survey respondents than face-to-face respondents who
rated this as least likely to encourage usage (10%).
Sub-group Analysis
Generally, females were more likely than males to choose any of these options (97% vs. 93%) and
were therefore more likely to choose specific options including ‘a cafe’ (56% vs. 44%), ‘single sex
changing rooms’ (43% vs. 24%) and also ‘family changing rooms’ (33% vs. 20%) as well as ‘an App...’
(34% vs. 25%) and perhaps inevitably a ‘beauty spa’ (34% vs. 8%).
Similarly, different facilities appeal to different age groups with younger people more likely to
mention technology such as ‘wi-fi’ (16-34: 49%, 35-54: 30%, 55+: 16%) and ‘an App...’ (16-34: 62%,
35-54: 37%, 55+: 8%) and also facilities for children including ‘a crèche’ (16-34: 37%, 35-54: 20%,
55+: 10%) and ‘baby change facilities’ (16-34: 28%, 35-54: 13%, 55+: 10%).
The one area that was more attractive to older self-completion survey respondents was ‘being
able to access other council services’ (16-34: 5%, 35-54: 6%, 55+: 11%), although this option is still
less popular than many of the others amongst the over 55s.
Notably, respondents who indicated that they’d be unlikely to recommend a Wakefield Council
run facility by giving a score of 0-6 out of 10 were significantly more likely than those giving a
score of 9-10 to mention ‘an App...’ here (37% vs. 25%).
It should also be noted that respondents who said that they use Pontefract Pool most often were
more likely to mention ‘single sex changing rooms’ (46%) than those using Castleford (33%), Sun
Lane (31%) or Featherstone (24%).
Similarly, those using Sun Lane most often were more likely to mention ‘Wi-fi’ (42%) than
respondents using other Wakefield Council leisure centres and pools. Also, respondents who said
that they actually use a non-Wakefield Council run facility most often were more likely to
mention ‘an App...’ (41%) and a ‘free car park’ (87%); many of these use private facilities which
might suggest that these are available at these facilities and respondents would therefore like to
see the same services offered by Wakefield Council.
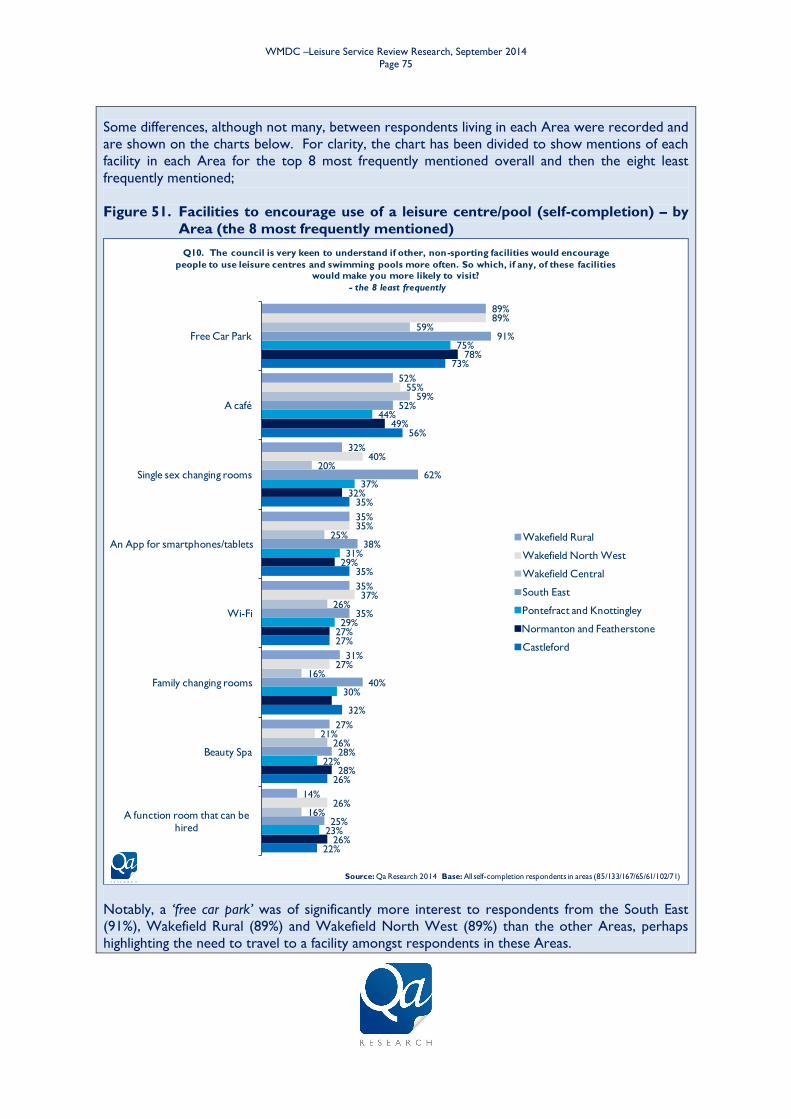
WMDC –Leisure Service Review Research, September 2014
Page 75
Some differences, although not many, between respondents living in each Area were recorded and
are shown on the charts below. For clarity, the chart has been divided to show mentions of each
facility in each Area for the top 8 most frequently mentioned overall and then the eight least
frequently mentioned;
Figure 51. Facilities to encourage use of a leisure centre/pool (self-completion) – by
Area (the 8 most frequently mentioned)
22%
26%
32%
27%
35%
35%
56%
73%
26%
28%
27%
29%
32%
49%
78%
23%
22%
30%
29%
31%
37%
44%
75%
25%
28%
40%
35%
38%
62%
52%
91%
16%
26%
16%
26%
25%
20%
59%
59%
26%
21%
27%
37%
35%
40%
55%
89%
14%
27%
31%
35%
35%
32%
52%
89%
A function room that can be hired
Beauty Spa
Family changing rooms
Wi-Fi
An App for smartphones/tablets
Single sex changing rooms
A café
Free Car Park
Q10. The council is very keen to understand if other, non-sporting facilities would encourage
people to use leisure centres and swimming pools more often. So which, if any, of these facilities
would make you more likely to visit?
- the 8 least frequently
Wakefield Rural
Wakefield North West
Wakefield Central
South East
Pontefract and Knottingley
Normanton and Featherstone
Castleford
Source: Qa Research 2014 Base: All self-completion respondents in areas (85/133/167/65/61/102/71)
Notably, a ‘free car park’ was of significantly more interest to respondents from the South East
(91%), Wakefield Rural (89%) and Wakefield North West (89%) than the other Areas, perhaps
highlighting the need to travel to a facility amongst respondents in these Areas.

WMDC –Leisure Service Review Research, September 2014
Page 76
Compared to all other Areas, South East respondents were more likely to mention ‘single sex
changing rooms’ (62%) and also ‘family changing rooms’ (40%), perhaps suggesting that changing
rooms in general were a concern at Minsthorpe Pool.
The chart below shows responses for the 8 least frequently mentioned facilities;
Figure 52. Facilities to encourage use of a leisure centre/pool (self-completion) – by
Area (the 8 least frequently mentioned)
2%
8%
9%
14%
20%
26%
19%
21%
8%
5%
13%
18%
20%
24%
29%
4%
6%
10%
15%
19%
27%
22%
20%
5%
6%
5%
23%
20%
12%
26%
17%
7%
5%
5%
10%
16%
23%
34%
26%
3%
5%
3%
18%
22%
22%
24%
24%
1%
6%
10%
14%
18%
28%
20%
21%
Being able to access other services not provided by the Council
Hireable storage for club equipment
Being able to access other council services
Baby change facilities
Crèche
Refreshments
Being able to access support services related to being healthy
A communal space for meeting people
Q10. The council is very keen to understand if other, non-sporting facilities would encourage people
to use leisure centres and swimming pools more often. So which, if any, of these facilities would make
you more likely to visit?
- the 8 least frequently
Wakefield Rural
Wakefield North West
Wakefield Central
South East
Pontefract and Knottingley
Normanton and Featherstone
Castleford
Source: Qa Research 2014 Base: All self-completion respondents in areas (85/133/167/65/61/102/71)
Despite some differences here, the relatively small bases sizes for each Area mean that none of
these are significant. However, it’s notable that ‘being able to access support services related to being
healthy’ was mentioned more by those in Wakefield Central (34%).
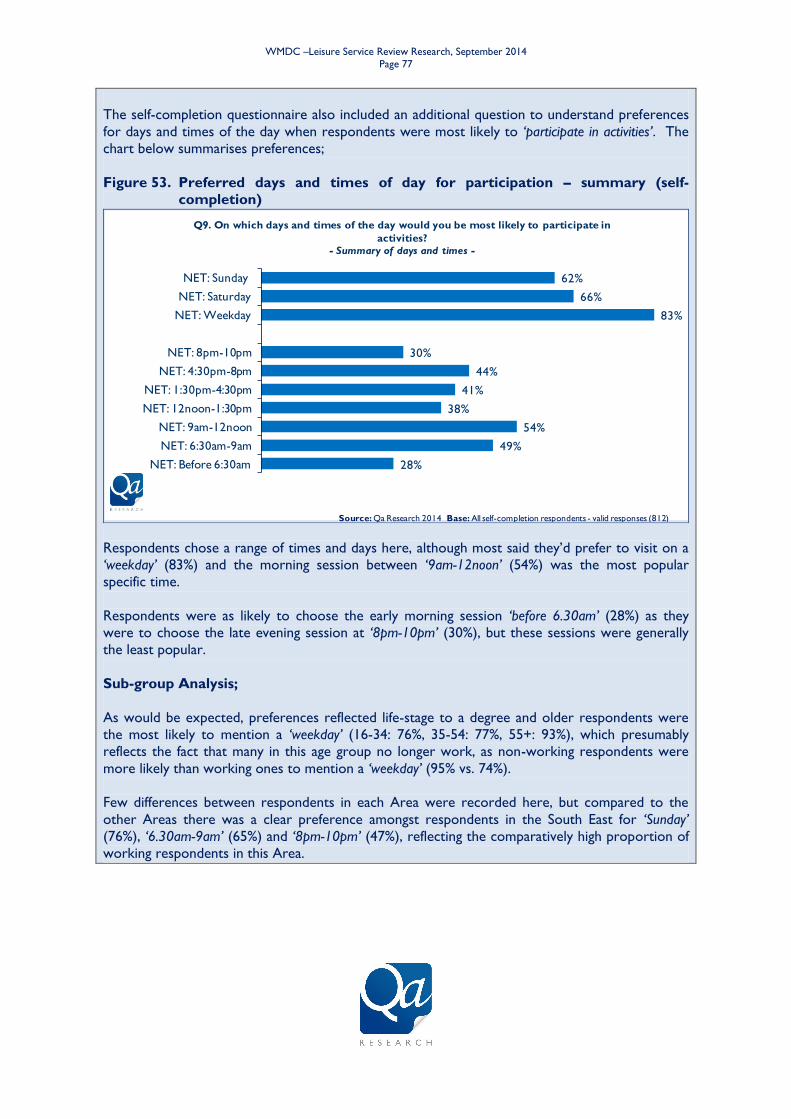
WMDC –Leisure Service Review Research, September 2014
Page 77
The self-completion questionnaire also included an additional question to understand preferences
for days and times of the day when respondents were most likely to ‘participate in activities’. The
chart below summarises preferences;
Figure 53. Preferred days and times of day for participation – summary (self-
completion)
28%
49%
54%
38%
41%
44%
30%
83%
66%
62%
NET: Before 6:30am
NET: 6:30am-9am
NET: 9am-12noon
NET: 12noon-1:30pm
NET: 1:30pm-4:30pm
NET: 4:30pm-8pm
NET: 8pm-10pm
NET: Weekday
NET: Saturday
NET: Sunday
Q9. On which days and times of the day would you be most likely to participate in
activities?
- Summary of days and times -
Source: Qa Research 2014 Base: All self-completion respondents - valid responses (812)
Respondents chose a range of times and days here, although most said they’d prefer to visit on a
‘weekday’ (83%) and the morning session between ‘9am-12noon’ (54%) was the most popular
specific time.
Respondents were as likely to choose the early morning session ‘before 6.30am’ (28%) as they
were to choose the late evening session at ‘8pm-10pm’ (30%), but these sessions were generally
the least popular.
Sub-group Analysis;
As would be expected, preferences reflected life-stage to a degree and older respondents were
the most likely to mention a ‘weekday’ (16-34: 76%, 35-54: 77%, 55+: 93%), which presumably
reflects the fact that many in this age group no longer work, as non-working respondents were
more likely than working ones to mention a ‘weekday’ (95% vs. 74%).
Few differences between respondents in each Area were recorded here, but compared to the
other Areas there was a clear preference amongst respondents in the South East for ‘Sunday’
(76%), ‘6.30am-9am’ (65%) and ‘8pm-10pm’ (47%), reflecting the comparatively high proportion of
working respondents in this Area.
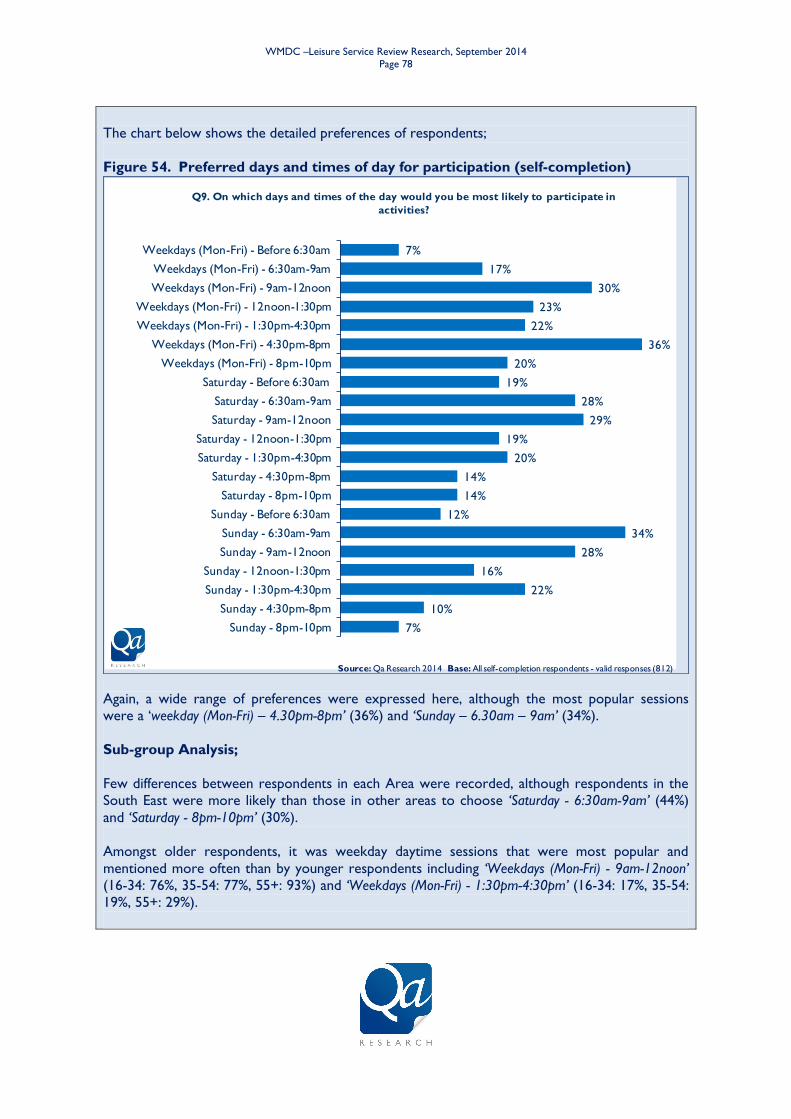
WMDC –Leisure Service Review Research, September 2014
Page 78
The chart below shows the detailed preferences of respondents;
Figure 54. Preferred days and times of day for participation (self-completion)
7%
10%
22%
16%
28%
34%
12%
14%
14%
20%
19%
29%
28%
19%
20%
36%
22%
23%
30%
17%
7%
Sunday - 8pm-10pm
Sunday - 4:30pm-8pm
Sunday - 1:30pm-4:30pm
Sunday - 12noon-1:30pm
Sunday - 9am-12noon
Sunday - 6:30am-9am
Sunday - Before 6:30am
Saturday - 8pm-10pm
Saturday - 4:30pm-8pm
Saturday - 1:30pm-4:30pm
Saturday - 12noon-1:30pm
Saturday - 9am-12noon
Saturday - 6:30am-9am
Saturday - Before 6:30am
Weekdays (Mon-Fri) - 8pm-10pm
Weekdays (Mon-Fri) - 4:30pm-8pm
Weekdays (Mon-Fri) - 1:30pm-4:30pm
Weekdays (Mon-Fri) - 12noon-1:30pm
Weekdays (Mon-Fri) - 9am-12noon
Weekdays (Mon-Fri) - 6:30am-9am
Weekdays (Mon-Fri) - Before 6:30am
Q9. On which days and times of the day would you be most likely to participate in
activities?
Source: Qa Research 2014 Base: All self-completion respondents - valid responses (812)
Again, a wide range of preferences were expressed here, although the most popular sessions
were a ‘weekday (Mon-Fri) – 4.30pm-8pm’ (36%) and ‘Sunday – 6.30am – 9am’ (34%).
Sub-group Analysis;
Few differences between respondents in each Area were recorded, although respondents in the
South East were more likely than those in other areas to choose ‘Saturday - 6:30am-9am’ (44%)
and ‘Saturday - 8pm-10pm’ (30%).
Amongst older respondents, it was weekday daytime sessions that were most popular and
mentioned more often than by younger respondents including ‘Weekdays (Mon-Fri) - 9am-12noon’
(16-34: 76%, 35-54: 77%, 55+: 93%) and ‘Weekdays (Mon-Fri) - 1:30pm-4:30pm’ (16-34: 17%, 35-54:
19%, 55+: 29%).
WMDC –Leisure Service Review Research, September 2014
Page 79
6. Appendix
6.1.2 Face-to-face Survey
Good morning/afternoon/evening, my name is… and I’m from Qa Research. We are undertaking a survey on behalf of Wakefield Council to help the council make decisions about what leisure services should look like in the future and other services that get people active. We would really appreciate it if you could spare 10 minutes to take part in this important research? Before we begin, I’d like to reassure you that this interview will be carried out according to the Market Research Society’s Code of Conduct and all your answers and information you provide will be treated as anonymous and confidential in accordance with the Data Protection Act 1998.
SCREENERS S1. How often do you do moderate physical activity for more than half an hour at a time? This might include things like walking quickly, dancing, bowling, playing golf or pushing a vacuum cleaner. SINGLECODE Once or twice a week 3 or 4 times a week 5 or more times a week Never S2. What is your postcode? This will be used for analysis purposes only. It will not be used to identify you, or be passed on to any third parties. CHECK WARD S3. DO NOT READ, INTERVIEWER TO CODE GENDER SINGLECODE Male Female S4. Can I ask how old you are? Numerical box READ OUT AGE BANDS IF NECESSARY SINGLECODE 16-24 25-34 35-44 45-54 55-59 60-64 65-74 75 or over
WMDC –Leisure Service Review Research, September 2014
Page 80
SHOWCARD S5 S5. And which of these do you feel best describes your ethnic origin? SINGLECODE White British Irish Any other White background (specify) Mixed Race White and Black Caribbean White and Black African White and Asian Any other mixed background (specify) Black or Black British Caribbean African Any other Black or Black British (specify) Asian or Asian British Indian Pakistani Nepali Bangladeshi Chinese Any other Asian (specify) Any other ethnic background Other (specify) Prefer not to say
SECTION 1: Current Usage of Leisure Facilities
These next few questions are about how much you currently take part in leisure activities and use leisure facilities. Q1. How often do you take part in vigorous physical activity for long enough to get sweaty? (This might include strenuous sporting activity, heavy manual labour, running, lifting heavy objects, heavy housework or strenuous gardening) SINGLECODE Once or twice a week 3 or 4 times a week 5 or more times a week Never Don’t know Q2. What, if any, activities, sports or exercise do you take part in during an average week? Please tell me the FIVE you do most often. DO NOT READ OUT - PROBE MULTICODE Badminton Ballroom dancing Basketball Bowls (lawn and indoor) Boxing Canoeing
WMDC –Leisure Service Review Research, September 2014
Page 81
Cricket Cycling Diving Football Golf Gym Mountain biking Mountaineering/climbing Netball Pilates Rambling (walking) Rugby league Rugby union Running Sailing Skateboarding Squash Swimming Tennis Weight training Windsurfing Yoga Zumba Something else (write in) PROBE as much as possible, e.g. if ‘martial arts’ which ones None Don’t know
ASK Q3 FOR EACH ACTIVITY MENTIONED AT Q2 –MAXIMUM OF FIVE. Q3. How often you do each of these activities? SINGLECODE More than once or twice a week Once or twice a week Once or twice a month Once every two to three months Once every three to six months Once or twice a year Don’t know
Q4. Which of these do you ever use? READ OUT MULTICODE Your nearest leisure centre or swimming pool run by Wakefield Council A leisure centre or swimming pool run by Wakefield Council that is not the nearest one to your home Your nearest leisure centre or swimming pool that is not run by Wakefield Council, but is run by a another council, company or organisation A leisure centre or swimming pool that is not the nearest one to your home and that is not run by Wakefield Council. This could be one run by another council or a company or any other organisation. None Don’t know
WMDC –Leisure Service Review Research, September 2014
Page 82
IF ‘None’ AT Q4 GOTO Q8 Q5a. Which leisure centre or swimming pools do you ever use? DO NOT READ OUT – PROBE MULTICODE Ackworth Quaker School (Ackworth) Adwick (Doncaster) Airedale Sports Centre (Airedale/Castleford) Askerm (Doncaster) Bannatynes Health Club (Wakefield) Batley Sports Centre (Kirklees Burntwood Court Hotel (Brierley) Castleford Swimming Pool Cedar Court (Crigglestone/Wakefield) City High Academy (East Moor/Wakefield) Crofton Community Centre (Crofton/Wakefield) Dewsbury Sports Centre Doncaster Dome Exercise for Less (Pontefract) Exercise for Less (Wakefield) Featherstone Sports Complex Fitness Base (Pontefract) Fitness Flex (Pontefract) Fitness Muscleworld (Horbury) Formula Fitness (Knottingley) Freeston Academy School (Normanton/Wakefield) Glasshoughton Community Centre (Castleford) Hemsworth Sports Centre at Hemsworth College (Wakefield) John Charles Centre for Sport (Leeds) John Smiths Stadium (Huddersfield) Kippax Leisure Centre (Leeds) Knottingley Sports Centre and Pool Lock Lane Sports Centre (Castleford) Metrodome (Barnsley) Minsthorpe Academy (Minsthoprpe) Normanton Jubillee Pool Nuffield (Wakefield) Oasis (Belle Vue/Wakefield) Ossett School Pontefract Pool QEGS School (Wakefield) Rothwell Sports and Leisure (Leeds) Royston (Barnsley) Sandal Magna School (Sandal/Wakefield ) Sandal Rugby Union (Sandal/Wakefield) Silcoates School (Wrenthorpe/Wakefield) Spenborough Leisure Centre (Kirklees) St Wilfrid’s High School (Featherstone) Sun Lane Leisure Thornes Park Stadium Topps gym (Outwood/Wakefield) Total Fitness (Ossett) Ultimate Physiques (Castleford)
WMDC –Leisure Service Review Research, September 2014
Page 83
Waterton Park Hotel and Leisure Club (Wakefield) Other (write in) None Don’t know Q5b. And which do you use most often? DO NOT READ OUT – PROBE SINGLECODE IMPORT ANSWERS FROM Q5a None Don’t know Q6. Is this the nearest leisure centre or swimming pool to your home? SINGLECODE Yes No Don’t know Q7. Why do you use this one most often? CODES OPEN ASK ALL Q8a. On a scale of 0 to 10 with 0 being ‘not at all’ and 10 ‘very likely’, how likely would you be to recommend to family and friends the leisure centres and swimming pools that are run by Wakefield Council in your local area? SINGLECODE 0 – Not at all likely 1 2 3 4 5 6 7 8 9 10 – Very likely Never used/no opinion Don’t know

WMDC –Leisure Service Review Research, September 2014
Page 84
Q8b. How likely would you be to recommend leisure centres and swimming pools in your local area that are run by private companies and other organisations? SINGLECODE 0 – Not at all likely 1 2 3 4 5 6 7 8 9 10 – Very likely Never used/no opinion Don’t know Q9a. An Aspire membership gives you access to leisure facilities across the Wakefield district. Do you currently have an Aspire membership? SINGLECODE Yes No Don’t know IF ‘No’ ASK Q9b, OTHERS GOTO Q10a Q9b. Had you heard of the Aspire membership scheme before this interview? SINGLECODE Yes No Don’t know
WMDC –Leisure Service Review Research, September 2014
Page 85
SECTION 2: Wakefield Leisure Service The next few questions are about The Wakefield Council Leisure Service. The principles of Wakefield Leisure Service in the future are to provide buildings and activities which encourage more people to become active. To do this, within the budget, the service wants to offer the following;
a range of activities from leisure centres, swimming pools and other locations across the district which inspire people to become active and stay active
leisure centre buildings which are fit for purpose, efficient and flexible enough to accommodate a wide variety of needs
welcoming staff which encourage, inspire, and support individual people and groups to be active.
SHOWCARD Q10a Q10a. How far do you agree or disagree with these principles? SINGLECODE Strongly Disagree Disagree Neither Disagree or Agree Agree Strongly Agree Don’t know SHOWCARD Q10a (AGAIN) Q10b. How far do you agree or disagree with the following statements? SINGLECODE Strongly Disagree Disagree Neither Disagree or Agree Agree Strongly Agree Don’t know LOOP- RANDOMISE ORDER OF ASKING
Access to a high quality leisure centres is more important to me than the number of buildings the service operates
I am willing to travel to get access to better quality leisure centres
Leisure service activities shouldn’t just be delivered from leisure centre buildings but also from other locations such as parks, sports clubs and schools
Leisure activities provided locally should be tailored to meet the needs of individual communities
The leisure service should continually assess usage and cost of its services and stop providing those activities which are not increasing the number of people taking part in them
It’s important to work with local communities now so that they can help to deliver leisure services themselves in future
The leisure service should aim to attract people from outside the district to use its facilities, so that people within the district can benefit from reduced costs
The leisure service is not aimed at people like me

WMDC –Leisure Service Review Research, September 2014
Page 86
IF ‘Agree’ THE ‘leisure service not aimed at me’ ASK Q11, OTHERS GO TO Q12a Q11. Why do you think the leisure service is not aimed at people like you? OPEN Don’t know The Council wants to encourage more people to become active, so it needs to understand what facilities people want and which activities they would like to do. SHOWCARD Q12a Q12a. What INDOOR activities do you currently do or would you like to do in future? MULTICODE Badminton Basketball Bowls (indoor) Boxing Climbing Cricket Cycling Dance classes such as ballroom, Zumba Diving Fitness class such as spinning, circuit, boxercise Running Football Gym Ice skating Netball Skateboarding Squash Swimming Tennis Weight training Yoga/Pilates Something else (write in) PROBE as much as possible, e.g. if ‘martial arts’ which ones Don’t know None IF ‘None’ AT Q12a GOTO Q12c Q12b. Of the ones you’ve mentioned, can you tell me the top THREE that you’d like to do in future, starting with the one you’d like to do most? READ OUT SINGLECODE – MAX THREE, RECORD ORDER Import answers from Q12a
WMDC –Leisure Service Review Research, September 2014
Page 87
ASK ALL SHOWCARD Q12c Q12c. What OUTDOOR activities do you currently do or would you like to do in future? MULTICODE Athletics Basketball Bowls (outdoor) Canoeing Cricket Cycling Football Golf Hockey Horse Riding Motor sports Mountain biking Mountaineering/climbing Netball Rambling (walking) Rowing Rugby league Rugby union Running Sailing Skateboarding Tennis Something else (write in) PROBE as much as possible None Don’t know IF ‘None’ AT Q12c GOTO Q13 Q12d. Of the ones you’ve mentioned, can you tell me the top THREE that you’d like to do in future, starting with the one you’d like to do most? READ OUT SINGLECODE – MAX THREE, RECORD ORDER Import answers from Q12c SHOWCARD Q13 Q13. The council is very keen to understand if other, non-sporting facilities would encourage people to use leisure centres and swimming pools more often. So which, if any, of these facilities would make you more likely to visit? MULITCODE An App for smartphones/tablets allowing you to search activities/classes and book and pay for them A communal space for meeting people Refreshments available in the form of self serve drinks and snacks A café Wi-Fi A crèche available so you can pay to leave children for a short time A function room that can be hired for parties, clubs and meetings or privately provided activities Single sex changing rooms Family changing rooms Baby change facilities

WMDC –Leisure Service Review Research, September 2014
Page 88
Beauty Spa Free car park Hireable storage for club equipment Being able to access other council services like paying parking fines, applying for Blue Badges, etc Being able to access support services related to being healthy such as ‘healthy eating sessions’, ‘stop smoking sessions,’ etc Being able to access other services not provided by the Council such as housing, debt management, etc Something else (write in) None Don’t know
SECTION 3: South East The pool at Minsthorpe has already had to close following a serious structural defect and it was not financially viable to re-open this pool. A decision has been taken by the Council to build a new pool in the South East, and it is considering a number of options. SHOWCARD Q14 Q14. With this in mind, which of these do you feel is the best option for where the new pool should be built? READ OUT SINGLECODE In the broad Minsthorpe area In a specific location in Minsthorpe (please specify) In the broad area of Hemsworth In a specific location in Hemsworth (please specify) Another location (please specify) No preference Don’t know Q15. Can I just check, would it be acceptable for an organisation other than the Council to run the
pool if this saved the Council a significant amount of money? SINGLECODE Yes No Other (write in) Don’t know

WMDC –Leisure Service Review Research, September 2014
Page 89
SECTION 4: Five Towns I would now like you to think about the Five Towns area of the district. The Council currently runs swimming pools in Pontefract, Castleford and Normanton. It also runs pools in Featherstone and Knottingley which offer other activities and sports as well as a pool. It is not feasible for the Council to continue running all the existing leisure centres and swimming pools in the Five Towns area with their current opening hours, as they are relatively expensive to run and require expensive new equipment or maintenance to keep them open. There are two options for how the Council could deliver leisure services in the Five Towns area which I’d like to read out to you. SHOWCARD Q16 ROTATE ORDER OF OPTIONS
Continue running the existing swimming pools at Castleford, Pontefract and Knottingley for as long as they are affordable, accepting that as the buildings and equipment are old they will eventually fail and there would be no alternative but to close, as the Council will not be able to continue to run them. Close Castleford Pool, Pontefract Pool and the pool at Knottingley Sports Centre (but not the other facilities there) and replace with a single centrally located leisure centre. This new centre would offer a new pool and other sports facilities and would have the capacity to fulfill current usage demand and likely future demand. It would also be open more hours than any of the current individual centres can offer. The pools at Normanton and Featherstone and the sports facilities at Knottingley would not close, so with this option there’d be 3 pools and 3 sports centres in the Five Towns area.
Q16. With this in mind, which of the following do you feel it would be better for the Council to do? READ OUT SINGLECODE – ROTATE ORDER OF OPTIONS Continue running the existing swimming pools at Castleford, Pontefract and Knottingley for as long as they are affordable, accepting that as the buildings and equipment are old they will eventually fail and there would be no alternative but to close, as the Council will not be able to continue to run them. Close Castleford Pool, Pontefract Pool and the pool at Knottingley Sports Centre (but not the other facilities there) now and build a single centrally located leisure centre. No preference Refuse to choose an option (DO NOT READ OUT) Don’t know

WMDC –Leisure Service Review Research, September 2014
Page 90
SHOWCARD Q17 Q17. Just to stress, the Council has not yet made a decision about the future of leisure centres
and swimming pools in the Five Towns. However, if the Council decided to replace the pools at Castleford, Pontefract and Knottingley then a number of broad locations are being considered for where a new facility could be built.
For each of the following locations please tell me how likely you would be to travel to a new leisure centre in that area. READ OUT SINGLECODE Very likely Quite likely Not very likely Not at all likely Depends on what was offered Don’t know LOOP – RANDOMISE ORDER The broad area of Pontefract Park/Prince of Wales Colliery site The broad area of Glasshoughton/around Xscape The broad area of Knottingley SHOWCARD Q18 Q18. Should the Council build a leisure centre for the Five Towns, how important do you think it is that this centre should be located close to other sport and leisure facilities? SINGLECODE Very important Quite important Not very important Not at all important Depends on what was offered Don’t know
DEMOGRAPHICS
The Council want to make sure that all their services are delivered fairly. We are therefore asking you the following questions, so that the Council can make sure that their services include everyone’s needs. The information you provide will be kept confidential. D1. Do you have any children at home? If yes, which age groups do they fit into? MULTICODE No children at home 4 years old and under 5 to 10 years 11 to 15 years Over 16 years (and still at home) Prefer not to say Don’t know
WMDC –Leisure Service Review Research, September 2014
Page 91
SHOWCARD D2 D2. Which of these activities best describes what you do? SINGLECODE Employee in full-time job (30 hours plus per week) Employee in part-time job (under 30 hours per week) Self employed; full or part time On government supported training programme (e.g. Modern Apprentice/ Training for Work) Full-time education at school, college or university Unemployed and available for work Unemployed due to long term illness Full-time carer for a disabled person (paid/ unpaid) Wholly retired from work Looking after the home Doing something else (write in) Prefer not to say Don’t know D3. Do you consider yourself to be disabled? SINGLECODE Yes No Prefer not to say Don’t know D4. How would you describe your Religion? SINGLECODE No religion Christian (all Christian denominations) Buddhist Hindu Muslim Sikh Jewish Other Prefer not to say Don’t know D5. As a follow up to this survey the council will be holding some discussion groups across the district. Would you, or another member of your household, be interested in being invited to one of these groups to discuss some of these issues in a greater depth? SINGLECODE Yes No

WMDC –Leisure Service Review Research, September 2014
Page 92
IF ‘Yes’ AT D5 ASK THE FOLLOWING, OTHERS GOTO Q7. D6. Can I take some details so we can contact you regarding these groups. Please rest assured that your name or address will not be attached to any of the answers you have given today. Full name Contact number Full address Email address D7. The Council has also asked if you would like to take part in other future consultations about a range of subjects in the district including leisure, open spaces, physical activity, health and wellbeing and plans for the local area. If so, they would like to keep your contact details on file so they can contact you directly.
Would you be happy for me to pass your details on to the Council? Your name or address will not be attached to any of the answers you have given today.
COLLECT DETAILS IF NOT GIVE AT D6 Thank you very much for taking part in this survey today.
S:\ProjectFiles\W\WakefieldMDC\STAKE04-
6780_Wakefield_MDC_Leisure_Review_Research\Survey\WF_leisure_review_2014_survey_V3.doc
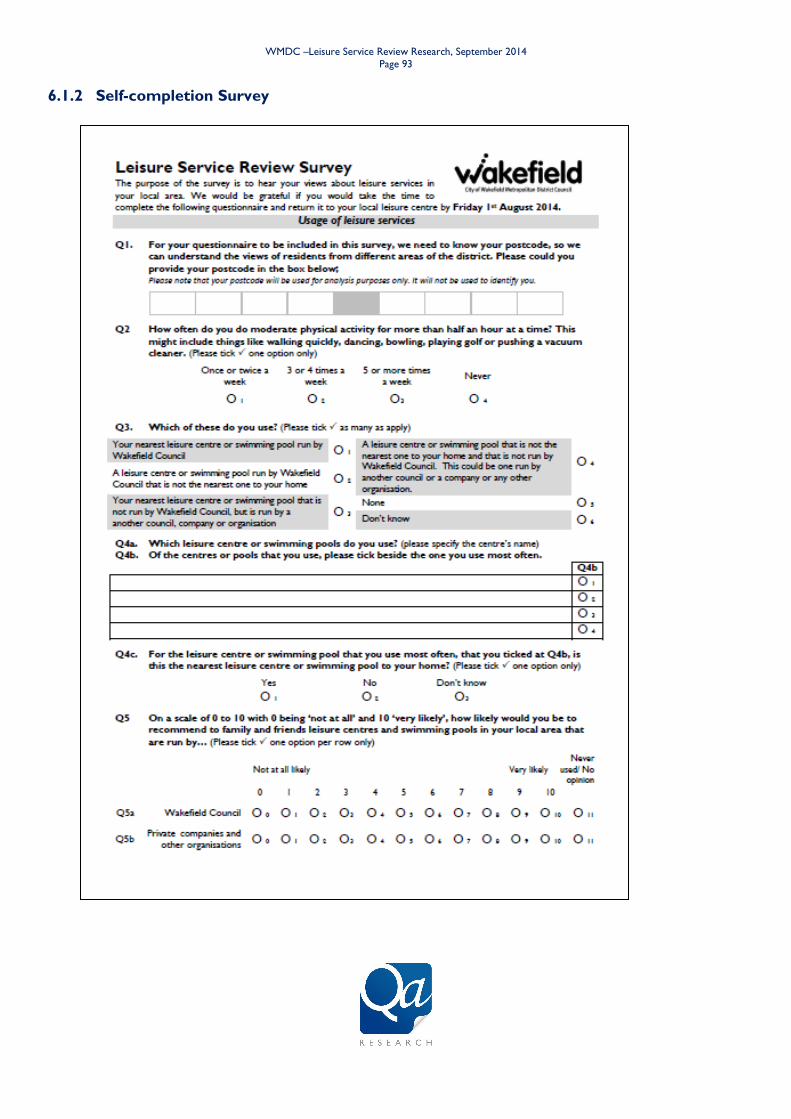
WMDC –Leisure Service Review Research, September 2014
Page 93
6.1.2 Self-completion Survey
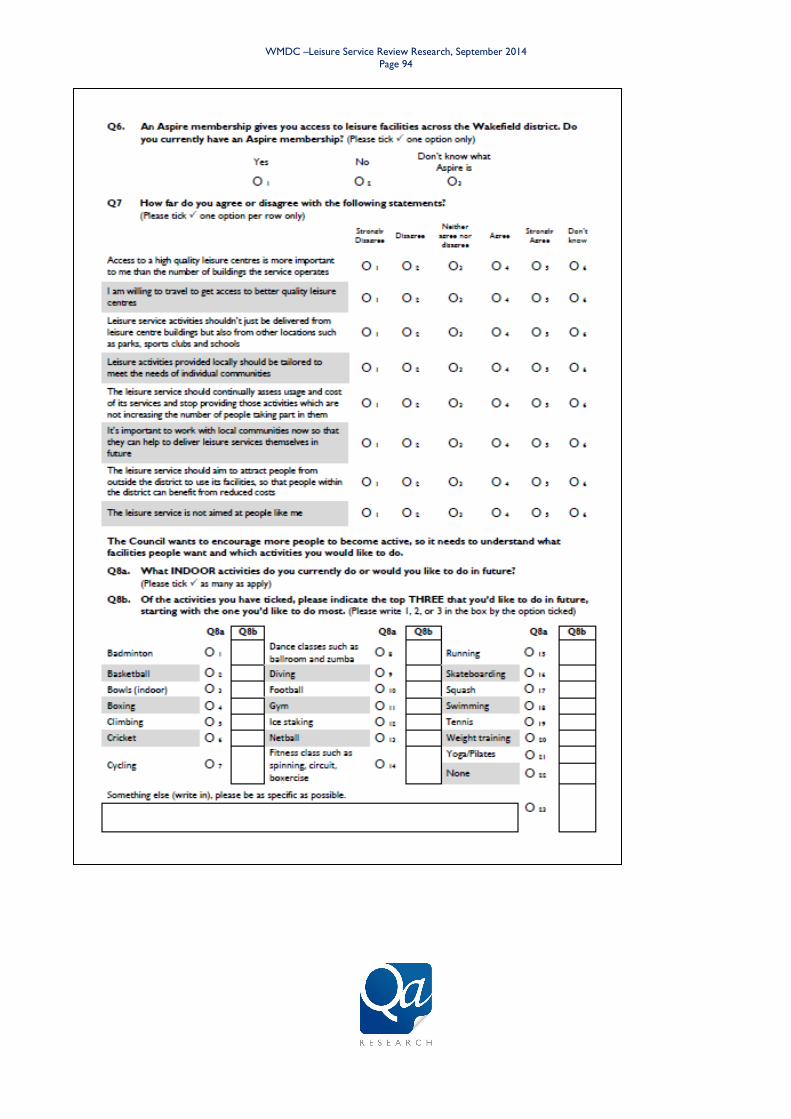
WMDC –Leisure Service Review Research, September 2014
Page 94
WMDC –Leisure Service Review Research, September 2014
Page 95
WMDC –Leisure Service Review Research, September 2014
Page 96