LEICESTER & LEICESTERSHIRE ECONOMIC ASSESSMENT SUMMARY · LEICESTER & LEICESTERSHIRE ECONOMIC...
85
Leicester and Leicestershire Economic Assessment 1 Summary LEICESTER & LEICESTERSHIRE ECONOMIC ASSESSMENT SUMMARY 2011
Transcript of LEICESTER & LEICESTERSHIRE ECONOMIC ASSESSMENT SUMMARY · LEICESTER & LEICESTERSHIRE ECONOMIC...

Leicester and Leicestershire Economic Assessment 1 Summary
LEICESTER & LEICESTERSHIRE ECONOMIC ASSESSMENT
SUMMARY
2011

Leicester and Leicestershire Economic Assessment 2 Summary
Leicester and Leicestershire Economic Assessment Summary
Table of Contents
Section
Subject Page
1 Introduction
3 - 8
2 Demography
9 - 10
3 Business and Enterprise
11 - 25
4 Employment and Skills
26- 33
5 Economic Exclusion and Worklessness
34 - 36
6 Housing
37 - 44
7 Employment Land and Premises
45 - 49
8 Transport
50 - 54
9 Environment
55 - 59
10 Rural
60 - 64
11 Summary Conclusions Key Economic Statistics Summary
65 - 85

Leicester and Leicestershire Economic Assessment 3 Summary
1 Introduction 1.1 This document is a stand-alone summary of the detailed Local Economic
Assessment (LEA) for Leicester and Leicestershire.
Introduction to the Economic Assessment 1.2 The LEA refresh has been developed in the context of the Government’s Local
Growth White Paper, published in October 2010. This White Paper announced the first tranche of 24 approved Local Enterprise Partnerships (LEPs) established to “provide the strategic leadership in their areas and set out local economic priorities.”
1.3 Leicester and Leicestershire’s proposal to become a LEP was approved within
this first tranche. This LEA refresh has been undertaken to support the work of the LLEP in its strategic role to identify local economic development priorities. Our objectives were to:
Provide a sound understanding of the economic conditions in the Leicester and Leicestershire sub-region.
Identify the comparative strengths and weaknesses of the local economy and the nature of local economic challenges and opportunities.
Identify the constraints to local economic growth and employment and the risks to delivering sustainable economic growth.
1.4 A ‘virtual’ LEA project team has gathered, analysed and interpreted a vast
amount of evidence over the past few months. This has come from a wide range of sources including national statistics, local statistics and bespoke research studies undertaken within the sub-region. The detailed findings are presented in ten chapters.
1.5 This summary follows the same structure as the full LEA, but with the
addition of a rural section (section ten). Where appropriate, a “Strengths, Weaknesses, Opportunities and Threats” (SWOT) analysis has been included at the end of each themed section. Section 11 summarises the strengths and weaknesses of the local economy in Leicester and Leicestershire and also assesses the opportunities, threats and challenges it faces. The last part of Section 11 uses this work to suggest a set of key strategic priorities that should be pursued in order to develop a more prosperous, productive and sustainable local economy for Leicester and Leicestershire. Key economic statistics are presented, for quick reference, at the end of section 11.
1.6 It should be noted that this summary provides a sub-regional overview and a
more in depth analysis can be found in the full LEA. In particular, the detailed LEA chapters have commentary on local authority district level data and information to help inform strategic planning and decision making at a more local level.

Leicester and Leicestershire Economic Assessment 4 Summary
1.7 The Leicester and Leicestershire sub-region is considered a sensible,
functional economic geography for analysis. The sub-regional boundary matches real economic, labour market, travel-to-work, housing market and retail catchment areas.
Introduction to Leicester and Leicestershire 1.8 Before embarking upon an economic assessment of the area, this section
describes our sub-region from a “place” perspective. 1.9 Leicester is one of the most culturally diverse cities in the UK, whilst
Leicestershire County is renowned for its quality of life. The two combine to create an area that is popular with residents, visitors, businesses, shoppers and students alike.
1.10 Just under one million people live in the Leicester and Leicestershire sub-
region, with about a third living within the Leicester City boundary. The area has a wide variety of property types and tenures available at a range of prices. Overall, house prices are sufficiently high to contribute to economic buoyancy, and relatively affordable compared to household income and many other areas of the country.
1.11 Leicestershire County comprises seven local authority districts: Blaby,
Charnwood, Harborough, Hinckley & Bosworth, Melton, North West Leicestershire and Oadby & Wigston. Some of the key settlements within the County include Blaby in Blaby district, Loughborough and Shepshed in Charnwood, Hinckley and Earl Shilton in Hinckley & Bosworth District, Market Harborough and Lutterworth in Harborough District, Coalville and Ashby-de-la-Zouch in North West Leicestershire, Melton Mowbray in Melton, and Oadby, Wigston and South Wigston in Oadby & Wigston District.
1.12 A major regeneration programme in Leicester City has physically transformed
the urban landscape in the city centre, with iconic new developments including Curve, Highcross Leicester and Phoenix Square. Leicestershire County is characterised by beautiful countryside, historic market towns, the emerging National Forest and has benefited from investment in major attractions such as Twycross Zoo.
1.13 Connectivity is one of the key strengths of the sub-region. Leicestershire is
home to East Midlands Airport with its many international links. Leicester is the first city on the mainline rail network north out of London and just four hours from Paris via Eurostar from St. Pancras. The sub-region is also within easy reach of the major UK motorway network.

Leicester and Leicestershire Economic Assessment 5 Summary
1.14 Already a significant economy in the East Midlands, with local GVA in 2008 at £19.2 billion1, the area has a strong tradition in business and enterprise. It is home to major brands including Next, Walkers, Triumph, Caterpillar, Samworth Brothers, Wal-Mart, DHL and 3M.
1.15 Over 50,000 students (including both full-time and part-time) study at the
three excellent universities in the City and County – University of Leicester, De Montfort University and Loughborough University. The area also has strong Further Education Colleges providing a wide range of academic and vocational training.
1.16 According to the latest research2, annual visitor numbers to the City and
County now stand at 31.8 million, with the visitor economy in Leicester and Leicestershire growing to £1.31 billion. These figures are split across both the leisure and business tourism sectors.
History and Heritage 1.17 The area has strong history and heritage with attractions including the Jewry
Wall Museum in Leicester, Bosworth Battlefield, Belvoir Castle and Ashby-de-la-Zouch Castle.
1.18 Leicestershire has significant links with the history of transport.
Loughborough houses the only double-track mainline heritage railway at Great Central Railway, the modern-day jet engine was developed by Sir Frank Whittle in Lutterworth, and the Donington Grand Prix Exhibition is the largest collection of Grand Prix racing cars in the world.
1.19 The area’s industrial heritage is also represented at local museums including
Abbey Pumping Station in Leicester and Snibston Discovery Park in Coalville.
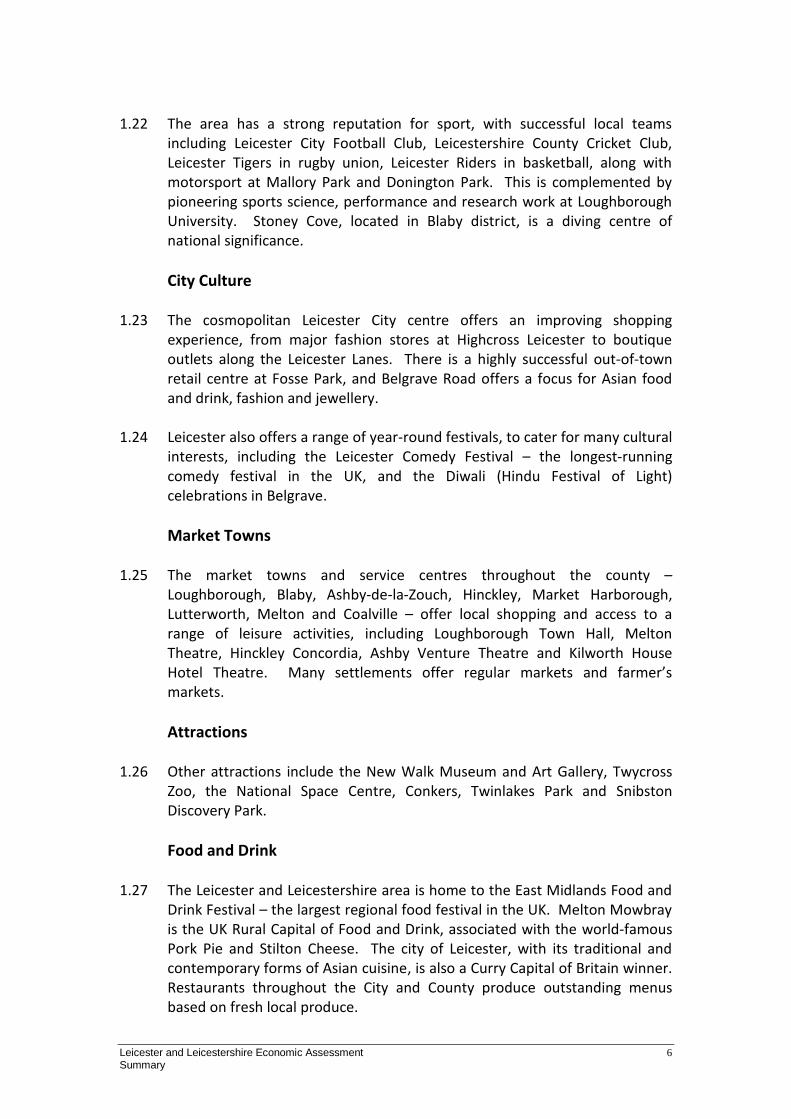
Outdoor Pursuits 1.20 The National Forest in North West Leicestershire spans 200 square miles,
across three counties. It is one of the country's boldest environmental projects and, already, more than seven million trees have been planted. The County offers a range of country parks including Bradgate Park, Charnwood Forest and Beacon Hill.
1.21 The waterways network in the City and County is set to undergo a major
development following the launch of the River Soar and Grand Union Canal Strategy in 2009. This offers a significant opportunity to enhance the social and economic well-being of both City and County residents.
1 GVA = Gross Value Added (GVA) is the principal measure of the total value of goods and services
that a geographical area produces. GVA is an important indicator of the overall health of a local
economy. It is calculated by summing the incomes generated in the production process. 2 STEAM model – via http://tourism.goleicestershire.com/
Leicester and Leicestershire Economic Assessment 6 Summary
1.22 The area has a strong reputation for sport, with successful local teams
including Leicester City Football Club, Leicestershire County Cricket Club, Leicester Tigers in rugby union, Leicester Riders in basketball, along with motorsport at Mallory Park and Donington Park. This is complemented by pioneering sports science, performance and research work at Loughborough University. Stoney Cove, located in Blaby district, is a diving centre of national significance.
City Culture 1.23 The cosmopolitan Leicester City centre offers an improving shopping
experience, from major fashion stores at Highcross Leicester to boutique outlets along the Leicester Lanes. There is a highly successful out-of-town retail centre at Fosse Park, and Belgrave Road offers a focus for Asian food and drink, fashion and jewellery.
1.24 Leicester also offers a range of year-round festivals, to cater for many cultural
interests, including the Leicester Comedy Festival – the longest-running comedy festival in the UK, and the Diwali (Hindu Festival of Light) celebrations in Belgrave.
Market Towns 1.25 The market towns and service centres throughout the county –
Loughborough, Blaby, Ashby-de-la-Zouch, Hinckley, Market Harborough, Lutterworth, Melton and Coalville – offer local shopping and access to a range of leisure activities, including Loughborough Town Hall, Melton Theatre, Hinckley Concordia, Ashby Venture Theatre and Kilworth House Hotel Theatre. Many settlements offer regular markets and farmer’s markets.
Attractions 1.26 Other attractions include the New Walk Museum and Art Gallery, Twycross
Zoo, the National Space Centre, Conkers, Twinlakes Park and Snibston Discovery Park.
Food and Drink 1.27 The Leicester and Leicestershire area is home to the East Midlands Food and
Drink Festival – the largest regional food festival in the UK. Melton Mowbray is the UK Rural Capital of Food and Drink, associated with the world-famous Pork Pie and Stilton Cheese. The city of Leicester, with its traditional and contemporary forms of Asian cuisine, is also a Curry Capital of Britain winner. Restaurants throughout the City and County produce outstanding menus based on fresh local produce.

Leicester and Leicestershire Economic Assessment 7 Summary
Challenges 1.28 Like many areas of the country, the sub-region is also facing significant
challenges. The One Leicester Strategy acknowledges that poverty is the root cause of many of the difficulties facing some City residents and that too many people are disadvantaged through poor health. Average male-resident earnings in Leicester are low compared to other cities. Furthermore, one in five City residents are claiming benefits and 23% are without formal qualifications3. The 2009 Index of Multiple Deprivation suggests that Leicester is the 25th most deprived local authority in the country. Although the County is generally more affluent, five of its neighbourhoods fall within the 20% most deprived nationally and there are pockets of relatively high unemployment.
1.29 Although the local economy is quite diverse and not overly dependent on any
one sector or employer, this assessment will identify the importance of further developing the knowledge economy so that the area continues to prosper and can be competitive in the global market place in the future. In the short-term, the local economy is vulnerable to public sector job cuts which could lead to increased unemployment. Local businesses have already expressed concern about falling consumer confidence and the potential loss of business from the public sector at a time when fuel, energy and operating costs are on the increase. The lack of access to super fast broadband could inhibit economic growth in the more remote rural areas of Leicestershire. It will be important for local partners to create the right conditions for business growth and private sector job growth to compensate for job losses in the public sector.
Opinions about Leicester and Leicestershire
1.30 The Place Survey4 asked residents to express the level of their overall/general satisfaction with the local area. 85% of Leicestershire County residents and 72% of Leicester City residents indicated that they were satisfied or very satisfied with their local area. This compares to a national figure of 80%. In terms of social cohesion, 76% of Leicester residents agreed that people from different backgrounds got on well together in their local area, which is an important indicator for a multi-cultural city. This compares to a national figure of 76% and a Leicestershire County figure of 82%.
1.31 44% of City-based businesses and 53% of County-based businesses rated the
sub-region as a good place to do business.5 About a third rated it as average
3 Annual Population Survey 2009
4 The Place Survey was carried out across all UK local authority districts in the Autumn of 2008, the
Coalition Government has decided to discontinue this survey 5 Leicester and Leicestershire Business Survey 2009

Leicester and Leicestershire Economic Assessment 8 Summary
and several did not express an opinion. Very few local businesses considered the area to be “not good for business”.
Arrangements for Updates 1.32 The evidence base will be updated annually in terms of the key statistics. The
next full refresh of the LEA is planned to take place in 2013. 1.33 Key statistics about the local economy are presented at the end of section 11.

Leicester and Leicestershire Economic Assessment 9 Summary
2 Demography 2.1 The estimated resident population of the sub-region is about 950,000. for
mid-2009 (National Statistics June 2010), with about one third of the population living within the Leicester City boundary. The estimated population age structure showed 63% are of working age, 19% aged 0-15, 19% of state pension age, similar in proportion to England, but with considerable variation across the sub-region. Leicester City and Charnwood areas have higher proportions (65%) in the working age group, influenced in part by the presence of nearly 40,000 full-time university students in Leicester and Loughborough.
2.2 The revised population estimates show a 6% increase in the sub-region’s
population from 2001 to 2009. The estimated increase for Leicester City is higher at 8%, and this is much larger than in earlier estimates.
2.3 Leicester City has a very different population structure to that of
Leicestershire in many ways – age structure, ethnic composition, household composition, economic activity. There is also considerable variation across the districts of Leicestershire in population size and age distribution.
2.4 Cultural diversity is a distinctive feature of the local economy. For the 2006
resident population, 20% was estimated to be from non White British ethnic groups (42% in Leicester City and 10% in Leicestershire). The largest group within this was 95,200 (10%) of Indian ethnic origin (25% of the Leicester City population and 4% of the Leicestershire County population).
2.5 Nearly half the population of the sub-region live in the ‘urban’ area of
Leicester, and nearly a quarter live in ‘urban’ areas in the remainder of Leicestershire around Loughborough/Shepshed, Hinckley, Coalville, Melton Mowbray, Market Harborough and Ashby-de-la-Zouch. About one third of the Leicestershire County population live in rural areas defined as ‘Town and Fringe’ or ‘Village’ areas. Only 2% of the Leicestershire population live in the most rural ‘Hamlet and Isolated Dwelling’ areas.
2.6 For the working age group (16-64 male/16-59 female) the ONS 2008-based
figures project an increase from 2008 to 2021 of 30,000 (5%), including a projected increase of nearly 15,000 (24%) in Leicester City. With changing economic circumstances, the projected increases in the working age population, especially those aged below 40, are subject to the greatest uncertainty.
2.7 There is a substantial projected increase in the numbers of older people in
the sub-region, due to improved life expectancy, in line with long-term trends. There is a projected increase from 2008 to 2021 in the older people age group of over 53,000 (31%). Leicester City has a high ratio of working age
Leicester and Leicestershire Economic Assessment 10 Summary
people to those of pensionable age and a projected increase in this ratio. This is in contract to the situation seen in Leicestershire districts and in the UK as a whole.
2.8 The projected increase in the younger population is mainly influenced by
projections using recent increase in birth rates and in people that fall within family-forming age groups. Recent work-related migration has also contributed to this.
2.9 The most recent evidence on overseas migrant workers and students suggest
these groups are still arriving and impacting on the local economy. Many are European, especially Polish, but there are also significant inflows from India and from a diverse range of countries.
2.10 Student numbers have increased up to 2010 and were 53,500 in 2008/9
(including both full-time and part-time students). Future student populations may be affected by future changes in funding and overseas migration policy.

Leicester and Leicestershire Economic Assessment 11 Summary
3 Business and Enterprise
Productivity and Investment 3.1 In 2008, total Gross Value Added (GVA)6 in the Leicester and Leicestershire
sub-region was £19.2billion. Between 1995 and 2008, the total GVA increased at an average nominal rate of 5.4% per year in Leicestershire County and 4.1% in Leicester City. This is less than the average rate for England of 5.5%. Leicester City’s GVA growth has been consistently below that seen for England, whereas Leicestershire County’s GVA growth has been more volatile over the same time period (figure 3.1).
Figure 3.1 GVA Growth Rates Year on Year, 1995 to 2008
0
1
2
3
4
5
6
7
8
9
1996 1997 1998 1999 2000 2001 2002 2003 2004 2005 2006 2007 2008
% G
row
th
Leicester City Leicestershire England
Source: ONS Nuts 3 Statistics
* Note: Leicestershire includes Rutland
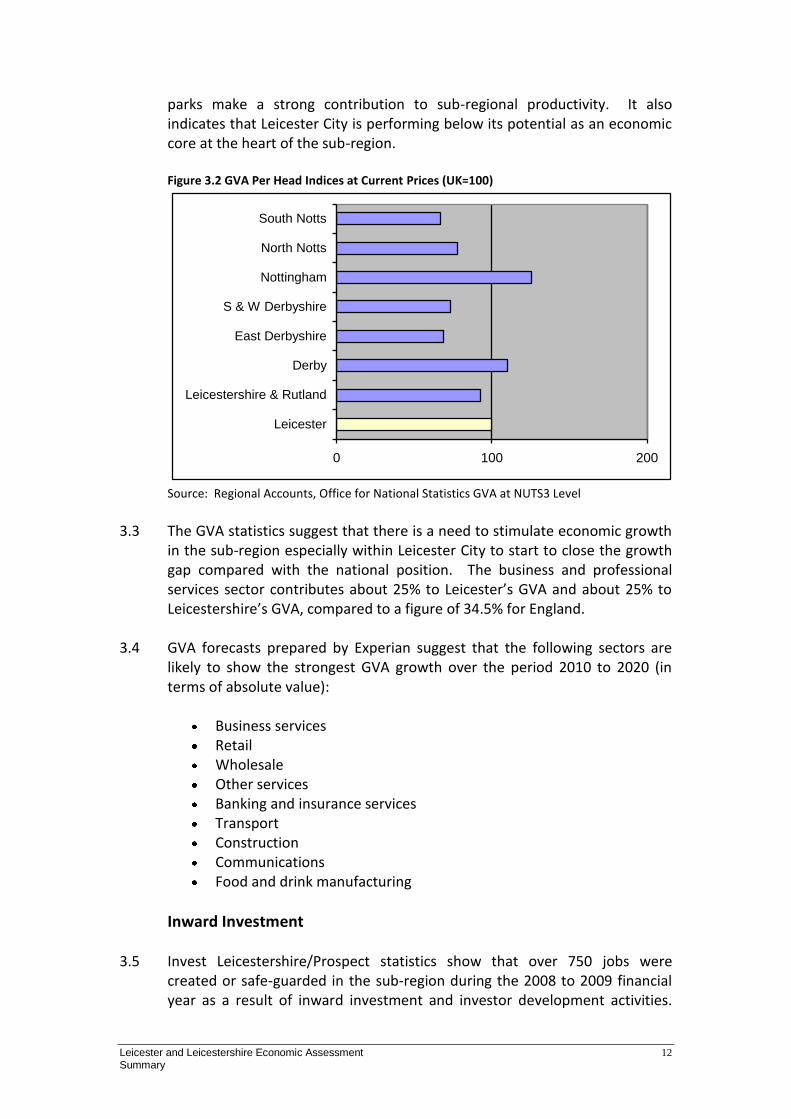
3.2 Productivity, understood as output per head of the local population, is an
important indicator of the overall health and wealth of an economy. In 2008, the GVA per head for Leicester was £20,483 which is lower than the figure for England (£21,049) and higher than the Leicestershire figure of £19,104. However, cities generally show higher GVA per head than surrounding rural areas as they provide a focus or core for economic activity to take place. Figure 3.2 shows GVA per head indices at current prices (indexed to the UK=100). This shows that Leicester’s GVA per head is below that seen in Nottingham and Derby. Also the difference in productivity between Leicester and Leicestershire is less marked than is the case with Nottingham City and Nottinghamshire and Derby City and Derbyshire. This suggests that Leicestershire’s market towns and the rural economy, as well as economic activity concentrated within Leicestershire County’s science and business
6 GVA = Gross Value Added (GVA) is the principal measure of the total value of goods and services
that a geographical area produces. GVA is an important indicator of the overall health of a local
economy. It is calculated by summing the incomes generated in the production process.
Leicester and Leicestershire Economic Assessment 12 Summary
parks make a strong contribution to sub-regional productivity. It also indicates that Leicester City is performing below its potential as an economic core at the heart of the sub-region.
Figure 3.2 GVA Per Head Indices at Current Prices (UK=100)
0 100 200
Leicester
Leicestershire & Rutland
Derby
East Derbyshire
S & W Derbyshire
Nottingham
North Notts
South Notts
Source: Regional Accounts, Office for National Statistics GVA at NUTS3 Level
3.3 The GVA statistics suggest that there is a need to stimulate economic growth
in the sub-region especially within Leicester City to start to close the growth gap compared with the national position. The business and professional services sector contributes about 25% to Leicester’s GVA and about 25% to Leicestershire’s GVA, compared to a figure of 34.5% for England.
3.4 GVA forecasts prepared by Experian suggest that the following sectors are
likely to show the strongest GVA growth over the period 2010 to 2020 (in terms of absolute value):
Business services Retail Wholesale Other services Banking and insurance services Transport Construction Communications Food and drink manufacturing
Inward Investment 3.5 Invest Leicestershire/Prospect statistics show that over 750 jobs were
created or safe-guarded in the sub-region during the 2008 to 2009 financial year as a result of inward investment and investor development activities.

Leicester and Leicestershire Economic Assessment 13 Summary
Combined figures for EMB and Invest Leicestershire/Prospect for the financial year 2009 to 2010 show that almost 800 jobs were either created or safe-guarded (through inward investment and investor development activities). The new jobs cover a range of sectors (including some new knowledge-based businesses). However, there figures need to be seen in the context of the 421,000 jobs in the local economy. Although it is important to attract new investment to the sub-region, these figures highlight the importance of retaining and supporting indigenous businesses. The Investor Development function provides a key service working to retain the large employers in the sub-region. Although only 0.6% of businesses employ more than 250 people, these key companies account for over 30% of local employment.7
Innovation 3.6 The area has a significant competitive advantage in terms of its three
excellent universities (De Montfort University, Loughborough University and the University of Leicester) and a strong Further Education (FE) sector. This offers the opportunity to promote a culture of innovation, facilitating knowledge transfer and improving general business links with universities and FE Colleges. Over the three year period 2008-2011, Leicestershire’s three universities collectively secured around £12 million through the Higher Education Innovation Fund (HEIF) to lead on a range of initiatives aimed at enabling businesses to use their expertise and boost competitiveness. Importantly the emphasis is on facilitating collaboration between universities and business.
3.7 In addition to this, Knowledge Transfer Partnerships (KTPs) help businesses to
improve their competitiveness and productivity through better use of the extensive knowledge, technology and skills that reside within UK universities. Part-funded by Government, and led by the Technology Strategy Board, KTP projects apply the world-leading knowledge and expertise of academics to business critical projects. Currently, at March 2011, the three Leicestershire universities are engaged with business and other organisations in 18 KTPs.
3.8 The three universities within Leicestershire also work collectively with the
other universities across the East Midlands in a number of areas to support innovation and economic growth. This includes a graduate internships programme supporting local businesses, predominantly SMEs and an enterprise programme offering mentoring, funds and training to graduates and the alumni community to encourage new business start up.
3.9 Collectively, the three local universities recognise the ‘Three Universities for
Business’ initiative which brings together the universities to showcase the specialist services and expertise available to local and regional businesses.
7 ABI 2009

Leicester and Leicestershire Economic Assessment 14 Summary
3.10 In particular, the universities have expertise in the following areas, providing opportunities for high technology business start-ups and competitive high growth businesses:
Space-related research & technologies, Creative & design, Digital/knowledge-based technology, Green technologies, Transport technologies, Bio-medical & health care science and technology, Sports research & technology
Sector Structure 3.11 The local economy is diverse and the area is not overly dependent on any one
sector or large employer. This helps to protect local economies in times of recession. The local economy has undergone a significant re-structuring over the last 20-30 years, with substantial losses of manufacturing jobs and growth in service sector employment. Some 20,000 manufacturing jobs have gone from Leicester City and 23,500 from Leicestershire County in the last decade. Nevertheless, the relatively high proportion of manufacturing employment (14% in the sub-region compared to 9% nationally) remains a key feature of the local economy and differentiates the sub-region from other areas of the country. Food and drink manufacturing has become increasingly important to the sub-regional economy, now accounting for approximately 16% of manufacturing jobs. There is some local specialisation in high technology manufacturing in Charnwood and the new science parks in Leicester and Loughborough will offer opportunities to strengthen high technology manufacturing in the area. Supporting high technology sectors will enable the sub-region to take advantage of the potential links with local universities.
3.12 Service sector employment has grown over the last decade and is projected to continue to grow. Significant sectors include logistics and transport, associated with the sub-region’s central location and communication links. The retail sector has also grown in importance, with major retail centres at Highcross Leicester, Fosse Park, Loughborough and in the other vibrant market towns. In 2012, Marks and Spencer will open their major e-commerce distribution centre on the East Midlands Distribution Centre site in Castle Donington, employing hundreds of people.
3.13 The area has less employment in the financial and business services sectors
compared to national figures. These sectors are projected to grow and it could be important for the local economy to attract some new investment in these areas. The business services sector covers a wide range of businesses including professional services, cultural and creative industries and could potentially offer a wider range of opportunities for graduates.

Leicester and Leicestershire Economic Assessment 15 Summary
3.14 Tourism currently accounts for 7% of all employment in the sub-region, with
some high-profile attractions such as Curve and the National Space Centre in Leicester, and Twycross Zoo and the National Forest in Leicestershire. There is potential to further develop tourism, with requisite investment in the sub-region as appropriate, including investment in the inland waterways and other attractions. Examples of development could include short breaks, holidays, business tourism and themed activities and events.
3.15 The high proportion of public sector related employment in Leicester City
(one in three jobs in the public administration, education, health and social work sectors) is a significant concern in the light of significant cuts in public expenditure.
Table 3.1 Share of Employment by Sector, 2009
Industry
Leicester City
Leicestershire County
Leicester & Leicestershire LEP
Area
England
Manufacturing 13% 14% 14% 9%
Electricity, gas, water 3% 2% 2% 1%
Construction 3% 5% 4% 5%
Wholesale & Retail 15% 19% 17% 16%
Transport & Storage 2% 7% 5% 5%
Accommodation & food 4% 6% 5% 7%
Information & communication 2% 2% 2% 4%
Financial & insurance 3% 2% 2% 4%
Real estate 2% 2% 2% 2%
Professional, scientific and technical services
5% 7% 7% 7%
Business admin/ support services 9% 7% 8% 8%
Public admin & defence 7% 4% 5% 5%
Education 12% 10% 10% 10%
Human health & social work 17% 7% 11% 13%
Arts, entertainment & recreation 2% 3% 2% 2%
Other services 2% 2% 2% 2% Source: BRES, ONS Crown Copyright Reserved (from nomis on 5th January2011)
3.16 Districts in Leicestershire with high dependency on public sector related
employment include Blaby, Charnwood and Oadby & Wigston.
3.17 ONS have recently produced more accurate estimates of private and public sector job growth, which take a narrower definition of the public sector than previous figures issued. These statistics show that Leicester experienced a net loss of 500 private sector jobs over the period 2003 to 2008 (-0.4%) and as such is in the worst performing quintile in Great Britain in terms of private sector job growth. Over the same time period, Leicester experienced an increase of around 2,000 public sector jobs. Taking this new definition of public sector employment, 24.3% of Leicester’s jobs are in the public sector and the city is ranked 115th out of 408 in terms of public sector employment dependency. Taking these two factors together, a relatively strong case can be made for the need to rebalance the Leicester city economy.

Leicester and Leicestershire Economic Assessment 16 Summary
3.18 In terms of the districts within Leicestershire, Blaby has a relatively high share of public sector employment at 21.3%, mainly due to the location of Leicestershire County Council offices. Blaby has also seen the strongest private sector job growth in the country over the period 2003 to 2008, this is influenced by the development of Grove Park. Charnwood has a high proportion of employment in the education sector and is set to lose up to 1300 private sector jobs with the closure of Astra Zeneca. Hinckley & Bosworth has experienced modest private sector job growth (only 0.9%) over the period 2003 to 2008, but opportunities around the MIRA expansion with associated high technology jobs could bring a welcome boost to the local economy.
Knowledge Economy
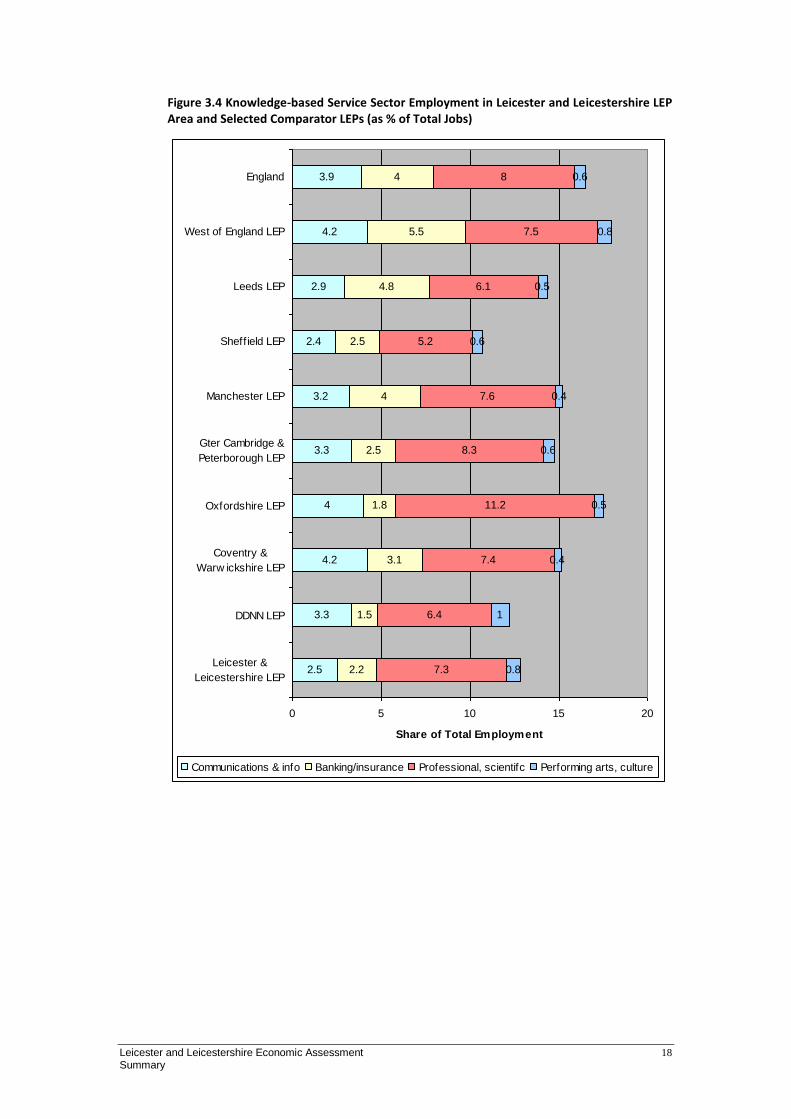
3.19 The detailed Business and Enterprise chapter presents several graphs and
statistics on the knowledge economy, comparing Leicester with other cities and the Leicester and Leicestershire LEP area with other LEP areas. This shows that:
Leicester City has a relatively low share of knowledge based employment compared to many other cities
Leicester City’s knowledge-based service sector is under-developed compared to many other cities (see figure 3.3)
The Leicester and Leicestershire LEP area has a relatively low share of knowledge-based employed compared to similar and ‘aspirational’ LEP areas. This is especially true for knowledge-based service sector employment (see figure 3.4).

Leicester and Leicestershire Economic Assessment 17 Summary
Figure 3.3 Knowledge Based Service Sector Employment in Leicester and Comparator Cities (as % of Total Jobs)
2.8
2.9
4.3
2.4
3.7
3.5
3.1
3.9
12.2
3
4.1
3.5
3.9
2.7
2.1
2.4
3
4.4
4.5
4.3
8.3
5.9
5.9
6.6
7.4
4
6.1
7.2
6.9
6.9
5.5
10.5
6
9
9.4
7.1
8.6
11.2
8
0.9
0.7
1.4
0.8
0.3
0.7
0.6
1.1
0.7
0.4
0.7
0.6
0.6
0 5 10 15 20 25 30
Leicester
Derby
Nottingham
Northampton
Coventry
New castle
Sheffield
Bristol
Reading
Birmingham
Leeds
Manchester
England
Share of Total Employment
Communications & info Banking/insurance Professional, scientifc Performing arts, culture
Leicester and Leicestershire Economic Assessment 18 Summary
Figure 3.4 Knowledge-based Service Sector Employment in Leicester and Leicestershire LEP Area and Selected Comparator LEPs (as % of Total Jobs)
2.5
3.3
4.2
4
3.3
3.2
2.4
2.9
4.2
3.9
2.2
1.5
3.1
1.8
2.5
4
2.5
4.8
5.5
4
7.3
6.4
7.4
11.2
8.3
7.6
5.2
6.1
7.5
8
0.8
1
0.4
0.5
0.6
0.4
0.6
0.5
0.8
0.6
0 5 10 15 20
Leicester &
Leicestershire LEP
DDNN LEP
Coventry &
Warw ickshire LEP
Oxfordshire LEP
Gter Cambridge &
Peterborough LEP
Manchester LEP
Sheffield LEP
Leeds LEP
West of England LEP
England
Share of Total Employment
Communications & info Banking/insurance Professional, scientifc Performing arts, culture

Leicester and Leicestershire Economic Assessment 19 Summary
Business Structure 3.20 Small businesses are extremely important to the local economy. 83% of
businesses employ less than 10 people and 96% of local businesses employ less than 50 people (similar to national picture as shown in table 3.2). This has significant implications for the provision of business support and communicating with businesses. Although only 0.6% of businesses employ over 250 people, these businesses account for 30% of local employment.
Table 3.2: Business Size in Leicester and Leicestershire 2009 Proportion of Business Units in Each Size Band
Size Leicester Leicestershire Leicester & Leicestershire England
0 to 9 78.7% 84.1% 82.6% 83.2%
10 to 19 10.0% 7.7% 8.3% 8.1%
20 to 49 6.5% 4.9% 5.3% 5.4%
50 to 99 2.6% 1.8% 2.0% 1.9%
100+ 2.2% 1.5% 1.7% 1.5%
Source: UK Business, Activity Size and Location from Office for National Statistics (ONS)
3.21 According to the 2009 IDBR8, there were 32,910 VAT-registered and PAYE
registered enterprises9 in the sub-region. The sectors with the highest number of business units were:
Wholesale and retail (20% of business units)
Construction (12.5% of business units)
Professional, scientific and technical services (12%) 3.22 Only 10% of business units are in the “production” or manufacturing sector.
However, these businesses tend to be larger in size and account for 14% of employment. Conversely, although 12.5% of business units fall into the construction sector, because many of these businesses are smaller in size, the sector accounts for around 4% of employment.
Enterprise 3.23 Self employment is a good indicator of enterprise and early start-up activity.
Leicestershire County exhibits a higher rate of self employment at 9.9% compared to Leicester City (6%), giving an overall sub-regional rate of 8.6% (similar to the national rate of 9%). At a district level, high self employment rates can be seen in North West Leicestershire (11.9%), Melton (13.6%) and
8 Inter Departmental Business Register
9 This figure counts enterprises rather than business units, so businesses with more than one site in the
sub-region only count once, whereas in some databases each unit is counted resulting in a higher
estimate of business – around 39,000

Leicester and Leicestershire Economic Assessment 20 Summary
Harborough (10.5%). The lowest self employment rates are found in Leicester and Blaby.
3.24 Another useful indicator is the business registration rate.10 All areas of the
sub-region and Great Britain have experienced a fall in the business registration rate between 2008 and 2009. Leicester and Leicestershire rates were both slightly below the national level in both 2008 and 2009. Harborough District stands out as having a particularly high business registration rate at 57.3 compared to the Great Britain figure of 47.5. Self-employment levels are also high in Harborough.
3.25 Three-year business survival rates are low in Leicester City but better in the
surrounding County. Recent research into business survival, suggests that a relatively high proportion of Leicester City’s start-ups are in sectors that tend to have higher than average failure rates (based on national data) – such as the hospitality and retail sectors.
3.26 Research by EMB Ltd. amongst the owner/managers of recent start-up
businesses suggested that 40% of respondents had chosen to start their business in a sector that was unrelated to their previous employment. Where a business starts to trade in a new sector, this could be considered a higher risk venture than one where the owner/manager has prior experience of the sector. Furthermore, only 38% of the owner/managers had conducted any market research prior to starting their business, so are unlikely to have fully assessed competition, threats and opportunities.
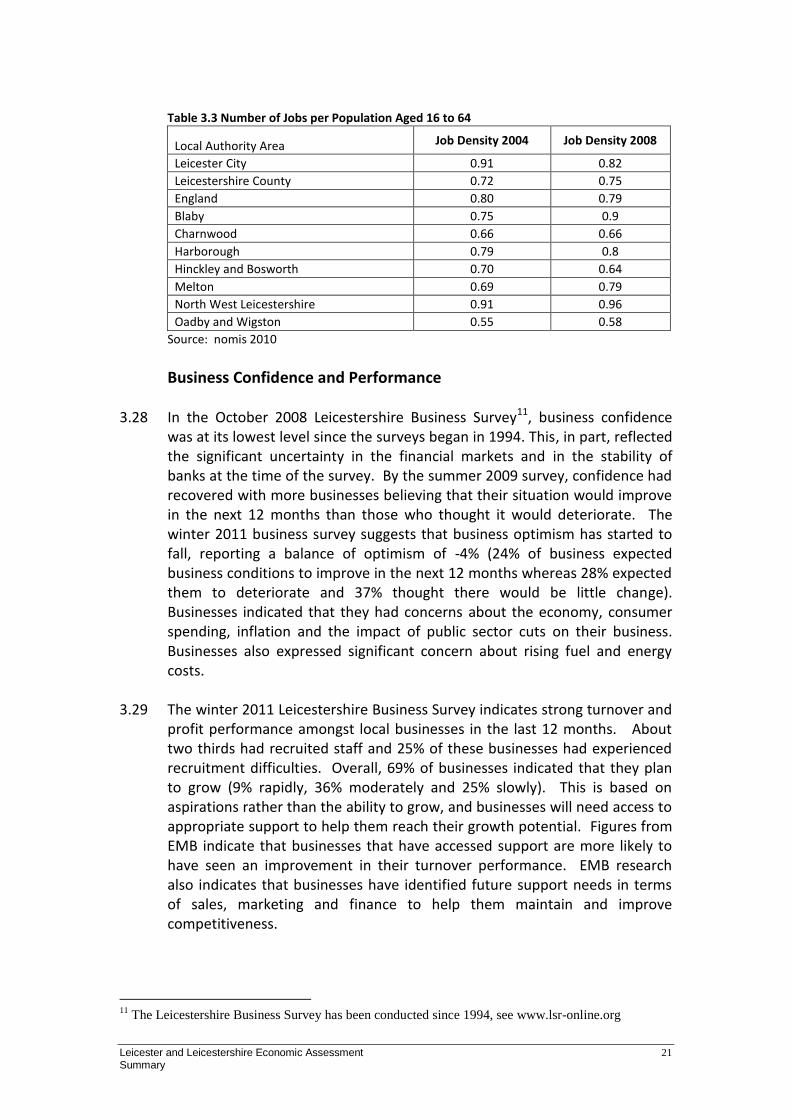
Job Density
3.27 Another useful indicator is job density which is shown in table 3.3. This shows the number of jobs per head of population aged 16 to 64. In particular, Charnwood and Melton have low job densities when compared to England as a whole. The future location of employment sites closer to housing could help to redress this uneven picture across the sub-region.
10
Business Registration Rate is the number of VAT and PAYE registered for the first time divided by
the local population (per 10,000 aged 16+)
Leicester and Leicestershire Economic Assessment 21 Summary
Table 3.3 Number of Jobs per Population Aged 16 to 64
Local Authority Area Job Density 2004 Job Density 2008
Leicester City 0.91 0.82
Leicestershire County 0.72 0.75
England 0.80 0.79
Blaby 0.75 0.9
Charnwood 0.66 0.66
Harborough 0.79 0.8
Hinckley and Bosworth 0.70 0.64
Melton 0.69 0.79
North West Leicestershire 0.91 0.96
Oadby and Wigston 0.55 0.58
Source: nomis 2010
Business Confidence and Performance 3.28 In the October 2008 Leicestershire Business Survey11, business confidence
was at its lowest level since the surveys began in 1994. This, in part, reflected the significant uncertainty in the financial markets and in the stability of banks at the time of the survey. By the summer 2009 survey, confidence had recovered with more businesses believing that their situation would improve in the next 12 months than those who thought it would deteriorate. The winter 2011 business survey suggests that business optimism has started to fall, reporting a balance of optimism of -4% (24% of business expected business conditions to improve in the next 12 months whereas 28% expected them to deteriorate and 37% thought there would be little change). Businesses indicated that they had concerns about the economy, consumer spending, inflation and the impact of public sector cuts on their business. Businesses also expressed significant concern about rising fuel and energy costs.
3.29 The winter 2011 Leicestershire Business Survey indicates strong turnover and
profit performance amongst local businesses in the last 12 months. About two thirds had recruited staff and 25% of these businesses had experienced recruitment difficulties. Overall, 69% of businesses indicated that they plan to grow (9% rapidly, 36% moderately and 25% slowly). This is based on aspirations rather than the ability to grow, and businesses will need access to appropriate support to help them reach their growth potential. Figures from EMB indicate that businesses that have accessed support are more likely to have seen an improvement in their turnover performance. EMB research also indicates that businesses have identified future support needs in terms of sales, marketing and finance to help them maintain and improve competitiveness.
11
The Leicestershire Business Survey has been conducted since 1994, see www.lsr-online.org

Leicester and Leicestershire Economic Assessment 22 Summary
Figure 3.5 Change in Balance of Optimism
-80%
-60%
-40%
-20%
0%
20%
40%
W04/05 S05 W05/06 S06 W06/07 S07 2008 S 09 W09/10 W 11
Overall Manufacturing Services
Note: S=Summer and W=Winter Source: Leicester and Leicestershire Business Survey 2011 Balance of optimism is the difference between the percentage of firms expecting conditions to improve and those expecting conditions to deteriorate
Third Sector and Social Enterprises 3.30 There are over 3,700 third sector organisations in the sub-region12, with the
VAL database recording 2,675 in Leicestershire and 1,058 in Leicester. The less detailed Infolinx, which includes Rutland, has over 5,000 organisations registered. Volunteering makes an important contribution to the local economy, currently estimated to be at least £138M.13
3.31 There are currently an indicative 108 Social Enterprises in Leicester and 37 in
Leicestershire14 (Source Case and VAL data base). This figure is believed to be an underestimate. The LSEDP15 partners are working with potential groups to help them to understand the definition of social enterprise. To this aim the LSEDP members are currently updating their databases to reflect social enterprises as being businesses that meet the following definition:
‘Social enterprises are distinguished by their participatory ownership and management structure and are defined as, `businesses or organisations with primarily social objectives whose surpluses are principally re-invested for that purpose in the business or community, rather than being driven by the need to maximize profit of shareholders and owners.’
3.32 There are high numbers of Third Sector organisations yet comparatively low numbers of social enterprises, which presents considerable scope for growth through business advice, organisational development and support. The larger social enterprises in the Midlands Co-operative Society and John Lewis Partnership are an indication of what is possible.
12
Source Voluntary Action Leicester (VAL) database 13
VAL estimates and using Place Survey data (2010) 14
Source CaSE and VAL databases 15
Leicestershire Social Enterprise Development Partnership

Leicester and Leicestershire Economic Assessment 23 Summary
3.33 The contribution from the Third Sector to the Leicester & Leicestershire economy is both environmental and social in nature and is driven by people’s beliefs, ethics, community ethos and wish to contribute to local and broader society. This may be through the voluntary contribution of their skills and experience or financial donations and co-operative contributions to local democratic activity. The economic gains from new business activity stemming from the Third Sector are considerable as the move continues away from public sector funding of many community and voluntary organisations and towards activities that generate trading income.
Growth Forecasts
3.34 In the current economic climate, with unprecedented reductions in public
expenditure, falling consumer confidence and economic instability in many economies, it is particularly difficult to produce robust economic forecasts. The most recent Scenario Impact Model (SIM) we can access has been developed by Experian working with the East Midlands Development Agency. The SIM suggests that the following sectors are most likely to experience GVA growth in the next 10 years:
Business services Retail Wholesale Other services Banking and insurance services Transport Construction Communications Food and drink manufacturing
3.35 The SIM suggests that the following sectors are likely to experience the
strongest employment growth in the next 10 years:
Retailing Wholesale Transport Business/professional services Health (& related) Hotels and catering Financial services Construction

Leicester and Leicestershire Economic Assessment 24 Summary
3.36 The greatest employment decline is expected in:
Public administration Education Gas, electricity and water
International Trade
3.37 The strong local manufacturing base and logistics sectors provide significant
opportunities for international trade, which could be further developed, as currently, 45%16 of local manufacturers are engaged in export activity. In particular, the existing strong links with China and India could be further developed. This represents a significant opportunity given the rapid expansion of these economies.
3.38 Only 13% of service sector businesses export, again suggesting there is an
opportunity to increase this, especially through growth of knowledge based service sector businesses.
16
Leicester and Leicestershire Business Survey 2009

Leicester and Leicestershire Economic Assessment 25 Summary
3 - Business and Enterprise SWOT
Strengths GVA per head in Leicester City is above regional and
national averages
County market towns and rural economy make a strong contribution to sub-regional GVA
Diverse economic structure that is not overly dependent on any one sector, some local strengths in manufacturing, transport and communications, retail (Highcross/ Fosse Park) & wholesale
Growing service sector employment across a range of industries, with business services making strong contribution to GVA
Strong sales and profit performance indicated in recent business survey
Strong 3-year business survival rates in Leicestershire County
Three world-class universities with a clear strategy to support innovation and business growth
Strong FE sector
Leading science, enterprise and technology parks, such as Loughborough University’s Innovation Centre and MIRA
Strong private sector job growth in some areas of the sub-region, Blaby highest in country over period 2003 to 2008 – also strong in Harborough, NW Leicestershire and Melton
Weaknesses GVA per head in Leicester City is lower than in
Derby and Nottingham
Annual GVA growth in both Leicester City and Leicestershire is below national average
Potential over-reliance on public sector related employment in Leicester City, Blaby, Charnwood and Oadby & Wigston
Low private sector job growth in Leicester City over period 2003 to 2008
Many recent start-up businesses are in sectors that are new to the owner/managers and in sectors with high failure rates such as hospitality and retail
3-year survival rates are low in Leicester City compared to other major cities and to regional and national figures.
Relatively low self-employment levels in Leicester City
Sub-region does not have a strong identity which can make it difficult to attract new investment
Knowledge-based service sector employment still relatively low in Leicester and Leicestershire LEP area
Low proportion of knowledge based enterprises in the sub-region
Opportunities Diverse economy provides resilience and good base
for growth
Significant opportunity to transfer innovation and knowledge from local universities to businesses – especially high technology manufacturing, green technology, transport, design and creative sectors
Local specialism’s in terms of food and drink manufacturing including local brands, ethnic minority foods, snack food manufacturing
Improving retail profile – Highcross and Fosse Park
Strong cultural offer for tourism, destination and inward investment marketing (e.g. Curve, Phoenix Square, Digital Media Centre, Sports Venues)
Ongoing development of National Forest as visitor destination of national significance
Olympics and Paralympics 2012
Infrastructure investment in Leicester, to attract further inward investment to the City and sub-region
Public sector procurement and development of local supply chains
Improve sub-region’s image and identity to attract more business and leisure tourism
Trading links with India and China
Threats Many recent start-ups are in vulnerable sectors
which could impact on business survival rates
Public sector spending will reduce significantly and is likely to impact on consumer confidence and performance of many private businesses that are dependent on the public sector for contracts
Some businesses may become “leaner” and employ less people in future
Low consumer confidence likely to impact on the property sector and some areas of the luxury service and retail sectors
Price could become the overriding criteria in terms of public sector procurement
Closure of some retails outlets in market towns will have a “snowball” effect
Significant decline in public sector resources to provide infrastructure for growth (for both employment land and housing)
Closure of regional Business Link service by November 2011 will limit access to face-to-face business advice

Leicester and Leicestershire Economic Assessment 26 Summary
4 Employment and Skills
Qualifications in the Workforce 4.1 A major challenge is the contrast between the labour market profiles of
Leicester City at the core of the sub-region and the surrounding Leicestershire County area. There is a risk that potential investors might look at the City skills profile alone and reach the conclusion that the area has a low skill, low wage economy. This conclusion would fail to take into account the strength of the labour market in the surrounding County, which is one of the strongest performing areas in the region. Therefore, improving qualification levels amongst City residents is one of the most significant challenges facing the sub-region. Although there has been some improvement, there are still 23% of working age City residents with no recognised qualifications. There are also some pockets of poor performance in the County which are masked in the high-level statistics.
Table 4.1 Summary of Qualification Levels (for the population aged 16 to 64)
Level 4 [1] (%)
Level 3 (%)
Level 2 (%)
Level 1 (%)
No qualification
s (%)
Other qualification
s (%)
Leicester City 22.3 36.8 51.2 64.2 22.8 13.0
Leicestershire County 29.5 53.8 70.3 81.7 11.8 6.5
Leicester & Leicestershire 27.2 48.4 64.2 76.1 15.3 8.6
East Midlands 25.7 47.2 63.9 78.9 13.0 8.1
England 29.6 48.9 65 79 12.1 9.0
Source: Annual Population Survey (APS) 2009
4.2 Degree-level qualifications (Level 4) in the workforce are below national levels for the sub-region as a whole and especially low in Leicester City. In Leicester City over 48% of the workforce (aged 16-64) do not have Level 2 qualifications. Although this is still a high statistic, the situation has improved considerably in recent years. This results from several factors, including the impact of the Train to Gain programme, a strong FE sector, employer investment in training and, to some extent, a higher proportion of those entering the labour market with Level 2 qualifications.

Leicester and Leicestershire Economic Assessment 27 Summary
% of 16 - 64 year olds with Level 4 Qualification
0.0
5.0
10.0
15.0
20.0
25.0
30.0
35.0
40.0
Oxfordshire
City Region
West of
England
Greater
Cambridge and
Greater
Peterborough
Coventry &
Warwickshire
Leeds City
Region
Leicester &
Leicestershire
Greater
Manchester
Nottingham,
Derby
Sheffield City
Region
%
% of 16 - 64 year olds with No Qualifications
0.0
2.0
4.0
6.0
8.0
10.0
12.0
14.0
16.0
18.0
Leicester &
Leicestershire
Coventry &
Warwickshire
Greater
Manchester
Sheffield City
Region
Leeds City
Region
Nottingham,
Derby
Greater
Cambridge and
Greater
Peterborough
West of
England
Oxfordshire
City Region
%

Leicester and Leicestershire Economic Assessment 28 Summary
% of 16 - 64 year olds with Level 4 Qualifications
0.0
10.0
20.0
30.0
40.0
50.0
60.0
70.0
Leicester Manchester Nottingham Coventry Leeds Sheffield Bristol Oxford Cambridge
%
% of 16-24 year olds with No Qualifications
0.0
5.0
10.0
15.0
20.0
25.0
Leicester Manchester Nottingham Coventry Leeds Sheffield Bristol Oxford Cambridge
%
4.3 Understanding the barriers and needs of learners and retraining those
learners in appropriate job opportunities will be important in improving overall qualification levels in the sub-region. The up-skilling of residents, particularly those from the most deprived areas, amongst new communities and those currently out-of-work, is critically important. Only 54% of working age females in Leicester City are currently in employment17. This could suggest a need for more flexible working opportunities, appropriate training and progression opportunities.
17
Research is currently underway to explore barriers to entering the labour market amongst a number
of female groups in Leicester City
Leicester and Leicestershire Economic Assessment 29 Summary
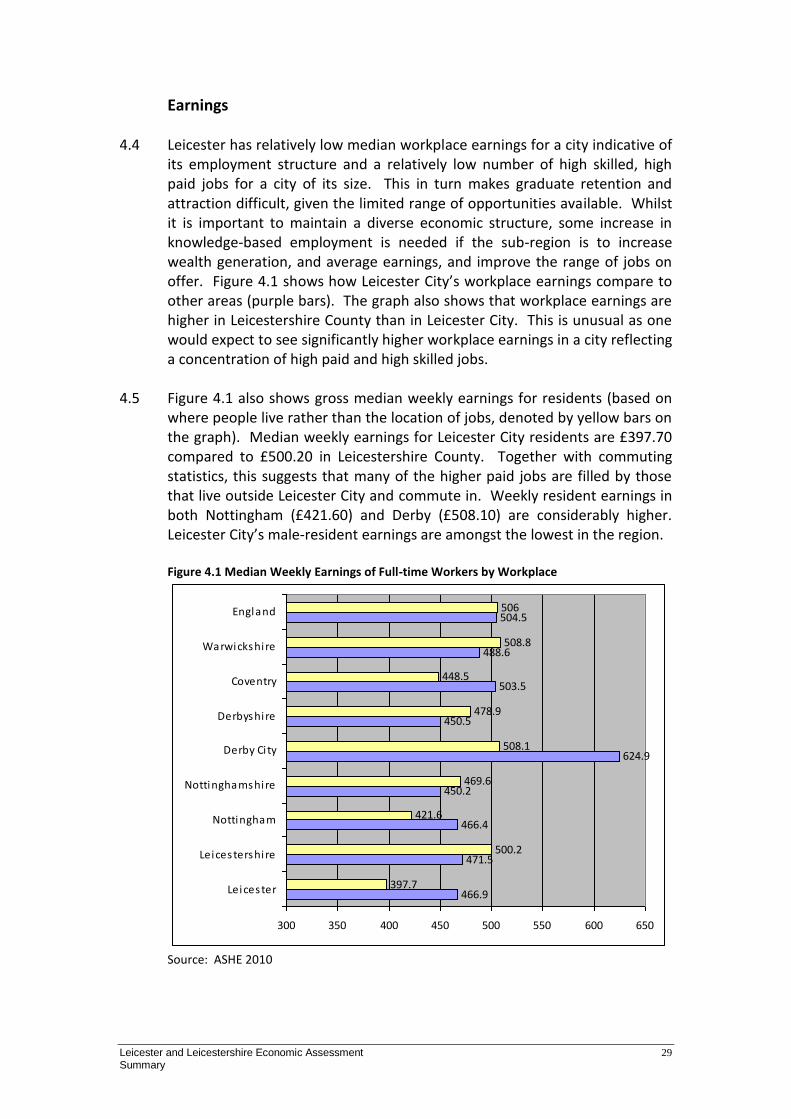
Earnings 4.4 Leicester has relatively low median workplace earnings for a city indicative of
its employment structure and a relatively low number of high skilled, high paid jobs for a city of its size. This in turn makes graduate retention and attraction difficult, given the limited range of opportunities available. Whilst it is important to maintain a diverse economic structure, some increase in knowledge-based employment is needed if the sub-region is to increase wealth generation, and average earnings, and improve the range of jobs on offer. Figure 4.1 shows how Leicester City’s workplace earnings compare to other areas (purple bars). The graph also shows that workplace earnings are higher in Leicestershire County than in Leicester City. This is unusual as one would expect to see significantly higher workplace earnings in a city reflecting a concentration of high paid and high skilled jobs.
4.5 Figure 4.1 also shows gross median weekly earnings for residents (based on
where people live rather than the location of jobs, denoted by yellow bars on the graph). Median weekly earnings for Leicester City residents are £397.70 compared to £500.20 in Leicestershire County. Together with commuting statistics, this suggests that many of the higher paid jobs are filled by those that live outside Leicester City and commute in. Weekly resident earnings in both Nottingham (£421.60) and Derby (£508.10) are considerably higher. Leicester City’s male-resident earnings are amongst the lowest in the region.
Figure 4.1 Median Weekly Earnings of Full-time Workers by Workplace
466.9
471.5
466.4
450.2
624.9
450.5
503.5
488.6
504.5
397.7
500.2
421.6
469.6
508.1
478.9
448.5
508.8
506
300 350 400 450 500 550 600 650
Leicester
Leicestershire
Nottingham
Nottinghamshire
Derby Ci ty
Derbyshire
Coventry
Warwickshire
England
Source: ASHE 2010

Leicester and Leicestershire Economic Assessment 30 Summary
Employment Rates and Occupations 4.6 In June 2010, the employment rate for the sub-region was 69.7%, with a
lower rate of 61% in Leicester City and a higher rate of 73.9% in Leicestershire County (compared to 70.5% nationally). Employment rates have fallen since the last Economic Assessment was published. In terms of occupations, City residents are more likely to be working in elementary occupations or as process, plant and machine operatives than is the case with County residents. There are also relatively high proportions working in health and social welfare. Only 11% of Leicester City resident workers are employed as managers or senior officials compared to a regional average of 16%. This is reflected in the lower wages of City residents noted earlier. A relatively high proportion (17%) of Leicestershire County’s resident workers are working in managerial occupations.18
Figure 4.2 Proportion of Employment by Occupation, Based on Where People Live
0.0
2.0
4.0
6.0
8.0
10.0
12.0
14.0
16.0
18.0
20.0
Managers
and s
enio
r
offic
ials
Pro
fess
ional occupations
Ass
ocia
te p
rof &
tech
occupations
Adm
inis
trative a
nd
secre
tari
al occupations
Skille
d t
rades
occupations
Pers
onal se
rvic
e
occupations
Sale
s and c
ust
om
er
serv
ice o
ccupations
Pro
cess
, pla
nt
and
machin
e o
pera
tives
Ele
menta
ry o
ccupations
Leicester
Leicestershire
East Midlands
England
Source: APS, June 2010
Recruitment Difficulties and Skills Shortages 4.7 Some businesses continue to experience recruitment difficulties, skills
shortages and skills gaps. This is more marked in manufacturing businesses than amongst those in the service sector. 21% of businesses in the 2011 Leicester and Leicestershire Business Survey reported that skills shortages were having a serious impact on their business. However, this has reduced from the much higher figure of 35% in 2005. Over half the businesses surveyed could identify some skills gaps in their current workforce19. This
18
Occupation statistics from APS, June 2010 19
Question asked in 2008 but not 2009

Leicester and Leicestershire Economic Assessment 31 Summary
highlights the importance of local training infrastructure which needs to meet current and future employer needs. There is significant variation by sector in terms of recruitment and skills requirements suggesting the importance of sector-based initiatives and a role for apprenticeships in developing sector-specific skills.
4.8 In the recent Business Survey, 51% of those with recruitment problems
stated that there was a lack of applicants with suitable skills. However, 37% of firms with recruitment difficulties stated that there was a lack of applicants with the right attitude, motivation or personality. Overall, businesses experienced the greatest difficulty recruiting technician and professional associate positions along with skilled craft occupations. In the service sector, businesses reported difficulties recruiting care assistants, sales representatives and sales assistants. Businesses appeared fairly receptive to the concept of apprenticeships, about one third of those planning to recruit would at least consider taking on an apprentice.
4.9 The manufacturing sector employs a high proportion of Leicester City and
BME workers. Although the sector has declined overall, it remains important and there are potential opportunities for growth in high technology manufacturing and food and drink manufacturing.
Educational Attainment 4.10 There has been a significant improvement in the proportion of pupils
achieving five or more GCSEs at grades A*-C (including English and Maths) in both Leicester City and Leicestershire County over the period 2005 to 2010. The improvement is especially marked in Leicester City, and the gap between the performance of pupils attending City and County has narrowed. In 2010, 55.3% of pupils in County schools achieved 5 or more GCSEs at grades A*-C, including English and Maths, compared to 48.9% of pupils in Leicester City (and 53% in England).20
4.11 The under-performance of White students in Leicester City is a significant
issue, with problems concentrated in deprived areas in the west of the City. This is apparent as early as age 11 (Key Stage 2). Only 37% of White pupils in Leicester City achieved five or more GCSEs at grades A*-C (including English and Maths) compared to 62% of Asian pupils in the City. The gap between White and Asian students is also significant in the County but not quite so marked (54% of White and 69% of Asian students. Overall, a high proportion of 17 year olds in both the City and County remain in education post-16 and this continues to increase.
20
Department for Children Schools and Families (DCSF) Statistics

Leicester and Leicestershire Economic Assessment 32 Summary
4.12 Although 15% of secondary school pupils living in the City travel to County schools, there is little evidence that this has any impact on attainment.
4.13 Although the sub-region benefits from three large universities, graduate retention is relatively low. Six months after graduating, 36.7% of De Montfort University graduates, 22.5% of the University of Leicester graduates and 12.5% of Loughborough University graduates had found employment in the sub-region.
4.14 In 2010, 6% of Leicester City and 3% of Leicestershire County school leavers
went into full-time training which included apprenticeship programmes.

Leicester and Leicestershire Economic Assessment 33 Summary
4 - Employment and Skills SWOT
Strengths Workforce qualifications in the County are
amongst the highest in the region
Progression rates to Higher Education are exceptionally high in the City (especially amongst the Indian population)
Proportion of the workforce qualified to Level 4 has increased in both the City and County
Three world class universities are located in the sub-region and there is a strong and improving FE sector
Leicestershire has a slightly higher proportion of the workforce employed as managers and in professional occupations when compared to the region
The health sector in Leicester City employs large numbers of women, part- time workers, migrants and graduates.
Weaknesses City wages for both residents and workplace jobs
are lower than expected for a City.
23% of residents in the City have no qualifications and workforce qualifications are amongst the poorest in the region
Marked poor performance of White young people resident in the City, which is already apparent at age 11
The 2 most deprived neighbourhoods for education skills and training in the UK are located in the City
Leicester has a high proportion of resident workers employed in low-skilled occupations and a relatively small proportion employed in management/professional roles
Only 54% of females in the City are in employment
Low graduate retention - especially arts and engineering graduates
Opportunities 3 universities produce approximately 17,000
graduates each year and strong FE sector
Young and culturally diverse workforce in the City
Food and drink sector employment is expected to increase and also employment in the health sector
Completion rates for apprenticeships have improved, which is against the regional trend
Qualification Levels in the City are improving with higher achievement at Levels 2 and 3 at age 19
Promoting the good progress in City schools rather than league tables would improve reputation of the City, inspire pupils and encourage inward investment
.
Threats Potential increase in the claimant count as a result
of public sector cuts and falling consumer confidence
Fluctuation in vacancies notified to Job Centre Plus over the past 12 months
Significant proportion of City employment in public sector and related sectors, which is a risk given potential future cuts in public spending
Public sector is important source of graduate employment & cuts likely to have negative impact on graduate retention
Apprenticeship participation has been affected by the economic downturn and ongoing uncertainty, employers not willing to take on apprentice
Low aspirations of young people in deprived areas of the City
Employers report lack of applicants with ‘the right attitude
Skills gaps reported by many businesses, in both manufacturing and services sectors
Less government funding available to invest in workforce training

Leicester and Leicestershire Economic Assessment 34 Summary
5 Economic Exclusion and Worklessness 5.1 The chapter describes the extent, intensity and geography of economic
exclusion and worklessness in Leicester and Leicestershire. It highlights different types of worklessness and the links to social exclusion, identifying the barriers that some groups and communities may be more likely to experience in term of economic inclusion.
Index of Multiple Deprivation (IMD) 5.2 Leicester is the 25th most deprived local authority in the country (in terms of
the 2010 Index of Multiple Deprivation (IMD) ranked by average score). Leicestershire County is the 12th LEAST deprived local authority in the country (IMD 2007). Compared to 2007 rankings, the City has become relatively less deprived. Although figures have not been published for the County (IMD 2010) based on the information gained for its districts it is believed that the County ranking will get worse. Oadby and Wigston District has recently become eligible for ERDF Priority Axis 2 funding (sustainable economic and enterprise activity in disadvantaged communities).
5.3 The Index of Multiple Deprivation (IMD) is made up of 7 categories,
Employment, Health and Disability, Education, Skills and Training, Barriers to Housing and Services, Crime and the Living Environment. These are combined to construct an overall ranking and score for each of the 32,482 Lower Super Output Areas (LSOA’s) nationally.
5.4 40% of Leicester City’s neighbourhoods (76 LSOAs)21 fall into the 20% most
deprived nationally, whereas in the County 5 neighbourhoods fall into this category. This suggests that deprivation is relatively widespread in Leicester, but that Leicestershire also experiences pockets of deprivation. However, rather than being in isolated rural areas, the most deprived parts of Leicestershire are those within urban areas.
5.5 The City is very different from the County. In the City 86% of LSOA’s are in
the 50% most deprived in the country and 25% are in the 10% most deprived. This compares with 18% and 1% respectively for the County. There are no City LSOA’s that are in the least deprived 10% nationally.
5.6 In the City 23 (12.3%) LSOA’s are in the 5% most deprived LSOA’s in the IMD.
In the County there is only 1 (0.25%). 5.7 One area that is common to many of the 23 most deprived LSOA’s in the City,
is that many of these are neighbourhoods with populations that have high
21
Lower Super Output Area. These are small communities (generally smaller than wards) which have around 1,500
people living in them. In total, there are 32,482 LSOAs in England and 583 in Leicester and Leicestershire.

Leicester and Leicestershire Economic Assessment 35 Summary
concentrations of White British residents. In two cases over 92% of residents are White British (Census 2001).
Worklessness 5.8 In total, 64,410 people were claiming out of work DWP22 benefits in the sub-
region in November 2010. This is a particularly significant problem for Leicester City, where 16.3% of working age residents were claiming out of work benefits (compared to 7.4% in Leicestershire County). Within Leicester City, some wards such as New Parks, have very high concentrations of residents (27%) on out of work benefits. North West Leicestershire had the highest rate of out of work benefit claimants in the County at 9.2%.
5.9 The following groups are more likely to experience significant barriers to
employment and skills development: women, those on incapacity benefit, NEET23, carers, lone parents, older people, Black or Minority Ethnic Groups (BME) and those from new Communities. Further analysis of all those on DWP benefits shows that:
50% are female (39,220)
42% of are on incapacity benefit (33,440)24
11% are claiming a lone parent benefit (8,830)
28% of JSA claimants25 in the sub-region were from BME groups in April 2011
16% of those claiming benefits are aged 16-24
22% of those claiming benefits are over 55 (17,010) 5.10 More recent figures indicate that 5.9% of working age residents in the City
and 2.2% in the County are claiming Job Seekers Allowance (May 2011). This compares to the UK figure of 3.7%. However, the JSA claimant count has fallen since May 2010 when it was 6% in the City and 2.4% in the County. In the current climate of public sector cuts and low consumer confidence, the JSA claimant count is expected to increase during 2011.
5.11 Futhermore, current welfare reform is likely to tighten eligibility to all out of
work groups. Migration is expected from the Incapacity Benefit & Employment Support Allowance and and Income support for lone parents to job seekers Allowance. This will pose a significant challenge to the sub-region as many of these claimants face complex multiple disadvantages for entering the workforce. Additionally, many have experienced long periods of detachment from the workforce.
22
DWP = Department of Work and Pensions 23
NEET = those not in education, training or employment 24 These are slightly more likely to be male, although females are more likely between age 50 and 60 25 Ethnicity not available for all out for all work benefits
Leicester and Leicestershire Economic Assessment 36 Summary
5.12 Few barriers to employment exist in isolation and often support is needed to address a number of related or consequential issues, such as childcare, housing, health, financial exclusion, debt, etc, before a person can be supported into a sustainable form of employment. Holistic support needs to be flexible enough to take into account inter-dependent needs. Research from past recessions suggests that local action is a determining factor in the success of post-recession economies.
5.13 Local intervention examples include the Highcross project which was
supported by a number of partnerships including representation both from the City and County. The partnerships were successful in developing and supporting a client routeway approach to meet the recruitment needs of employers and also providing routeways for the workless and long-term unemployed to be job-ready to meet genuine job opportunities. Multi-access centres have been rolled out across the sub-region, building on successful partnership-working. The core services can provide a flexible and holistic approach to tackling social and economic exclusion.
5.14 Many areas in the County are more education/skills than employment
deprived suggesting that employment opportunities are relatively good, although employment is low-skilled in some areas. In the City, types of deprivation are more varied and there is significantly less correlation between adult skills deprivation and young people’s education deprivation. Areas of adult skills deprivation appear to be linked to income and employment deprivation, whereas education deprivation has a closer link to health deprivation and income deprivation affecting children.
5.15 Neighbourhoods exhibiting education deprivation tend to be located within
wards of social housing on the edge of the city, Braunstone, Eyres Monsell, Freemen, New Parks and Beaumont Leys, Abbey. Other educationally deprived neighbourhoods are in the Spinney Hills, Charwood and Latimer wards.
5.16 Recent research into low participation rates of females in the city attempted
to identify factors contributing towards the situation. The main factors broadly fell under the following headings:
the ethnic composition of the workforce economic inactivity due to a preference not to work amongst some
women concentrations of benefit claimants in particular parts of the city poor qualifications or lack of basic skills low levels of pay available fewer job opportunities especially as a consequence of the decline of the
textiles industry

Leicester and Leicestershire Economic Assessment 37 Summary
6 Housing 6.1 There is a considerable variation in property types and tenures across the
Leicester and Leicestershire Housing Market Area (HMA)26, but these tend not to correlate to demography or actual need. As with most cities in England, Leicester has ‘prospering suburbs’ which surround the more mixed and less well-off central areas of the bigger settlements. Overall, the HMA has housing at a range of prices that are sufficiently high to contribute to economic buoyancy, and relatively affordable compared to household income. However, variations within this generalised pattern reveal significant shortage of affordable dwellings across the HMA both in rural and in urban areas to meet need. This shortage is, at least in the short-to-medium-term, set to increase as a result of the current economic climate and the associated difficulties such as inability to obtain mortgages, or the loss of homes.
Housing Stock 6.2 The HMA has a wide range of housing types and sizes and the housing mix is
comparable to that found in similar City–centred sub-regions across Britain. While Leicester has a high proportion of one bedroom properties, terraced housing and flats and a significant social housing sector, Leicestershire has a higher proportion of larger housing, private sector properties and detached housing. Good quality housing is available in both city and rural locations. This property mix is able to cater for the wide variety of socio-economic needs and aspirations within HMA, and acts as an incentive for those seeking to live within the HMA.
Decent Homes
6.3 Private sector:
Across the seven Leicestershire local district council areas around 31% of private sector homes (74,600) fail to meet the Decent Homes Standard.
In Leicester City 42% of private sector homes (34,100) currently fail to meet the standard. This maybe due to the higher level of pre-1919 stock within the City compared to the County.
Nationally, 35.8% of private sector homes fall below the standard.27
6.4 Public sector:
Charnwood (34%), Melton (10%) and North-West Leicestershire (55%) still have significant levels of non-decent LA homes.
All are set to secure funding from Government to address this issue.
26
Note the HMA comprises Leicester City and Leicestershire County Unitary Authority areas 27
English House Condition Survey 2007

Leicester and Leicestershire Economic Assessment 38 Summary
6.5 Registered Social Landlords (RSL)/Housing Associations: 40.9% of the total
RSL homes within Leicester and Leicestershire that fail to meet the Decent Homes Standard are within Blaby District. However these have recently transferred from the local authority to a LSVT (Large Scale Voluntary Transfer) organisation that is committed to bringing the stock up to standard.
Empty Homes 6.6 Leicester has a higher percentage of private sector empty homes at 3.1%
than other parts of the sub-region as a result of the higher turnover than seen with other tenures. However, there are very few empty public sector homes largely due to substantial demand and a shortfall in provision.
Affordability and Affordable Housing 6.7 Though often used interchangeably, housing affordability and affordable
housing are terms with distinct meanings.
Housing Affordability: Relates to the general ability of households to access market housing, most often based on a comparison of incomes and house prices.
Affordable Housing: Housing provided specifically for households who are determined to be in housing need. Includes social rented and intermediate properties.
Affordability 6.8 Affordability in Leicester and Leicestershire has been measured in relation to
the ratio of incomes to house prices. A sustainable mortgage is argued to be up to 3.5 times household income. Affordability indicators suggest that house price differentials have led to some degree of polarisation of earnings across the sub-region, with higher value areas showing a higher median income and vice versa. Comparing lower quartile incomes with lower quartile house prices shows a worse picture of affordability (with house prices up to 10 times higher than lower quartile incomes).
6.9 Variations in house prices support evidence of ‘City Flight’ and ‘Escalator
Model’ theories. Property prices may also have been driven upwards by speculative purchases and buy to let. Prices have risen substantially since 2004, and have largely been sustained despite the economic changes. Sales volumes have plummeted, and it is debatable whether some drop in price might make property more affordable and therefore stimulate market movement.
6.10 There is a contrast between property prices in urban and rural areas. This is
likely to have an economic impact on the most expensive rural settlements as

Leicester and Leicestershire Economic Assessment 39 Summary
lower income households will be unable to afford to live there and local services may suffer as a result.
Viability 6.11 The viability of development varies within and across districts. Each Local
Authority has carried out a Viability Assessment which has guided policy decisions regarding affordable housing contributions. The findings emerging from these pieces of work were broadly:
Policy choices which recommended either: o Single targets for the entire district which are likely to require
grant in lower value areas, or o Differential targets to reflect values across the district (ranging
from 10% to 40%)
Viability may be impacted by factors other than house prices
Thresholds triggering contributions may be set below the national indicative minimum (of 15 properties) without affecting viability.
Grant funding has a greater proportionate impact in weaker sub-markets 6.12 The viability of sites is also affected by wider Section 106 such as for
education, police and fire services, waste management etc. However, trigger levels are also key. A low trigger may negatively impact upon viability, and turn developers away leaving sites undeveloped and a lack of housing while triggers that are too high may lead to insufficient provision of affordable housing
6.13 Viability has the potential to greatly impact the delivery of market and affordable housing. This looks set to worsen as a result of the significant cuts in funding imposed by the Government.
Affordable Housing Provision 6.14 Affordable Housing provision has varied substantially over time both within
and across local authorities in Leicester and Leicestershire. The supply of affordable homes does not necessarily appear adversely affected by the economic downturn. It may be that schemes agreed during a healthier economy are coming through in later years, and or may also be a reflection of how much the market has been sustained with grant funding. However the future supply of affordable housing is likely to be significantly affected by the reduction in available funding for grants.
6.15 The provision of intermediate housing has declined in general across the sub-
region. This is thought to be the result of lenders viewing the products as high risk and reluctant to offer mortgages on them.

Leicester and Leicestershire Economic Assessment 40 Summary
Household Projections
6.16 The Government’s 2008-based household projections indicate an average annual growth of 2% for the Leicester and Leicestershire HMA for the 25 year period to 2033 compared with 1.8% for England. This is a higher growth rate than achieved in the period 1991-2008 (0.9%). Across the whole HMA, one person households are projected to increase by almost 60% from 119,000 to 189,000 by 2033. However, this does not mean that all one person households will want small one bedroom accommodation. Projections by age of household indicate a 45% increase in households aged 65-84 and 150% for 85+ which will have implications for planning to meet the housing needs of elderly persons.
Planned Housing Growth
6.17 The East Midlands Regional Spatial Strategy (RSS) (which remains part of the
statutory Development Plan until the enactment of the Localism Bill) requires Leicester and Leicestershire to deliver 80,400 new homes by 2026 or 4,020 per year in an urban concentration approach. including sustainable urban extensions (SUEs) as necessary. Almost 50% of future housing growth is currently focused on the Leicester PUA.
Housing Land Availability 6.18 Current City and District Strategic Housing Land Availability Assessments
(SHLAAs) indicate that land is available to deliver just over 14,000 new homes during the next five years April 2010 to March 2015. This equates to about 2,800 per year and is well below the RSS planned annual requirement of 4,020 dwellings. Several districts (as shown by annual monitoring returns) currently do not have a five year housing supply. Even where land does have extant planning permission, the provision of necessary infrastructure and housing market conditions will greatly influence whether the site will come forward for development.
Funding 6.19 The detailed housing chapter has highlighted a number of challenges that will
need to be addressed if the LEP area’s housing offer is to both effectively provide for current population and household movement, and to act positively in attracting and securing labour to the sub-region. These challenges include:
provision of sufficient affordable housing,
ensuring housing is decent
bringing empty properties back into use, and the
delivery of significant numbers of new housing needed to support growth
Leicester and Leicestershire Economic Assessment 41 Summary
6.20 In the past, the availability of public funding has helped to enable non-viable
development sites to become viable, assisted in achieving affordable housing targets, pump-primed delivery of infrastructure for new developments and improved the quality of our stock. However, the significant reductions in the availability of public funding to support housing announced by the Coalition Government in October 2010 poses a very real threat to the quality and delivery of housing stock in the sub-region.
6.21 The same, and possibly worse, challenges exist in the private sector in terms
of housing standards and quality. With increasing unemployment and difficulty in securing access to finance, the deterioration of private sector housing stock is a very real possibility as the economic climate shows little sign of recovery.
6.22 The lack of available funding also has the ability to impact upon the
development sectors ability to deliver new housing of high quality and design. Whilst environmental targets are also increasing, such as the need to meet Code for Sustainable Homes Level 4 from April 2011 in return for funding from the Homes and Communities Agency, the ability of developers to afford to deliver these standards is questionable. This may lead to a either a poorer quality offer, or potentially a reduction in delivery as viability issues become more prevalent.
6.23 When it was completed in April 2009, the Leicester and Leicestershire Growth
Infrastructure Assessment 28 identified a deficit in funding of circa £1.3bn. This study was undertaken when funding was more readily available to support delivery of infrastructure for new housing growth, thus this level of deficit is cautious given the scale of cuts to public funding. Whilst new delivery models are emerging to take the place of traditional funding streams, the performance of these in delivering housing and the associated infrastructure remains unknown. The role of the private sector is also expected to increase to compensate, but with so many projects being jointly public/privately funded over recent years it is difficult to see how this will occur.
6.24 Clearly, as is seen by the new delivery models of for example; New Homes
Bonus and the Affordable Rent Programme, new ways of working together, prioritisation and funding mechanisms will need to emerge in order to continue to ensure that Leicester and Leicestershire has a good housing offer of a variety of types and tenures at a high quality in a variety of locations and well functioning market.
6.25 Our challenge is to provide a range of housing products that people want to
live in, where they want to live to avoid significant future voids. Not all single
28
http://www.leicestershiretogether.org/infrastructure_assessment_main_report.pdf

Leicester and Leicestershire Economic Assessment 42 Summary
people will chose to buy one bedroom accommodation and not all older households, with support needs, will choose to live in supported housing. However, new development cannot be entirely aspirational and that the availability of adequate resources is a key consideration.

Leicester and Leicestershire Economic Assessment 43 Summary
6 - Housing SWOT
STRENGTHS
Relatively moderately priced housing within the overall UK housing market context
A good mix of types and sizes of housing across the wider conurbation and county
Many attractive areas and environments with high quality and luxury housing.
Established working arrangements and a strong track record of delivery.
A good mix of communities and neighbourhoods attractive to people from a variety of different backgrounds.
House prices have generally been sustained despite the down turn in the economic climate
The HMA is geographically well placed with good access to communication links and a number of key cities.
Relatively strong policy position and evidence base to manage and administer developer contributions
WEAKNESSES
Shortfall of affordable housing compared to need, especially in suburban and rural areas.
Imbalances between housing sub-markets leading to: o Poor viability of sites, especially in parts of the city, o Areas of lower value and non decent stock
depreciating values and increased polarisation. o City flight (people leaving the city as they become
more affluent)
Imbalances of occupancy levels, overcrowding in some areas and under-occupation in others
Some polarised tenure.
Concentrations of deprivation in central and city areas
Mismatch between housing need and demand versus availability
Substantial areas of non decent stock, particularly within the private sector.
Need for affordable homes in increasing – continued market dysfunction and lack of supply draws subsidy away from other areas.
Differences in policy positions across local authorities may make a joined up growth strategy more challenging to implement

Leicester and Leicestershire Economic Assessment 44 Summary
OPPORTUNITIES
The Leicester and Leicestershire Enterprise Partnership will facilitate opportunities for prioritisation, value for money and maximising limited public resources.
The SUEs and SRA’s provide opportunity for housing and employment land to be closely aligned.
New delivery models such as New Homes Bonus opportunity to address issues previously difficult to tackle, such as turning empty homes into viable use.
Removal of targets and prescribed processes from central government and localism approach promotes flexibility to respond to the challenges.
Regeneration and SUE’s provide opportunity to provide more mixed communities, less polarisation, a sub-market structure less divided between city and suburbs, and a better balance between supply and demand
Managing student housing growth and provision to both aid graduate retention and release traditional houses as family homes
Planned housing growth could have a positive impact on jobs in the construction sector
Good housing offer in advantageous geographical position to attract households
Competitive house prices compared to other cities/settlements in the sub-region
Investment provides thriving communities and attracts a good economic mix
Strong evidence base to support appropriate housing mix including intermediate housing
THREATS
Housing market is generally dysfunctional and volatile and has significant impact on employment.
Ageing population and increased under-occupation of housing
Polarisation between housing sub-markets.
Over-supply of particular types of housing, such as city centre flats.
Lack of suitable housing in the city causing city flight.
Increasing unemployment, difficulties accessing finance, increasing interest rates and possessions and economic hardship leading to High or increasing numbers of empty properties, and more non-decent homes particularly in sub-market areas which are unpopular and potentially poorer quality housing. The lack of funding has the potential to exacerbate these issues.
High priced sites in suburban and rural areas leading to development of expensive up market housing alone rather than balanced communities
Competing cities and other growth areas attracting graduates and skilled workers away with a better housing and environmental offer along with a loss of younger population from rural areas.
Reductions in public and private sector funding available to deliver infrastructure and affordable homes needed and cause increasing levels of non decent properties
Expensive housing in rural areas – hard for young people to access.
Weakened policy position, delays and uncertainty arising from the national position allows developers to drive housing delivery that may not meet demand.
Stagnating market through lack of sales
Rise in interest rates threatens households’ economic position
Affordability issues prevent households from accessing employment opportunities
Rural affordability impacts rural economies and communities
Entry level households cannot access housing and cannot emerge as separate households – potential for overcrowding and increased economic/social stress
Lack of investment limits the potential for the housing and employment offer in the sub-region
Homelessness increases due to worsening of economic climate
Development to enhance housing and economic offer becomes unviable without grant
Uncertainty regarding Affordable Rent tenure may affect future provision of or jeopardise the economic position of households in housing need.
Leicester and Leicestershire Economic Assessment 45 Summary
7 Employment Land and Premises 7.1 A balanced supply of employment land and premises is a necessary pre-
requisite for an area to be able to maximise its economic performance. Sub-regional partners are in agreement that the Leicester and Leicestershire sub-region has suffered from a structural shortage of employment land for many years and that this has been a barrier to maximising growth within the sub-region.
7.2 At the present time, the sub-region can be characterised as follows:
There is an increasing demand for offices and a decline in demand for industrial space.
There has been an imbalance in the growth of the office stock, with significant increases in offices in out-of-town locations and stagnation in the City.
Conversely, the greatest demand for offices is in Leicester.
Leicester has seen the largest decline in industrial stock and also has the oldest industrial stock in the sub-region.
Conversely, the greatest demand for land for new industrial stock is in Leicester.
There is a 20-year supply of land for offices in Blaby.
There is a substantial over-supply of industrial land in North West Leicestershire.
There is a shortage of land for industrial and warehousing uses in Leicester.
The un-met demand for industrial and warehousing land in Leicester must be found in the wider Leicester Principal Urban Area (PUA) if the economic potential of the City and the whole sub-region is to be realised.
7.3 The amount of additional undeveloped employment land required in the sub-
region to provide a balanced supply is derived from a range of evidence, including forecasts of future demand for land, an analysis of the current effective supply of land, an assessment of the gap between demand and supply and consideration of a range of other economic and property factors.
7.4 The re-evaluation of the PACEC Study conducted in 200829 recommends that
the following additional allocations of previously undeveloped employment land are required, including:
179,786 sq. m. of offices across the sub-region as a whole, including:
29
Strategic Study of Employment Land Requirements in Leicester and Leicestershire, PACEC 2008
revised in 2010/11

Leicester and Leicestershire Economic Assessment 46 Summary
An initial 31,410 sq.m. of offices in Charnwood North and Oadby & Wigston together with a potential further allocation in Phase 3 of the New Business Quarter (NBQ) in Leicester (to help meet a total PUA requirement of 131,980 sq.m.).
32,515 sq.m. of offices in Hinckley.
170.2 hectares of land for light industrial and small-scale warehousing, including:
Up to 90.2 ha for light industrial and warehousing in the PUA.
Up to 80 ha for light industrial and warehousing outside the PUA.
50 hectares for a potential strategic road rail strategic distribution centre. 7.5 These revised recommendations in 2011 represent an increase in the
allocation of land for offices across the sub-region, together with a slight reduction in the allocation of land for light industrial and small warehousing uses, compared to the recommendations in the 2008 Study. This reflects the revised assumptions made by PACEC in calculating office demand on the basis of private sector office growth and revised assumptions on the rate of renewal and the proportion of renewal that will take place on previously developed land.
7.6 An assessment of future demand for workspaces across the sub-region
undertaken as part of the Workspace Study (2009) identified the following key conclusions:
Take-up of workspace remains strong from different sub-markets across the sub-region.
For basic workspaces and serviced offices, demand is arising from start-up and micro-businesses, notably amongst those serving local businesses and consumers.
For the innovation centres at De Montfort University, Loughborough University and the LCB Depot in Leicester, demand is arising from technology and creative based firms seeking support services for business germination, incubation and growth as well as opportunities to network with other firms. These facilities and services will be key to securing inward investment from technical and knowledge-based industries, thus driving up productivity and achieving sustainable economic growth.
For freehold premises and plots, demand is arising – on a more limited scale - from company directors who wish to either develop or acquire freehold premises for investment purposes.
There is unmet demand for small office schemes in Waterside and St George’s South in Leicester.
Future demand for workspaces, in terms of uses and mix of uses, unit sizes, ICT connectivity, energy performance and area, will be shaped by continued structural changes in the sub-region’s economy.

Leicester and Leicestershire Economic Assessment 47 Summary
Retail 7.7 The Leicester and Leicestershire sub-region has a healthy retail offer that
experiences relatively little loss of expenditure to shopping centres located outside of the area. Leicester City’s ranking as a retail centre is currently 14th in Great Britain30 and Fosse Park is the third ranked retail park in Great Britain, in terms of consumer expenditure. Within Leicester, the market provides a distinctive element to the retail offer, differentiating the city from other retail centres and attracting two million visitors annually.
7.8 The continued strength of the retail sub-regional offer and development of future retail infrastructure must go hand in hand with the provision of high-quality public realm and environment to reinforce and further retain a high level of retail expenditure in the sub-region.
Value of Industrial Development Land 7.9 Industrial development land values in Leicester are very competitive
compared to neighbouring cities such as Birmingham, Coventry and Nottingham. Moreover, they are extremely competitive compared with other large cities such as Bristol, Sheffield, Manchester and Leeds.
Office Rental Values 7.10 Office rental values in Leicester are relatively low compared to many other
cities. In terms of business occupiers, this can be seen by some as a strength (particularly by those for whom “image” is less important), in that it will help a business to lower its costs by locating in Leicester. However, rental values are closely linked to the quality and range of accommodation on offer. Cities with lower average rental values are often perceived as less attractive for businesses where image is important. Much of the current office stock in Leicester is low grade and, as such, Leicester lags behind other urban centres in terms of its offer and image. Furthermore, the low rental values do not give investors, developers and existing property owners any incentive to invest or redevelop as investment yields are low.
30
Based on CACI Retail Footprint 2010

Leicester and Leicestershire Economic Assessment 48 Summary
Figure 7.1 Office Rental Values in Comparator Cities, 1 January 2010
0
50
100
150
200
250
300
Birmin
gham
Leed
s
Man
ches
ter
Bristo
l
Cambrid
ge
Newcast
le
Oxf
ord
Readin
g
Sheffi
eld
Leice
ster
Notting
ham
Off
ice
Ren
tal
Val
ues
£/m
2
Source: Valuation Office (2008)

Leicester and Leicestershire Economic Assessment 49 Summary
7 - Employment Land and Premises SWOT Strengths
A co-ordinated approach to employment land and workspace planning and delivery across the sub-region
Strong growth of industrial stock in North West Leicestershire, Hinckley & Bosworth, Melton
Strong demand for offices in Leicester, Blaby, Harborough, Hinckley & Bosworth, Charnwood and NW Leicestershire
Overall demand for small office floor space in the Leicester PUA has held up in recent years
Good supplies of undeveloped employment space in North West Leicestershire and Harborough
Strong retail offer, Highcross, Fosse Park, Leicester market, market towns - area retains high proportion of retail expenditure
Industrial development land is competitively priced in Leicester compared to many other cities
Weaknesses
Market failure causing long-term structural shortages of ‘fit for purpose’ employment land and workspaces across the sub-region
Continued stagnation in the development of new offices in Leicester at the expense of out-of-town office development
Large stock of old, outdated industrial and commercial premises of little interest to business, particularly within the City
Limited supply of available Grade A and high-quality office accommodation in Leicester
Current shortage of undeveloped employment land available to the market in Leicester, Charnwood, Blaby, Hinckley and Bosworth, Oadby and Wigston and Melton
Gaps in the supply of workspace for germination, incubation and growth of businesses, particularly in science, technology and creative sectors
Lack of overall co-ordination between the provision of workspaces and business support across the sub-region, however, some local exceptions
Opportunities
Joined-up approach to employment land planning and delivery - a source of economic competitiveness for sub-regional economy
Promote sustainable development by aligning homes with jobs & reducing the need to travel
Joined-up public sector approaches to the planning, funding & delivery of employment land & workspaces
Loughborough Science Park provides one of the most attractive sites for high technology-based industry in the East Midlands
Leicester Science Park to promote innovation employment in the City
Substantial demand for employment land in Leicester and Charnwood
Unmet demand for small office schemes in Waterside and St George’s South in Leicester
Strong demand for basic workspaces and serviced offices from start-up and micro-businesses
Strong demand for germination, incubation and grow-on space from businesses in science, technology & creative sectors
Further development of retail offer and Leicester Market
Threats
Abolition of the Regional Spatial Strategy.
Abandonment of the strategic approach to the planning and delivery of employment land and workspaces, particularly for strategic employment sites in the Sustainable Urban Extensions
Inability to allocate additional undeveloped employment land outside the City boundary to meet unmet demand from within the City
Significant reductions in public sector resources and diminishing external funding programmes limiting the scope for future public sector interventions in employment land and workspaces
The need for advance investment and public sector intervention to bring forward strategic employment sites within the proposed Sustainable Urban Extensions
Car parking standards for City Centre offices deflecting demand for offices towards car-dependant out-of-town schemes
Urgent need to provide land in Charnwood to avoid it running out of land supply in the next 5-10 years, in all sub-areas
Identified additional allocations of undeveloped employment land not being brought to the market
Continued pressure for residential development on employment sites (especially in the City)

Leicester and Leicestershire Economic Assessment 50 Summary
8 Transport
8.1 The quality of local transport is critical to the success or otherwise of local economies. Transport connectivity enables people and businesses to access services, employment centres and key markets. In areas of high demand, delays associated with congestion can affect quality of life and have costs for both businesses and employees, eroding some of the benefits associated with the concentration of economic activity.
Supporting Key Economic Sectors 8.2 Transport continues to shape Leicester and Leicestershire’s economy by
providing attractive operating environments for key sectors. The strong presence of the manufacturing, transport and logistics sectors in the sub-region, and the fact that the business and knowledge-based service sectors will continue to grow, ensure that it is these sectors on which the transport system must be focused in attempting to provide businesses in the sub-region with attractive operating environments in which they can access labour, suppliers and markets as easily and efficiently as possible.
8.3 The presence of a number of manufacturing, transport and logistics businesses in the sub-region means that there is a dependence on the movement of freight. In particular, businesses are looking for efficient strategic road networks that provide easy access to national and international markets. The sub-region benefits from excellent access to the strategic road network, and the area has a strong competitive advantage in terms of the movement of freight by road. The position of the sub-region at the heart of the country, between the East Coast Ports and markets in the north of the UK, means that the area has been strongly placed to develop as the UK’s logistics hub. Furthermore, East Midlands Airport, at the intersections of the M1, A42/M42 and A50, has developed a national role for the movement of air freight, second only to Heathrow. The relatively limited role played by rail freight does not appear to have constrained the development of the logistics sector in the sub-region, although this could become more of a challenge in the future. This is a fact that was recognised in the Leicester and Leicestershire Employment Land Study of 2008 which identified the potential need for a strategic road-rail distribution centre in the sub-region.
8.4 There are, however, challenges with the management of traffic on the
strategic road network: until the onset of the recession, traffic flows have risen strongly during recent years and congestion and incidents can impact on the transport costs, and, hence, competitiveness and efficiency of businesses in Leicestershire, particularly manufacturing and logistics firms. If left unchecked, problems on the strategic road network will damage the competitive advantage of the Leicester and Leicestershire economy, particularly in light of the housing growth planned for the sub-region.
Leicester and Leicestershire Economic Assessment 51 Summary
8.5 At a strategic level, existing congestion problems currently include peak-period congestion at the M1 Junction 21, poor road links to the A1 northbound, and the limited movements allowed at the M1 Junction 19 which mean that it is not possible to travel between the A14 and M1 south at this junction. Locally, there is marked peak-period congestion in Leicester City centre, on its arterial routes and ring roads, and in some of the county towns such as Loughborough and Melton Mowbray. The sub-region also experiences inter-urban congestion at peak times which limits connectivity, especially on the M1 heading south to J21 and on the A6 between Leicester and Loughborough.
8.6 The sub-region has a smaller proportion of people working in the knowledge-
based service sector than the England average. However, it is likely that professional services will continue to grow in importance, and it will be important to create the transport conditions to enable these types of business to flourish. Leicester City, particularly the City centre, will be the main concentration of this type of activity, which will lead to ‘spillover’ benefits for the wider economy. This requires the provision of effective strategic connectivity for business travel, particularly by rail, not only to London, but also to professional services clusters in other major cities including Nottingham and Birmingham. As planned housing growth across the HMA31 occurs, commuting to other key centres is likely to increase, meaning that the quality of these linkages will become increasingly important.
8.7 At present, rail connectivity is generally considered to be good and the area
has frequent and fast rail services to London from Leicester, Market Harborough, Loughborough and East Midlands Parkway. On the other hand, rail connectivity to Manchester, Leeds, Northampton and Milton Keynes is poor. Rail services to Birmingham and Nottingham could also be improved. However, it is recognised that improving rail connectivity will be expensive.
8.8 The development of a ‘knowledge economy’ in the HMA requires effective
access to a skilled labour market. The obvious pre-requisite is to up-skill the existing workforce and to attract highly-skilled workers to the sub-region which will require the provision of appropriate levels of housing and other infrastructure to support a high quality of life. This also means catering for the travel-to-work needs of ‘knowledge-workers’, who require effective connectivity by a range of modes, including the car and, with increasing salary prospects, will become more willing to travel further to work. Only 7.5% of the journeys to work in the HMA are made by bus. For travel to work into and within the central Leicestershire urban area, a step-change in the quality of bus services is required to provide a viable and attractive alternative to the private car for a much greater proportion of the working population.
31
HMA = Housing Market Area, corresponds to the Leicester and Leicestershire sub-region

Leicester and Leicestershire Economic Assessment 52 Summary
The Impact of the Recession 8.9 Claimant Count Data published for May 2011 (Leicestershire County Council
Unemployment Bulletin, Table 1) indicates that the Job Seekers Claimant rate is highest in the City (5.9%), compared to 2.2% in the County. There are a number of factors affecting the rate in the City (such as the match of skills to job vacancies, poor skills, low educational attainment, poor health and multiple deprivation). However, lower public transport accessibility to employment locations outside central Leicester may also be a factor in limiting employment opportunities for City residents and thus may be impacting on local unemployment rates.
8.10 There are concerns that unemployment levels are likely to increase both
locally and nationally during 2011, especially given the likelihood of job losses in the public sector. It is also anticipated that there will be greater competition for those vacancies that do arise. Transport provision could become a factor constraining people’s ability to find jobs. If incomes fall relative to the costs associated with owning and running a car, people may become more dependent on public transport. Also, if people begin to look further afield for employment, transport issues, particularly lengthy and expensive public transport journeys, will increasingly be an important factor determining worklessness.
Transport Conditions in Leicester and Leicestershire 8.11 There are complex commuting patterns across the sub-region as people
travel between the City and County for work, education and training. The sub-region itself is relatively self-contained in terms of commuting to and from work but 70,800 people commute into the City each day to work, compared to 27,60032 commuting out, thus confirming that Leicester is extremely important to the County for the supply of jobs (17% of County wards have between a third and a half of their workforce commuting to the City). However, the patterns of commuting across the sub-region suggest that there are a number of other important individual labour markets throughout the County.
8.12 The current public transport offering in the sub-region has both its strengths
and weaknesses. Bus access to central Leicester is seen as a strength, along with the provision of a comprehensive hourly county bus network. With more bus priority, journey times by bus are becoming increasingly competitive with car travel, especially at peak times in urban areas. Leicester’s park and ride network is also expanding. Bus service punctuality is broadly at levels found elsewhere.
32
Source 2001 census, more recent APS 2008 commuting figures confirm high level of self
containment

Leicester and Leicestershire Economic Assessment 53 Summary
8.13 The public transport interchange in central Leicester is poor given the distance between the London Road Station, Haymarket and St. Margaret’s bus stations. However, Leicester City Council is developing a major scheme that will propose new bus termini and routings.
8.14 There is also often limited access by bus to centres of employment outside
central Leicester such as business parks, and limited or non-existent public transport provision to the most rural communities. This limits access to employment and training, although only 5% of residents in the HMA do not have access to an hourly or better bus service.
8.15 Evening and weekend bus services are less frequent than at other times as
patronage is lower, making the services less commercially viable. This is particularly problematic for employees working shifts.
8.16 Whilst the current public transport network offering in the sub-region is generally seen as a strength, it must be noted that over the next 2-3 years cuts to local government funding, concessionary fare funding, the Government grants paid to bus service operators and rural bus subsidies will have an impact on the existing local bus network, particularly network coverage, service frequencies and prices.
8.17 National research suggests that crime levels on public transport are low. However, crime and fear of crime are seen as a deterrent to walking, cycling and the use of public transport, particularly amongst women, the young and the elderly.
8.18 In terms of business views of public transport, 40% of rural businesses rate
‘employee travel to work by public transport’ as a concern, compared to only 20% in urban areas, whilst 31% of rural businesses expressed concern regarding customer access to their premises by public transport, compared to only 15% in urban areas33. Availability of late evening and early morning bus services is one of the key business concerns relating to public transport. Also, many people commute to work by car; in 22% of businesses all employees commute to work by car and more than 75% of people travel to work by car in a further 30% of businesses. Nearly half (46%) of all companies reported that they have no staff who travel to work by public transport34.
8.19 In terms of road safety, there have been marked improvements across the
sub-region over the last 10 to 15 years. The rate of reduction of road accident casualties is lower in Leicester City than in the County. However, casualties in Leicester only account for approximately a quarter of all killed or seriously injured casualties across the sub-region.
33
Leicester and Leicestershire Business Survey, Winter 2011 34
Leicester and Leicestershire Business Survey, Winter 2011

Leicester and Leicestershire Economic Assessment 54 Summary
8 - Transport provision in Leicester & Leicestershire - SWOT Strengths Strategic location on national road network
Good road access to peripheral business parks and development land
Delays on strategic road network less severe than regionally / nationally
East Midlands Airport – access to international markets / freight distribution
Frequent, high speed rail services to London (and on to Europe)
Rail services to most County towns and East Midlands Parkway serving the Airport
Good daytime bus network, especially in central Leicestershire, rural Leicestershire and inter-urban routes
Increasing levels of bus priority, bus information and park & ride
Relatively low, and falling, road accident rates
Weaknesses Peak period traffic congestion in Leicester – arterial routes
/ ring road / M1 Junction 21
Peak period congestion in County towns, particularly Loughborough and Melton Mowbray
Peak period congestion on some inter-urban routes limits connectivity (i.e. A6 between Leicester and Loughborough, A14 at M1 Junction 19, A6 / A50 / A453 at M1 Junctions 23a-24a) and along some sections of A5
Limited bus access to employment centres outside of the core urban areas
Poor evening and weekend bus services adversely affect access to employment or night-time leisure services
Poor public transport competitiveness with the car – particularly for orbital and cross city movements
Poor rail accessibility to some key centres outside the region (Manchester / Birmingham / Leeds)
Low rail speeds to Nottingham / Birmingham
Modest local rail network with relatively infrequent services
Public transport interchange in Leicester
Capacity and operational constraints on the Midland Mainline and rail freight routes
No regional rail freight terminal in the East Midlands
Opportunities Access to strategic road network is attractive for
distribution, manufacturing and logistics sectors
Relatively short journey to work offers opportunity for behavioural change in reducing congestion and CO2 emissions through promotion of walking and cycling for shorter trips
Encouraging higher levels of home-working amongst the sub-region’s businesses can reduce the need for travel on the journey to work, and hence congestion issues at peak times
Spare capacity on some key road corridors (e.g. A42, M42)
Planned enhancements of the Midland Mainline
Ongoing investigations into potential sites for a strategic road-rail distribution centre in the sub-region (allied to delivery of employment land requirements)
Potential to develop a range of innovative interventions through Local Transport Plans and Local Development Frameworks that will foster more sustainable travel patterns and reduce economic costs
Rail crowding is not yet an issue on most services
HS2 may provide opportunities to improve the strategic connectivity of the sub-region and reduce over-crowding on existing mainlines, providing capacity on regional services
Planned Highway Agency improvements for the M1 at J19 and further opportunities for improvements at M1 J21, 23a & 24
A46 improvements due for opening in 2012
Threats Increasing demand for travel due to economic, employment
and housing growth is likely to increase vehicle kilometres and traffic flows that could lead to worsening congestion, thus inhibiting economic activity, and higher emissions, which could have an adverse impact on both people and the environment
Growth in car travel as it becomes cheaper relative to public transport
Some businesses perceive a lack of parking for customers and employees as a factor affecting business desire to locate in Leicester City
Cuts in transport investment funding may affect ability to fund the transport infrastructure needed to support sustainable housing and economic growth
Cost of travel can act as a barrier to population accessing employment and training
Growth in the quantity and size of HGV traffic generated from economic activity may contribute to worsening congestion
Cuts to concessionary fare funding, bus services operator grant, rural bus subsidies over the next 2-3 years will have impacts on current bus network coverage, frequencies and prices
Gaps in rural public transport services may affect people’s ability to find jobs or access education and training opportunities

Leicester and Leicestershire Economic Assessment 55 Summary
9 Environment
Climate Change - Mitigation
9.1 At a national level, a target has been set for carbon emissions to reduce by at
least 80% by 2050 against 1990 levels. This requires per capita emissions to be reduced in Leicestershire from eight to two tonnes. This will be achieved by measures that reduce energy demand, deliver improved energy efficiency, and switch power sources to renewable energy.
9.2 Such responses should be supported, wherever possible, as they reduce
costs, reduce waste and help to mitigate the impact of climate change. 9.3 There is an increasing need to accept that the design of how buildings and
machines work in carbon terms will need to become relatively more important and that this will bring aesthetic design challenges for society.
9.4 There will be a range of business and education opportunities in delivering
energy reduction, energy efficiency and renewable energy schemes, which may need seed corn funding.
Climate Change - Adaptation 9.5 There will need to be a Leicester Shire Climate Change Adaptation Strategy
prepared and delivered to ensure the impacts of climate change are managed in an appropriate fashion.
9.6 The risk of flooding affecting homes and businesses is already a significant
issue in the sub-region. Historically, this has been from rivers bursting their banks. Whilst this risk will increase with climate change, there is also likely to be increased surface water flooding from the increased intensity of rainfall. Such flooding incidents are harder to forecast and can occur over a much wider area of the City and County.
9.7 There will be a need to ensure the public are aware of these risks and the
measures available to cope in emergencies.
Resource Efficiency 9.8 The Winter 2011 Leicester and Leicestershire Business Survey highlighted
that businesses are concerned about rising fuel and energy costs and this concern has become more significant in the last two years. This could make businesses more receptive to initiatives that improve resource efficiency. Resource efficiency improvements could be particularly beneficial in that savings generated go straight to the bottom line, reduce waste and reduce impact on the environment. They could also reduce the regulatory burden on business that is otherwise expected to increase as the real costs of

Leicester and Leicestershire Economic Assessment 56 Summary
environmental services will be increasingly charged. Water resource management will become increasingly important due to potential drought from climate change and potential conflict over use of limited resources.
9.9 There is a need to tackle diffuse pollution as it affects our rivers and
watercourses. 9.10 Programmes to tackle air quality issues in the designated Air Quality
management areas in Leicester and Leicestershire and noise in any areas designated in Noise Action Plans will be addressed through the priorities set out in the Local Transport Plan. Programmes that increase support for sustainable transport will need further support.
9.11 Waste Management will be based on the following principles:
working towards zero growth in waste by 2016
reducing the amount of waste sent to landfill
exceeding government targets for recycling and composting to continue to achieve levels of current best practice
taking a flexible approach to other forms of waste recovery on the basis that technology in this area is developing very quickly
Green Infrastructure
9.12 There is a need to improve the quality and accessibility of some of the
greenspace in and around Leicester. This will have multiple benefits for well-being, physical and mental health, biodiversity, air quality, flood management, climate change adaptation and sustainable transport. Particular priority areas linked to Growth Point developments have been identified for:
Soar Valley
Charnwood Forest
Burbage Common and Woods
The countryside edge in and around Leicester and other urban areas
Environmental Services
9.13 In Leicester and Leicestershire, we can expect that issues relating to
protection of the public good, represented by ecosystem services, will receive greater prominence. This will be achieved through increased regulation, through measures designed to ensure that such services are not damaged and through additional work to ensure that we understand ecosystem services better. This will be coupled by significant effort to ensure that individuals understand how they depend upon the natural environment. This is a critical issue as the absence of such understanding can inhibit meaningful decisions being made on behalf of society.

Leicester and Leicestershire Economic Assessment 57 Summary
Biodiversity 9.14 Whilst biodiversity levels of both the County and City are comparatively weak
and impoverished compared to other areas of the country, there are small pockets of significant interest. Leicestershire has suffered a significant loss of biodiversity over the last 50 years. It is, therefore, important to protect and enhance the rich sites that remain. Elsewhere, programmes of nature conservation enhancement will be needed. Existing programmes will need continued support in the National Forest, Charnwood Forest, Leighfield Forest and in the strategic river corridors of the Soar, Trent and Welland and their tributaries.
9.15 Habitats that are beneficial for wildlife in Leicester City include: small areas of
woodland and wetland, meadows, pasture, hedgerows and spinneys, managed green spaces including parks and private gardens, allotments, cemeteries and school grounds. There are also more typical urban habitats, such as buildings and structures, disused railway land, road verges/banks, bare ground and disused or abandoned land. The River Soar and Canal Corridor is a very important natural feature in the City for wildlife.
Better Places 9.16 The quality of much recent development in Leicester and Leicestershire has
been unacceptably poor (according to CABE35). There is a pressing need to ensure the design quality of new development improves.
9.17 Our city and town centres are the focus of our communities. The distinctive
identity of the historic environment helps to define the quality of these places. They have also undergone significant changes in function and form. In many instances, these changes have meant that the ‘heartbeat’ of the centres has reduced. Programmes of action to ensure that employment, retail activity and sense of place are retained and developed are highly desirable.
9.18 Heritage sites around the City and County contribute significantly to
employment, tourism and people’s sense of place, quality of life and civic pride.
9.19 Environmentally-led regeneration through the National Forest initiative has
demonstrated the success that focussed programmes of activity can achieve. Whilst such significant levels of landscape change are not required in much of Leicester and Leicestershire, where policies of protection of existing character are more appropriate, there are some areas where more focussed activity would be beneficial to fully realise their environmental and economic
35
Commission for Architecture and the Built Environment, audit report 2006
Leicester and Leicestershire Economic Assessment 58 Summary
potential. As well as the City, town centres and the National Forest, these include:
The River Soar corridor
The countryside in and around Leicester and in and around other urban areas
Charnwood Forest
Geology and Minerals 9.20 Leicestershire is very rich in minerals. The geology of Charnwood Forest is
nationally important and the associated palaeontology (Charnia fossils) is internationally important as the first evidence of life in the fossil record. Mineral operators are significant employers and contributors to the local economy. However, the side effects of quarry operations can involve additional traffic, noise, dust and landscape change. Future mineral operations need to work in ways which minimise harmful impacts, and, when land is restored, maximise community and environmental benefits. As society and the economy continue to demand the products associated with mineral production in Leicestershire, we can expect to see a continued need for minerals working. In land-use planning terms, this will be much easier to accommodate where it can be seen that public assets will be created through the early identification of appropriate “after uses” for such sites.
Inland Waterways 9.21 Inland waterways can support climate change, carbon reduction and
environmental sustainability by:
Assisting in the mitigation of flood risk
Playing a role in urban cooling
Providing sustainable transport
Providing biodiversity and forming ecological corridors
Contributing to regional and local renewable energy targets through onshore hydro-electric power and the use of canal water for heating and cooling buildings

Leicester and Leicestershire Economic Assessment 59 Summary
9 - Environment SWOT
Strengths
Pleasant and attractive environment
Developing National Forest with good access
Nationally important geological and biological resource of Charnwood Forest
Weaknesses
Relatively poor levels of biodiversity compared to other areas of the country
The quality of greenspace in and around Leicester varies and it is not evenly distributed.
Low quality of recent development
Some market town centres overwhelmed by traffic
Opportunities
Climate Change – Business opportunities in resource efficiency, including: renewable energy generation; fitting energy efficiency measures to new and existing buildings and vehicles; water conservation; air quality; waste management reduction, refuse and recycling
Scale of mineral resource provides opportunities through planned restoration to provide improved biodiversity and green infrastructure
Regeneration of City and town centres
Greater opportunities for partnership working on environmental imperatives
River Soar and the Grand Union Canal development potential
Skills training in resource efficiency trades
Threats
Climate Change – general trend to drier hotter summers, wetter winters, more intense rainfall leading to increased flooding, and an increased risk of more extreme weather events
Need to reduce per capita CO2 emissions to two tonnes by 2050 while still providing good quality of life for all
More expensive and regulated environmental services

Leicester and Leicestershire Economic Assessment 60 Summary
10 Rural 10.1 Leicestershire’s rural economy aligns significantly, in structural terms, to the
urban economy with a range of sectors represented. This includes an expanding tourism sector, increased patterns of home-working, and a growing creative and knowledge-based economy. Other important sectors include wholesale, retail, food and drink manufacturing, transport and communications. Despite some key larger employers based within rural areas, businesses are generally much smaller in rural areas, with a higher proportion employing less than 10 people than seen in urban areas. Operating within a rural area can present key challenges for such businesses.
10.2 The need for increased economic development in rural areas has been
strongly advocated from many sources; the Rural Coalition in the Rural Challenge Report 201036 affirmed the importance of rural economies estimating that rural businesses are worth nearly £145,000m to the national economy every year. Fundamental barriers to rural economic growth include planning restrictions, the lack of affordable rural housing, lower levels of public transport, and lack of adequate broadband provision.
10.3 Land-based businesses remain important within Leicestershire, and there has
been an increase in on-farm diversification. This has resulted in improvements to local tourism, food and drink and equestrian activity. Agricultural productivity is likely to be of increasing importance as a result of current food security concerns, however it is important that this is not undertaken to the detriment of environmental and land management factors. Furthermore, Leicestershire has an expanding woodland economy, principally located within the National Forest.
10.4 It is estimated that in total 250 affordable rural homes per annum are
required in Leicestershire to meet local needs.37 Despite current low delivery rates, there are a significant number of pipeline projects. The Leicester and Leicestershire Local Investment Plan has identified that there are at least 350 homes within settlements of less that 10,000 population to 2014 in the pipeline. Under current public funding models this would require £16.5m.
10.5 Improvements to broadband connectivity are critical for a range of
community, education and businesses needs. There is a growing Digital Divide between urban and rural areas. In total 190,000 residents live within the Final Third38 and are at risk of not receiving market-led connectivity improvements. This is illustrated in Figure 10.1.
36
The Rural Challenge: Achieving sustainable rural communities for the 21st
century. August 2010 37
Leicester and Leicestershire Strategic Housing Market Assessment (2008) 38
The Final Third refers to 33% of the population to whom it is currently unlikely to be economically viable to connect to Next Generation Access (NGA) networks.

Leicester and Leicestershire Economic Assessment 61 Summary
Figure 10.1 The “final-third” in Leicestershire. Map modelling the location of super-fast broadband based on rollout to 65% of the Leicestershire population. Coloured areas represent those at risk (amber, red).
39
39
http://www.communities.gov.uk/publications/communities/assessmentngafinalreport

Leicester and Leicestershire Economic Assessment 62 Summary
10.6 Employment across a range of broad sector groups is more evenly spread in
rural areas compared to urban – demonstrating a more diverse employment/economic base. There is proportionally more employment in;
o wholesale and retail trade in significantly rural areas (village, hamlet
and isolated dwellings) o manufacturing in town and fringe o transport and communications in town and fringe
10.7 The proportion of employment within the food and drink, equestrian and
outdoor recreation, and land-based sectors within Leicestershire is greater than the England average. The food and drink sector, for example, has experienced the largest growth within the manufacturing sector between 1998 and 2009. To develop the Food and Drink sector further, partners have recently produced a Food and Drink Strategy (2011 – 2014).
10.8 There is an increasing tourism base in and around the National Forest, with a
number of key tourist sites, outdoor activities and range of accommodation. In Charnwood, key sites include Bradgate Country Park and the Great Central Railway. There are a number of other important tourism attractions within rural Leicestershire including Twycross Zoo, Bosworth Battlefield, Conkers and Foxton Locks.
10.9 Between 2006 and 2009 the economic impact of tourism in Leicestershire
increased by over 10% while declining slightly across the rest of the East Midlands, employment increased by over 6% and tourist numbers by 5%. The LLEP has recently produced a Tourism Strategy for Leicester and Leicestershire 2011-16 which highlights the importance of rural tourism.
10.10 In terms of the knowledge economy, there is a higher proportion of
consumer services within significantly rural areas and a slightly lower proportion of knowledge-based services. There is a significantly lower proportion of high-technology manufacturing in significantly rural areas.40
10.11 There is a higher proportion of construction sector, banking, financial and
business services sector, and transport and communication sector businesses in rural than urban areas.
10.12 Business confidence is slightly higher amongst businesses located in rural
areas compared to those in urban areas. In the recent business survey41, 28% of rural businesses expected conditions to improve and 22% expected conditions to deteriorate, giving a balance of optimism at +6%. (This compared to a balance of -5% for urban located businesses). 70% of rural
40
Source Leicester and Leicestershire Economic Assessment 2010 41
Leicester and Leicestershire Business Survey, Winter 2011

Leicester and Leicestershire Economic Assessment 63 Summary
businesses planned to grow (similar to urban businesses) – with 6% planning rapid growth, 35% planning moderate growth and 29% slow growth.
10.13 In general, larger proportions of the working age population in Leicestershire
have higher level qualifications and smaller proportions have no qualifications, than in urban areas42. There is also significant out-commuting from rural areas to higher paid employment within urban areas; meaning those who work in rural areas are on average paid less than those that live there. Employee access issues can be problematic for employers especially for young employees reliant on public transport.
10.14 Rural estates, owned by individuals, institutions and public sector
organisations, within Leicestershire are significantly important to the rural economy. They provide employment opportunities, workspace provision, affordable rural housing, and local services. Two thirds of Leicestershire estates are identified as smaller holdings up of to 800ha each. In total 24% of the Leicestershire land area is owned by an estate.
10.15 The LEP provides new opportunities to support rural businesses through closer working with residents and business in Leicester City. The City provides a significant market which, for example, could be developed in terms of tourism marketing and local food sourcing. In addition, services developed as part of planned housing extensions could provide additional support to businesses and residents within rural hinterlands.
42
The Rural East Midlands 2008

Leicester and Leicestershire Economic Assessment 64 Summary
10- Rural SWOT
Strengths
Significant tourist attractions within rural Leicestershire including Bradgate Park, Twycross Zoo, Bosworth Battlefield, the National Forest and Foxton Locks
Entrepreneurial, dynamic, and proactive businesses within rural areas who seek new opportunities for business growth
Key unique, established and successful brands within rural Leicestershire – especially with the food and drink sector
Central location within the heart of the country and good transport links, especially to the west of Leicestershire, provide key investment opportunities within rural Leicestershire
A diverse rural economy resulting in a range of opportunities for economic growth. Supported by rich and varied natural environment
Relatively prosperous communities with low overall levels of deprivation
Relatively high levels of qualifications, although problems exist within some sectors
Weaknesses
Broadband connectivity in some rural areas is poor, affecting many rural businesses and opportunities for skills development. In some instances there is limited use of ICT technologies, especially within the land-based sector, resulting in business inefficiency
Lack of appropriate managed workspace and enterprise space in rural areas for either new businesses or those that become established to expand into
Lack of skilled workforce within certain sectors. Some are characterised as low skill, low wage
Lack of affordable housing and reduced provision of public transport within rural areas results in problems for some businesses appointing staff to certain positions
Opportunities
Rural estates, in addition to supporting land-based businesses, can offer significant opportunities to strengthen rural economies by providing workspace, affordable rural housing and community facilities
Tourism could offer more to the sub-regional economy. Opportunity to increase overnight stays and develop improved links between other sectors including food and drink, equestrian and land-based
Key sectors in rural areas could contribute further to the sub-regional economy – including food and drink, land-based, and equestrian
County Multi Access Centre programme will help to ensure that residents in rural areas are able to access training and skills development opportunities
Businesses in rural locations, including the land-based sector, could increase profitability through adoption of resource efficiency measures
Development of food and drink manufacturing to provide local ethnic food, reducing food miles
Personalised travel planning and green travel plans to support rural businesses and employees
LEP provides new opportunities to support rural businesses through closer working with residents and business in Leicester City
Threats
Planning policies are often cited as a key barrier to achieving economic growth in rural areas. Regional policy of urban concentration results in a constrained rural economy
Many agricultural diversification projects have quoted ‘access issues’ as a barrier to gaining planning permission
Increased burden of regulation and legislation, especially for land-based, equestrian and food and drink businesses, results in reduced opportunity to diversify and expand
Difficulties of successfully identifying pockets of rural deprivation. Measures such as IMD are not successful in identifying rural issues
Rural premium. Additional cost of delivering services within rural areas. Due to the sparse population and limited resources, mainstream service delivery does not always reach those in most need

Leicester and Leicestershire Economic Assessment 65 Summary
11 Summary Conclusions 11.1 This final section summarises the strengths and weaknesses of the Leicester
and Leicestershire economy. It also assesses the opportunities, threats and challenges facing the local area. The remainder of the section links the evidence presented in this assessment to suggest high-level strategic priorities that could be pursued in order to develop a more prosperous, productive and sustainable local economy for Leicester and Leicestershire.
STRENGTHS 11.2 The Leicester and Leicestershire sub-region has a number of key strengths
which are summarised below.
Economic Structure and Performance
Diverse economic structure not overly dependent on any one sector or any single employer.
o Significant employment remains in the manufacturing sector and
these companies are performing well, especially engineering and food and drink sub-sectors. Some high technology manufacturing.
o Strong logistics sector is a distinctive feature of the local area, linked to its strategic location.
o Service sector is growing in significance, with a wide range of sub-sectors represented - professional services, creative and cultural industries.
Generally strong market towns and rural economy – as evidenced by GVA per head in Leicestershire County.
Strong retail offer through Highcross and Fosse Park, and retail expenditure largely remains within sub-region.
Tourist attractions - Twycross Zoo, National Space Centre, Conkers, Twinlakes Park and Snibston Discovery Park.
Trading links with significant and growing economies such as China and India.
Universities and Further Education
Three world-class universities located in the sub-region. o Contribute significantly to the area’s GVA and bring innovation and
R&D skills to local businesses. o Expertise in space science, physics, medical research, green
technology, innovative manufacturing, engineering, design and creative industries.

Leicester and Leicestershire Economic Assessment 66 Summary
Strong and improving FE sector providing a wide range of vocational training to meet local employer needs and a pathway to higher education.
Progression rates to Higher Education are very high in Leicester City, especially amongst Indian population and those receiving Free School Meals (FSM).
Transport and Location
Strategic location in relation to national road network; 95% of the English population are accessible in 4 hours by road.
East Midlands Airport, second largest freight-handling airport in the UK.
Frequent, high speed rail services to London (and on to Europe).
Environment and Quality of Life
Pleasant and attractive natural environment with good and improving access.
National Forest – national example of environmental-led regeneration project.
Generally good quality of life as evidenced through the Place Survey.
Housing and Infrastructure
A good mix of types and sizes of housing across the wider conurbation and county in a choice of rural, market towns and urban locations.
Moderately priced housing within the overall UK housing market context.
History of delivering new housing.
Industrial development land is competitively priced in Leicester compared to many other cities.
Cultural Diversity
Leicester City has a younger age profile compared to many areas.
Cultural diversity is a distinctive feature in Leicester City, and has contributed to strong overseas trading links.
WEAKNESSES 11.3 On the other hand, the Leicester and Leicestershire sub-region has some key
weaknesses which are summarised below.
Economic Structure and Performance
GVA per head in Leicester is below that seen in Nottingham, Derby and more prosperous cities in the south and east of England.

Leicester and Leicestershire Economic Assessment 67 Summary
Average annual GVA growth in Leicester City and Leicestershire has been below the national average, reflecting a lack of high-value added industry in the area.
Workplace earnings in Leicester are low compared to similar cities – linked to the relatively low proportion of jobs in managerial and professional occupations and in knowledge-based sectors.
Leicester City male resident earnings (median) are especially low.
Three-year business survival rates in Leicester City have been below the national average for a number of years.
Leicester and Leicestershire does not have a strong identity/ image which may have limited the area’s ability to attract inward investment.
Area has not fully capitalised on the opportunities to transfer innovation and R&D from its three universities into existing and new businesses.
Insufficient graduate-level jobs in some sectors and an under-developed knowledge economy compared to many other areas.
One in three jobs in Leicester City are linked to the public sector and there was a net loss of private sector jobs (-500) over the period 2003 to 2008.
Skills and Employment
23% of Leicester City’s resident working age population have no recognised qualifications (compared to 12% in England) - Leicester is one of the worst performing areas in the country on this indicator. A further 13% have ‘other or overseas qualifications’ which do not readily match UK qualifications.
22% of Leicester City’s resident working age population have a level 4 qualification43 compared to 30% in England.
Only 54% of Leicester City’s working age females are in employment
Marked poor educational performance of white young people resident in Leicester City, already apparent at age 11.
Employers report lack of “applicants” that are “job-ready”, especially young people.
Deprivation and Worklessness
Nearly 41% (76) of the LSOA’s in Leicester City (187) fall into the 20% most deprived nationally (based on IMD 2010). 86.1% (161) are in the worst 50%. In the county 17.7% are in the worst 50% (70 of 396).
Out of the 187 LSOA’s 23 (12.3%) were in the worst performing 5% of the index (in the County there was only 1).
Of the 24 LSOA’s in the top 5% worst performing 14 have gotten worst and 10 have gotten better.
Overall Leicester was previously ranked 20th out of the authority areas (including districts and Boroughs). Leicester is now ranked 25th. Overall it
43
Level 4 is equivalent to a first degree
Leicester and Leicestershire Economic Assessment 68 Summary
is important to understand that it is hard to judge any changes in rankings as these are receptive to the actions being undertaken in each authority area and on the performance of other authorities.
Oadby and Wigston now eligible for ERDF funding linked to its indices of deprivation.
16.9% of working age residents in Leicester City are claiming key out-of-work benefits (Job Seekers Allowance, Lone Parent, Employment Support Allowance and Incapacity Benefit and other income related benefits).
Transport
Peak period traffic congestion in Leicester City (including on its arterial routes), some of the County towns (particularly Loughborough and Melton Mowbray), and on parts of the strategic road network (M1 Junctions 21, 23a-24a and along some sections of the A5).
Poor rail accessibility to some key centres outside the region (Manchester / Birmingham / Leeds) and low rail speeds to Nottingham / Birmingham.
Poor public transport interchange in Leicester City.
No regional rail freight terminal in East Midlands.
Employment Land & Infrastructure
Limited supply of Grade A and high-quality office accommodation in Leicester.
Lack of employment land and obsolete premises have constrained growth in Leicester City.
Limited access to high-speed Broadband in rural areas of Leicestershire.
Housing
“City flight” – people leave the City as they become more affluent – complex issue but in part linked to quality and mix of housing available.
A shortfall of affordable housing compared to need, especially in suburban and rural areas, similar to most other areas of the UK.
Environment
Relatively poor access to green space in Leicester City.
Relatively poor levels of biodiversity compared to other areas of the country.
OPPORTUNITIES 11.4 The following opportunities have been identified for the sub-region following
a review of the evidence base.

Leicester and Leicestershire Economic Assessment 69 Summary
Economic Structure
Three world-class universities located in the sub-region with expertise in space science, physics, biomedical and healthcare research, green technology, innovative manufacturing, engineering, transport technology, sports research and technology, product design and creative industries. This offers significant opportunities for:
o Growth in knowledge-based start-up businesses and spin-outs. o Commercialisation of leading-edge technology. o Transferring innovative practice and R&D skills to support growth and
maintain competitiveness in established businesses in all sectors. o Creation of more graduate-level jobs in the local economy. o Attracting new investment into the area. o Supporting a low carbon economy – e.g. in energy efficiency,
renewable energy, sustainable construction, waste management. o Linking with employers in terms of internships and graduate
placements.
Diverse economic structure with significant employment in manufacturing, wholesale and retail, transport, communications and tourism - offers the potential to create a wide range of job opportunities at all skill levels.
Diverse economic structure offers opportunities to strengthen local supply chains.
Some large and influential employers with significant growth potential.
Potential to further develop international trade, by building on existing strong links with India, China and Europe.
Growing service sector, with business and professional services already making a high contribution to GVA and projected to grow in the future.
Evidence from the recent business survey suggests local business performance is strong and that many businesses have growth aspirations.
Improving tourism and cultural offer – National Forest, Twycross zoo, Curve, Phoenix Square, National Space Centre, festivals, inland waterway network.
Potential to develop the social enterprise sector, given high numbers of third sector organisations but relatively low number of social enterprises.
Changes in government policy may lead to the opportunity to provide more localised business support.
Employment Land, Housing and Infrastructure
Science, enterprise and technology parks located in Loughborough, Leicester and around MIRA in Hinckley & Bosworth.

Leicester and Leicestershire Economic Assessment 70 Summary
The possibility of establishing an Enterprise Zone in the sub-region offers the opportunity to develop the knowledge-economy and build on existing strengths.
Strong demand for basic workspaces and serviced offices from start-up and micro-businesses, as well as for germination, incubation and grow-on space from businesses in science, technology & creative sectors.
Grade A. office provision close to the station in Leicester City offers opportunity to attract investment into the City.
Ongoing investigations into potential sites for a strategic road-rail distribution centre for the sub-region (allied to delivery of employment land requirements).
Potential for major growth areas to accommodate and provide right employment land and housing to support the economy (jobs) in right locations – improving sustainability of the local economy.
Planned housing growth could generate more construction sector jobs.
ERDF funding in Leicester and Oadby & Wigston provides opportunities to stimulate economic growth.
People and Skills
Potential to raise educational attainment through investment in schools (Building Schools for the Future) and academies.
Strong FE sector, and investment in new FE College premises, offers potential to deliver training and apprenticeships to meet the skill needs in the local economy and provide a pathway to higher education.
Three universities are supporting the Aim Higher initiative to widen participation in HE.
Ageing population, especially in Leicestershire County, can provide a more flexible workforce and will generate opportunities in the health and social care sectors.
Cultural diversity and a relatively young population profile in Leicester City offers opportunities for a wide range of start-ups and to further develop international trade links.
Transport
Relatively short journey to work offers opportunity for behavioural change in reducing congestion and CO2 emissions through promotion of walking and cycling for shorter trips.
Encouraging higher levels of home-working amongst the sub-region’s businesses can reduce the need for travel on the journey to work, and hence congestion issues at peak times.
Access to strategic road network is attractive for distribution, manufacturing and logistics sectors.
Planned enhancements of the Midland Mainline will improve rail links.

Leicester and Leicestershire Economic Assessment 71 Summary
HS2 may provide opportunities to improve the strategic connectivity of the sub-region and reduce over-crowding on existing mainlines, providing capacity on regional services.
Planned Highway Agency improvements for the M1 at J19 and further opportunities for improvements at M1 J21, 23a & 24.
Environment
Attractive natural environment offers opportunities for tourism and to attract people to live in the sub-region.
Scale of mineral resources provides opportunities through planned restoration to provide improved biodiversity / green infrastructure.
THREATS and CHALLENGES 11.5 There a number of significant threats and challenges to the local economy
which are summarised in the following section. Economic Structure
Failure to capitalise on the opportunities to establish and grow knowledge-based businesses will inhibit wealth creation in the local economy and restrict earnings growth.
A failure to innovate across all sectors will result in declining business performance and a loss of competitiveness.
The fact that one in three jobs in Leicester City are linked to the public sector, makes the economy vulnerable to public expenditure cuts, especially given the poor private sector job growth over the period 2003 to 2008.
High percentage of new business start-ups are in sectors with high failure rates (e.g. hospitality and retail). This may result in business survival rates continuing to be worse in Leicester City than is the case nationally.
Current low consumer confidence and predicted job losses from the public sector will lead to reduced expenditure in the retail and service sectors, causing problems for local businesses.
The high proportion of very small businesses in the local economy poses a challenge for the delivery of business support services. This is compounded by the loss of the Business Link adviser service and lack of future funding to support business start-ups. Businesses have expressed a strong preference for face to face support which will be challenging to deliver in the current climate.
The government emphasis on “high growth” businesses could result in a lack of support for established and stable businesses that provide significant local employment.
Competing cities and growth areas could attract businesses and people away from the sub-region offering a better business environment and access to a more buoyant labour market.

Leicester and Leicestershire Economic Assessment 72 Summary
Analysis by Experian suggests that Leicester City’s economy is vulnerable to economic shocks.
People and Skills
Skills gaps reported by 50% of businesses, could inhibit growth and the ability of businesses to innovate. Skills gaps are more apparent in the manufacturing sectors, but a wide range of skills gaps have been reported.
12% of businesses report skills gaps with basic literacy and 11% with basic numeracy which is a threat to business growth and productivity.
50% of businesses employing less than ten people have made NO investment in formal training for their employees in the last 12 months. This is a concern in itself but a situation that could become worse with reductions in government funding for employee skills development.
Changes to university tuition fees may result in fewer students choosing to study in Leicester and Leicestershire which will impact on spending patterns in the local economy and may ultimately reduce local employers’ ability to access new graduates resulting in skills shortages.
Reductions to the number of young people eligible for the Educational Maintenance Allowance may also impact on young people’s study choices.
The ageing population could prove challenging for service providers, particularly in the more rural and remote areas of Leicestershire County.
Deprivation
High levels of deprivation and worklessness, alongside the low skills base in Leicester City make the area less attractive to inward investment.
Infrastructure and Transport
Significant funding gap and continuing decrease in public sector funds will impact on the delivery of essential infrastructure which could constrain economic growth in the area.
Insufficient investment in employment sites and infrastructure could result in businesses moving out of Leicester City and Leicestershire to more attractive premises elsewhere in the country offering state-of-the-art facilities and car parking.
Insufficient Grade A. office space in Leicester City makes it difficult to attract investment and retain professional services businesses in the area.
Inability to allocate additional undeveloped employment land outside the City boundary to meet unmet demand from within the City will constrain business and job growth in the sub-region.
Continued pressure for residential development on employment sites (especially in the City) will also inhibit growth potential.
Increasing demand for travel due to economic, employment and housing growth is likely to increase vehicle kilometres and traffic flows that could lead

Leicester and Leicestershire Economic Assessment 73 Summary
to worsening congestion, thus inhibiting economic activity, and higher emissions, which could have an adverse impact on both people and the environment.
Cuts to concessionary fare funding, bus services operator grant, rural bus subsidies over the next 2 to 3 years will have impacts on current bus network coverage, frequencies and prices.
Gaps in rural public transport services may affect people’s ability to find jobs or access education and training opportunities.
Housing and Environment
Loss of more economically active, wealth-generating households, either out of the City to the suburbs and rural areas, or out of the County completely will weaken the area’s labour market.
Competing cities and other growth areas could attract graduates and skilled workers away with a better housing and environmental offer.
Climate change will increase risk of flooding and extreme weather events which will disrupt business and could inhibit investment decisions.
The achievement of the government’s targets around carbon dioxide emissions will require huge investment which has the potential to divert funding from other areas.

Leicester and Leicestershire Economic Assessment 74 Summary
KEY CONCLUSIONS AND STRATEGIC PRIORITIES 11.6 The evidence suggests that a number of long-term strategic priorities could
usefully be pursued in order to develop a more prosperous, productive and sustainable local economy for Leicester and Leicestershire. These are presented below.
Why this should be a priority:
Average annual GVA growth is below the national average in both Leicester City and Leicestershire suggesting the need to stimulate growth in the local economy.
GVA per head in Leicester is below that of Nottingham and Derby and many indicators suggest that Leicester City is performing below its potential for a city of its size.
There has been a net loss of private sector jobs (-500) over the time period 2003 to 2008 in Leicester City. On the other hand districts such as Blaby experienced very strong private sector job growth (linked to developments at Grove Park) indicating that the sub-region has the potential for private sector growth when the right conditions for growth are available.
1 in 3 jobs in Leicester City are linked to the public sector and the area is considered vulnerable to economic shocks.
Blaby, Oadby & Wigston, Charnwood also have high dependencies on public sector related employment.
Workplace and resident earnings are low in Leicester City.
The area has a relatively under-developed knowledge economy, especially given the presence of three universities.
11.7 In support of this strategic priority, the evidence suggests that there is a need
to stimulate enterprise activity, especially in knowledge-based areas and to support new start-ups so that they are more likely to survive.
Why supporting enterprise activity should be a priority:
Business creation rates are below the national average in the sub-region and self employment levels are low in Leicester City suggesting a need to encourage enterprise and business start-up.
High proportion of new business start-ups are in sectors with high failure rates, such as retail and hospitality.
People are starting businesses in sectors where they have no prior experience and without conducting market research, suggesting a need for high quality pre-start and start-up advice.
3-year survival rates are lower than the national average in Leicester City suggesting a need for support beyond the initial start-up phase.
Strategic Priority 1 - The need to increase productivity and private sector job growth

Leicester and Leicestershire Economic Assessment 75 Summary
Insufficient start-ups in high technology, high value-added sectors or those with significant growth potential.
Three universities and strong FE sector provide opportunities for more knowledge-intensive start-ups to be developed and supported.
Why this should be a priority:
Overall, the economy is diverse and not overly dependent on any one sector or large employer – which will be important to try to maintain. This will protect the economy from economic shocks.
However, the sub-region has less employment in knowledge-based sectors than more prosperous areas of the country.
In particular, the area has a less well developed professional services, communications and financial services sector compared to many other cities and LEP areas.
Workplace and resident earning are low in Leicester City compared to many other cities, which is linked to the sector structure and level of jobs in the economy.
There is significant opportunity to exploit the full commercial potential of the knowledge, expertise and capabilities within the three local universities.
Universities have expertise in the following areas but further work is needed to identify which of these fields offers the greatest potential to improve the sub-region’s knowledge economy.
o space science, physics, biomedical and healthcare research,
green technology, innovative manufacturing, engineering, transport technology, sports research and technology, product design and creative industries.
The lack of graduate level opportunities in the labour market has made it difficult to retain and attract graduates.
11.8 Providing the right transport, employment land, infrastructure and housing
conditions will play a vital role in enabling economic success. Each of these issues is assessed in the sections below.
Transport: Local transport authorities (through their Local Transport Plans) will need to work with private and public sector partners to ensure that physical regeneration improvements are closely aligned with the job creation and business investment needs of the local economy. Current issues include:
Strategic Priority 2 - Creating a Balanced and Sustainable Knowledge-Based Economy
Strategic Priority 3 - Addressing the Physical Requirements for Success

Leicester and Leicestershire Economic Assessment 76 Summary
Congestion is a current problem and a constraint to future sustainable economic growth. Evidence suggests there should be a focus on tackling congestion in the following areas:
o M1 – J19, 21, 23a - 24a o Intersections of M1, A42 & A50 o A5 corridor near Hinckley o A1 northbound o A6 between Leicester & Loughborough o Leicester city centre / arterial routes / ring roads o County towns – particularly Loughborough / Melton Mowbray
The manufacturing, transport and logistics sectors are important locally and businesses are looking for efficient strategic road networks that provide access to national/ international markets. It will be important to tackle congestion on the major routes so that Leicester and Leicestershire’s competitive advantage is not damaged.
The desire to develop the local knowledge economy, especially in Leicester City has transport implications. In particular, rail services to Manchester, Leeds, Northampton, Milton Keynes, Birmingham and Nottingham need improvement.
Evidence also suggests the need for a step-change in the quality of bus services to provide a viable and attractive alternative to the private car for those in managerial/professional occupations.
It will be important to cater for the additional transport demand likely to emanate from housing growth, without having an additional impact on the transport system, on individuals and on the environment. If the planned 80,400 new homes are built, with an urban concentration approach, current modelling work suggest that this could lead to a 40% increase in the number of kilometres travelled by vehicles and an 80% increase in delays.
Transport plans will need to enable people to access employment, training and skills development opportunities throughout the sub-region. The evidence suggests a need to:
o Underpin economic growth by connecting goods, people and
ideas as efficiently as possible o Provide a transport system that allows professional workers to
access job opportunities in Leicester City o Support the lower-skilled – by improving the limited access by
bus to employment centres outside of core urban areas o Tackle the poor provision of evening / weekend bus services
Employment Land. A balanced supply of employment land and premises is a prerequisite for an area to be able to maximise its economic performance. Current issues include:

Leicester and Leicestershire Economic Assessment 77 Summary
The lack of fit for purpose employment land and obsolete premises (especially in Leicester City) has acted as a constraint to growth in the past.
Limited supply of Grade A office accommodation has also restricted growth in Leicester City.
Recent evidence suggests the need for the following allocations of previously undeveloped employment land to support economic growth:
o 179,786 sq. m. of offices across the sub-region as a whole,
including:
An initial 31,410 sq.m. of offices in Charnwood North and Oadby & Wigston together with a potential further allocation in Phase 3 of the New Business Quarter (NBQ) in Leicester (to help meet a total PUA requirement of 131,980 sq.m.).
32,515 sq.m. of offices in Hinckley.
o 170.2 hectares of land for light industrial and small-scale warehousing, including:
Up to 90.2 ha for light industrial and warehousing in the
Leicester PUA. Up to 80 ha for light industrial and warehousing outside
the Leicester PUA.
o 50 hectares for a potential strategic road rail strategic distribution centre
There is increased demand for basic workspace and serviced offices from micro-businesses, notably amongst those serving local businesses and consumers
Demand is increasing from technology and creative based businesses for the innovation centres at De Montfort University, Loughborough University and the LCB Depot in Leicester. Businesses seek support with germination, incubation and growth as well as opportunities to network with other firms. These services and facilities will be key to securing inward investment, growing the knowledge economy and achieving sustainable economic growth.
Knowledge based businesses will require access to a world class ICT infrastructure. The evidence suggests that a significant area of rural Leicestershire is at risk of not having access to super-fast Broadband which could constrain growth.
Housing. Providing the right type and quality of housing in the right locations at the right price will be important to attract and retain people

Leicester and Leicestershire Economic Assessment 78 Summary
with the right skills for a prosperous and sustainable economy. Current issues include:
There is a need for a balance between the delivery of employment land/premises and housing in the future, the two need to be considered together along with wider infrastructure implications. Land availability will be a key and critical issue.
The development of the knowledge economy suggests an increased need to provide housing for recent graduates, growing families and highly mobile knowledge workers.
The considerable polarisation in the housing market at present, suggests a need to increase the quality of housing in the city and address affordability in rural areas to reduce polarisation.
There is a need to focus on the provision of a range of housing types across the sub-region to help to release availability and create a fully functioning housing market.
There is a high percentage of non-decent housing in the city and a lack of high quality four bed-roomed detached housing. This has contributed to city flight and could make it difficult to attract knowledge workers with families to live in the city itself.
The evidence suggests that there is a clear requirement for affordable housing everywhere and not just for lower income households but middle incomes as well.
At present, there is a mismatch between what developers will provide and evidenced need, which has a negative impact on viability and the ability to deliver affordable homes.
Priority 4 - Raising Skills Levels and Educational Attainment
Why this should be a priority:
23% of Leicester City’s working age resident population have no recognised qualifications (almost double the England figure of 12%). A further 13% of Leicester City residents have ‘other qualifications’ (e.g. overseas) that do not readily match to UK qualifications. This is a significant weakness in the local labour market, which could constrain economic growth, business performance and make the area appear less attractive to inward investors.
The area has a lower proportion of its working age residents with degree level qualifications than is the case nationally. In particular, a low proportion of Leicester City residents have degree level qualifications. Workforce qualifications are linked to the sector and occupational structure in the local economy and reflect a lack of graduate level opportunities in the labour market. The situation also suggests that the demand for high level skills is not as great as it could be amongst local employers.
From the business survey, 21% of businesses indicated that skills

Leicester and Leicestershire Economic Assessment 79 Summary
shortages were having a serious impact on their business, suggesting the need to continue to engage with employers to ensure that their needs are understood and that local training provision is aligned to these needs.
Many employers have commented on a lack of applicants that are ‘job ready’ especially young people. This suggests the need for stronger links between employers and schools, FE Colleges and local universities.
Employers are interested in apprenticeships as a means to fill technical skills gaps in their workforce and encourage young people to enter their sectors.
Over 50% of local businesses have identified some skills gaps in their current workforce, these are especially around customer care, communications skills, management and leadership, marketing/sales and job specific technical skills.
At least 12% of employers have identified skills gaps around basic literacy and numeracy, which is a key weakness in the local labour market.
About half the businesses in the local area employing less than ten people have spent nothing on formal training for their employees. Changes to government funding for skills could make this situation worse.
Why this should be a priority:
The UK as a whole is falling behind competitor nations in terms of education and the whole country needs to improve its performance in terms of education to remain globally competitive.
The marked poor performance of white young people resident in Leicester City, is evident as early as age 11 and carries forward to GCSE performance. This is especially pronounced in deprived neighbourhoods located in the west of the City.
Employers report a lack of applicants that are job ready
Overall, there has been a significant improvement in the proportion of pupils achieving five or more GCSEs at grades A*to C (including English and Maths) in both Leicester City and Leicestershire County between 2005 and 2010. Leicester City still performs below the national average on this indicator, with Leicestershire County performing above the national average.
Relatively high progression rates to higher education suggest that this is an opportunity that can be further developed.
Strategic Priority 5 - Providing Effective Business Support
Why this should be a priority:
Performance of local businesses is key to wealth generation, GVA growth and earnings growth in the local economy. Local GVA growth

Leicester and Leicestershire Economic Assessment 80 Summary
currently lags behind national figures and median earnings are relatively low.
Historically, the area has seen little job growth from inward investment and has relied upon indigenous businesses to generate job growth, suggesting a crucial need to provide high quality support to local businesses.
Private sector job growth has been low in Leicester City over the period 2003 to 2008. With the area facing public sector job losses, it will be particularly important for the private sector to generate job growth.
Many local businesses have growth aspirations, representing an opportunity for good quality support to help these businesses reach their potential.
The diverse local economic structure is dependent on businesses in all sectors performing well.
EMB’s research from summer 2010 indicates that businesses that have received support demonstrated a stronger turnover performance than those that had not accessed business support.
The high number of small businesses (although similar to that seen in the UK) poses a challenge for the delivery of business support, especially as recent research conducted by EMB Ltd. indicates a strong preference for face to face business support.
Three-year survival rates are below the national average in Leicester City suggesting a need for ongoing business support and not just support during the pre-start and start-up phases.
Over a third of local businesses have expressed concerns about competition and finding new business, indicating a need for support with sales/marketing, business planning and identifying new markets.
Businesses have continued to express concern about regulation and red tape.
Some businesses have indicated that access to finance and cash flow are of significant concern.
In the recent business survey, 21% of businesses identified skills shortages around management and supervisory skills and 50% identified some skills gaps in the current workforce.
Why this should be a priority:
To achieve GVA growth, wealth creation and higher wages requires some re-balancing of the economy. This can in part be achieved through the growth of indigenous businesses but encouraging and retaining investment can also make a significant contribution.
Job growth from inward investment in the past has represented a small proportion of total jobs in the economy.
Historically, the area has not presented a strong identity/image which
Strategic Priority 6 - Stimulating Investment and International Trade

Leicester and Leicestershire Economic Assessment 81 Summary
has inhibited the ability to attract inward investment to the sub-region. The availability of employment land and high quality office space has also deterred inward investment.
The presence of science and technology parks and three universities in the sub-region offers a significant opportunity to attract investment.
Our area has some large employers, from both foreign direct investment (FDI) and UK investment. Although only 0.6% of local businesses employ over 250 people, these few businesses account for over 30% of local employment. Retaining this investment in the sub-region is vitally important to the local economy, suggesting it is important to maintain and further develop relationships with these key companies and support their growth plans.
The strong manufacturing base and logistics sectors provide significant opportunities for international trade, which could be further developed as currently only 45% of local manufacturers are engaged in export activity.
Only 13% of service sector businesses export, again suggesting there is an opportunity to increase this, especially through growth of knowledge based service sector businesses.
The existing strong links with China and India could be further developed. This represents a significant opportunity given the rapid expansion of these economies.
Strategic Priority 7 - Growing the Green Economy
Why this should be a priority:
The challenging government target to reduce carbon dioxide emissions will require significant investment and there is considerable interest in this area nationally and internationally.
University expertise in green technology and pioneering organisations such as CENEX and Intelligent Energy based in Loughborough and MIRA provide a good foundation to develop and grow this sector.
Potential business opportunities to support the low carbon economy in terms of resource efficiency, renewable energy generation, fitting energy efficiency measures to new and existing buildings and vehicles, water conservation, air quality improvements, waste management reduction and recycling.
Over half local businesses have expressed concern about the rising cost of fuel and energy. This presents an opportunity to promote resource efficiency to businesses and encourage them to adopt sound environmental practices.
National Forest is a national example of environmental-led regeneration, demonstrating the potential for environmental projects to contribute to the local economy.
New housing growth areas provide opportunities to locate new houses closer to employment sites, encouraging more local working and greater

Leicester and Leicestershire Economic Assessment 82 Summary
sustainability.
Home working is relatively more important in rural areas and some districts such as North West Leicestershire, Harborough and Melton exhibit relatively high levels of self employment. Improvements to Broadband in rural areas will be important to encourage efficient and effective home working and new business start-ups in rural areas.
Strategic Priority 8 – Addressing economic inequalities and promoting social inclusion
Why this should be a priority:
There is considerable evidence of deprivation and social exclusion in the sub-region which could inhibit economic growth and discourage potential investors from coming to this sub-region. High levels of deprivation could also make it difficult to retain For example:
o Leicester is the 25th most deprived local authority nationally (ID 2010). Figures for Leicestershire have not been released but in 2007 it was ranked 146 of 149
o 41% of Leicester City’s neighbourhoods and five neighbourhoods within Leicestershire County fall within the 20% most deprived nationally
o 16.3% of working age residents in Leicester City are claiming out-of-work benefits
o In May 2011, 5.9% (12,187) of Leicester’ working age population (16-64) were claiming Job Seekers Allowance. In the County the figure was 2.2% and Sub Region 3.4%. The figure for the UK was 3.7%
o In Leicester the JSA claimant rate for men is 8% and for women is 3.8%. The UK figures are 5.1% and 2.4%
o The unemployment rate for Leicester (Jan 2010 – Dec 2010) is 11.4% (17,100). Although an improvement on the previous reporting quarter (0.4%) this still 3.7% higher than Great Britain (7.7%)
o At this time 12.4% (10,000) of the Leicester male and 10% (6,500) of the female working age populations were unemployed
o 12 wards in Leicester have unemployment rates that are over 10%. In the Charnwood ward this is 13.8% and the Spinney Hills ward 15.1%. The national average is 5.7%.
o In Spinney Hills the unemployment rate for men is 15%, at 15.1% female unemployment is higher. Spinney Hills is the only ward in the City where there is higher female unemployment
o Only 54.4% of working age females in Leicester City are in employment
o Oadby and Wigston has become eligible for ERDF funding o Poor educational performance amongst white young people living in
the west of the city o Low earnings and qualification levels amongst those living in
deprived neighbourhoods

Leicester and Leicestershire Economic Assessment 83 Summary
Table 11.1 Key Economic Statistics Leicester City and Leicestershire County
Measure Area Baseline Date Source
Leicester City £20,438 ONS - NUTS 3 GVA Statistics
GVA per head Leicestershire County £19,104 2008 Note: Leicestershire includes Rutland
England £21,049
Leicester City 99.5 ONS - NUTS3 GVA Statistics
GVA per head UK=100 Leicestershire County 93.0 2008 Note: Leicestershire includes Rutland
UK 100
Proportion of businesses reporting increased profits (last 12 months)
Leicester City 32% Leicester & Leicestershire Business Survey
Leicestershire County 34% Jan-11
LLEP Area 34%
Business Start-up Rate (per 10,000 population)
Leicester City 45.2 2009 BIS website - National Indicator 171
Leicestershire County 43.6 2009
GB 47.5 2009
Leicester City 61%
Business Survival Rates (3 years) Leicestershire County 69% 2009 Business Demography 2009
England 66%
Leicester City 62.2%
Employment Rate Leicestershire County 71.4% Jun-11
Annual Population Survey (APS) June 2010
GB 70.3%
Employers that are not experiencing skills shortages
Leicester City 82%
Leicestershire County 79% Jan-11
Leicester & Leicestershire Business Survey
LLEP Area 79%
% Working age population qualified to at least level 2
Leicester City 51.2%
Leicestershire County 70.3% Dec-09
Annual Population Survey (APS) Dec 2009
England 65.0%
% Working age population qualified to at least level 4
Leicester City 22.3%
Leicestershire County 29.5% Dec-
09 APS 2009
England 29.6%

Leicester and Leicestershire Economic Assessment 84 Summary
Measure Area Baseline Date Source
Median Weekly Earnings (Resident based)
Leicester City £397.7
Leicestershire County £500.2 2010 ONS - ASHE 2010
England £506.0
Median Weekly Earnings (Workplace based)
Leicester City £466.9
Leicestershire County £471.5 2010 ONS - ASHE 2010
England £504.5
Table 11.2 Key Demographic Statistics
Measure Area Baseline Date Source
Population Leicester City 304,700
Leicestershire County 644,700 Mid 2009 ONS June 2010
LLEP Area 949,400
% population that non-white British Leicester City 42%
Leicestershire County 10% Aug 2008
ONS Experimental Population Estimates by Ethnic Group - LAs
LLEP Area 20%
Key Transport Statistics Table 11.3a Congestion/ Journey Times Person journey time per mile during the morning peak on key routes in urban central Leicestershire (previous National Indicator 167) Urban Area Person journey times % change 04/05 to
09/10 2004/05 2007/08 2009/10
London 4.21 4.07 3.49 -12.2%
Greater Manchester 5.00 4.56 4.44 -5.5%
Bristol 3.57 3.44 3.35 -9.0%
Leicester 4.21 4.24 4.17 -1.7%
Nottingham 3.48 3.48 3.42 -2.6%
Average of all areas 4.16 4.08 3.57 -7.4% All figures shown in minutes and seconds Source: Department for Transport, Congestion Statistics, Statistical Release, February 2011

Leicester and Leicestershire Economic Assessment 85 Summary
11.3b Accessibility Access to employment by public transport, walking and cycling (previous National Indicator 176)
44
Area 2007 2008 2009
Derby 82.1% 81.9% 81.9%
Leicester 85.2% 85.4% 84.8%
Nottingham 85.3% 85.4% 85.6%
Derbyshire 80.1% 80.0% 80.0%
Leicestershire 80.1% 80.2% 79.9%
Nottinghamshire 79.9% 80.4% 80.3% Source: Department for Transport, 2009 Core Accessibility Indicators 11.3c Accessibility Extent to which employees being able to get to and from work by car / public transport is a concern for businesses in Leicester and Leicestershire
Indicator All Urban Rural
Percentage of businesses who expressed concern about employees being able to get to and from work by car
11% 11% 9%
Percentage of businesses who expressed concern about employees being able to get to and from work by public transport
22% 20% 40%
Source: Leicester and Leicestershire Business Survey, Winter 2011
11.3d Accessibility Extent to which customers being able to get to and from their premises by car / public transport is a concern for businesses in Leicester and Leicestershire
All Urban Rural
Percentage of businesses who expressed concern about customers being able to get to and from their premises by car
11% 11% 4%
Percentage of businesses who expressed concern about customers being able to get to and from their premises by public transport
17% 15% 31%
Source: Leicester and Leicestershire Business Survey, Winter 201
44 Note this indicator measures the percentage of people of working age (those aged between 16 and 74) living within the catchment area of a location with more than 500 jobs by public transport, demand responsive transport and / or walking and cycling.
![Leicester and Leicestershire Combined Authority Constitution...LLCA: means the Leicester and Leicestershire Combined Authority; LLCA Order: means [] made under the Local Democracy,](https://static.fdocuments.in/doc/165x107/601b5cc1ebc1c05ae72bb5e8/leicester-and-leicestershire-combined-authority-constitution-llca-means-the.jpg)