2014 Winnebago Minnie Winnie - Minne Winnie Premier Class C Motorhomes
Upload
meredith-maxwellCategory
view
218download
0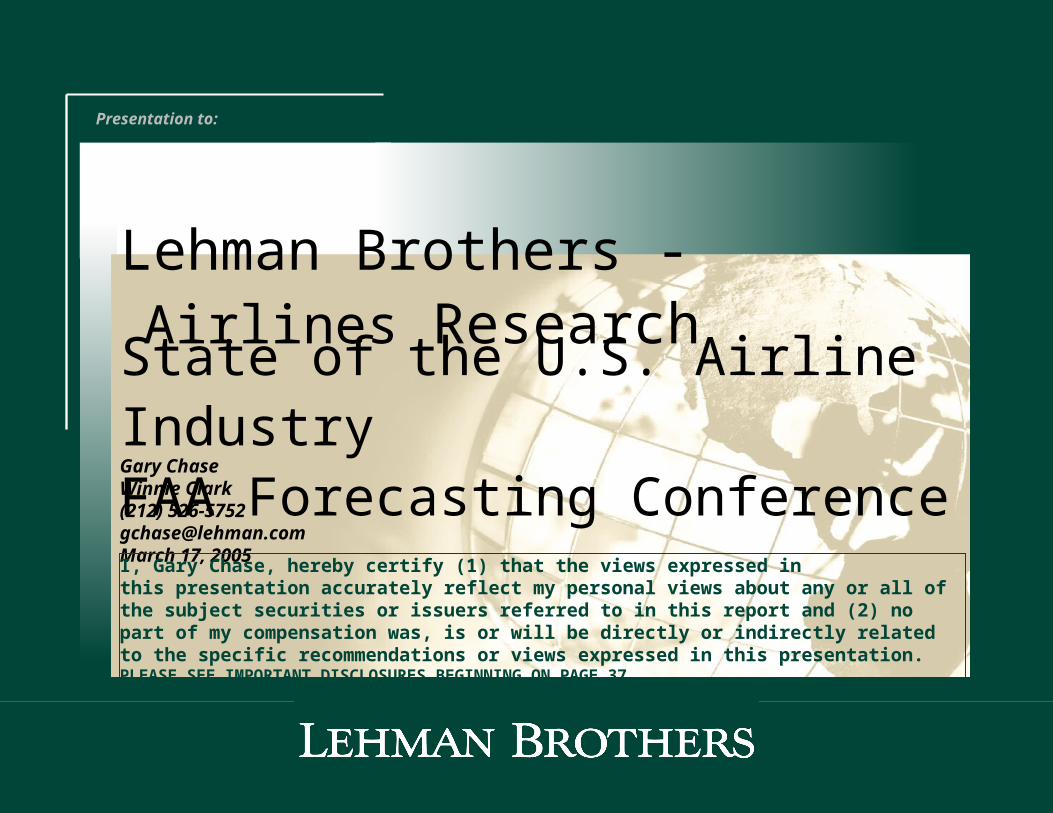
Lehman Brothers - Airlines Research
Presentation to:
Gary Chase Winnie Clark(212) [email protected] 17, 2005
State of the U.S. Airline IndustryFAA Forecasting Conference
I, Gary Chase, hereby certify (1) that the views expressed in this presentation accurately reflect my personal views about any or all of the subject securities or issuers referred to in this report and (2) no part of my compensation was, is or will be directly or indirectly related to the specific recommendations or views expressed in this presentation. PLEASE SEE IMPORTANT DISCLOSURES BEGINNING ON PAGE 37.
Airlines Research
Gary Chase – Winnie Clark
Industry Profitability Record Among The Worst In Corporate America
-15,000
-10,000
-5,000
0
5,000
10,000
15,000
20,000
1970 1975 1980 1985 1990 1995 2000 2005
Cumulative P&L Net ($mm) Net Annual Profit ($mm)
ATA Airline Net P&L ($mm)
Source: Air Transport Association, Lehman Brothers estimates.
1

Airlines Research
Gary Chase – Winnie Clark
Industry Keeps Piling On Debt To Stay In Business
0
20,000
40,000
60,000
80,000
100,000
120,000
’78 ’80 ’82 ’84 ’86 ’88 ’90 ’92 ’94 ’96 ’98 ’00 ’02
0%
20%
40%
60%
80%
100%
120%
Total Debt – Incl. PV Op Lease As % Revenue
Industry Total Debt as a % Revenue (1978–2003)
Source: Company Reports, DOT Form 41.
2
Airlines Research
Gary Chase – Winnie Clark
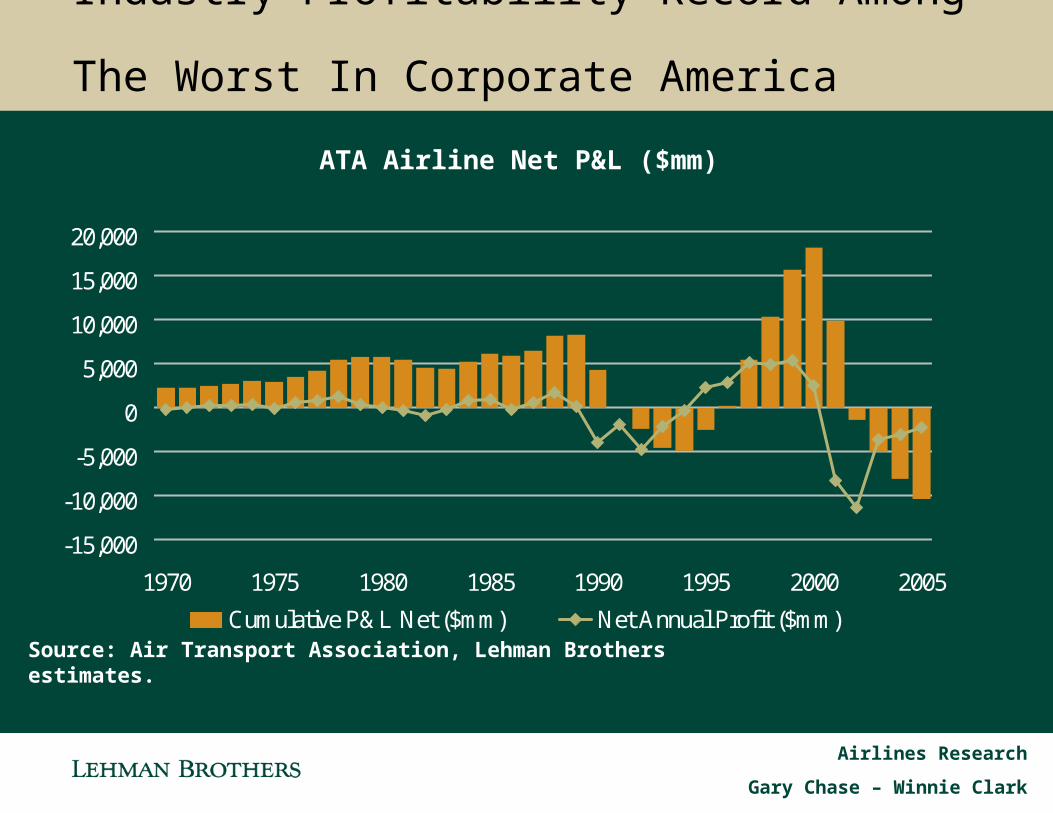
Conclusions – Restructuring Will Continue, Energy and Capital Access the Pacing Items
Whether we like it or not, our industry is in dire financial condition. Current losses are unsustainable. The business is restructuring and has accomplished more than many appreciate, but the current revenue environment combined with skyrocketing fuel prices means the industry cannot be profitable absent further change.
The extremity of the current environment is affecting everyone. No carrier is immune from these challenges. The cost of fuel and the amount of external capital available to the industry will set the required pace of restructuring and determine whether or not that restructuring needs to occur under judicial supervision.
We see further pain for ALL airline stakeholders, including labor, equipment suppliers, airports and municipalities, and lenders unless energy prices collapse or the economy takes a stunning turn for the better.
All stakeholders need to understand how acute the industry’s current challenges are and work to make the system less costly and more productive.
3

Airlines Research
Gary Chase – Winnie Clark
Airline Industry in Financial Distress – Road Ahead Challenging Long as Fuel Costs Stay High
Industry facing unprecedented challenges in the aftermath of 9/11. The economy is strong, businesses and consumers are spending, and GDP (the historical macro driver of the industry) has been growing at a reasonable rate, but industry financial results are still dismal.
The industry has taken painful steps to address this extreme adversity. Non-fuel profitability is as good as it has ever been; high fuel costs are consuming what would otherwise be an upcycle. Given high fuel costs, these painful steps, impressive as they may be, are inadequate.
We see only two ways to improve the current situation:
Marginal Revenue Improvement, or,
Absolute (NOT Unit) Cost Reduction.
4
Airlines Research
Gary Chase – Winnie Clark
Airline Industry in Financial Distress – Road Ahead Challenging Long as Fuel Costs Stay High
Industry facing unprecedented challenges in the aftermath of 9/11. The economy is strong, businesses and consumers are spending, and GDP (the historical macro driver of the industry) has been growing at a reasonable rate, but industry financial results are still dismal.
The industry has taken painful steps to address this extreme adversity. Non-fuel profitability is as good as it has ever been; high fuel costs are consuming what would otherwise be an upcycle. Given high fuel costs, these painful steps, impressive as they may be, are inadequate.
We see only two ways to improve the current situation:
Marginal Revenue Improvement, or,
Absolute (NOT Unit) Cost Reduction.
5

Airlines Research
Gary Chase – Winnie Clark
Industry Facing Unprecedented Challenges
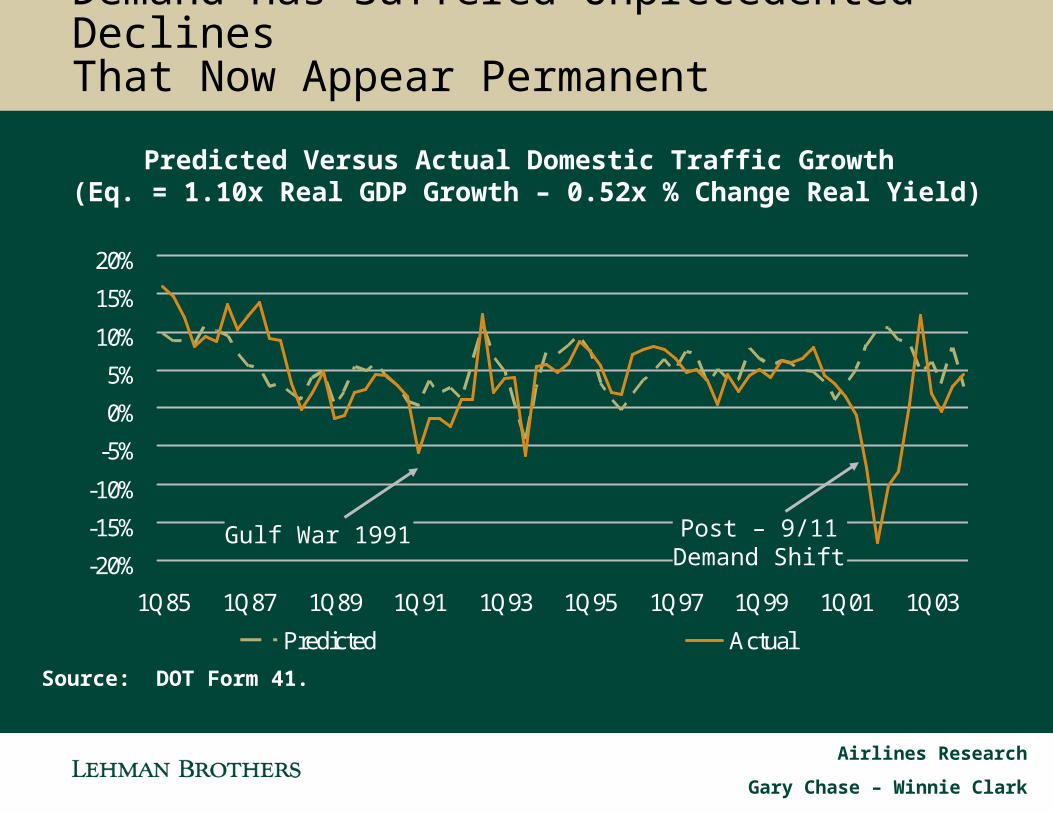
The aftermath of 9/11 saw a material adverse shift in the demand function for air travel. We believe demand is still some 10-15% below what it was in the summer of 2001.
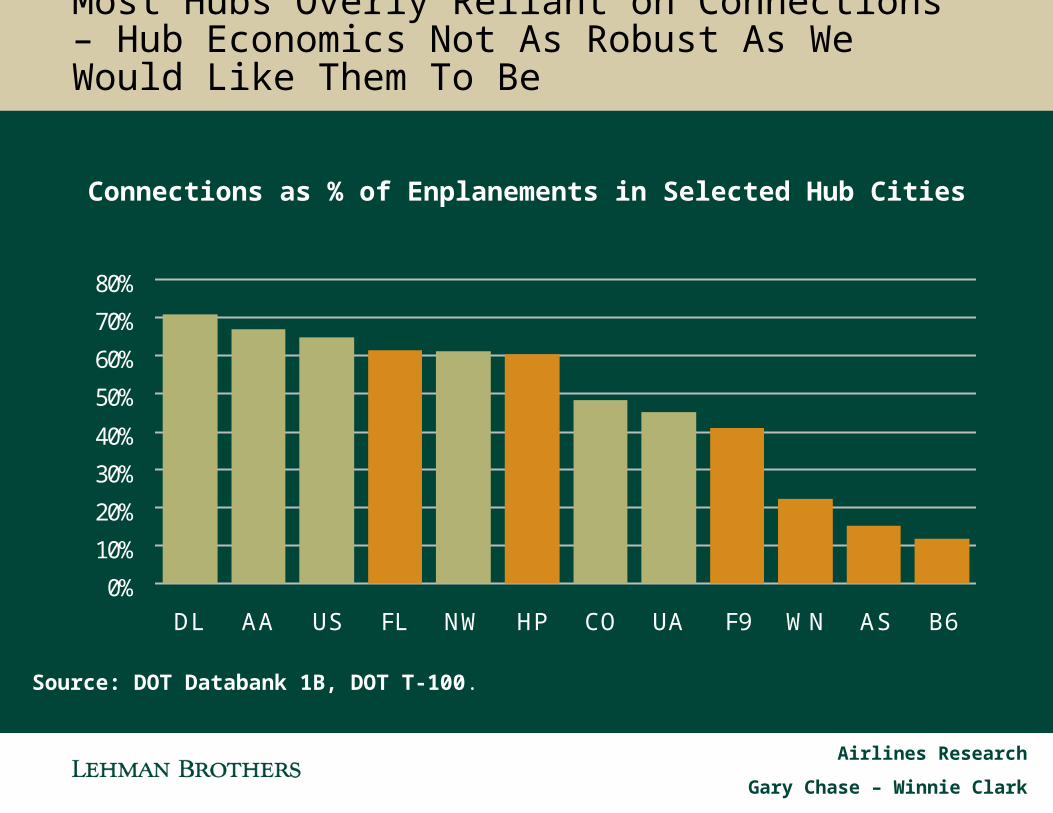
Hub economics are vulnerable and overly reliant on low value connecting traffic. This structure made sense in the days of a very elongated fare structure, but that structure no longer exists.
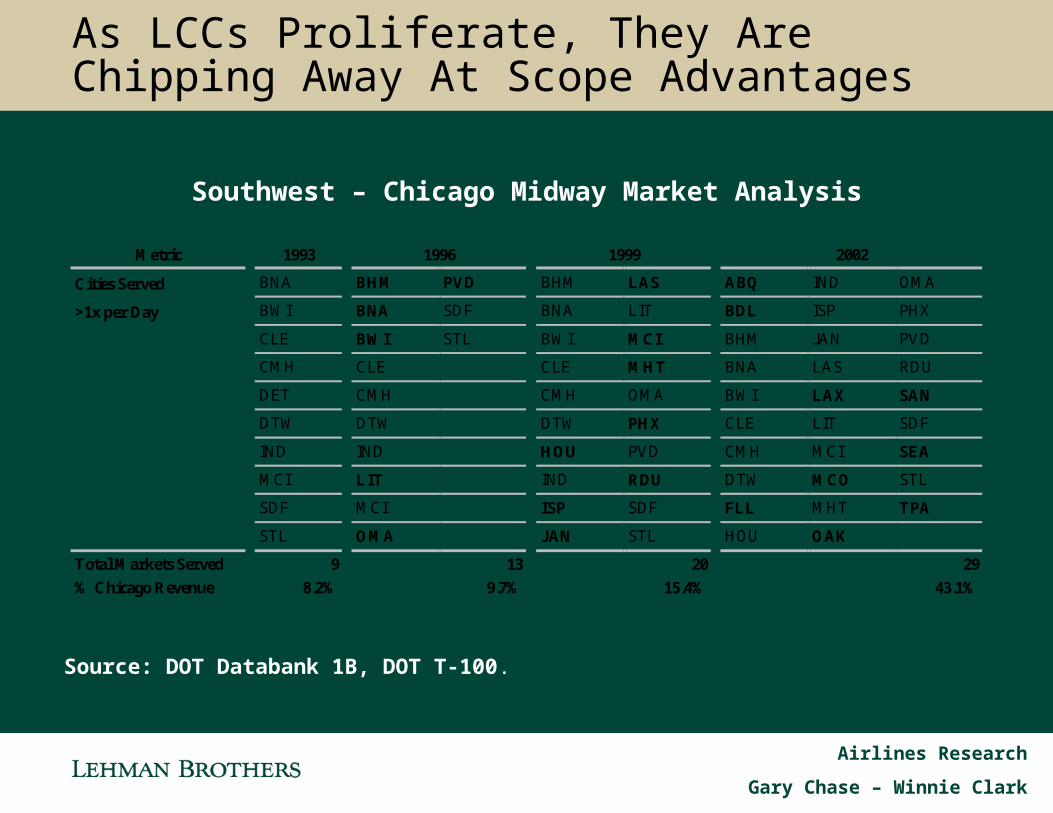
Increasingly capable low-cost carriers are infiltrating every part of the domestic entity.
That proliferation of low-fare carriers has finally forced the collapse of high-end business fares in the domestic entity.
6
Airlines Research
Gary Chase – Winnie Clark
Demand Has Suffered Unprecedented Declines That Now Appear Permanent
-20%
-15%
-10%
-5%
0%
5%
10%
15%
20%
1Q85 1Q87 1Q89 1Q91 1Q93 1Q95 1Q97 1Q99 1Q01 1Q03
Predicted Actual
Predicted Versus Actual Domestic Traffic Growth (Eq. = 1.10x Real GDP Growth – 0.52x % Change Real Yield)
Gulf War 1991 Post – 9/11Demand Shift
Source: DOT Form 41.
7

Airlines Research
Gary Chase – Winnie Clark
We See Continued Demand Shortfalls More than Three Years After 9/11
-30%
-25%
-20%
-15%
-10%
-5%
0%
OCT MAR AUG JAN JUN NOV APR SEP
Estimated Demand Shortfall (Domestic Only)
Source: Air Transport Association, Lehman Brothers estimates.
8

Airlines Research
Gary Chase – Winnie Clark
Large Local Markets Drive Hubs – Hub Economics Not As Robust As We Would Like Them To Be
0
5
10
15
20
25
’90 ’91 ’92 ’93 ’94 ’95 ’96 ’97 ’98 ’99 ’00 ’01 ’02 '03
Local Flow
Network Airlines – Weighted Ave LOH Yield
Source: DOT Databank 1B.
9
Airlines Research
Gary Chase – Winnie Clark
0%
10%
20%
30%
40%
50%
60%
70%
80%
DL AA US FL NW HP CO UA F9 WN AS B6
Connections as % of Enplanements in Selected Hub Cities
Most Hubs Overly Reliant on Connections – Hub Economics Not As Robust As We Would Like Them To Be
Source: DOT Databank 1B, DOT T-100.
10

Airlines Research
Gary Chase – Winnie Clark
Low-fare carriers have learned from the past and have much more of a franchise focus than at any point in history.
They also are defying conventional wisdom about LCCs by flying longer-hauls, creating upscale brand images, and building their presence in core cities.
In many cases, passengers prefer LCCs for reliability, consistently low fares, and, in some cases, a better product.
Low-Fare Airlines Are Getting It Right – A New Breed of Category Killer Is Emerging
Airline Franchise
Value
Network Presence
City Strength Brand
11
Airlines Research
Gary Chase – Winnie Clark
Metric 1993 1996 1999 2002
Cities Served BNA BHM PVD BHM LAS ABQ IND OMA
>1x per Day BWI BNA SDF BNA LIT BDL ISP PHX
CLE BWI STL BWI MCI BHM JAN PVD
CMH CLE CLE MHT BNA LAS RDU
DET CMH CMH OMA BWI LAX SAN
DTW DTW DTW PHX CLE LIT SDF
IND IND HOU PVD CMH MCI SEA
MCI LIT IND RDU DTW MCO STL
SDF MCI ISP SDF FLL MHT TPA
STL OMA JAN STL HOU OAK
Total Markets Served 9 13 20 29
% Chicago Revenue 8.2% 9.7% 15.4% 43.1%
Southwest – Chicago Midway Market Analysis
As LCCs Proliferate, They Are Chipping Away At Scope Advantages
Source: DOT Databank 1B, DOT T-100.
12

Airlines Research
Gary Chase – Winnie Clark
Nonstop Milage Passengers per Day Each Way (PDEW)
0–100 100–200 200–300 300–400 400–500 500–600 600+
0–249 $0.71 $0.65 $0.61 $0.46 $0.50 $0.34 $0.34
250–499 $0.39 $0.36 $0.30 $0.31 $0.29 $0.27 $0.22
500–749 $0.24 $0.22 $0.23 $0.21 $0.18 $0.20 $0.18
750–999 $0.17 $0.15 $0.15 $0.18 $0.15 $0.15 $0.14
1,000–1,249 $0.14 $0.12 $0.13 $0.12 $0.12 $0.13 $0.11
1,250–1,499 $0.12 $0.11 $0.10 $0.12 $0.11 $0.12 $0.12
1,500–1,749 $0.11 $0.10 $0.11 $0.10 $0.11 $0.10 $0.10
1,750–1,999 $0.10 $0.08 $0.08 $0.09 $0.08 $0.09 $0.08
2,000+ $0.08 $0.07 $0.07 $0.07 $0.07 $0.07 $0.08
Analysis of Average Fares by Market Density (Nonstop Yield)
Shifting The Cost Burden To Selected Routes Only Attracts Entry – JetBlue Looking At Smaller Markets
Source: DOT Databank 1B.
13

Airlines Research
Gary Chase – Winnie Clark
0%
10%
20%
30%
40%
50%
60%
AMR CAL DAL UAL AMR CAL DAL UAL AMR UAL AMR UAL
% Revenue from Passengers Paying Fares >$1,000
JFK-LAX JFK-SFO BOS-LAX BOS-SFO
Shifting The Cost Burden To Selected Routes Only Attracts Entry – Will Virgin Go Upmarket In The Transcon?
Source: DOT Databank 1B.
14

Airlines Research
Gary Chase – Winnie Clark
Major Airlines Generate a Lot of Revenue Above SimpliFares Price Points
-12%
-10%
-8%
-6%
-4%
-2%
0%
CO NW AA UA US DL AS HP FL WN F9 B6
$499 $349
Estimated Dilutive Impact of Potential Simplifares on Domestic Revenue
LCC Proliferation Has Finally Forced a Reductionin the Highest Business Fares
Source: DOT Databank 1B.
15

Airlines Research
Gary Chase – Winnie Clark
Energy Prices at Record Highs (Unadjusted for Inflation)
$0
$20
$40
$60
Feb-6
7
Mar
-70
Apr-7
3
May
-76
Jun-
79
Jul-8
2
Aug-8
5
Sep-8
8
Oct-91
Nov-9
4
Dec-9
7
Jan-
01
Feb-0
4
Long-Term Crude Prices (1967–Present )
As If We Needed More Challenges, Energy Prices are Skyrocketing
Source: FreeLunch.com.
16
Airlines Research
Gary Chase – Winnie Clark
Airline Industry in Financial Distress – Road Ahead Challenging Long as Fuel Costs Stay High
Industry facing unprecedented challenges in the aftermath of 9/11. The economy is strong, businesses and consumers are spending, and GDP (the historical macro driver of the industry) has been growing at a reasonable rate, but industry financial results are still dismal.
The industry has taken painful steps to address this extreme adversity. Non-fuel profitability is as good as it has ever been; high fuel costs are consuming what would otherwise be an upcycle. Given high fuel costs, these painful steps, impressive as they may be, are inadequate.
We see only two ways to improve the current situation:
Marginal Revenue Improvement, or,
Absolute (NOT Unit) Cost Reduction.
17

Airlines Research
Gary Chase – Winnie Clark
Industry Has Taken Painful Steps to Address the Current Adversity
Industry adversity has forced material sacrifices from labor groups at the network airlines; labor rates have converged with LCCs.
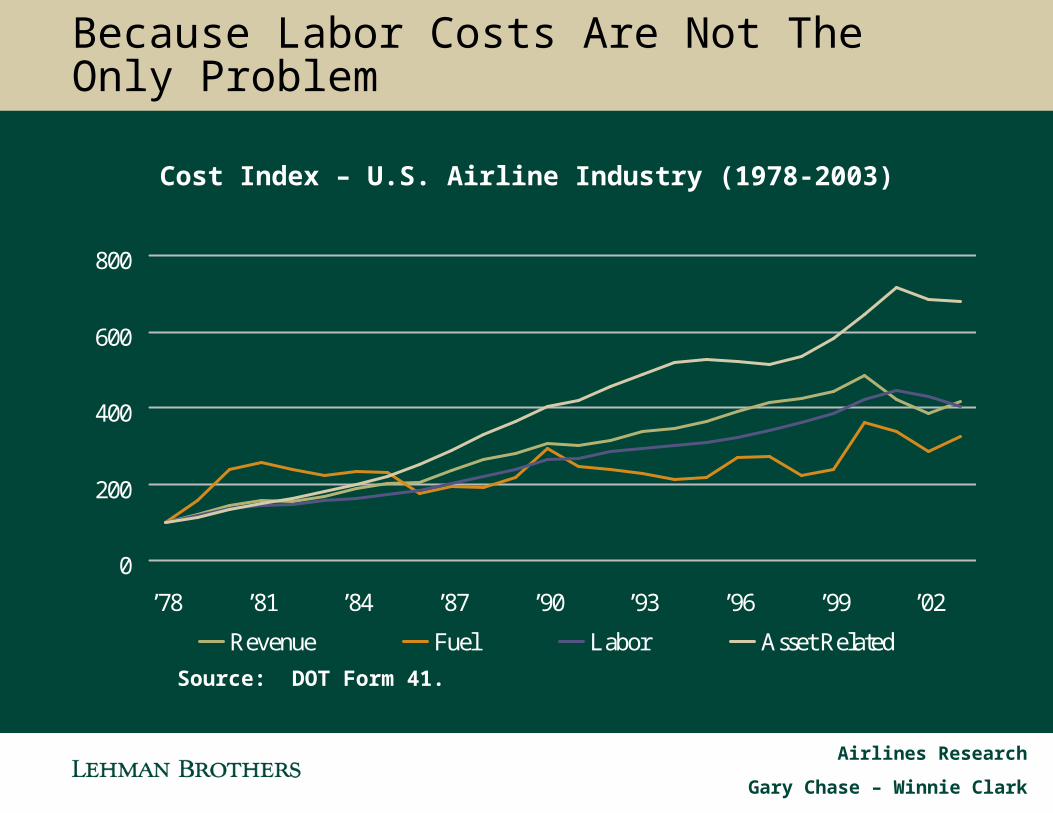
Industry has also made progress on non-labor costs, but that progress has been less impressive. The costs of insurance, security, and airport landing fees and rentals have also risen to offset some of what might otherwise look like progress.
Non-fuel operating profitability is as good as it has ever been for the industry, but that is little comfort when oil prices are above $50. Based on current energy price expectations, we see continued massive losses. LCCs are not immune from current industry duress.
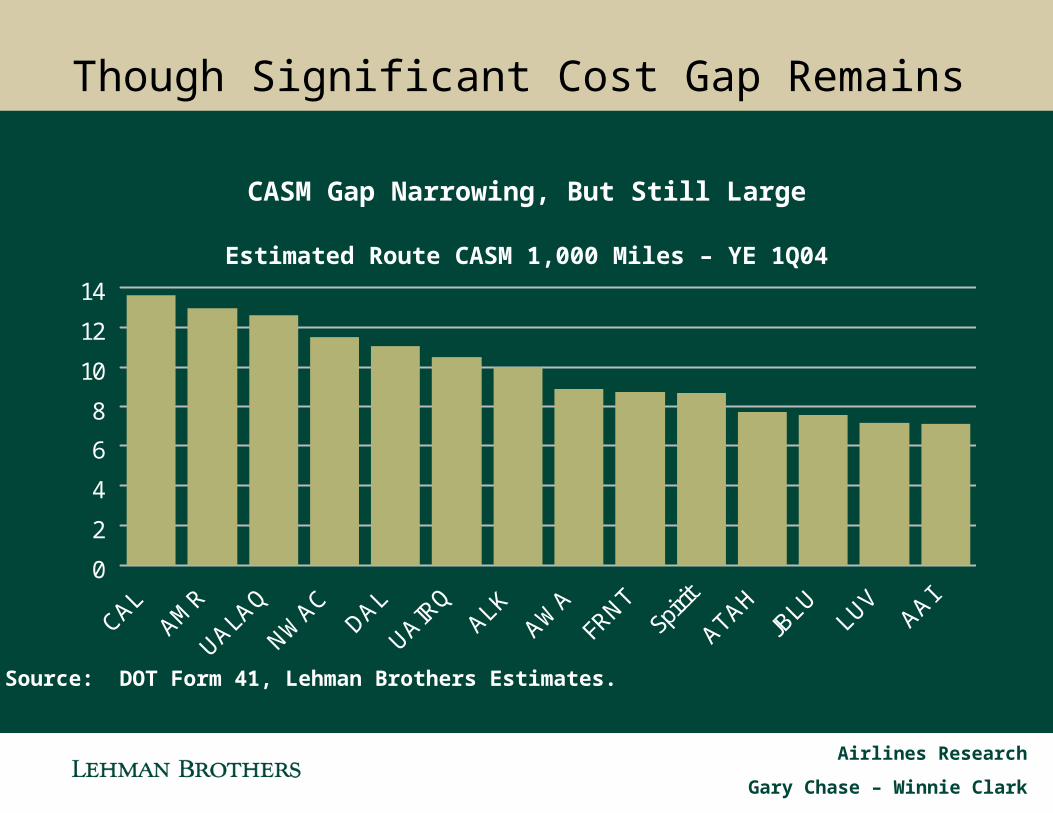
The need for further cost progress by the industry is also underscored by the continued cost gap between network carriers and the best LCCs.
18

Airlines Research
Gary Chase – Winnie Clark
Labor Rates Have Declined Substantially for the Network Carriers
Network Airline Labor Groups Have Made Large Sacrifices
0
50
100
150
200
250
300
350
737 757 747
2001 2005
United 12-Year Captain Wage Rate Comparisons – 2001/2002 vs. 2005
Source: AIR, Inc., contracts, airlinepilotpay.com.
19

Airlines Research
Gary Chase – Winnie Clark
Labor Rates Have Converged Between Network Carriers and LCCs
Labor Rates Are Converging Between LCCs and the Network Airlines
0
50
100
150
200
250
300
350
AS WN F9 B6 FL HP NW DL AA CO UA US
Pilot Wage Rate Comparisons Small Narrowbodies – 2005
Low-Fare Network
Source: AIR, Inc., contracts, Lehman Brothers estimates.
20
Airlines Research
Gary Chase – Winnie Clark
Though Significant Cost Gap Remains
CASM Gap Narrowing, But Still Large
0
2
4
6
8
10
12
14
CALAM
R
UALAQ
NWAC
DAL
UAIRQ
ALKAW
AFRNT
Spirit
ATAHJB
LULUV
AAI
Estimated Route CASM 1,000 Miles – YE 1Q04
Source: DOT Form 41, Lehman Brothers Estimates.
21
Airlines Research
Gary Chase – Winnie Clark
Because Labor Costs Are Not The Only Problem
0
200
400
600
800
’78 ’81 ’84 ’87 ’90 ’93 ’96 ’99 ’02
Revenue Fuel Labor Asset Related
Cost Index – U.S. Airline Industry (1978-2003)
Source: DOT Form 41.
22

Airlines Research
Gary Chase – Winnie Clark
Non-Labor Cost Progress Less Impressive, But Other Costs Post 9/11 Masking Some Progress
0
1
2
3
4
5
6
UA CO AA US F9 DL AS HP NW TZ NK FL B6 WN
1999 2001 2003
Non-Fuel/Labor Unit Cost Trends (Stage Length Adjusted to 1,000 Miles)
Source: DOT Form 41, Company reports, Lehman Brothers estimates.
23

Airlines Research
Gary Chase – Winnie Clark
Non-Fuel Operating Profitability as Good as it Has Ever Been
Non-fuel Profits Very Impressive…If Only Fuel Were Still at $20
-15,000
-10,000
-5,000
0
5,000
10,000
15,000
20,000
25,000
’78 ’80 ’82 ’84 ’86 ’88 ’90 ’92 ’94 ’96 ’98 ’00 ’02 ’04
Operating Profit Operating Profit Ex-Fuel
Historical Industry Profit from Operations – Reported and Excluding Fuel
Source: DOT Form 41, company reports, Lehman Brothers estimates.
24

Airlines Research
Gary Chase – Winnie Clark
But With High Fuel Costs, We See Continued Massive Losses; LCCs are Not Immune
Given High Fuel Prices, We Are Still Forecasting Substantial Industry Losses
-4000
-3000
-2000
-1000
0
2004A 2005E 2006E
Projected Pre-tax Loss for Coverage Universe
Source: Company reports, Lehman Brothers estimates.
25
Airlines Research
Gary Chase – Winnie Clark
Airline Industry in Financial Distress – Road Ahead Challenging Long as Fuel Costs Stay High
Industry facing unprecedented challenges in the aftermath of 9/11. The economy is strong, businesses and consumers are spending, and GDP (the historical macro driver of the industry) has been growing at a reasonable rate, but industry financial results are still dismal.
The industry has taken painful steps to address this extreme adversity. Non-fuel profitability is as good as it has ever been; high fuel costs are consuming what would otherwise be an upcycle. Given high fuel costs, these painful steps, impressive as they may be, are inadequate.
We see only two ways to improve the current situation:
Marginal Revenue Improvement, or,
Absolute (NOT Unit) Cost Reduction.
26
Airlines Research
Gary Chase – Winnie Clark
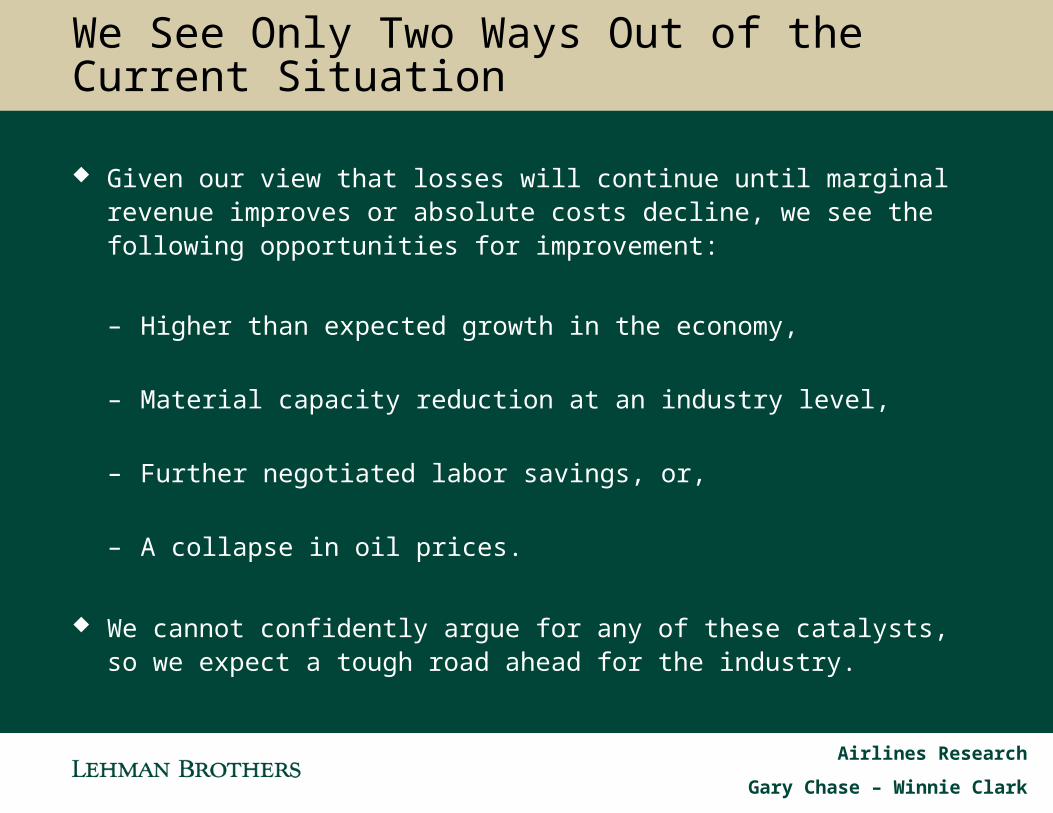
We See Only Two Ways Out of the Current Situation
Given our view that losses will continue until marginal revenue improves or absolute costs decline, we see the following opportunities for improvement:
– Higher than expected growth in the economy,
– Material capacity reduction at an industry level,
– Further negotiated labor savings, or,
– A collapse in oil prices.
We cannot confidently argue for any of these catalysts, so we expect a tough road ahead for the industry.
27

Airlines Research
Gary Chase – Winnie Clark
-4%
0%
4%
8%
12%
Majors LCCs Mainline With Regionals
Utilization Fleet
Capacity Growth Still Outpacing GDP
Airline Revenue Has Historically Grown with GDP
U.S. Airlines Capacity Growth Assumptions – 2005
GDP Forecast = 3.4%
GDP Upper Bound = 4.9%
Source: Company reports, DOT Form 41, Lehman Brothers estimates, BACK Aviation.
28
Airlines Research
Gary Chase – Winnie Clark
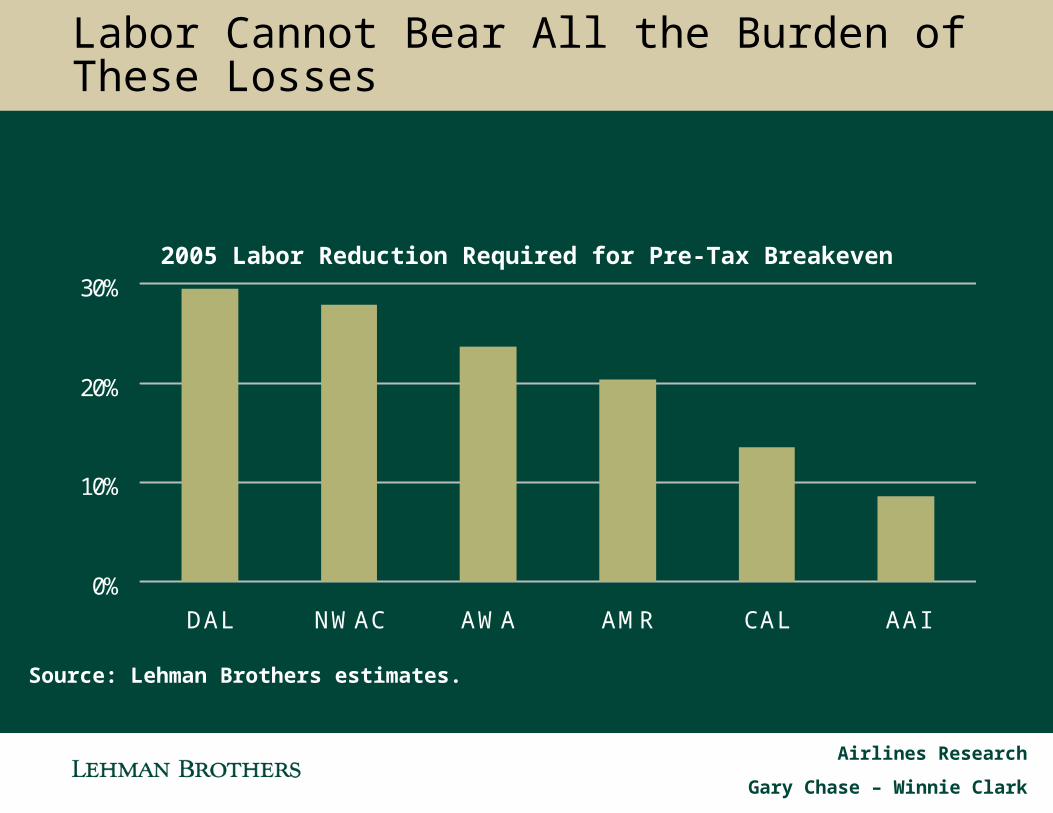
Labor Cannot Bear All the Burden of These Losses
0%
10%
20%
30%
DAL NWAC AWA AMR CAL AAI
2005 Labor Reduction Required for Pre-Tax Breakeven
Source: Lehman Brothers estimates.
29

Airlines Research
Gary Chase – Winnie Clark
Historical Volatility of Oil Says a Collapse in Energy Prices Unlikely
We Hope for Lower Oil Prices, But Historical Volatility Not on Our Side
100% 100% 98%91%
80%
64%
48%
33%22%
0%
20%
40%
60%
80%
100%
120%
20 25 30 35 40 45 50 55 60
Cumulative Probability of Oil Price Points for 2006 –Assuming Historical Volatility of Oil
(Based on Forward Curve)
Source: Lehman Brothers estimates, Bloomberg.
30
Airlines Research
Gary Chase – Winnie Clark
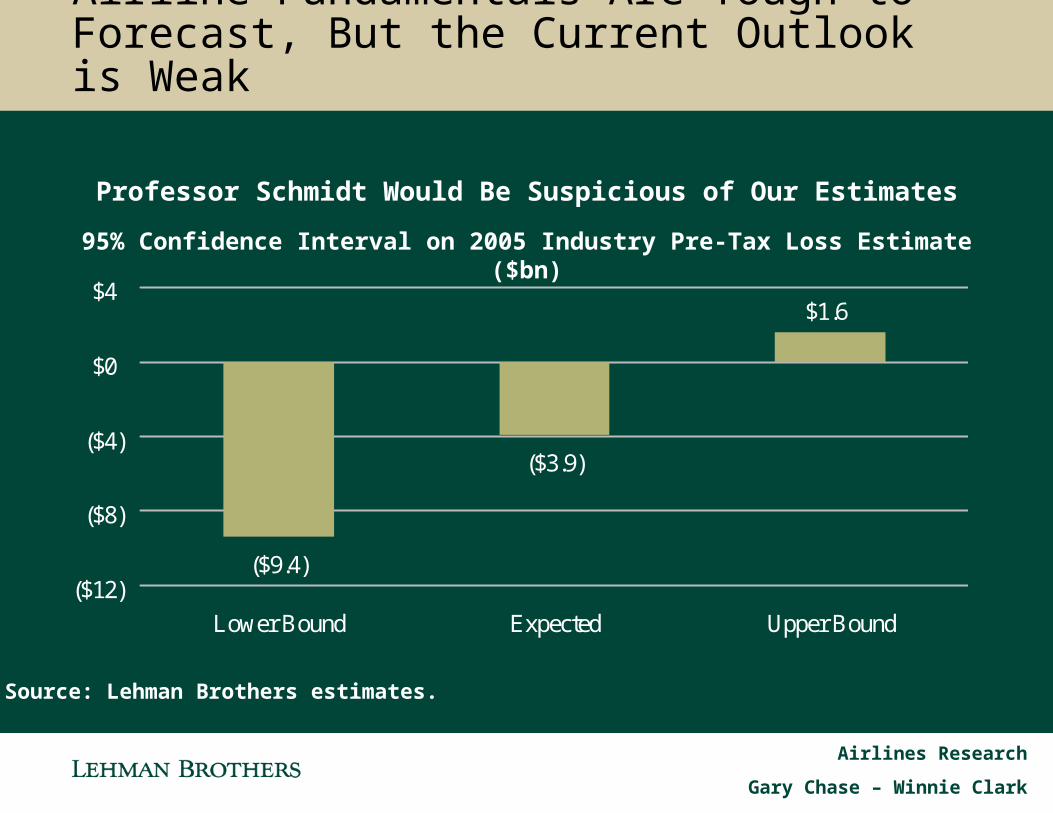
Airline Fundamentals Are Tough to Forecast, But the Current Outlook is Weak
Professor Schmidt Would Be Suspicious of Our Estimates
($3.9)
$1.6
($9.4)($12)
($8)
($4)
$0
$4
Lower Bound Expected Upper Bound
95% Confidence Interval on 2005 Industry Pre-Tax Loss Estimate ($bn)
Source: Lehman Brothers estimates.
31

Airlines Research
Gary Chase – Winnie Clark
Airline Industry in Financial Distress – Road Ahead Challenging Long as Fuel Costs Stay High
Industry facing unprecedented challenges in the aftermath of 9/11. The economy is strong, businesses and consumers are spending, and GDP (the historical macro driver of the industry) has been growing at a reasonable rate, but industry financial results are still dismal.
The industry has taken painful steps to address this extreme adversity. Non-fuel profitability is as good as it has ever been; high fuel costs are consuming what would otherwise be an upcycle. Given high fuel costs, these painful steps, impressive as they may be, are inadequate.
We see only two ways to improve the current situation:
Marginal Revenue Improvement, or,
Absolute (NOT Unit) Cost Reduction.
32

Airlines Research
Gary Chase – Winnie Clark
Conclusions - Restructuring Will Continue, Energy and Capital Access the Pacing Items
Whether we like it or not, our industry is in dire financial condition. Current losses are unsustainable. The business is restructuring and has accomplished more than many appreciate, but the current revenue environment combined with skyrocketing fuel prices means the industry cannot be profitable absent further change.
The extremity of the current environment is affecting everyone. No carrier is immune from these challenges. The cost of fuel and the amount of external capital available to the industry will set the required pace of restructuring and determine whether or not that restructuring needs to occur under judicial supervision.
We see further pain for ALL airline stakeholders, including labor, equipment suppliers, airports and municipalities, and lenders unless energy prices collapse or the economy takes a stunning turn for the better.
All stakeholders need to understand how acute the industry’s current challenges are and work to make the system less costly and more productive.
33
Airlines Research
Gary Chase – Winnie Clark
Risk Disclosure
Investing in airline stocks is very risky. Airline stocks have historically underperformed broader market averages by significant margins when measured over long periods of time. Our recommendations are based on historical trading patterns and our profit expectations, which are subject to a high degree of risk. Our profit expectations for individual companies hinge on our revenue assumptions, which depend entirely on assumptions we make regarding economic growth, the demand for leisure and business travel, the impact of competition from low-fare carriers, and industry-wide aircraft capacity decisions. Our profit expectations also depend on assumptions we make about the cost of jet fuel (historically a volatile commodity), the impact on revenue and expenses of potential labor disruptions, and the impact of any number of geopolitical events and terrorism risks on the demand for air travel, among other things. The combination of heavy operating and financial leverage along with the volatile nature of the underlying assumptions means that our profit expectations, targets, and ratings are subject to rapid, frequent, and material change.
34

Airlines Research
Gary Chase – Winnie Clark
Analyst Certification:
I, Gary Chase, hereby certify (1) that the views expressed in this research email accurately reflect my personal views about any or all of the subject securities or issuers referred to in this email and (2) no part of my compensation was, is or will be directly or indirectly related to the specific recommendations or views expressed in this email.
This material has been prepared and/or issued by Lehman Brothers Inc., member SIPC, and/or one of its affiliates ("Lehman Brothers") and has been approved by Lehman Brothers International (Europe), authorized and regulated by the Financial Services Authority, in connection with its distribution in the European Economic Area. This material is distributed in Japan by Lehman Brothers Japan Inc., and in Hong Kong by Lehman Brothers Asia Limited. This material is distributed in Australia by Lehman Brothers Australia Pty Limited, and in Singapore by Lehman Brothers Inc., Singapore Branch. This material is distributed in Korea by Lehman Brothers International (Europe) Seoul Branch. This document is for information purposes only and it should not be regarded as an offer to sell or as a solicitation of an offer to buy the securities or other instruments mentioned in it. No part of this document may be reproduced in any manner without the written permission of Lehman Brothers. With the exception of disclosures relating to Lehman Brothers, this research report is based on current public information that Lehman Brothers considers reliable, but we make no representation that it is accurate or complete, and it should not be relied on as such. In the case of any disclosure to the effect that Lehman Brothers Inc. or its affiliates beneficially own 1% or more of any class of common equity securities of the subject company, the computation of beneficial ownership of securities is based upon the methodology used to compute ownership under Section 13(d) of the United States' Securities Exchange Act of 1934. In the case of any disclosure to the effect that Lehman Brothers Inc. and/or its affiliates hold a short position of at least 1% of the outstanding share capital of a particular company, such disclosure relates solely to the ordinary share capital of the company. Accordingly, while such calculation represents Lehman Brothers' holdings net of any long position in the ordinary share capital of the company, such calculation excludes any rights or obligations that Lehman Brothers may otherwise have, or which may accrue in the future, with respect to such ordinary share capital. Similarly such calculation does not include any shares held or owned by Lehman Brothers where such shares are held under a wider agreement or arrangement (be it with a client or a counterparty) concerning the shares of such company (e.g. prime broking and/or stock lending activity). Any such disclosure represents the position of Lehman Brothers as of the last business day of the calendar month preceding the date of this report.
35
Airlines Research
Gary Chase – Winnie Clark
Guide to Lehman Brothers Equity Research Rating System:
Our coverage analysts use a relative rating system in which they rate stocks as 1-Overweight, 2-Equal weight or 3-Underweight (see definitions below) relative to other companies covered by the analyst or a team of analysts that are deemed to be in the same industry sector (the “sector coverage universe”). To see a list of the companies that comprise a particular sector coverage universe, please go to www.lehman.com/disclosures
In addition to the stock rating, we provide sector views which rate the outlook for the sector coverage universe as 1-Positive, 2-Neutral or
3-Negative (see definitions below). A rating system using terms such as buy, hold and sell is not the equivalent of our rating system. Investors should carefully read the entire research report including the definitions of all ratings and not infer its contents from ratings alone.
1-Overweight - The stock is expected to outperform the unweighted expected total return of the sector coverage universe over a 12-month investment horizon.
2-Equal weight - The stock is expected to perform in line with the unweighted expected total return of the sector coverage universe over a 12-month investment horizon.
3-Underweight - The stock is expected to underperform the unweighted expected total return of the sector coverage universe over a 12-month investment horizon.
RS-Rating Suspended - The rating and target price have been suspended temporarily to comply with applicable regulations and/or firm policies in certain circumstances including when Lehman Brothers is acting in an advisory capacity on a merger or strategic transaction involving the company.
Sector View
1-Positive - sector coverage universe fundamentals/valuations are improving.
2-Neutral - sector coverage universe fundamentals/valuations are steady, neither improving nor deteriorating.
3-Negative - sector coverage universe fundamentals/valuations are deteriorating.
36
Airlines Research
Gary Chase – Winnie Clark
Distribution of Ratings:
Lehman Brothers Global Equity Research has 1665 companies under coverage.
39% have been assigned a 1-Overweight rating which, for purposes of mandatory disclosures, is classified as a Buy rating, 37% of companies with this rating are investment banking clients of the firm.
42% have been assigned a 2-Equal weight rating which, for purposes of mandatory disclosures, is classified as a Hold rating, 8% of companies with this rating are investment banking clients of the firm.
19% have been assigned a 3-Underweight rating which, for purposes of mandatory disclosures, is classified as a Sell rating, 68% of companies with this rating are investment banking clients of the firm.
This material has been prepared and/or issued by Lehman Brothers Inc., member SIPC, and/or one of its affiliates ("Lehman Brothers") and has been approved by Lehman Brothers International (Europe), authorized and regulated by the Financial Services Authority, in connection with its distribution in the European Economic Area. This material is distributed in Japan by Lehman Brothers Japan Inc., and in Hong Kong by Lehman Brothers Asia Limited. This material is distributed in Australia by Lehman Brothers Australia Pty Limited, and in Singapore by Lehman Brothers Inc., Singapore Branch. This material is distributed in Korea by Lehman Brothers International (Europe) Seoul Branch. This document is for information purposes only and it should not be regarded as an offer to sell or as a solicitation of an offer to buy the securities or other instruments mentioned in it. No part of this document may be reproduced in any manner without the written permission of Lehman Brothers. With the exception of disclosures relating to Lehman Brothers, this research report is based on current public information that Lehman Brothers considers reliable, but we make no representation that it is accurate or complete, and it should not be relied on as such. In the case of any disclosure to the effect that Lehman Brothers Inc. or its affiliates beneficially own 1% or more of any class of common equity securities of the subject company, the computation of beneficial ownership of securities is based upon the methodology used to compute ownership under Section 13(d) of the United States' Securities Exchange Act of 1934.
37
Airlines Research
Gary Chase – Winnie Clark
In the case of any disclosure to the effect that Lehman Brothers Inc. and/or its affiliates hold a short position of at least 1% of the outstanding share capital of a particular company, such disclosure relates solely to the ordinary share capital of the company. Accordingly, while such calculation represents Lehman Brothers' holdings net of any long position in the ordinary share capital of the company, such calculation excludes any rights or obligations that Lehman Brothers may otherwise have, or which may accrue in the future, with respect to such ordinary share capital. Similarly such calculation does not include any shares held or owned by Lehman Brothers where such shares are held under a wider agreement or arrangement (be it with a client or a counterparty) concerning the shares of such company (e.g. prime broking and/or stock lending activity). Any such disclosure represents the position of Lehman Brothers as of the last business day of the calendar month preceding the date of this report.
This material is provided with the understanding that Lehman Brothers is not acting in a fiduciary capacity. Opinions expressed herein reflect the opinion of Lehman Brothers and are subject to change without notice. The products mentioned in this document may not be eligible for sale in some states or countries, and they may not be suitable for all types of investors. If an investor has any doubts about product suitability, he should consult his Lehman Brothers representative. The value of and the income produced by products may fluctuate, so that an investor may get back less than he invested. Value and income may be adversely affected by exchange rates, interest rates, or other factors. Past performance is not necessarily indicative of future results. If a product is income producing, part of the capital invested may be used to pay that income. © 2005 Lehman Brothers. All rights reserved. Additional information is available on request. Please contact a Lehman Brothers entity in your home jurisdiction.
Lehman Brothers policy for managing conflicts of interest in connection with investment research is available at www.lehman.com/researchconflictspolicy. Ratings, earnings per share forecasts and price targets contained in the Firm's equity research reports covering U.S. companies are available at www.lehman.com/disclosures.
38