Legrand Slideshow 2011 Q1 · 2018-01-09 · the Indian retail market €35m sales 12,000 retail...
30
2011 First-quarter results 2011 First-quarter results May 5, 2011
Transcript of Legrand Slideshow 2011 Q1 · 2018-01-09 · the Indian retail market €35m sales 12,000 retail...

2011 First-quarter results2011 First-quarter resultsMay 5, 2011

Contents
Highlights
Rise in net sales
Innovation & new product launches
3
4 to 7
8 to 11
22011 Q1 results
Acquisitions
Profitability and cash generation
12 to 17
18 to 22
Appendices 23 to 30

Highlights
Rise in net sales Fast-growing sales in new economies and newbusiness segments
Favorable base for year-on-year comparison in Franceand in Italy in 2010 Q1
Innovation Numerous new product launches
32011 Q1 results
Numerous new product launches
Acquisitions Strong momentum in acquisition-driven growth, in linewith Legrand’s strategy
Structural nature of the level of profitabilityachieved in 2010
Legrand fully in line with its 2011 targets

Rise in Net Sales
9.0% lfl(1) sales growth
15.8% lfl(1) rise in sales in neweconomies
16.7% lfl(1) growth in newbusiness segments
9121,036
+13.7%total growth
€ millions
Rise inNet Sales
42011 Q1 results
Particularly favorable base forcomparison in France and Italy
Positive effect of more than 3percentage points on 2011 Q1growth that will be reversed bystages
Excluding the comparison basisimpact, 2011 Q1 lfl(1) salesgrowth is fully in line withLegrand’s target for 2011
1. Like-for-like: at constant scope of consolidation and exchange rates
Q1 2010 Q1 2011

Rise in Net Sales
Group total €1,036m +13.7% +9.0% lfl(1)
France: €254m
+12.1% lfl(1)
- Strong performances in wiring devices
- Excellent showings in cable management,digital infrastructures and home systems
- Favorable base for comparison
Italy: €179m
+10.1% lfl(1)
- Vigorous trends in cable management,
USA & Canada: €136m
+5.2% lfl(1)
- Good showings for wire-mesh cablemanagement
- Firm trends in energy-efficient lighting
Rise inNet Sales
52011 Q1 results
- Vigorous trends in cable management,energy distribution and industrialapplications
- Favorable base for comparison
Rest of the World: €276m
+11.6% lfl(1)
- Continued very strong sales growth in neweconomies as a whole
- in particular in Asia and Latin America
- Firm trends in energy-efficient lightingcontrols and digital infrastructures
1. Like-for-like: at constant scope of consolidation and exchange rates
Rest of Europe: €191m
+3.7% lfl(1)
- Strong growth in sales in Russia andTurkey
- Improved trends in most eastern Europeancountries and in the UK
- offsetting persistent difficulties in southernEurope, the Netherlands and Belgium

Rise in Net Sales
Strong growth +26.6% (lfl(1) +15.8%)
Best performers in Q1 2011 India, Russia, China, Brazil, Turkey, Chile, Peru
35%(2) of total net sales in 2011 FY
New economies
Growth +8.5% (lfl(1) +6.2%)
Mature economies
Rise inNet Sales
62011 Q1 results
1. Like-for-like: at constant scope of consolidation and exchange rates
2. Based on current group structure
3. Global Insight data as of April 2011: residential and non residential markets (Belgium, Canada, France, Italy, the Netherlands,Spain, United Kingdom, USA)
Growth +8.5% (lfl(1) +6.2%)
Favorable base for comparison in France and Italy
Building market volumes well below pre-crisis level onaverage (-23%(3) between 2008 and 2010) Residential market stabilized, even improving in some countries
Difficult commercial market as a whole, but good showings indigital infrastructures and energy performance
Market prospects in the building sector moving gradually intopositive territory

27.5 16.4 6.7 6.6 27.4 16.1 24.0 124.7
Rise in Net Sales
Breakdown of change in 2011 first-quarter net sales (€m)
France Italy Rest ofEurope
Rest ofWorld
USA-Canada
+13.7%Total
Rise inNet Sales
72011 Q1 results
911.71,036.4
+1.6%FX
+2.6%Scope of
consolidation
Q1 2010 Q1 2011
+9.0%Like-for-like(1) growth
1. Like-for-like: at constant scope of consolidation and exchange rates
2. Due to the consolidation of Inform, Indo Asian Switchgear, Meta System Energy and Electrorack

Innovation & New Product Launches
Core product lines
New business segments
Medium term drivers
Innovation &New product
launches
82011 Q1 results
Medium term drivers People care
Smart grids
Charging stations for electric vehicles

Core Product Lines
New DPX3 circuit breaker range with higherbreaking capacity and integrated measurement
function
Control and command Energy distribution
DPX3 160A DPX3 250A
Living Lightnew wiring device range dedicated
to Europe and Latin America
Innovation &New product
launches
92011 Q1 results
NILOETM ,new European eco range
Easybar prefabricated busbarsfor commercial building
Cable management
Yi Pin & K2.0 rangesdedicated to public housing segment in China

New Business Segments
LCS2,BTnetnew server enclosures
Digital infrastructures Energy performance
New Ortronicscabinets
BTicino Living Light energyconsumption measuring device
Innovation &New product
launches
102011 Q1 results
Watt StopperDigital Lighting Management dimming
and daylighting system
Home Systems
BTicino Living LightHome systems

Medium-term Drivers
Private homecharging station
Electrical vehiclecharging stations
Public chargingstation
People Careinterface with home systems
Innovation &New product
launches
Interface triggering home system scenarios(such as switching lights on, opening shutters)in case of emergency call to facilitate rescue
112011 Q1 results

Acquisitions in Line with Group Strategy
Self financed
Small to mid-size bolt-on acquisitions Sales of the 6 companies acquired over the past 12
months total €210 million
Frontrunners that thus record high operating
Acquisitions
122011 Q1 results
Frontrunners that thus record high operatingmargins
Fast-growing segments(2) or economies(3)
Combined sales of the 6 companies acquired : over+20% lfl in Q1 2011
1. Like-for-like: at constant scope of consolidation and exchange rates
2. 78% of sales acquired
3. 79% of sales acquired

Market leader for UPS in Brazil
Close to€80m sales
Nationwide network of sales teams,
distributors and service centers
UPS-Line Interactive
Acquisitions
(1)
132011 Q1 results
distributors and service centers
Over 1,100 employees at 3 sites
Rounding out Legrand’s robustposition in Brazil
#1 in wiring devices
#1 in door-entry systems
#1 in miniature circuit breakers
#1 in industrial enclosures
Stepping up development inenergy-performancebusiness, a fast-growingbusiness
UPS-OnLine Sinus Triphases
1. Subject to the approval of competent authorities in Brazil

French leader for connected security
system
€12 m sales Acquisitions
142011 Q1 results
Quiatil remoteassistance control
Moving up to the top place in France for electrical systems
dedicated to people care ─ a very promising market

Specialized in Voice-Data-Image (VDI) cabinets for
datacenters in the United States
Over $23 m sales Acquisitions
152011 Q1 results
Accelerating expansion in digital infrastructures,
a fast-growing business segment

Key player for protection devices in
the Indian retail market
€35m sales
12,000 retail outlets serving network
Approximately 2,000 employees at 3 sites
Residual current circuitbreakers
Acquisitions
162011 Q1 results
Approximately 2,000 employees at 3 sites
Strengthening Legrand’s positionin India
Accelerating global expansionin new economies
Miniature circuitbreakers
Distribution panels

#1 for UPS(1)in Turkey
$72m sales
Automatic voltage
Specialist in modularUPS(1)
in Italy
Over €16m sales
Acquisitions
172011 Q1 results
Accelerating expansion in energy performance,
a fast-growing segment
Rectifier systems
Automatic voltageregulators
Inverter systems
UPS systems
1. Uninterruptible Power Supply
Modular UPS “Archimod”

Increase in Adjusted(1) Operating Income
Pricing and productivity initiatives
Raw material and components strong inflation
Impact of acquisitions (-30bps)
189
218+15.4%
20.7%21.1%
in € millionsand as % of sales
Profitability&
182011 Q1 results
1. Operating income adjusted for depreciation of the revaluation of intangible assets and for costs both relating to acquisitions (€8.5million in Q1 2010 and €8.4 million in Q1 2011) as well as, if applicable, for impairment of goodwill (0€ for Q1 2010 and Q1 2011)
2. Pro forma, please refer to page 28
Q1 2010 Q1 2011
&Cash generation
(2)
Allowing for usual seasonality,
adjusted operating margin fully in line with 2011 target,
i.e. ≥ 20% including acquisitions
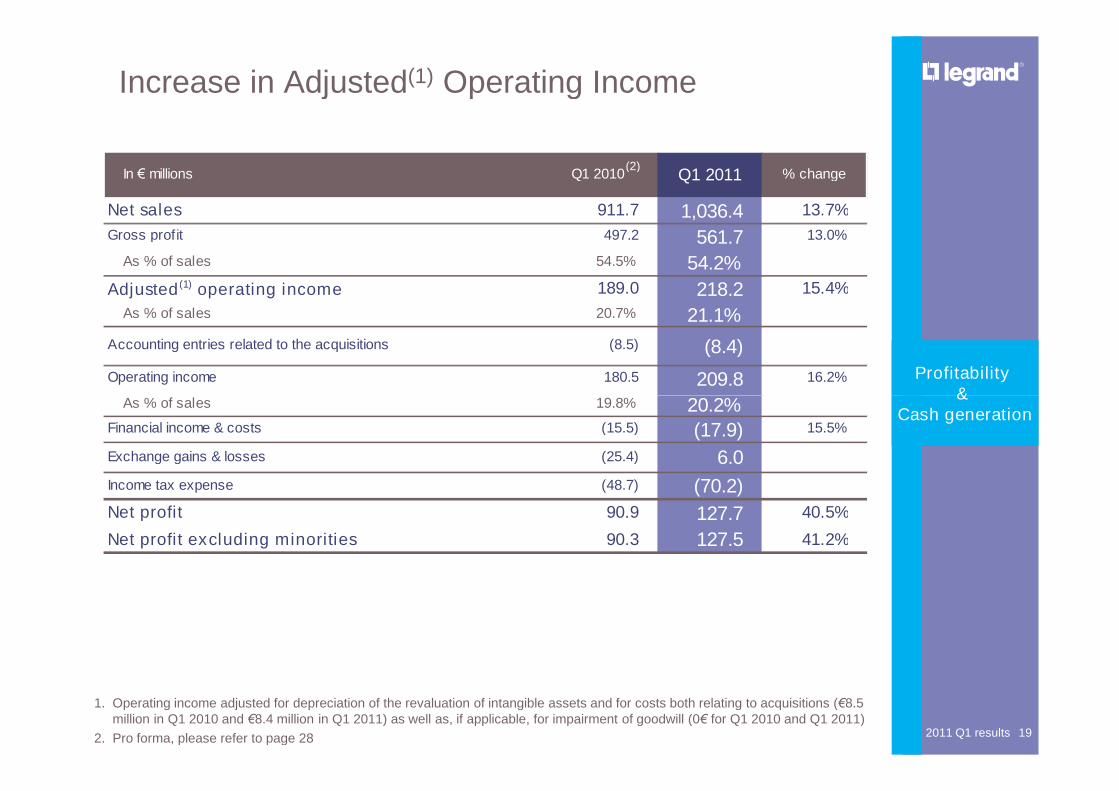
Increase in Adjusted(1) Operating Income
In € millions Q1 2010 Q1 2011 % change
Net sales 911.7 1,036.4 13.7%
Gross profit 497.2 561.7 13.0%
As % of sales 54.5% 54.2%
Adjusted(1) operating income 189.0 218.2 15.4%
As % of sales 20.7% 21.1%
Accounting entries related to the acquisitions (8.5) (8.4)
Operating income 180.5 209.8 16.2%
As % of sales 19.8% 20.2%
(2)
Profitability&
192011 Q1 results
As % of sales 19.8% 20.2%Financial income & costs (15.5) (17.9) 15.5%
Exchange gains & losses (25.4) 6.0
Income tax expense (48.7) (70.2)
Net profit 90.9 127.7 40.5%
Net profit excluding minorities 90.3 127.5 41.2%
1. Operating income adjusted for depreciation of the revaluation of intangible assets and for costs both relating to acquisitions (€8.5million in Q1 2010 and €8.4 million in Q1 2011) as well as, if applicable, for impairment of goodwill (0€ for Q1 2010 and Q1 2011)
2. Pro forma, please refer to page 28
&Cash generation

14%
16%
20%
16%
18%
20%
22%
Structural Nature of the Level of Profitability Achievedin 2010
+400bps
+200bps
Profitability&
202011 Q1 results
14%
10%
12%
14%
1992 1994 1996 1998 2000 2002 2003 2005 2007 2009 2010
Adj. operating margin Avg adj operating margin
Q12011
&Cash generation

Solid Free Cash Flow Generation
Strong profitability
Working capitalProfitability
&
€93m
212011 Q1 results
Working capitalrequirement under control
Normalized free cash flowat c.13%(1) of sales
&Cash generation€93m
1. Assuming a normalized working capital requirement of 10% of sales in 2010 and 2011

Solid Free Cash Flow Generation
Profitability&
In € millions Q1 2010 Q1 2011 % change
Cash-flow from operations (1) 155.4 183.1 17.8%
As % of sales 17.0% 17.7%
Change in working capital requirement (44.0) (67.7)Net cash provided by operating activities 111.4 115.4 3.6%
As % of sales 12.2% 11.1%
222011 Q1 results1. Cash flow from operations is defined as the sum of net cash provided by operating activities and change in working capital
requirement
&Cash generationCapital expenditures (including capitalized R&D) (18.1) (27.5)
Net proceeds of sales of fixed assets 0.8 5.3
Free cash-flow 94.1 93.2 -1.0%
As % of sales 10.3% 9.0%
23
Appendices

1,900
Building-market Volumes Well Below Pre-crisis Levelon Average (-23%(1) between 2008 and 2010)
Residential and commercial markets(1)
(in billions of 2005 US dollars)
242011 Q1 results
1,000
1,300
1,600
2000 2001 2002 2003 2004 2005 2006 2007 2008 2009 2010
Belgium, Canada, France, Italy, the Netherlands, Spain, United Kingdom, USA
1. Source :Global Insight as of April 2011
-23%

(€M) Q1 2010 Q1 2011Total
Change
Scope of
Consolidation
Like-for-Like
Growth
Currency
Effect
France 226.5 254.4 12.3% 0.2% 12.1% 0.0%
Italy 160.2 178.6 11.5% 1.3% 10.1% 0.0%
Rest of Europe 172.5 191.2 10.8% 6.0% 3.7% 0.8%
2011 First Quarter - Net Sales by Destination (1)
252011 Q1 results
USA/Canada 125.1 136.4 9.0% 2.3% 5.2% 1.3%
Rest of the World 227.4 275.8 21.3% 3.7% 11.6% 4.8%
Total 911.7 1,036.4 13.7% 2.6% 9.0% 1.6%
1. Market where sales are recorded

2011 First Quarter - Net Sales by Origin (1)
(€M) Q1 2010 Q1 2011Total
Change
Scope of
Consolidation
Like-for-Like
Growth
Currency
Effect
France 253.7 284.2 12.0% 0.0% 12.0% 0.0%
Italy 168.7 187.6 11.2% 1.8% 9.3% 0.0%
Rest of Europe 166.1 187.1 12.6% 6.4% 5.0% 0.8%
262011 Q1 results
1. Zone of origin of the product sold
USA/Canada 128.4 139.3 8.5% 2.3% 4.7% 1.3%
Rest of the World 194.8 238.2 22.3% 3.9% 11.5% 5.6%
Total 911.7 1,036.4 13.7% 2.6% 9.0% 1.6%

2011 First Quarter – Reconciliation of Cash-FlowFrom Operations with Net Profit
In € millions Q1 2010 Q1 2011
Net profit 90.9 127.7
Depreciation & Amortization 45.0 42.7
Change in other non-current assets and liabilities and deferred tax 0.9 10.9
272011 Q1 results
10.9
Exchange (gains)/losses net 17.5 3.6
(Gains)/losses on fixed-asset disposals and sales of securities 0.2 (1.6)
Other adjustments 0.9 (0.2)
Cash-flow from operations 155.4 183.1
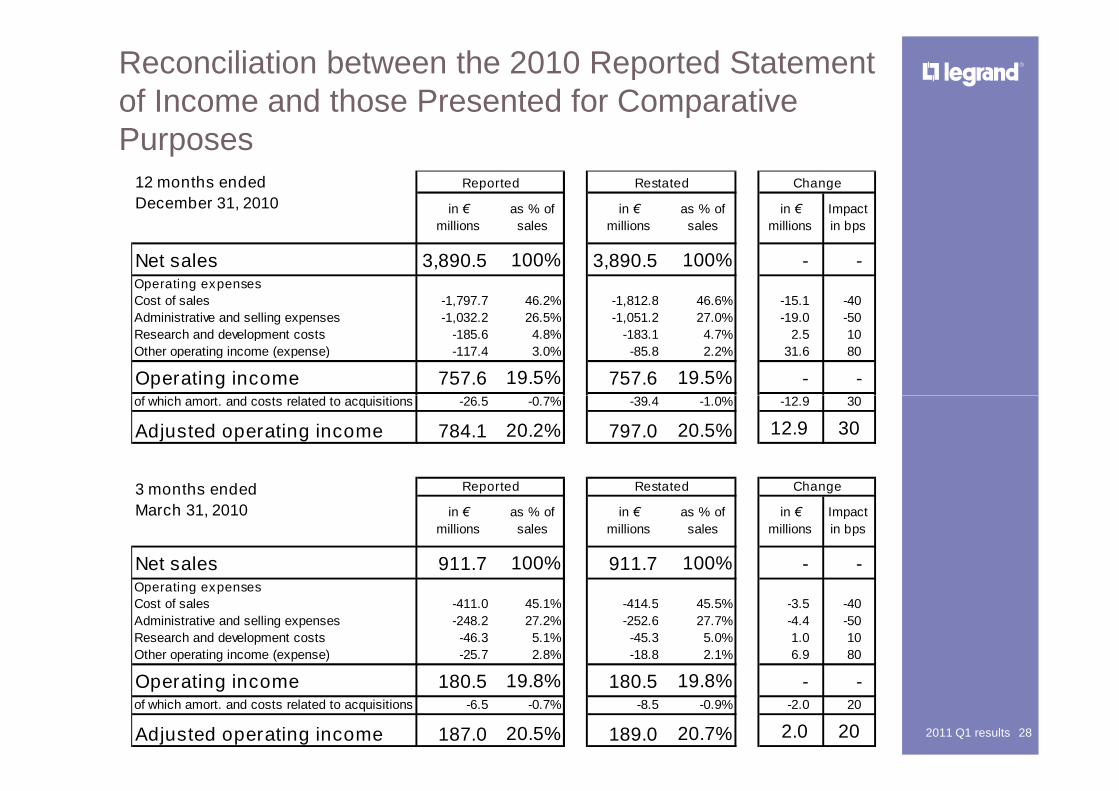
Reconciliation between the 2010 Reported Statementof Income and those Presented for ComparativePurposes
Net sales 3,890.5 100% 3,890.5 100% - -Operating expenses
Cost of sales -1,797.7 46.2% -1,812.8 46.6% -15.1 -40
Administrative and selling expenses -1,032.2 26.5% -1,051.2 27.0% -19.0 -50
Research and development costs -185.6 4.8% -183.1 4.7% 2.5 10
Other operating income (expense) -117.4 3.0% -85.8 2.2% 31.6 80
Operating income 757.6 19.5% 757.6 19.5% - -of which amort. and costs related to acquisitions -26.5 -0.7% -39.4 -1.0% -12.9 30
12 months ended
December 31, 2010
Reported Restated Change
in €
millions
as % of
sales
in €
millions
as % of
sales
in €
millions
Impact
in bps
282011 Q1 results
of which amort. and costs related to acquisitions -26.5 -0.7% -39.4 -1.0% -12.9 30
Adjusted operating income 784.1 20.2% 797.0 20.5% 12.9 30
Net sales 911.7 100% 911.7 100% - -Operating expenses
Cost of sales -411.0 45.1% -414.5 45.5% -3.5 -40
Administrative and selling expenses -248.2 27.2% -252.6 27.7% -4.4 -50
Research and development costs -46.3 5.1% -45.3 5.0% 1.0 10
Other operating income (expense) -25.7 2.8% -18.8 2.1% 6.9 80
Operating income 180.5 19.8% 180.5 19.8% - -of which amort. and costs related to acquisitions -6.5 -0.7% -8.5 -0.9% -2.0 20
Adjusted operating income 187.0 20.5% 189.0 20.7% 2.0 20
3 months ended
March 31, 2010
Reported Restated Change
in €
millions
as % of
sales
in €
millions
as % of
sales
in €
millions
Impact
in bps

Scope of Consolidation
2010 Q1 H1 9M FY
Inform Balance sheet only 6 months
Indo Asian Switchgear Balance sheet only 4 months
292011 Q1 results
2011 Q1 H1 9M FY
Inform 3 months 6 months 9 months 12 months
Indo Asian Switchgear 3 months 6 months 9 months 12 months
Meta System Energy 3 months 6 months 9 months 12 months
Electrorack 3 months 6 months 9 months 12 months
Intervox Balance sheet only 6 months 9 months 12 months
SMS Balance sheet only To be determined To be determined

Disclaimer
The information contained in this presentation has not been independently verified and norepresentation or warranty expressed or implied is made as to, and no reliance should beplaced, on the fairness, accuracy, completeness or correctness of the information oropinions contained herein.
This presentation contains information about Legrand’s markets and its competitive positiontherein. Legrand is not aware of any authoritative industry or market reports that cover oraddress its market. Legrand assembles information on its markets through its subsidiaries,which in turn compile information on its local markets annually from formal and informalcontacts with industry professionals, electrical products distributors, building statistics andmacroeconomic data. Legrand estimates its position in its markets based on market data
302011 Q1 results
macroeconomic data. Legrand estimates its position in its markets based on market datareferred to above and on its actual sales in the relevant market for the same period.
This document may contain estimates and/or forward-looking statements. Such statementsdo not constitute forecasts regarding Legrand’s results or any other performance indicator,but rather trends or targets, as the case may be. These statements are by their naturesubject to risks and uncertainties, many of which are outside Legrand’s control, including,but not limited to the risks described in Legrand’s reference document available on itsInternet website (www.legrandgroup.com). These statements do not reflect futureperformance of Legrand, which may materially differ. Legrand does not undertake to provideupdates of these statements to reflect events that occur or circumstances that arise after thedate of this document.
This document does not constitute an offer to sell, or a solicitation of an offer to buy Legrandshares in any jurisdiction.