Legislative Environmental Caucus February 16, 2005 · Legislative Environmental Caucus February 16,...
12
Legislative Environmental Caucus February 16, 2005 Paul Crissman Environmental Programs Manager Division of Waste Management DENR/DWM/SWS 10/4/2005
Transcript of Legislative Environmental Caucus February 16, 2005 · Legislative Environmental Caucus February 16,...
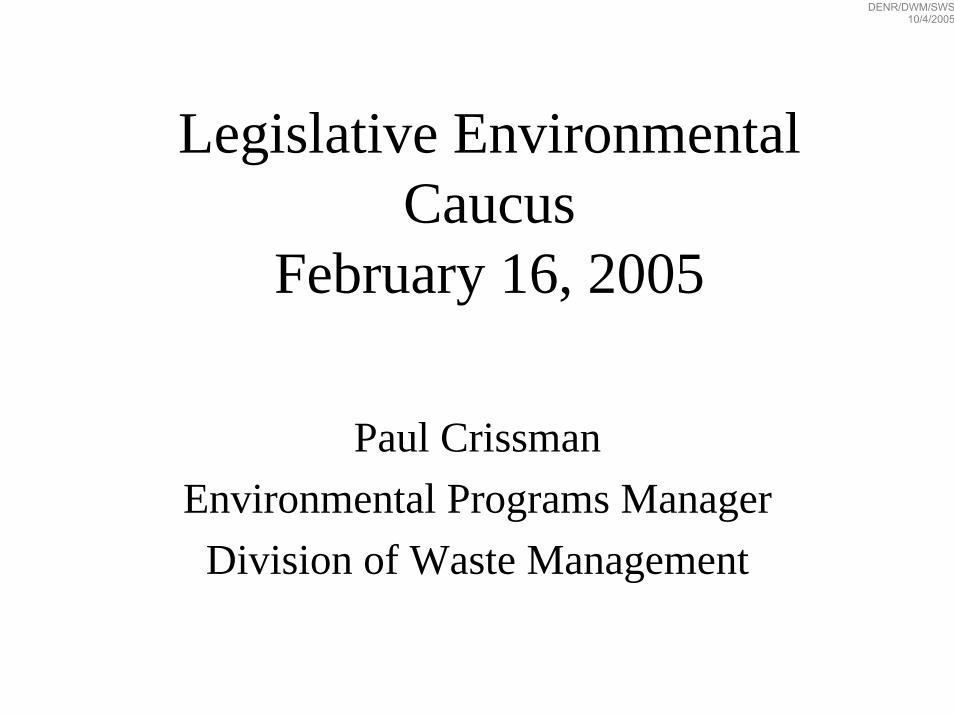
Legislative Environmental Caucus
February 16, 2005
Paul CrissmanEnvironmental Programs Manager
Division of Waste Management
DENR/DWM/SWS10/4/2005

Tons of Solid Waste Disposed of by North Carolina
0
2,000,000
4,000,000
6,000,000
8,000,000
10,000,000
12,000,000
1990
-91
1991
-92
1992
-93
1993
-94
1994
-95
1995
-96
1996
-97
1997
-98
1998
-99
1999
-00
2000
-01
2001
-02
2002
-03
2003
-04
Fiscal Year
Tons
DENR/DWM/SWS10/4/2005

Solid Waste Disposed of by North Carolina on Per Capita Basis
0
0.2
0.4
0.6
0.8
1
1.2
1.4
1990
-91
1991
-92
1992
-93
1993
-94
1994
-95
1995
-96
1996
-97
1997
-98
1998
-99
1999
-00
2000
-01
2001
-02
2002
-03
2003
-04
Fiscal Year
Tons
/Per
son
DENR/DWM/SWS10/4/2005
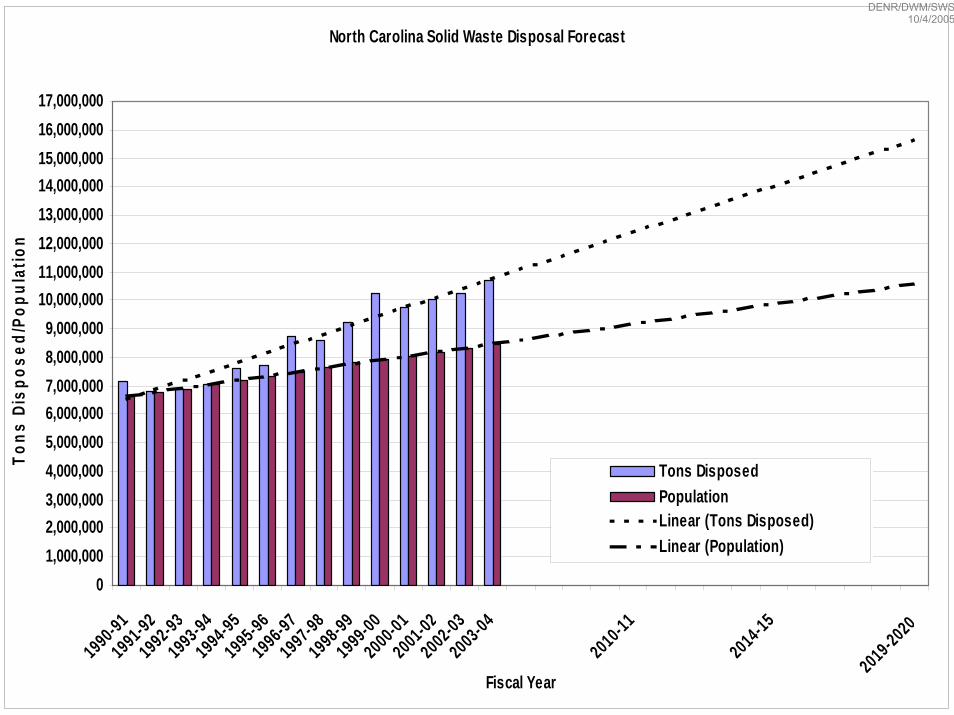
North Carolina Solid Waste Disposal Forecast
01,000,0002,000,0003,000,0004,000,0005,000,0006,000,0007,000,0008,000,0009,000,000
10,000,00011,000,00012,000,00013,000,00014,000,00015,000,00016,000,00017,000,000
1990-911991-921992-931993-941994-951995-961996-971997-981998-991999-002000-012001-022002-032003-04
2010-11
2014-15
2019-2020
Fiscal Year
Tons
Dis
pose
d/Po
pula
tion
Tons DisposedPopulationLinear (Tons Disposed)Linear (Population)
DENR/DWM/SWS10/4/2005

Net Imports/Exports of Solid Waste in North Carolina
0
200,000
400,000
600,000
800,000
1,000,000
1,200,000
1,400,000
1995
-96
1996
-97
1997
-98
1998
-99
1999
-00
2000
-01
2001
-02
2002
-03
2003
-04
Fiscal Year
Tons
ImportsExports
DENR/DWM/SWS10/4/2005

DENR/DWM/SWS10/4/2005

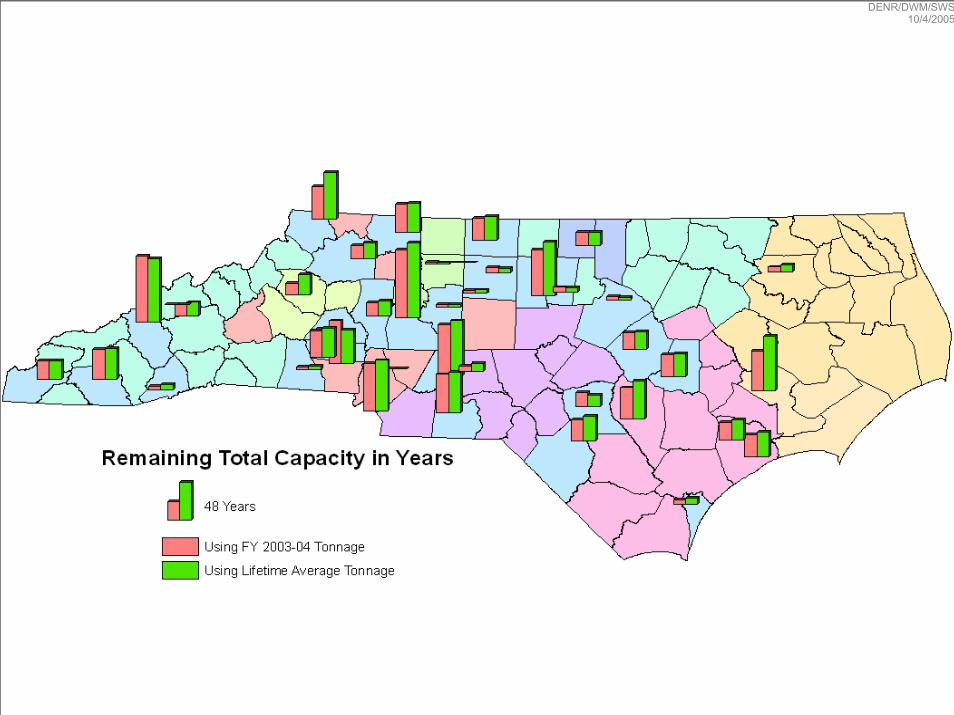
Total Landfill Capacity for North Carolina
County: All Counties
Opened Surveyed Months OpenDate Varied 1/11/2005 Varied
Lifetime 2003-2004Total Tons Disposed 57,083,570.0 7,606,671.9Tons Disposed per Month 576,011.9 633,889.3
Used Permitted TotalVolume Airspace (yd3) 95,805,976.0 132,927,669.0 326,334,692.0Remaining Airspace (yd3) 37,121,693.0 230,528,716.0
Utilization Factor (tons/yd3): 0.60
Permitted TotalRemaining Capacity for Tons of Waste 22,118,022.8 137,354,710.4Remaining Capacity in Years (Lifetime TPM) 3.3 20.8Remaining Capacity in Years (2003-2004 TPM) 2.9 18.1
DENR/DWM/SWS10/4/2005
DENR/DWM/SWS10/4/2005

DENR/DWM/SWS10/4/2005

•Camden County - Black Bear- MSW3.5 million tons/year, east coast
•Columbus County -Riegel Ridge- MSW.5 million tons/year, 100 mile radius
•Brunswick County-Hugo Neu-industrial process waste landfill2 million tons/year
•Hyde County- Alligator River Recyclingconstruction and demolition waste
DENR/DWM/SWS10/4/2005

The Future:More of the Same,
(probably continue to have more and more waste)
Yet Very Different
(probably become one of the nation’s leading importers of waste).
DENR/DWM/SWS10/4/2005
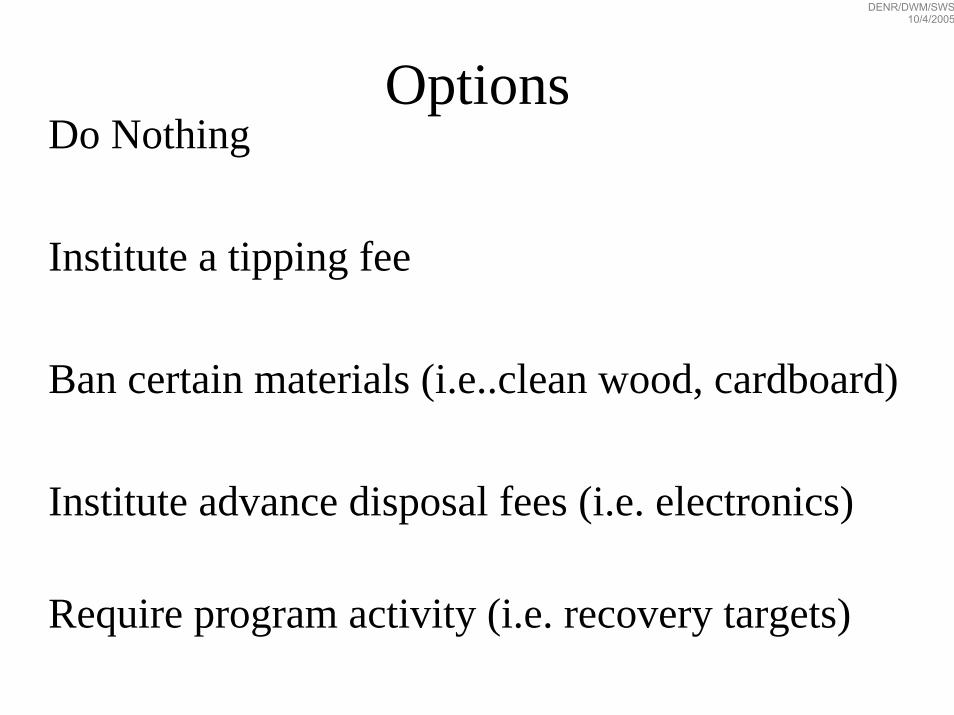
OptionsDo Nothing
Institute a tipping fee
Ban certain materials (i.e..clean wood, cardboard)
Institute advance disposal fees (i.e. electronics)
Require program activity (i.e. recovery targets)
DENR/DWM/SWS10/4/2005