
Legg Mason ClearBridge US Appreciation Fund...Legg Mason ClearBridge US Appreciation Fund May 2020...
24
Legg Mason ClearBridge US Appreciation Fund May 2020 The value of investments and the income from them may go down as well as up and you may not get back the amount you originally invested. This information is only for use by professional clients, eligible counterparties or qualified investors. It is not aimed at, or for use by, retail clients.
Transcript of Legg Mason ClearBridge US Appreciation Fund...Legg Mason ClearBridge US Appreciation Fund May 2020...

Legg Mason ClearBridge US Appreciation Fund
May 2020
The value of investments and the income from them may go down as well as up and you may not get back the amount you originally invested.
This information is only for use by professional clients, eligible counterparties or qualified investors. It is not aimed at, or for use by, retail clients.
Firm Overview

ClearBridge Investments
Source: ClearBridge, as at 31 March 2020.
A Long-Term Focus Drives a Distinguished History
3
$121 billion in assets under management
Headquartered in New York; offices in Baltimore, London, San Francisco, Sydney and Wilmington
Operate with investment independence, wholly-owned subsidiary of Legg Mason
PRI Signatory since 2008
Committed to authentic active management
▪ Performance distinct from market benchmarks
and factor-based strategies
▪ Long-term investment horizon
▪ Robust risk management
▪ Active ownership
Culture of longevity, consistency and risk
awareness
▪ Highly experienced and tenured investment
professionals
▪ Deliberate succession planning
▪ Risk considerations examined in all decisions
Robust fundamental research platform
▪ Bottom-up, quality focus
▪ Proprietary research and ESG ratings
▪ 30 year history of ESG investing with a fully-
integrated approach
Client focus
▪ Alignment of interests with clients
▪ Innovative compensation plan
Global investment manager with a 50+ year legacy as a leader in active management

Innovating to meet investor needs and evolving markets
Source: ClearBridge. For illustrative purposes only.
ClearBridge milestones
Appreciation
Strategy launched,
introducing
Low Volatility
approach
Aggressive Growth
Strategy
launched,
introducing
High Active
Share approach
Dividend Strategy launched, introducing
Income Solutions approach
2003
ClearBridge name established
ClearBridge Institutional Sector
Research Platform introduced
2005
Energy MLP
Strategies
launched
2010
TDI expands
equity income
offerings
2012
International Value
Strategy launched,
introducing
International
capabilities
1994
Introduced
Active ETFs
2017
ClearBridge signs UNPRI
2008
Proprietary
ESG
Company
Ratings
introduced
2014
Introduced
Dynamic MDAs
2015
19701983
Responsible Investing Program launched,
introducing ESG capabilities
1987
Boutique Asset Managers
Individual, specialized asset management firms
Smith Barney Asset Management
Loeb Rhoades Asset Management
Davis Skaggs Asset Management
Shearson Asset Management
Salomon Bros. Asset Management
Benefits of scale
Citigroup forms a
Combined Asset
Manager Citigroup
Asset Management
A singular focus on Investment Management
ClearBridge Investments
4

Independent Risk ManagementIdentify and address investment and business risk
5
Dedicated team of seven risk management and portfolio analytics professionals distinguished by:
▪ Independence – Direct reporting line to Chief Executive Officer and General Counsel
▪ Flexibility – Preventive risk program focusing on business needs
▪ Clarity – Promote risk aware culture with defined responsibilities
Investment Risk
Analyses
Investment Policy Risk tolerance, instrument/transaction analysis (derivatives, short selling, etc.)
Performance Ex-post portfolio analysis, attribution, variance, tracking error, beta
Risk Adjusted Ex-ante portfolio analysis, risk modeling, market risk exposure
Product/Style Investment objective suitability reviews, positioning, peer group comparison
OtherEconomic factors impact, market changes, industry standards and best practices,
product development
Trading Review of trade blotter, short positions and associated market factors

Legg Mason ClearBridge US Appreciation FundExperienced investment team
Source: Legg Mason, 31 March 2020.
Scott Glasser
▪ Managing Director, Co-CIO, Portfolio Manager
▪ 29 years of investment industry experience
▪ Joined predecessor in 1993
Michael Kagan
▪ Managing Director, Portfolio Manager
▪ 35 years of investment industry experience
▪ Joined predecessor in 1994
Stephen Rigo, CFA
▪ Director, Senior Portfolio Analyst
▪ 20 years of investment
industry experience
▪ Joined ClearBridge in 2016
6
Research
Name Sector(s) Covered Experience
Chuck Harris, Director of
Research
Industrials/Basic
Materials36 years
Neal Austria Consumer Discretionary 18 years
Robert Buesing, Jr.Consumer
Staples/Durables9 years
Dimitry Dayen, CFA Energy/Utilities 15 years
Tatiana Eades Energy/Utilities 21 years
Hilary Frisch, CFA IT & Communications 27 years
Erica Furfaro Internet/Media 15 Years
Miguel del Gallego, CFA Financials 20 years
Marshall Gordon Health Care 20 years
David Hochstim, CFA Financials 34 years
Deepon Nag Technology-Hardware 11 years
Humphrey Oleng Basic Materials 11 years
Hannah Whang Industrials 14 Years
Nick Wu, PhD Health Care 18 years
Average: 19 years
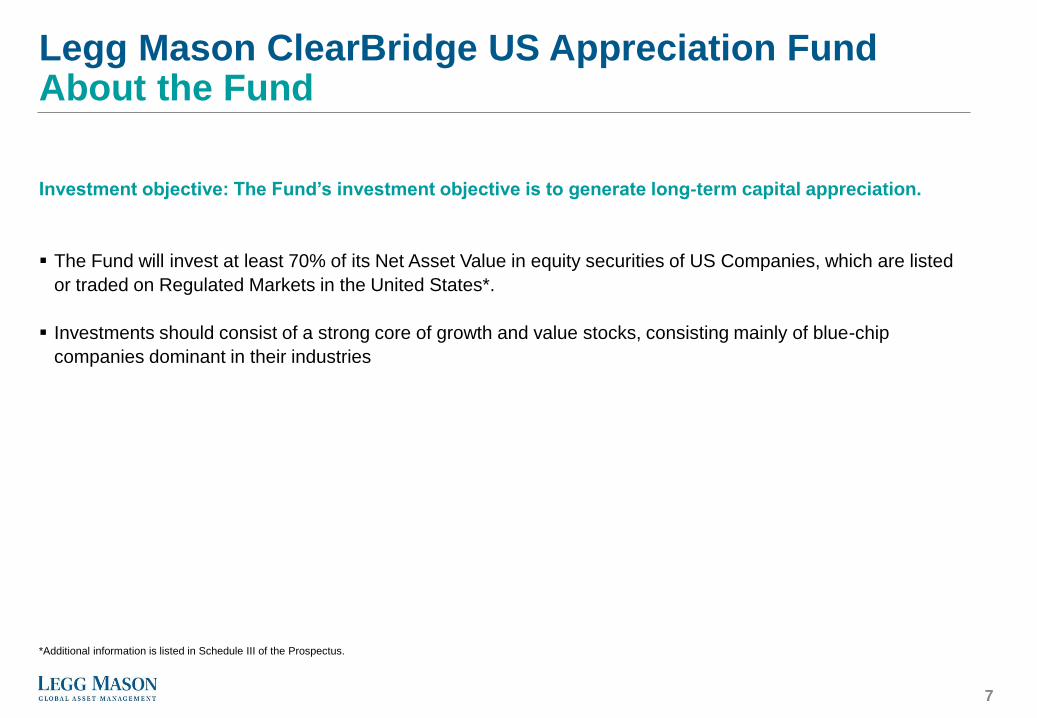
Legg Mason ClearBridge US Appreciation FundAbout the Fund
*Additional information is listed in Schedule III of the Prospectus.
Investment objective: The Fund’s investment objective is to generate long-term capital appreciation.
▪ The Fund will invest at least 70% of its Net Asset Value in equity securities of US Companies, which are listed
or traded on Regulated Markets in the United States*.
▪ Investments should consist of a strong core of growth and value stocks, consisting mainly of blue-chip
companies dominant in their industries
7
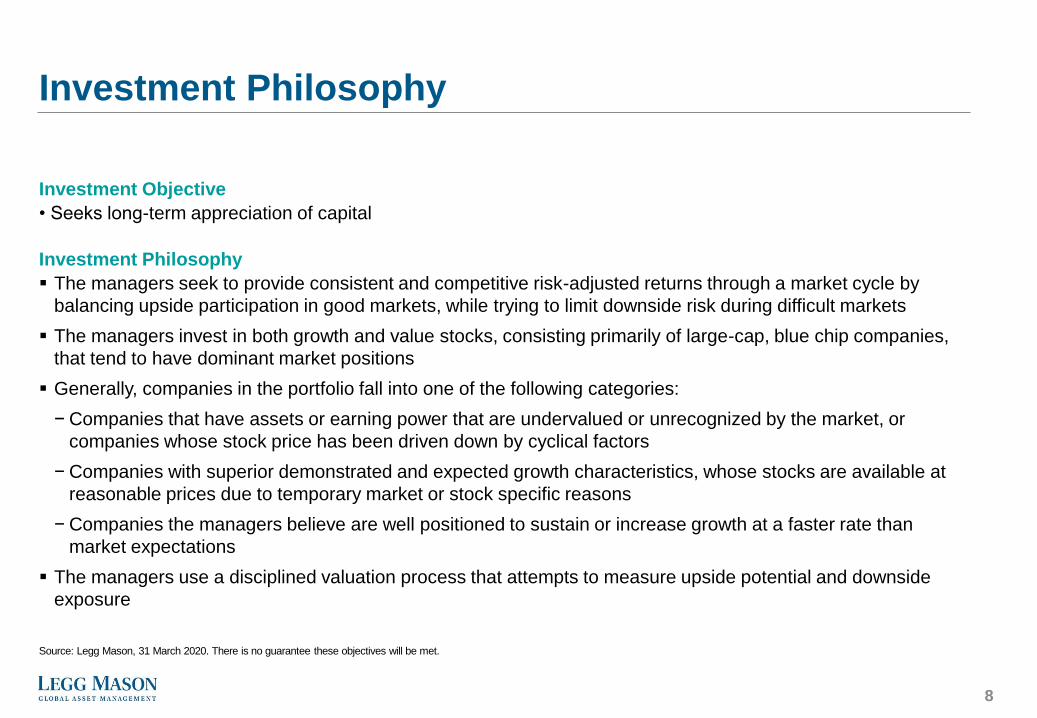
Investment Philosophy
Source: Legg Mason, 31 March 2020. There is no guarantee these objectives will be met.
Investment Objective
• Seeks long-term appreciation of capital
Investment Philosophy
▪ The managers seek to provide consistent and competitive risk-adjusted returns through a market cycle by
balancing upside participation in good markets, while trying to limit downside risk during difficult markets
▪ The managers invest in both growth and value stocks, consisting primarily of large-cap, blue chip companies,
that tend to have dominant market positions
▪ Generally, companies in the portfolio fall into one of the following categories:
− Companies that have assets or earning power that are undervalued or unrecognized by the market, or
companies whose stock price has been driven down by cyclical factors
− Companies with superior demonstrated and expected growth characteristics, whose stocks are available at
reasonable prices due to temporary market or stock specific reasons
− Companies the managers believe are well positioned to sustain or increase growth at a faster rate than
market expectations
▪ The managers use a disciplined valuation process that attempts to measure upside potential and downside
exposure
LIFTED FROM CLEARBRIDGE BRIDGE SEISMIC US APPRECIATION BOOK
8
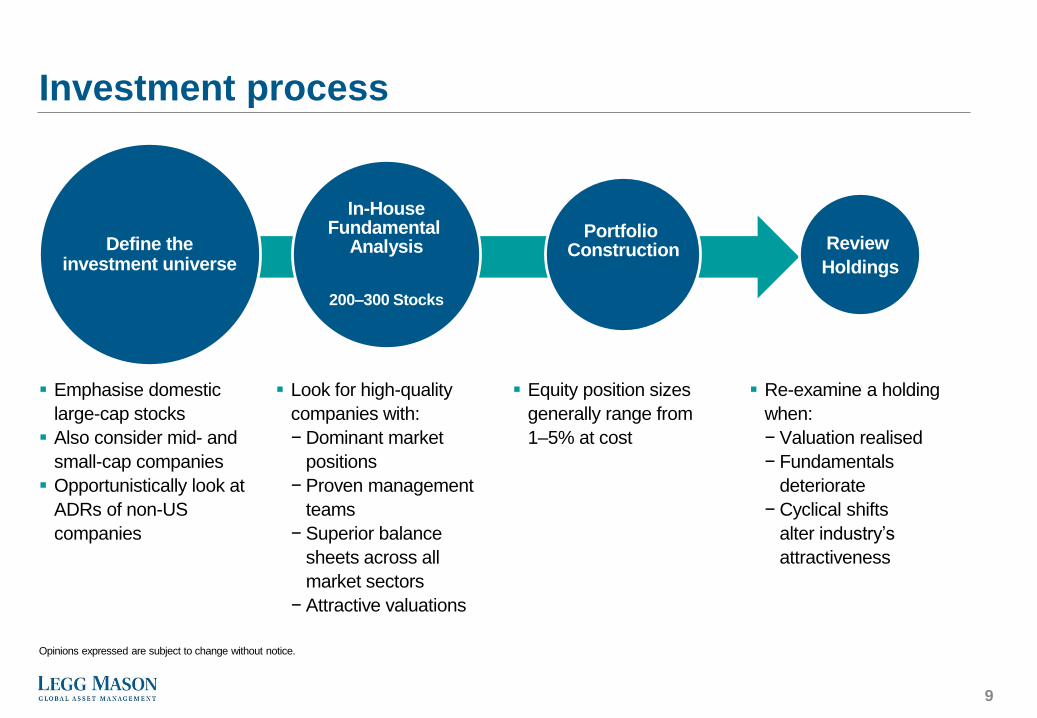
Investment process
Opinions expressed are subject to change without notice.
Define theinvestment universe
In-HouseFundamental
Analysis
200–300 Stocks
Portfolio Construction Review
Holdings
▪ Emphasise domestic
large-cap stocks
▪ Also consider mid- and
small-cap companies
▪ Opportunistically look at
ADRs of non-US
companies
▪ Look for high-quality
companies with:
− Dominant market
positions
− Proven management
teams
− Superior balance
sheets across all
market sectors
− Attractive valuations
▪ Equity position sizes
generally range from
1–5% at cost
▪ Re-examine a holding
when:
− Valuation realised
− Fundamentals
deteriorate
− Cyclical shifts
alter industry’s
attractiveness
9

Portfolio positioning and performance

Fund Index Underweight Overweight
Materials 6.59% 2.49%
Communication Services 14.06% 10.84%
Energy 3.53% 3.05%
Information Technology 26.14% 25.71%
Financials 10.48% 10.60%
Consumer Staples 7.03% 7.37%
Health Care 14.98% 15.36%
Real Estate 2.07% 2.92%
Industrials 5.49% 7.93%
Utilities 0.53% 3.26%
Consumer Discretionary 7.30% 10.47%
Cash & Cash Equivalents 1.79% 0.00% 1.79
-3.17
-2.73
-2.44
-0.84
-0.37
-0.34
-0.13
0.43
0.49
3.21
4.10
-4 -2 0 2 4 6
Sector exposure relative to S&P 500 Index30 April 2020
Source: Legg Mason, 30 April 2020.
Portfolio characteristics may change without notice.
11
S&P 500
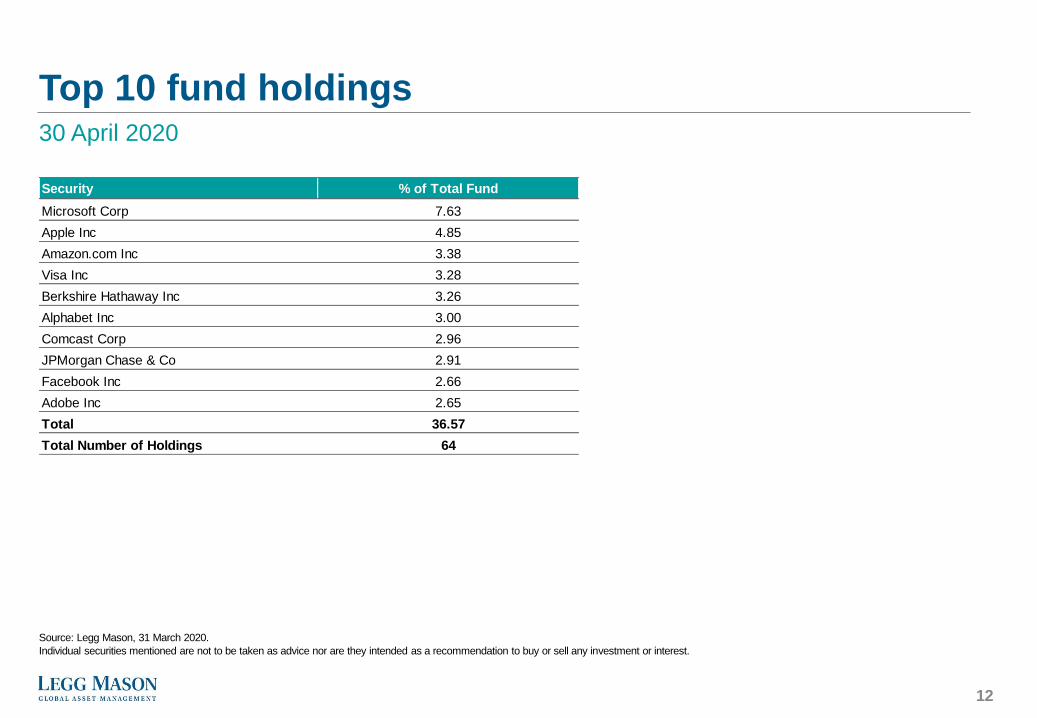
Top 10 fund holdings30 April 2020
Source: Legg Mason, 31 March 2020.
Individual securities mentioned are not to be taken as advice nor are they intended as a recommendation to buy or sell any investment or interest.
12
Security % of Total Fund
Microsoft Corp 7.63
Apple Inc 4.85
Amazon.com Inc 3.38
Visa Inc 3.28
Berkshire Hathaway Inc 3.26
Alphabet Inc 3.00
Comcast Corp 2.96
JPMorgan Chase & Co 2.91
Facebook Inc 2.66
Adobe Inc 2.65
Total 36.57
Total Number of Holdings 64

Portfolio holdings30 April 2020
Source: Legg Mason, 30 April 2020.
Individual securities mentioned are not to be taken as advice nor are they intended as a recommendation to buy or sell any investment or interest.
13
Cash 1.79% Visa Inc 3.28%
Financials 10.48% Adobe Systems Incorporated 2.65%
Communication Services 14.06% Berkshire Hathaway I 3.26% Automatic Data Processing, Inc. 1.79%
Comcast Corp Class A 2.96% JPMorgan Chase & Co. 2.91% Salesforce.com 1.10%
Facebook Inc 2.66% Travelers Cos Inc/The Npv 1.42% Intl Business Machines Corp Co 1.10%
The Walt Disney Company 1.63% Bank Of America Corp 1.33% ASML Holding NV NY Registered Shs 0.81%
Alphabet Inc. 1.58% CME Group Inc. Class A 0.88% FIDELITY NATIONAL INFO SERV 0.64%
Verizon Communications Inc. 1.49% US Bancorp 0.68% Arista Networks Inc. 0.56%
Alphabet Inc. 1.42% Texas Instruments Incorporated 0.54%
AT&T Inc. 1.17% Health Care 14.98% Cognizant Technology Solutions 0.51%
T-MOBILE US INC USD0.0001 0.71% Johnson & Johnson 2.61% Cisco Systems, Inc. 0.39%
PINTEREST INC- CLASS NPV 0.45% Merck & Co. Inc. 2.44% Oracle Corporation 0.28%
Unitedhealth Group Inc 2.28%
Consumer Discretionary 7.30% Thermo Fisher Scientific Inc. 2.22% Materials 6.59%
Amazon.Com, Inc. 3.38% Pfizer Inc 1.72% PPG Industries Inc 1.65%
The Home Depot, Inc. 2.55% Medtronic PLC 1.62% Air Products and Chemicals, Inc. 1.63%
Tjx Companies Inc 1.37% Becton Dickinson & Co. 1.08% Ecolab Inc. 1.34%
Amgen Inc. 0.56% SHERWIN-WILLIAMS CO/THE 0.79%
Consumer Staples 7.03% CVS Health 0.44% VULCAN MATERIALS CO 0.68%
Wal Mart Stores Inc 2.31% Ball Corp. 0.51%
Procter & Gamble Co/T Npv 1.58% Industrials 5.49%
Pepsico Inc 1.29% Honeywell International Inc Co 2.07% Real Estate 2.07%
Mondelez International, Inc. Class A 0.94% Waste Management Inc 1.24% American Tower Corp 2.07%
The Coca-Cola Company 0.90% United Parcel Service 1.12%
3M Co 0.77% Utilities 0.53%
Energy 3.53% Canadian Pacific Railway Ltd. 0.29% NextEra Energy, Inc. 0.29%
Chevron Corp 1.39% Sempra Energy 0.25%
Exxon Mobil Corp 0.92% Information Technology 26.14%
Kinder Morgan, Inc. Class P 0.75% Microsoft Corp 7.63% Total 100.00%
Pioneer Natural Resources Company 0.47% Apple Inc. 4.85% Number of Holdings 64

Fund compositionMarket capitalisation30 April 2020
Source: Legg Mason, 30 April 2020.
14
76.63
11.97
7.003.94
0.46
58.00
14.3311.99 12.48
2.67
0
10
20
30
40
50
60
70
80
90
More than 100,000 mil 50,000 - 100,000 mil 25,000 - 50,000 mil 10,000 - 25,000 mil 5,000 - 10,000 mil
% o
f F
un
d
$ Millions
Legg Mason ClearBridge US Appreciation Fund S&P 500 Index
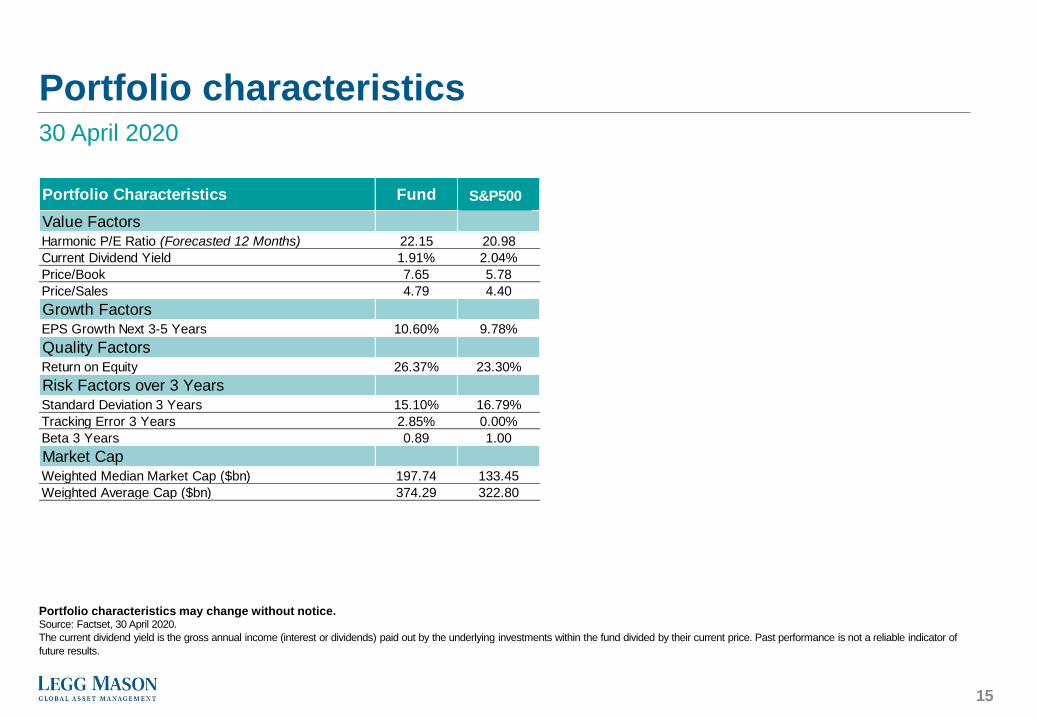
Portfolio Characteristics Fund Index
Value FactorsHarmonic P/E Ratio (Forecasted 12 Months) 22.15 20.98
Current Dividend Yield 1.91% 2.04%
Price/Book 7.65 5.78
Price/Sales 4.79 4.40
Growth FactorsEPS Growth Next 3-5 Years 10.60% 9.78%
Quality FactorsReturn on Equity 26.37% 23.30%
Risk Factors over 3 YearsStandard Deviation 3 Years 15.10% 16.79%
Tracking Error 3 Years 2.85% 0.00%
Beta 3 Years 0.89 1.00
Market CapWeighted Median Market Cap ($bn) 197.74 133.45
Weighted Average Cap ($bn) 374.29 322.80
Portfolio characteristics30 April 2020
Portfolio characteristics may change without notice.Source: Factset, 30 April 2020.
The current dividend yield is the gross annual income (interest or dividends) paid out by the underlying investments within the fund divided by their current price. Past performance is not a reliable indicator of
future results.
15
S&P500
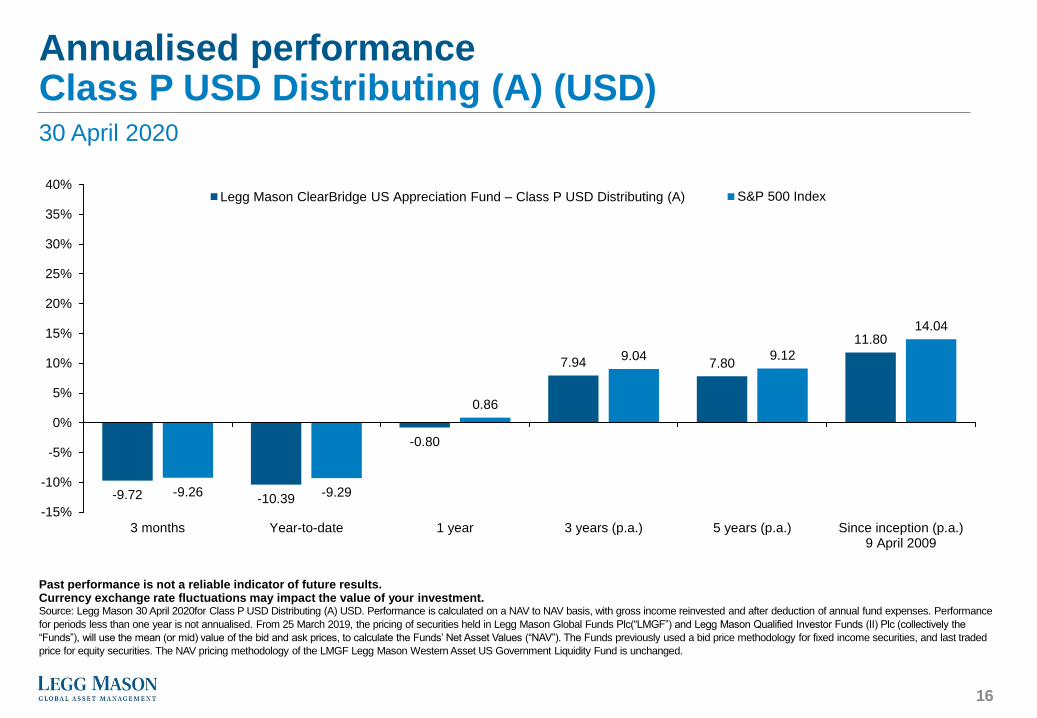
Annualised performanceClass P USD Distributing (A) (USD)30 April 2020
Past performance is not a reliable indicator of future results.Currency exchange rate fluctuations may impact the value of your investment.Source: Legg Mason 30 April 2020for Class P USD Distributing (A) USD. Performance is calculated on a NAV to NAV basis, with gross income reinvested and after deduction of annual fund expenses. Performance
for periods less than one year is not annualised. From 25 March 2019, the pricing of securities held in Legg Mason Global Funds Plc(“LMGF”) and Legg Mason Qualified Investor Funds (II) Plc (collectively the
“Funds”), will use the mean (or mid) value of the bid and ask prices, to calculate the Funds’ Net Asset Values (“NAV”). The Funds previously used a bid price methodology for fixed income securities, and last traded
price for equity securities. The NAV pricing methodology of the LMGF Legg Mason Western Asset US Government Liquidity Fund is unchanged.
-9.72 -10.39
-0.80
7.94 7.80
11.80
-9.26 -9.29
0.86
9.04 9.12
14.04
-15%
-10%
-5%
0%
5%
10%
15%
20%
25%
30%
35%
40%
3 months Year-to-date 1 year 3 years (p.a.) 5 years (p.a.) Since inception (p.a.)9 April 2009
Legg Mason ClearBridge US Appreciation Fund – Class P USD Distributing (A) S&P 500 Index
16

Calendar year performanceClass P USD Distributing (A) (USD)31 December 2019
Past performance is not a reliable indicator of future resultsCurrency exchange rate fluctuations may impact the value of your investment.Source: Legg Mason as at 31 December 2019 for Class P USD Distributing (A) USD incepted in May of 2010. Performance is calculated on a NAV to NAV basis, with gross income reinvested and after deduction of
annual fund expenses. Performance for periods less than one year is not annualised. Past performance is no guide to future returns and may not be repeated. Please refer to the section entitled ‘Important
Information’ for additional details. From 25 March 2019, the pricing of securities held in Legg Mason Global Funds Plc (“LMGF”) and Legg Mason Qualified Investor Funds (II) Plc (collectively the “Funds”), will use
the mean (or mid) value of the bid and ask prices, to calculate the Funds’ Net Asset Values (“NAV”). The Funds previously used a bid price methodology for fixed income securities, and last traded price for equity
securities. The NAV pricing methodology of the LMGF Legg Mason Western Asset US Government Liquidity Fund is unchanged.
11.75
2.06
15.01
28.55
10.58
1.00
8.93
19.17
-2.47
28.87
15.06
2.11
16.00
32.39
13.69
1.38
11.96
21.83
-4.38
31.49
-10%
0%
10%
20%
30%
40%
2010 2011 2012 2013 2014 2015 2016 2017 2018 2019
Legg Mason ClearBridge US Appreciation Fund - Class P US$ Distributing (A) S&P 500 Index
17

Standardised past performanceRolling period returns30 April 2020
Past performance is not a reliable indicator of future results.Currency exchange rate fluctuations may impact the value of your investment.Source: Legg Mason, performance 30 April 2020. Performance is calculated on a NAV to NAV basis, with gross income reinvested and after deduction of annual fund expenses. From 25 March 2019, the pricing of
securities held in Legg Mason Global Funds Plc (“LMGF”) and Legg Mason Qualified Investor Funds (II) Plc (collectively the “Funds”), will use the mean (or mid) value of the bid and ask prices, to calculate the
Funds’ Net Asset Values (“NAV”). The Funds previously used a bid price methodology for fixed income securities, and last traded price for equity securities.
The NAV pricing methodology of the LMGF Legg Mason Western Asset US Government Liquidity Fund is unchanged.
Rolling 12-month performance
(%)
01 May 2019 -
30 Apr 2020
01 May 2018 -
30 Apr 2019
01 May 2017 -
30 Apr 2018
01 May 2016 -
30 Apr 2017
01 May 2015 -
30 Apr 2016
Legg Mason ClearBridge US Appreciation Fund
Class P Dist. (A) USD-0.80 15.45 9.81 14.07 1.47
S&P 500 0.86 13.49 13.27 17.92 1.21
18

Fund risksLegg Mason ClearBridge US Appreciation Fund
Investment in company shares: The fund invests in shares of companies, and the value of these shares can be negatively affected by changes in the
company, its industry or the economy in which it operates.
Geographical focus: This fund invests primarily in the United States, which means that it is more sensitive to local economic, market, political or regulatory
events in the United States, and will be more affected by these events than other funds that invest in a broader range of regions.
Fund operations: The fund is subject to the risk of loss resulting from inadequate or failed internal processes, people or systems or those of third parties such
as those responsible for the custody of its asset
19

Attribution analysis One year (%)30 April 2020
Past performance is not a reliable indicator of future results. Source: Legg Mason, 30 April 2020.
The attribution figures above are based on the Fund’s holdings and do not reflect fees or expenses of the Fund. BM = benchmark – S&P 500 Index. – S&P 500 Index.
20
Average Weight Total Return Attribution Effects
Port BM (+/-) Port BM Sector Stock Total
Communication Services 13.34 10.47 2.87 -2.12 3.30 0.06 -0.69 -0.63
Consumer Discretionary 6.21 10.01 -3.81 13.35 1.75 0.01 0.71 0.72
Consumer Staples 6.48 7.42 -0.94 9.81 3.62 -0.05 0.40 0.35
Energy 5.02 4.23 0.79 -31.44 -38.29 -0.44 0.51 0.07
Financials 14.66 12.64 2.03 -21.29 -16.71 -0.40 -0.72 -1.12
Health Care 13.70 14.18 -0.48 12.12 14.52 -0.08 -0.25 -0.33
Industrials 7.11 9.06 -1.95 -10.35 -15.90 0.46 0.39 0.84
Information Technology 22.71 22.88 -0.18 18.98 18.07 0.01 0.12 0.13
Materials 6.40 2.63 3.77 -6.03 -7.15 -0.32 0.08 -0.24
Real Estate 1.88 3.07 -1.19 23.99 -2.46 0.01 0.46 0.47
Utilities 0.65 3.41 -2.77 10.54 0.83 0.02 0.06 0.08
Cash and Equivalents 1.84 0.00 1.84 2.07 0.00 -0.51 0.00 -0.51
Total Fund 100.00 100.00 0.00 0.70 0.86 -1.24 1.07 -0.17
Sector Allocation for 1 Year
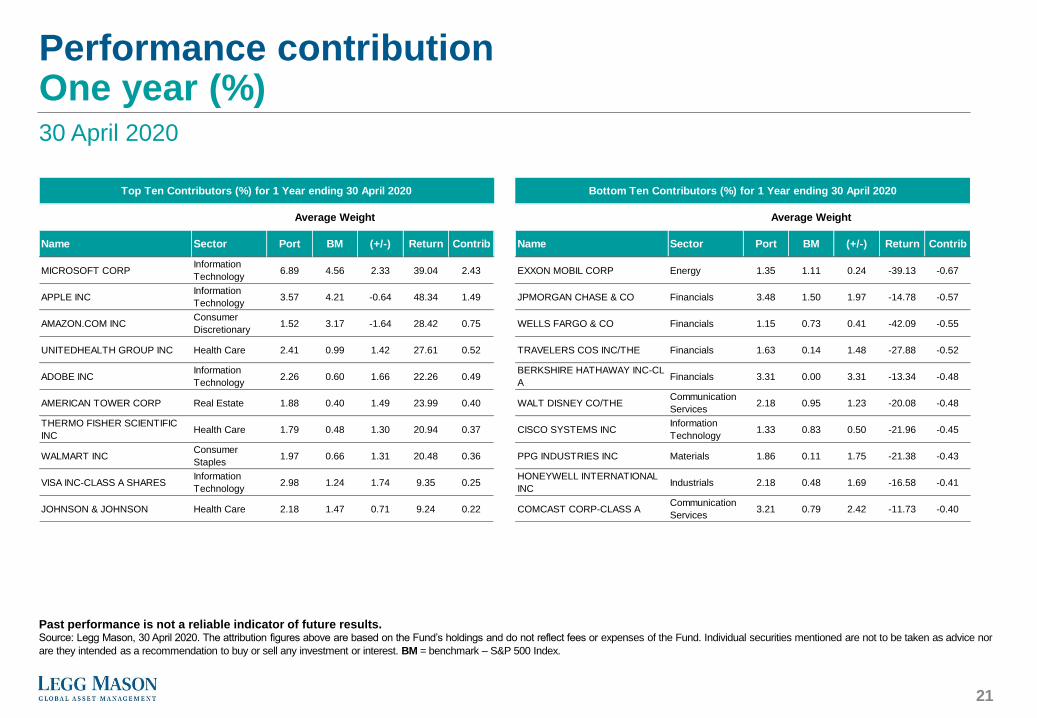
Performance contribution One year (%)30 April 2020
Past performance is not a reliable indicator of future results. Source: Legg Mason, 30 April 2020. The attribution figures above are based on the Fund’s holdings and do not reflect fees or expenses of the Fund. Individual securities mentioned are not to be taken as advice nor
are they intended as a recommendation to buy or sell any investment or interest. BM = benchmark – S&P 500 Index.
21
Average Weight Average Weight
Name Sector Port BM (+/-) Return Contrib Name Sector Port BM (+/-) Return Contrib
MICROSOFT CORPInformation
Technology6.89 4.56 2.33 39.04 2.43 EXXON MOBIL CORP Energy 1.35 1.11 0.24 -39.13 -0.67
APPLE INCInformation
Technology3.57 4.21 -0.64 48.34 1.49 JPMORGAN CHASE & CO Financials 3.48 1.50 1.97 -14.78 -0.57
AMAZON.COM INCConsumer
Discretionary1.52 3.17 -1.64 28.42 0.75 WELLS FARGO & CO Financials 1.15 0.73 0.41 -42.09 -0.55
UNITEDHEALTH GROUP INC Health Care 2.41 0.99 1.42 27.61 0.52 TRAVELERS COS INC/THE Financials 1.63 0.14 1.48 -27.88 -0.52
ADOBE INCInformation
Technology2.26 0.60 1.66 22.26 0.49
BERKSHIRE HATHAWAY INC-CL
AFinancials 3.31 0.00 3.31 -13.34 -0.48
AMERICAN TOWER CORP Real Estate 1.88 0.40 1.49 23.99 0.40 WALT DISNEY CO/THECommunication
Services2.18 0.95 1.23 -20.08 -0.48
THERMO FISHER SCIENTIFIC
INCHealth Care 1.79 0.48 1.30 20.94 0.37 CISCO SYSTEMS INC
Information
Technology1.33 0.83 0.50 -21.96 -0.45
WALMART INCConsumer
Staples1.97 0.66 1.31 20.48 0.36 PPG INDUSTRIES INC Materials 1.86 0.11 1.75 -21.38 -0.43
VISA INC-CLASS A SHARESInformation
Technology2.98 1.24 1.74 9.35 0.25
HONEYWELL INTERNATIONAL
INCIndustrials 2.18 0.48 1.69 -16.58 -0.41
JOHNSON & JOHNSON Health Care 2.18 1.47 0.71 9.24 0.22 COMCAST CORP-CLASS ACommunication
Services3.21 0.79 2.42 -11.73 -0.40
Top Ten Contributors (%) for 1 Year ending 30 April 2020 Bottom Ten Contributors (%) for 1 Year ending 30 April 2020
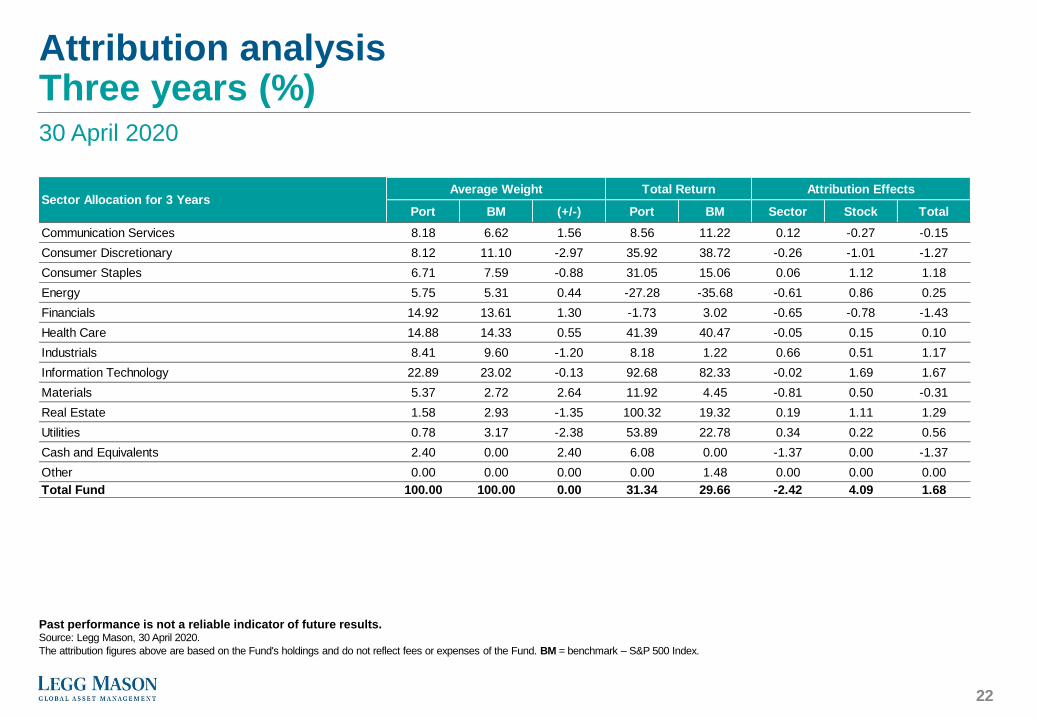
Attribution analysis Three years (%)30 April 2020
Past performance is not a reliable indicator of future results.Source: Legg Mason, 30 April 2020.
The attribution figures above are based on the Fund's holdings and do not reflect fees or expenses of the Fund. BM = benchmark – S&P 500 Index.
22
Average Weight Total Return Attribution Effects
Port BM (+/-) Port BM Sector Stock Total
Communication Services 8.18 6.62 1.56 8.56 11.22 0.12 -0.27 -0.15
Consumer Discretionary 8.12 11.10 -2.97 35.92 38.72 -0.26 -1.01 -1.27
Consumer Staples 6.71 7.59 -0.88 31.05 15.06 0.06 1.12 1.18
Energy 5.75 5.31 0.44 -27.28 -35.68 -0.61 0.86 0.25
Financials 14.92 13.61 1.30 -1.73 3.02 -0.65 -0.78 -1.43
Health Care 14.88 14.33 0.55 41.39 40.47 -0.05 0.15 0.10
Industrials 8.41 9.60 -1.20 8.18 1.22 0.66 0.51 1.17
Information Technology 22.89 23.02 -0.13 92.68 82.33 -0.02 1.69 1.67
Materials 5.37 2.72 2.64 11.92 4.45 -0.81 0.50 -0.31
Real Estate 1.58 2.93 -1.35 100.32 19.32 0.19 1.11 1.29
Utilities 0.78 3.17 -2.38 53.89 22.78 0.34 0.22 0.56
Cash and Equivalents 2.40 0.00 2.40 6.08 0.00 -1.37 0.00 -1.37
Other 0.00 0.00 0.00 0.00 1.48 0.00 0.00 0.00
Total Fund 100.00 100.00 0.00 31.34 29.66 -2.42 4.09 1.68
Sector Allocation for 3 Years

Performance contribution Three years (%)30 April 2020
Past performance is not a reliable indicator of future results.Source: Legg Mason, 30 April 2020. The attribution figures above are based on the Fund's holdings and do not reflect fees or expenses of the Fund. Individual securities mentioned are not to be taken as advice nor
are they intended as a recommendation to buy or sell any investment or interest. BM = benchmark – S&P 500 Index.
23
Average Weight Average Weight
Name Sector Port BM (+/-) Return Contrib Name Sector Port BM (+/-) Return Contrib
MICROSOFT CORPInformation
Technology5.84 3.65 2.19 175.37 7.43 WELLS FARGO & CO Financials 1.23 0.94 0.29 -44.77 -0.80
APPLE INCInformation
Technology3.46 3.96 -0.50 113.72 3.29 EXXON MOBIL CORP Energy 1.73 1.37 0.37 -35.17 -0.73
ADOBE INCInformation
Technology1.96 0.50 1.46 164.42 2.15 SCHLUMBERGER LTD Energy 0.52 0.31 0.21 -74.75 -0.61
VISA INC-CLASS A SHARESInformation
Technology2.47 1.07 1.40 99.78 1.84
PIONEER NATURAL
RESOURCES COEnergy 0.67 0.11 0.56 -47.39 -0.50
UNITEDHEALTH GROUP INC Health Care 2.91 0.98 1.93 74.97 1.60AMERICAN INTERNATIONAL
GROUPFinancials 0.20 0.20 0.00 -56.33 -0.43
HOME DEPOT INCConsumer
Discretionary2.98 0.93 2.05 51.43 1.39 PPG INDUSTRIES INC Materials 1.98 0.12 1.87 -13.07 -0.37
AMERICAN TOWER CORP Real Estate 1.58 0.32 1.26 100.32 1.36 DUPONT DE NEMOURS INC Materials 0.50 0.42 0.08 -55.84 -0.33
THERMO FISHER SCIENTIFIC
INCHealth Care 1.49 0.41 1.08 104.22 1.30 US BANCORP Financials 0.95 0.34 0.61 -22.53 -0.27
AMAZON.COM INCConsumer
Discretionary0.67 2.76 -2.09 63.11 1.26 TRAVELERS COS INC/THE Financials 1.83 0.15 1.67 -10.74 -0.22
WALMART INCConsumer
Staples1.72 0.61 1.12 72.73 1.10
INTL BUSINESS MACHINES
CORP
Information
Technology0.80 0.53 0.26 -10.61 -0.20
Top Ten Contributors (%) for 3 Years ending 30 April 2020 Bottom Ten Contributors (%) for 3 Years ending 30 April 2020

Important information
24
LMGFEUSGFLMGF EAA UK SWITZERLAND FRANCEGERMANY
This is a sub-fund of Legg Mason Global Funds
plc (‘LMGF plc’). LMGF is an open-ended
investment company with variable capital,
organised as an undertaking for collective
investment in transferable securities (‘UCITS’).
LMGF is authorised in Ireland by the Central
Bank of Ireland.
Information has been prepared from sources
believed reliable. It is not guaranteed in any way
by any Legg Mason, Inc. company or affiliate
(together ‘Legg Mason’).
Before investing you should read the application
form Prospectus and KIID. The fund documents
may be obtained free of charge in English,
French, German, Italian and Spanish from
LMGF plc’s registered office at Riverside Two,
Sir John Rogerson’s Quay, Grand Canal Dock,
Dublin 2, Ireland, from LMGF plc’s
administrator, BNY Mellon Fund Services
(Ireland) Limited, or from
www.leggmasonglobal.com.
Information provided herein is current to the
date of this communication and subject to
change.
Individual securities are examples only and are
not recommendations to buy or sell an
investment.
Opinions expressed are subject to change
without notice and do not consider the needs
of investors.
In Europe (excluding UK & Switzerland) this
financial promotion is issued by Legg Mason
Investments (Ireland) Limited, registered office
6th Floor, Building Three, Number One
Ballsbridge, 126 Pembroke Road, Ballsbridge,
Dublin 4, D04 EP27, Ireland. Registered in
Ireland, Company No. 271887. Authorised and
regulated by the Central Bank of Ireland.
In the UK this financial promotion is issued by
Legg Mason Investments (Europe) Limited,
registered office 201 Bishopsgate, London,
EC2M 3AB. Registered in England and Wales,
Company No. 1732037. Authorised and
regulated by the UK Financial Conduct
Authority.
In Switzerland, this financial promotion is issued
by Legg Mason Investments (Switzerland)
GmbH, authorised by the Swiss Financial
Market Supervisory Authority FINMA.
Investors in Switzerland: The representative in
Switzerland is FIRST INDEPENDENT FUND
SERVICES LTD., Klausstrasse 33, 8008 Zurich,
Switzerland and the paying agent in Switzerland
is NPB Neue Privat Bank AG, Limmatquai 1,
8024 Zurich, Switzerland. Copies of the Articles
of Association, the Prospectus, the Key Investor
Information Documents and the annual and
semi-annual reports of the Company may be
obtained free of charge from the representative
in Switzerland.
German investors: The prospectus, Key
Investor Information Document, annual report
and semi-annual report are available free of
charge from the German Information agent
[Legg Mason Investments (Europe) Limited,
Zweigniederlassung Frankfurt am Main,
MesseTurm, 21. Etage, Friedrich-Ebert-
Anlage 49, 60308 Frankfurt a.M., Germany] or
from www.leggmasonglobal.com.
The representative paying agent in France,
through which the KIIDs, Prospectus, semi-
annual and annual reports can be obtained free
of charge is CACEIS Bank, 1/3, Place
Valhubert, 75013 Paris, France.
This information is only for use by professional
clients. It is not aimed at retail clients. Not for
onward distribution.
May 2020