Legatum Institute Report on Well-Being.
96
www.li.com www.prosperity.com | REPORT | 2014 WELLBEING AND POLICY By Gus O’Donnell (Chair) and Angus Deaton Martine Durand David Halpern Richard Layard Commissioned by the Legatum Institute
-
Upload
the-happiness-initiative -
Category
Government & Nonprofit
-
view
306 -
download
1
Transcript of Legatum Institute Report on Well-Being.

www.li.com www.prosperity.com
| REPORT | 2014
WELLBEING AND POLICY
By Gus O’Donnell (Chair) and Angus Deaton
Martine DurandDavid HalpernRichard Layard
Commissioned by the Legatum Institute

©2014 Legatum Limited. All rights reserved. ‘Legatum’, and the Legatum Logo are the subjects of trade mark registrations of affiliates of Legatum Limited. Whilst every care has been taken in the preparation of this report, no responsibility can be taken for any error or omission contained herein.
The Legatum Institute is an independent non-partisan public policy organisation whose research, publications, and programmes advance ideas and policies in support of free and prosperous societies around the world.
The views expressed in this paper are those of the author(s) and not necessarily those of the Legatum Institute.

| 1
COMMISSIONERS’ BIOGRAPHIES
COMMISSIONERS’ BIOGRAPHIES
LORD GUS O’DONNELLLord O’Donnell, currently Chair of Frontier Economics, was the Head of the Civil Service and Cabinet Secretary between 2005 and 2011. Prior to that he served as Permanent Secretary to the Treasury between 2002 and 2005. Additionally he undertook the position as the United Kingdom’s Executive Director at the International Monetary Fund and the World Bank, and has served as Managing Director of Macroeconomic Policy and International Finance at HM Treasury. In January of 2012 he received a peerage and took his seat in the House of Lords. Lord O’Donnell was a Lecturer at the University of Glasgow before joining the civil service and received his M.Phil from Nuffield College, Oxford and his Bachelor’s degree from the University of Warwick.
PROF. ANGUS DEATONAngus Deaton is the Dwight D. Eisenhower Professor of Economics and International Affairs at the Woodrow Wilson School of Public and International Affairs and the Economics Department at Princeton University. He has published numerous papers which examine the relationship between income and wellbeing and how best to measure wellbeing. Most recently, he is the author of The Great Escape: health, wealth and the origins of inequality. He is a fellow of the Econometric Society, the British Academy, the Royal Society of Edinburgh and the American Academy of Arts and Sciences. He holds honorary degrees from the Universities of Rome, London, Edinburgh, and St. Andrews. Prior to Princeton he was Professor of Econometrics at the University of Bristol.
MS. MARTINE DURANDMs. Durand is the Chief Statistician and Director of the OECD Statistics Directorate. She oversees the Organisation’s statistical activities and is responsible for the work on the measurement of well-being and societal progress and the biennial flagship report How’s Life? Measuring Well-Being, as part of the OECD Better Life Initiative. Prior to this position she was Deputy-Director of Employment, Labour, and Social Affairs at the OECD. She has authored numerous papers on well-being,

2 |
COMMISSIONERS’ BIOGRAPHIES
labour markets, social policies, and international migration. She studied mathematics, statistics, and economics from Paris VI University, École Nationale de la Statistique et de l’Administration Économique and the University of Wisconsin-Madison.
DR DAVID HALPERN David Halpern is the Chief Executive of Behavioural Insights and Board Director. He has led the team since its inception in 2010. Prior to that, David was the founding Director of the Institute for Government and between 2001 and 2007 was the Chief Analyst at the Prime Minister’s Strategy Unit. Before entering government, David held tenure at Cambridge, Oxford and Harvard and has written several books and papers on areas relating to behavioural insights and wellbeing, including as a co-author of the MINDSPACE report and the Hidden Wealth of Nations.
PROF. LORD RICHARD LAYARDLord Layard is the Director of the Wellbeing Programme in the Centre for Economic Performance at the London School of Economics. He is the author of the influential book titled Happiness, which argued that social progress should be judged by the extent of happiness and misery. He is a leading authority in the growing debate on happiness and economics. He is also well known for his earlier work on unemployment and inequality. He was educated at King’s College, Cambridge, and the London School of Economics and Political Science.

| 3
ACKNOWLEDGEMENTS
ACKNOWLEDGEMENTS
The Commissioners acknowledge research support and advice from Giulia Greco, Lisa Ollerhead, Ewen McKinnon, Conal Smith, Marty Seligman and Dudley Knowles.
Gus O’Donnell and Richard Layard acknowledge support from the US National Institute of Aging (Grant R01AG040640) for work on wellbeing.
Angus Deaton acknowledges support from National Institute on Aging through the National Bureau of Economic Research, Grants 5R01AG040629–02 and P01 AG05842–14, and through Princeton’s Roybal Center, Grant P30 AG024928.


| 5
CONTENTS
CONTENTS
Prologue 7
Introduction 8
Chapter 1: Economic analysis, policy evaluation, and the role of happiness 17
1. The standard model 18
2. Long-standing, familiar problems 18
3. More recent difficulties 20
4. How can happiness measures help? 21
5. Conclusions 25
Chapter 2: Measuring subjective wellbeing 26
1. Introduction 27
2. Defining subjective wellbeing 28
3. A modular approach to measuring subjective wellbeing 30
4. National initiatives to measure subjective wellbeing 36
5. Policy uses of subjective wellbeing data 38
6. Conclusions 41
Chapter 3: The drivers of subjective wellbeing 42
1. Introduction 43
2. The drivers of wellbeing 44
3. The role of childhood 47
4. Conclusion 48
6 |
CONTENTS
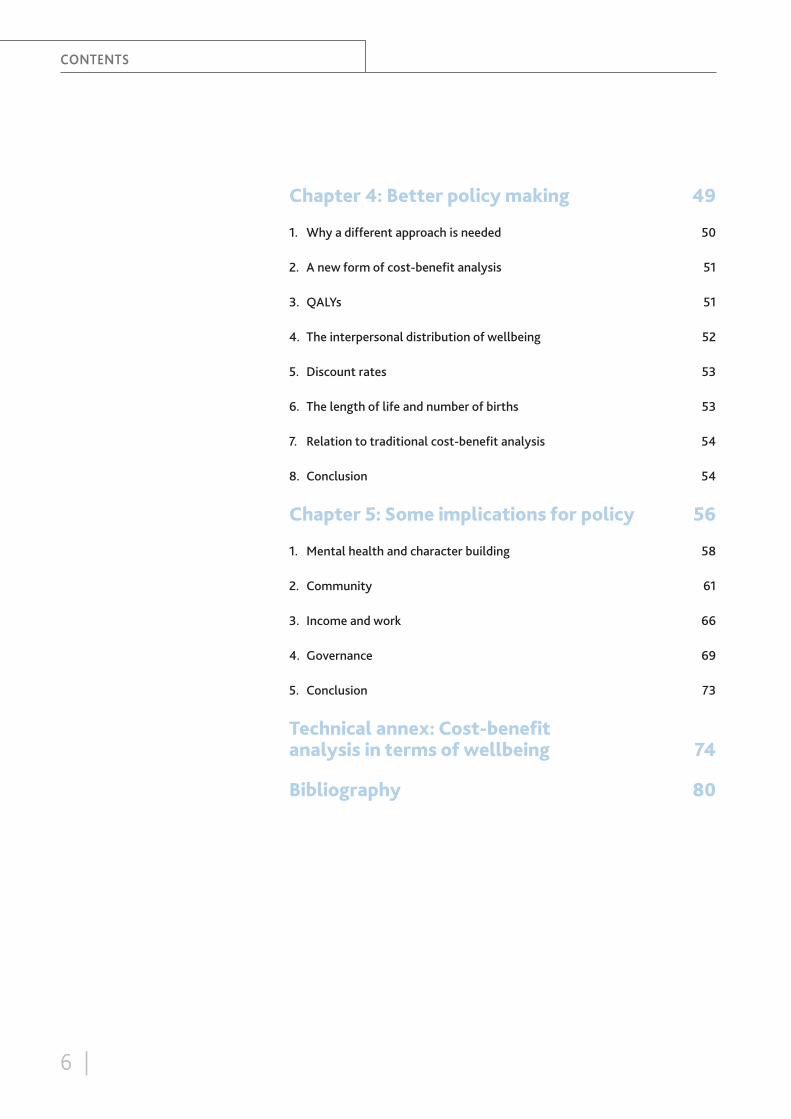
Chapter 4: Better policy making 49
1. Why a different approach is needed 50
2. A new form of cost-benefit analysis 51
3. QALYs 51
4. The interpersonal distribution of wellbeing 52
5. Discount rates 53
6. The length of life and number of births 53
7. Relation to traditional cost-benefit analysis 54
8. Conclusion 54
Chapter 5: Some implications for policy 56
1. Mental health and character building 58
2. Community 61
3. Income and work 66
4. Governance 69
5. Conclusion 73
Technical annex: Cost-benefit analysis in terms of wellbeing 74
Bibliography 80

| 7
PROLOGUE
PROLOGUE
The Legatum Institute established the Commission on Wellbeing and Policy to advance the policy debate on social wellbeing. This report aims to give policy makers a greater understanding of how wellbeing data can be used to improve public policy and advance prosperity.
The Legatum Institute is founded upon the principle that prosperity is a more capacious idea than can be expressed by a purely material measure such as Gross Domestic Product (GDP). Consequently the Institute’s own Prosperity Index is based on both wealth and wellbeing.
The Legatum Institute has sponsored the Commission on Wellbeing and Policy in order to help stimulate a debate as to if and how wellbeing analysis should influence government policy.
The Commission operated independently of the Legatum Institute and its views do not necessarily reflect those of the Institute.

8 |
INTRODUCTION
INTRODUCTION
INTRODUCTION
| 9
1. Little and Mirrlees (1974)
Thirty-four years ago I was recruited as an economist by the UK Treasury and told to revise the Green Book. This was the UK government’s bible on how to perform cost-benefit analysis (CBA). All policy decisions were supposed to be based on an assessment of costs and benefits using these guidelines. In reality, of course, many policies were implemented without any formal CBA, particularly if they had been promised during the election campaign. But as evidence-based policy making became more established, CBA was used much more widely as a way of assessing the merits of different policy options.
Non-economists, who constituted the majority of policy advisers at the time and still do in most countries, tend to list advantages and disadvantages of policies and then use ‘judgement’ to come to a recommendation, or leave the application of ‘judgement’ to the elected decision maker. Such processes make it hard to demonstrate that various decisions have been consistent and also to defend the choices made against, for example, opposition politicians who may have come to different judgements.
CBA is a way of making consistent, rigorous judgements based on explicit assumptions. A good CBA will help a decision maker to defend their judgement and improve the quality of the debate about whether the right policy option has been chosen. CBA was thought to be objective and hence a scientific way to come to decisions. However, as is explained in detail in Chapter 1, it is based on a set of value judgements that many would question.
I had spent my postgraduate years learning from Ian Little and Jim Mirrlees1 who taught me at Nuffield College, Oxford. They had devised a way of doing CBA that was intended primarily for use in developing countries, although in fact it was a more sophisticated form of CBA than was used in most advanced countries. It recognised the pervasive problems of market failures, externalities, and the particular problems of CBA for government projects in health and education. In many cases in developing countries it was impossible to use market prices to value costs and benefits because often they were distorted by taxes, subsidies, or non-competitive markets, or prices simply didn’t exist, since many public goods, like health, were provided free at the point of delivery. The extent of absolute poverty in developing countries also meant that many government policies were designed to help poorer groups most of all. Yet traditional CBA valued a £1 of benefits going to a millionaire at the same level as a £1 accruing to someone scraping a living in the slums of Delhi.
Little and Mirrlees had come up with clever ways of solving these problems but they were complex and in practice were used all too rarely. Politicians were particularly nervous about the distributional issues. I found it odd that ministers could accept a
Why use wellbeing as a measure of progress in society? What are the alternatives? In particular, what is wrong with GDP as a measure?

INTRODUCTION
10 |
2. Stiglitz et al. (2009)3. Speech given by Robert F. Kennedy on March 18,
1968 at University of Kansas www.jfklibrary.org/Research/Research-Aids/Ready-Reference/RFK-Speeches/Remarks-of-Robert-F-Kennedy-at-the-University-of-Kansas-March-18-1968.aspx
4. See Layard (2011)
consistent view about issues like the value of life, or serious injury, or time, yet they were reluctant to be pinned down on any distributional weighting system. These debates were really about how to measure success. It is inevitable that countries will want to measure how well they are doing both over time and compared to other countries. As individuals we all are keen to know how we are doing: Are we top of the class or in the middle of the pack?
So how should we measure success? This is not just a question about our place in a league table. Individuals want to lead more fulfilled lives and governments want to make the right decisions to improve conditions in their countries. Philosophers and social scientists have attempted to answer this question for both individuals and societies, and the intensity of this debate has picked up dramatically in the last few years.
It is also relevant to how we measure success and failure. At the individual and household level we use measures of deprivation to indicate groups that need assistance. For example, the last UK Labour government had a goal of ending child poverty by 2020, a goal accepted by the Coalition when it took over in May 2010. Child poverty was defined as children living in homes with less than 60 percent of median UK incomes. But only looking at incomes can be misleading. Current ministers have argued that factors like unemployment, family breakdown, and addiction should be taken into account. The obvious answer is to measure directly the wellbeing of the children and appraise policies in terms of their impact on wellbeing. We can then debate whether to have targets for raising the bottom levels of wellbeing and about acceptable levels of inequality of wellbeing.
At the country level over the last fifty years, ‘success’ has tended to be measured in terms of Gross Domestic Product (GDP) or GDP per person. This measure is not well suited to modern, service-based economies with larger government sectors. The deficiencies of GDP were spelt out in the Stiglitz, Sen, and Fitoussi report2 and the limitations are broadly accepted by most economists. This is not to say that GDP measures should be dropped: they have a long history and are very useful for marking comparisons over time and between countries (since an international methodology has been agreed). However, they do not tell the whole story, as Robert F. Kennedy pointed out in 1968:
[GNP] measures neither our wit nor our courage, neither our wisdom nor our learning, neither our compassion nor our devotion to our country, it measures everything in short, except that which makes life worthwhile.3
So why don’t we simply go straight to measuring costs and benefits in terms of their impact on overall wellbeing? There is now an understanding that this is the right approach but there remain differences about how to define ‘overall wellbeing’. One solution is to use measures of subjective wellbeing (sometimes expressed as SWB) by which we mean the answers to questions about people’s happiness and satisfaction with their lives.4 This approach fits with a utilitarian view of the world where governments try to maximise the sum of everybody’s happiness (or utility or ‘hedonic experience’). So in this report we focus on subjective wellbeing – or what, for short, we shall often simply call ‘wellbeing’.
This approach has been used in traditional welfare economics. When coupled with assumptions about how utility changes with income, it provides a powerful analytical approach. Unfortunately, the relationship between income and utility is quite complex, for reasons explained in chapters 1 and 3. There are other problems.

INTRODUCTION
| 11
5. Sen (1985)6. Nussbaum and Sen (1993)7. Huxley (1932)8. Bruni et al. (2008), Skidelsky and Skidelsky
(2012), British Academy (2014)
There are profound interactions between people that are not mediated through voluntary exchange – we get some of our tastes from society and our interactions with other members of society are not all of our own choosing. People’s attitudes change over time and depend upon context. For example, I might not be bothered about getting a free drink of water in my everyday life, but if I were imprisoned without food or drink I might be made very ‘happy’ by a simple glass of water. We also know that people adapt to their situation. It is remarkable how the reported wellbeing of people who have lost a limb returns, on average, towards its former level within a few years. The answers to questions about our perceived happiness and life satisfaction can of course be affected by the context in which they are put, and this explains economists’ strong preferences for looking at what people do, not what they say. While GDP measures are usually very precise, they are an incomplete part of the whole. Wellbeing measures are much less precise, but, as explained in Chapter 2, there are ways of handling these problems and at least the subjective wellbeing approach is trying to measure what really matters – our overall wellbeing.
Some, like Amartya Sen5 and Martha Nussbaum6 start from the premise that there is more to life than just utility or happiness. Freedom, rights, and opportunities are examples of other crucial factors that need to be taken into account. Films such as The Matrix have introduced the concept of a human plugged into a machine where they lead a ‘dream’ life. Should we accept that such an individual is in a better state than someone with lower subjective wellbeing living in the ‘real world’? Aldous Huxley’s novel Brave New World 7 posited a society where happiness pills were available to keep the population content. Huxley also wrote of a world where different classes of people were genetically produced and then programmed to have different levels of aspiration. And in some real societies, we have caste systems and different levels of citizenship with more rights for ‘natives’ then migrants. Sen argues that the reported happiness of people is not all that matters: we should also take account of individuals’ freedom of choice and how far society allows them to enhance their capabilities and flourish. Some describe this as how far society allows individuals to lead ‘good lives’. The risk in this approach is that the state ends up defining what constitutes a good life. For more on this debate, see Capabilities and Happiness, edited by L. Bruni et al., The Good Life by R. and E. Skidelsky, and Prospering Wisely by the British Academy.8 It is picked up further in Chapter 2 on measuring subjective wellbeing, which distinguishes measures of life satisfaction, affect and eudaimonics.
In light of this debate, how can we make progress in making better public policy decisions? First, it is sensible to attempt to build institutions, pass laws, and create incentives to raise capabilities and create the environment for citizens to lead fulfilling, satisfying lives. Then when it comes to appraising specific policy decisions, it seems reasonable to look at their impact on reported life satisfaction. If governments are doing a good job, they will be enhancing their citizens’ perceptions of how satisfied overall they are with their lives. Again, it is not a perfect measure, as governments could manipulate aspirations in order to appear more successful. But in societies with a free press, and in a highly interconnected world with widespread access to the Internet and social media, such manipulation is becoming much more difficult.
There are various ways of measuring life satisfaction (or life evaluations), but, reassuringly, different methods tend to produce similar results. However we need to be aware that measures of both life satisfaction and hedonic experience, such

INTRODUCTION
12 |
as ‘How happy were you yesterday?’, are sensitive to issues like the ordering and framing of questions and the way in which the questions are asked, for example, whether by phone or in person. And there is an assumption that people are capable of answering questions about how satisfied they are with their lives. These problems are discussed further in chapters 1 and 2.
In addition, measures of life satisfaction appear to be less subject (though far from immune) to some measurement problems, for example, the impact of the order, or even manner in which questions are asked.
Some examples might help explain when and how wellbeing can best be used in public policy. Take the case of a government that has, for political reasons, intervened to rescue a company operating in an area with few other employment opportunities that would otherwise have gone bankrupt. The decision to intervene might well have been based on protecting the wellbeing of the community. The decision about how best to run the company is probably best made on the traditional ground of restoring it to profitability so it can be returned to the private sector. In contrast, consider the provision of health or education services. Governments around the world tend to provide such services at the point of delivery at prices well below the actual costs. This is to provide benefits to society that outweigh individual benefits and reflect a desire to reduce inequalities. The impact of such government services on wellbeing is one very important measure of the success of these programmes. Indeed, if you consider the areas that are generally provided by the state, such as the criminal justice system, welfare benefits, child support, and help for older groups, they are all very difficult to measure in traditional economic ways because of the absence of market prices. Of course, you may also need to check that while increasing life satisfaction, you are also increasing the capabilities of individuals and society as a whole. For example, you will want to check what education, health, and housing possibilities exist for various groups in society and whether there are any unjustifiable biases in terms of gender, ethnicity, or location for example.
Whatever metric we choose we have to resolve three important issues. First: How do we compare my wellbeing or capabilities with that of someone else? Without a way to make interpersonal comparisons we head down the blind alley of the so-called ‘new welfare economics’. This is where political values come in. In an ideal world the parties would make explicit their weightings and this would be the focus of debate. But this is very unlikely to happen, at least within the next decade or so.
The second problem is how to compare my wellbeing now with my wellbeing next year. Are they equally valuable or should we discount the future? If you give lower weight to a person who has higher wellbeing than someone who has a lower level, as I would, must you also give a ‘future me’ a lower weight than the ‘current me’, if you are sure that the ‘future me’ will have a higher wellbeing level? These may sound like difficult, even unanswerable, questions, but in fact we answer them routinely when we make public policy decisions. These issues, and potential answers, are discussed in Chapter 4.
The third issue is presentational but also important. When presenting CBA results or, say, the impact of a tax or benefit change, policy analysts list the results by income groups. For example, we would show the impact on the top 10 percent down to the bottom 10 percent by income. This is traditional and probably should be retained by now as it is familiar. But we know that for some groups wellbeing and income

INTRODUCTION
| 13
9. Dolan et al. (2010)10. Oliver (2013)
can vary with some having much higher or lower wellbeing than would be expected given their income. Hence it is worth showing the impacts by wellbeing grouping as well.
In general, most of the policy work done by governments tends to value rich and poor alike and to apply a pure time discount to benefits to future generations. It is not easy to reconcile these two decisions but they are so deeply imbedded in the analysis that they are usually not challenged. Perhaps the best solution is to lock the philosophers in a room and not let them out until we have clear usable definitions of wellbeing, and guidelines for how to tackle interpersonal and inter-temporal comparability. In my ideal world, each party would spell out its chosen definitions and measures and then we would be able to assess if governments were making progress, using their own definitions of success. This is a necessary but, alas, not sufficient condition for coherent policy making.
The other step is to look at the micro foundations of public policy. In other words, we need to understand the assumptions made by policy analysts about how people make choices. We have to start by assuming that there is some long-term objective. Economists assume we maximise our utility or wellbeing which is related to our consumption, which in turn depends upon our income. But our earlier discussion of wellbeing is relevant here. It will not do to measure wellbeing simply by looking at income or consumption. This misses out so much of what makes life worth living. One answer is to attempt to maximise subjective wellbeing. Some would want to incorporate capabilities and functioning as well.
Having come up with an acceptable definition of what individuals are trying to maximise, economists then go on to infer from their actual decisions the ‘revealed’ details of their preferences. However, psychologists are warning us that this is very dangerous as individual decisions can be influenced by what many would regard as irrelevant factors. We all know that our decisions can be influenced by factors that, with hindsight, we should have ignored. There are plenty of examples of the importance of ‘framing’, for example, and its effect on decisions. The list of areas where we operate in a way that is not consistent with, or at least generally included in, standard economic models is rather long. The MINDSPACE report9 gives a good list. More examples are given in Chapter 1 and in Behavioural Public Policy, edited by Adam Oliver.10
Once we accept that individuals make choices that might not be in their, or society’s, long-term interest, we have potentially established a role for public policy. Most standard texts in public policy discuss the need for government to deliver public goods, to intervene to tackle market failures and externalities, and to redistribute resources. All these arguments are valid but I believe we should add the consequences of these behavioural ‘failures’ to the list. There is one important caveat: we must never lose sight of the consequences of the same behavioural factors on the ability of governments to tackle all these issues. After all, governments are run by politicians and policies are implemented by public servants, who have their own behavioural motivations. To give you one example, in the UK system, all ministers sit in either the House of Commons or the House of Lords. This means they regularly perform in front of their backbenchers. It is therefore hardly surprising that ministers tend to think of solutions that will be well received in both Houses. Quite often, this imparts a bias towards legislation as the way of solving a policy problem. Yet as a long-term tool, legislation has its disadvantages as it can be very rigid and quickly become ill suited to the dynamic world we inhabit.
INTRODUCTION
14 |
11. Thaler and Sunstein (2008)12. Speech given by the UK Prime Minister David
Cameron on wellbeing on November 25, 2010 www.gov.uk/government/speeches/pm-speech-on-wellbeing
13. Speech given by Chancellor Angela Merkel at the OECD, Paris, on February 19, 2014
14. Speech given by Ben S. Bernanke to the 32nd General Conference of the International Association for Research in Income and Wealth, Cambridge, Massachusetts, on August 6, 2012 www.federalreserve.gov/newsevents/speech/bernanke20120806a.htm
15. Helliwell et al. (2012), Helliwell et al. (2013)
There is a further philosophical issue about whether governments should intervene to correct behavioural ‘mistakes’. Some argue that ‘mistakes’ are impossible as individuals know better than the State what is in their own interests. Others say that even if the State does know better, it should not intervene as otherwise individuals will never learn. Both arguments have some force, but in the end governments have to decide if overall wellbeing will be enhanced by action. Such judgements inevitably involve interpersonal trade-offs, but that is precisely what elected governments are in office to decide, in my view.
However, there is a very strong argument relating to individual freedom. We believe that individual freedom is a hugely important part of wellbeing. An ideal outcome is for individuals to make choices that work for them and society as a whole. There are occasions when individuals make choices that they later regret, for example, not saving enough for retirement. One possible consequence is that the State has to step in to enhance their income. A much better outcome is to ‘nudge’ the individuals to save more and start saving earlier. This is precisely what has happened in the UK with people now being enrolled in their company pension scheme as the default, rather than having to opt in. This policy option maintains people’s freedom either to be enrolled in the scheme or not. An alternative, such as that used in Australia, is to force people to save by making membership compulsory. The UK solution is an example of libertarian paternalism, which is at the core of the recommendations in Sunstein and Thaler’s Nudge (2008).11 It accepts that people will not always do what is in their own long-run interests and in that sense is paternalistic, but it is non-coercive and therefore liberal. The point about nudges is that they should enhance people’s wellbeing, taking into account the benefits of having freedom to choose.
This report explains how governments and individuals can take account of wellbeing and use it for everyday decisions. Chapters 4 and 5 contain plenty of real examples. Countries around the world are becoming attracted to these compelling ideas but are nervous about how they can be made operational. It is our contention that these ideas will lead governments and individuals to make ‘better’ decisions, defined as decisions that will raise wellbeing. The fact is that governments are already moving in this direction, although not all have gone as far as Bhutan in stating that their goal is to maximise ‘Gross National Happiness’. But the prime minister of a centre-right party like the Conservatives in the UK, now governing in coalition with the Liberal Democrats, has said:
We’ll start measuring our progress as a country, not just by how our economy is growing, but by how our lives are improving; not just by our standard of living, but by our quality of life.12
Similarly Chancellor Merkel recently highlighted the importance of wellbeing as she emphasised that:
Industrialised countries do not only have the GDP and growth issues.13
Even hard-nosed central bankers, like Ben Bernanke, have argued:
The ultimate purpose of economics, of course, is to understand and promote the enhancement of wellbeing.14
Very few academics of any discipline, would now argue that a country should attempt to maximise GDP. The Stiglitz Commission firmly rejected that approach. There have now been two World Happiness reports15 looking at global evidence on wellbeing. And the OECD has led the way, looking at various ways to

INTRODUCTION
| 15
16. Knight and Gunatilaka (2010): 113–124; 17. Manski (2013)
measuring overall success that go way beyond simple GDP figures. Their approach to measuring subjective wellbeing in particular is explained in greater depth in Chapter 2. The tide has turned, and with it the scale of research into wellbeing and happiness measures has expanded enormously. We do not yet have all the answers, but we are at least looking in the right place. This report looks at how the world should measure success in the post-GDP only era. This is not an attempt by rich countries to move the goalposts in their favour; it is highly relevant for all countries. For example, in emerging economies like China and India, there will be substantial increases in GDP but it remains to be seen if these will be accompanied by similar rises in wellbeing. Another example is the mass migration from rural areas to big cities that is occurring in many countries around the world. This may be pushing GDP but not wellbeing in many cases.16
This report also considers how to move on from the measurement issue to deciding what governments should do. Chapters 4 and 5 explain how to turn these concepts into practical manuals for decision making. This is work in progress but it is already influencing how governments make real decisions. Certain technical deficiencies need to be overcome and solutions are presented in the report. We believe that it will not be long before national governments and international organisations catch up with these developments.
In Chapter 5 in particular there are numerous policy recommendations based on research that connects issues such as loneliness to wellbeing. In general, this research uses regressions or randomised control trials (RCTs) designed to sort out the separate effect of the specific factor on wellbeing. This is a difficult and often controversial process: the researcher is trying to get away from inferences based on correlations which might be spurious. However, there are always problems about what to use as the relevant controls. For example, could it be that poor people are lonely and that poor people have lower wellbeing because they are poor, rather than that there is a correlation between loneliness and wellbeing? By including both loneliness and income in a regression explaining wellbeing we hope to sort out these separate effects. In practice there are many other variables that matter so we must always be cautious about the quality of the research.
Similarly, RCTs are often regarded as the gold standard in research but they depend on the policies being implemented as precisely as in the trial. Sometimes the sample sizes were not large enough for us to have been confident about the results, and what happens in the trial may not be replicated in a large-scale national roll-out.
In addition, in an ideal world we would be working with models that took account of what economists call ‘general equilibrium’ effects. For example, we may find that people do not like aircraft noise, or do like green parks, but building an airport or a park will change property prices, commuting patterns, and where people live in ways that are not accounted for in the regressions or RCTs. This is why economists have tried to build models to help them think through how these effects might operate. Such models are also not without their drawbacks and they often depend on assumptions about the way people behave that are not supported by the evidence.
Where does this leave us? As policy advisers we need to explain carefully the caveats behind the research when making recommendations. We should also highlight the uncertainties, for example by using ranges rather than spuriously precise point estimates (see Manski, 2013).17 And we need to bear in mind that the decision-makers may start off with very strong prior beliefs that may be based on rather

INTRODUCTION
16 |
18. Keynes (1935)
out-of-date or incomplete evidence. We should remember Keynes’ words from the General Theory: “Practical men, who believe themselves to be quite exempt from any intellectual influence, are usually the slaves of some defunct economist.”18
The purpose of this report is to explain the concept of wellbeing and to suggest how it can be used to improve policy making. Much of the research in this area is new and needs to be treated with caution. Nevertheless, it is often of a higher standard than was used to justify existing policies so if we are to make progress we should have an open mind and think carefully about what really works.
We are not arguing that we have discovered the unique method of measuring success. However, the era of GDP being the unique measure is now over, and that is a positive step. There will be greater debate about what should replace GDP and it is right that countries decide for themselves what should be the key metrics of progress. This report should be seen as signalling the end of the GDP-only world and opening up the wellbeing debate to a broader set of disciplines. We aim to be roughly right, not precisely wrong.
GUS O’DONNELL

| 17
CHAPTER 1
ECONOMIC ANALYSIS, POLICY EVALUATION, AND THE ROLE OF HAPPINESS1

CHAPTER 1
18 |
THE STANDARD MODELThe basic workhorse for economic policy evaluation has long been what we might call the standard model. It assumes that consumers prefer more to less, that they have consistent and relatively stable preferences, and do the best that they can for themselves given the constraints they face. In the simplest version, they choose the bundle of goods and services that they like best given their incomes and the prices of each of those goods and services.
It is no accident that this way of thinking has survived so long because it has many great strengths. It provides a way of predicting behaviour and of thinking about what happens when prices and incomes change. Predictions are integrated with the analysis of welfare. Each individual is doing the best they can for themselves – so there is no role for anyone to interfere with their freely made choices – so choices and wellbeing are seamlessly integrated. We can also figure out what changes in prices and incomes will do for the wellbeing of people, at least in terms of how one thing is valued in terms of another. More specifically, the relative prices of goods are the same as the relative marginal valuations of the people who buy them. Market prices indicate what things are worth to people, at least at the margin.
The link between prices and welfare provides the basis for GDP accounting, as well as for the use of cost-benefit analysis (CBA) using market prices. The two basic welfare theorems of economics provide a link between individual and social welfare: a competitive equilibrium is one of a class of socially optimal arrangements. Utility maximization by individuals sits nicely with utilitarianism in general, or with other kindred approaches, such as the maximization of an equity-preferring social welfare function that respects individual choices. In this framework, there is no need to measure utility, because we have everything that we need. People’s choices reveal everything about their preferences that we need to know. Of course, there would be no harm in measuring utility, if we could do so. But it is unnecessary and, indeed, doing away with utility, marginal utility, and interpersonal comparisons of utility was long thought to be one of the great achievements of modern economics.
LONG-STANDING, FAMILIAR PROBLEMSNone of the above says anything about the distribution of income. Market prices are different depending on who has what, so that whatever ethical significance is carried by prices is conditional on the distribution of income, which may not be one that we like. Cost benefit analysis that uses market prices effectively endorses the status quo distribution of income.

CHAPTER 1
| 19
19. Fesseau and Mattonetti (2013)20. Little and Mirrlees (1974)
In a similar vein, GDP and its components, such as personal income or consumption, tell us nothing about who is getting what. National accountants used to tell us more about this than has been the case recently, and there has been a welcome recent emphasis on doing better on a routine basis. Several national statistical offices are now committed to enabling users to ‘drill down’ into the aggregates and see how consumption, or income, or wealth is distributed over different groups of people.19
The standard model has to be extended to deal with public and publicly provided goods, which often do not have market prices at all, and when market prices exist, do not capture the fact that public goods benefit many people. Indeed, the provision of public goods – goods that people cannot provide for themselves individually, but which can only be provided collectively – is one of the classic roles of government, some would even argue it is the main raison d’être of government. Beyond that, a substantial fraction of what people consume does not come through the market at all, such things as services from owner-occupied homes, state provision of healthcare or education, or goods and services provided by employers to their employees. None of these have observable prices. In GDP, these items are valued by making imputations; these are difficult to do, require sensible but often arbitrary assumptions, and are easily challenged. When doing cost-benefit analysis for these items, which are the very things that the state has to think about, we have no actual prices to guide us.
When doing CBA or welfare analysis more generally, we needed rules for correcting prices when they would be misleading, for example because they contain taxes, or creating prices when they do not exist. In CBA, this is often done by calculating ‘shadow prices’ to be used in place of actual prices. Shadow prices can also be used to incorporate distributional weights, as in the famous guidelines for project evaluation by Little and Mirrlees.20 In principle, shadow prices can also deal with trade-offs between consumption today and consumption in the future. We suspect that, with a few exceptions or for a few key prices, shadow prices were not much used in CBA in rich countries, but in poor countries there was a period when they were used, but this has essentially been abandoned. Shadow prices were seen as too easy to manipulate by interested parties, so that proponents of a project could influence prices in favour of the desired outcome. Even in the best of possible cases, shadow prices – or any prices at all – are hard to calculate, and require many difficult and challengeable assumptions.
In general, we can imagine public policy as being chosen to maximise a social welfare function that respects people’s own tastes over their own budgets, but that also incorporates distributional objectives. This can include the future as well as the past, which is essential for some problems, such as thinking about growth strategies or global warming. These problems can be solved to give optimal policies for direct and indirect taxes, as well as the optimal provision of public goods. Shadow prices are by-products of these kinds of calculations.
There are three important reasons why such approaches are less favoured than once was the case. First, much CBA assumes that we know what is going to happen, and that the problem is judging whether or not it is desirable. This is often not realistic, and a great deal of today’s project evaluation is devoted more to finding out about the outcomes, rather than valuing them, for example by running pilot studies, sometimes incorporating RCTs. The subsequent CBA is typically seen as a relatively straightforward tailpiece to such exercises. Second, maximising social welfare is
CHAPTER 1
20 |
a poor description of how political economy works. Some of the manuals contained instructions for soliciting social welfare functions from finance ministers; those instructions assumed that finance ministers were focused on improving the welfare of all of their citizens, while prioritising that of the poorest. In most poor countries around the world, and in many rich ones, politicians have other concerns. Politicians may be directing projects to buy political support, or helping their cronies get rich, or logrolling to get other things they care about, or rewarding their clients, and so on. Third, the relatively new field of behavioural economics has documented many cases in which the standard model does a poor job of describing the way that people actually behave.
As a result of these three factors, it often seems as if traditional CBA is evaluating something that is not going to happen, using assumptions about motives and behaviour that bear little relationship to reality, and valuations that are plucked out of thin air.
MORE RECENT DIFFICULTIESAny treatment that defines wellbeing over commodities is much too narrow. There are many other things that people care about other than goods and services; they care about health, education, their feelings, their ability to participate effectively in society, and their friendships and relationships with other people. Traditional analysis admits this, of course, but thinks of these things as outside the economic domain, and separate from it. But that is not satisfactory if people are prepared to trade off goods for feelings, for example, or if what happens in one domain has effects in another. Taking too narrow a view can cause serious mistakes in welfare judgements. For example, if some people get very rich, and everyone else’s incomes are unaffected, a standard economic analysis might argue that this makes for a better world. But if rich people use their wealth to turn the political system in their favour, or to block improvements in public healthcare or education, and if we ignore those effects just because they are not economic effects, we can get the judgement dead wrong. If we are trying to judge whether policies are Pareto improving – that is they leave at least one person better off and no one worse off – it is essential that we work in a broad enough space, taking into account all consequences for wellbeing. It is simply wrong to say that an increase in income for one group is fine as long as no one else’s income is reduced.
Another example comes from macroeconomics: an austerity programme or a recession will cause some people to have lower incomes, which economists regularly measure through the change in GDP, or to lose their jobs, which we measure through unemployment rates. But we rarely take into account the worry, stress, or anger that people feel in dealing with these things. Health might also be adversely affected by austerity, though the evidence on this is seriously contested.
Fundamental challenges to the standard model have come from psychologists and behavioural economists, who have catalogued a range of circumstances in which standard economic behaviour (doing the best one can subject to constraints) simply does not describe the way that people actually behave. People procrastinate or, more generally, their trade-offs between things at two distinct times in the future are different today than they will be tomorrow. Loss aversion is another well-known example. People construct mental accounts that erect barriers to making themselves as well off as they might be. And when people look back at an episode,

CHAPTER 1
| 21
their memory of it – which is what helps them to decide whether or not to do it again – turns out to be seriously biased. Recollections of utility from an unpleasant procedure – a visit to the dentist – or a pleasant one – a vacation – do not closely approximate the perceived happiness felt at the time, which can be thought of as the sum of the hedonics that were experienced; instead people make short cuts, averaging the peak and end experiences. One might argue that it is up to people to choose their own way of recollecting, but when debriefed, they tend to recognise that they are making errors. Such findings undermine the essential connection between experienced utility and decision-making utility, and open the way for paternalistic intervention, for others to make decisions for people in their own interests. Such interventions raise issues of personal freedom and agency that are not easily dealt with: the ‘nudge’ programme is one response to this conflict. Note that, if the standard model were true, none of these issues would arise: people do what is good for them, and the idea of interference simply does not arise.
The list of psychological biases is a long one, and they are particularly widespread in decisions involving risk or choices over time; human brains are clearly not evolved to mimic the optimal allocations under uncertainty that are beloved of economists and control engineers. The absurdity of supposing that people routinely solve dynamic inter-temporal optimisation problems under uncertainty (many of which are not solvable on current computers, and which we did not even know how to think about until 40 years ago) has not prevented much of the economics profession thinking about macroeconomics under the assumption that people think this way. Just to give one example, this is important in thinking about policies for mitigating climate change, where many economists insist on discounting the future at an interest rate taken from the bond market, supposing that this ‘price’ reveals the way in which current generations think about future generations. This is surely absurd.
There is a large unfinished research agenda here; economists have to remake economics in a way that somehow incorporates what has been learned from psychologists without discarding the valid and useful parts of economics. Many economists do this informally all the time, picking and choosing which parts of economics to use according to the situation, and not worrying too much about inconsistencies across situations. Yet it would be much better to have a more thoroughgoing treatment that recognises the psychological findings within something that approaches the general applicability of the standard model. This is currently a very active area in theoretical and empirical research, and is one of the main lines in behavioural economics.
HOW CAN HAPPINESS MEASURES HELP?Direct measures of wellbeing (self-reported or subjective wellbeing, or SWB) do not play a part in the standard model, essentially because they are unnecessary. If we can do everything using revealed preference and market prices, then such measures do not add anything essential, and we do not need to confront the many issues about whether such reports are reliable, whether or not they correspond to the things that people are trying to maximise, and so forth. The challenges to the standard model open up new possibilities in which subjective wellbeing might play a role. For example, it was the demonstration that recollections, and thus future decisions, differed from the integral of hedonic wellbeing, that showed that experienced utility and decision utility were different. Similarly, people might have great difficulty deciding on what makes them happy or brings goodness to their lives, and we –
CHAPTER 1
22 |
21. Kahneman and Riis (2005)
or they – might be able to use subjective wellbeing as an indicator of how they are doing. There are many claims along these lines, the most famous being the Easterlin paradox, that we think that material goods will make us happy, but they do not. Adam Smith thought the same, that the attractions of ‘wealth and greatness’ were a deception, and wrote, “it is well that nature imposes on us in this manner. It is this deception that rouses and keeps in continual motion the industry of mankind.” If revealed preference is a bad guide to wellbeing, perhaps self-reports of subjective wellbeing might do better.
Note first that the psychology, particularly the demonstration that experienced utility and decision utility are distinct, rules out one possibility that is often claimed in the literature, that subjective wellbeing corresponds to utility in the standard model. It might be close to what people experience, or it might be what people choose to maximise, but it cannot be both, because they are not the same thing, at least not always.
Beyond that, there are many distinct measures of subjective wellbeing. There are hundreds of different questions that have been used to solicit subjective wellbeing. Some focus on the evaluation of life, or satisfaction with life, some focus on experienced happiness, and some are hybrids, for example questions that ask people how happy they are with their lives. Kahneman21 has made the useful distinction between experiencing life and thinking about life. The former refers to the momentary flow of emotions, mostly fleeting, mostly impossible to remember, reconstruct, or to forecast, but that make up the texture of life as it is lived. The latter refers to measures that come from cognitive reflection on how life is going. Most of the early literature in the economics of happiness made the casual assertion that the different measures were all tapping into the same underlying concept, based on (sometimes not very large) correlations. But it is now clear that this is false. Education is associated with higher life evaluation, but not with better hedonic experience. Hedonic experience varies over the days of the week, and is better at weekends, while life evaluation is the same on all days of the week. Hedonics appear to saturate with income beyond a point, while life evaluation does not. Life evaluation is U-shaped with age, but stress, worry and anger diminish steadily with age from quite young ages.
Given the different measures and concepts, which one is right for thinking about policy, or doing CBA? There are (at least) two serious options. One, which builds on the experiments on experienced utility, and which recognises that the brain cannot integrate momentary feelings, is to fill in for the brain’s failings, and to calculate integrated (or average) experience for people. This can be done by the experienced sampling method (ESM – for further details see Chapter 2 on measurement), which monitors people’s emotions through the day, by the day reconstruction method, which deconstructs yesterday into episodes, and attaches hedonic experiences to each of them, or by ‘yesterday’ questions (did you experience a lot of happiness yesterday?) which are most useful for populations or groups of people. The other option is to use life evaluation or life satisfaction questions directly, and accept them as a reasonable assessment of what people are getting out of life.
The ‘integrated hedonics’ versus ‘life evaluation’ question has not been settled. However, here are some thoughts. One view is that hedonic experience, momentary happiness, sadness, worry, and so on, are best thought of as arguments of utility, rather than as measures of utility itself. One justification is that people seem to regularly trade off these emotions for one another or for other things, something

CHAPTER 1
| 23
22. Kahneman and Krueger (2006): 3–24
that would not be true of overall wellbeing. Life evaluation, or the closely related life satisfaction, is a more plausible candidate for utility, but even here, there is evidence that, in some circumstances, people will trade it for other goals; for example, for the wellbeing of others, which perhaps reasonably enough, they do not include in their assessments of their own wellbeing. Happiness (the emotion, and not, as the term is sometimes used, a synonym for life satisfaction) does not give sufficient recognition to suffering and deprivation; Sen has argued that deprived people may learn to find happiness in small things, or learn to be happy even under appalling conditions, so that we must not use their happiness – which may be a coping strategy – as an excuse to ignore their deprivation. The data from the Gallup World Poll suggest that Sen’s concern is real enough, but only for hedonic happiness, not for life evaluation. Denmark and the Nordic countries regularly lead the world in life evaluation, just as Togo, Sierra Leone, and Zimbabwe lead the legion of dissatisfaction. But Danes (and Italians) experience less happiness than Pakistanis or Nepalis, and there is little or no correlation across countries between per-capita GDP and hedonic happiness. It is hard to believe that these rankings reflect wellbeing, or at least the sort of wellbeing that we want to promote in policy making.
Yet the integral of pleasure has had many defenders, from Bentham and Sidgwick to Singer (and sometimes) Kahneman. Kahneman and Krueger have proposed a U-index, the fraction of time spent in activities or episodes where people are miserable.22 One could imagine directing public policy towards reducing misery measured in such a way. It would probably not be very different from proposals that focus on mental illness, or on a distribution-weighted utilitarianism. Even so, we would argue that misery should be an important component of wellbeing, and should be taken into account in policy, but is not wellbeing itself. For these reasons, the Commission feels that life evaluation (or life satisfaction) measures are the most relevant for policy evaluation.
One area where subjective wellbeing is clearly helpful is that it is sensitive to a much wider range of important things than a standard model that looks only at goods and services. Subjective wellbeing is affected by physical and mental health: it is better among those who spend time with friends and relatives, or at church; it is higher among the married, and lower among the divorced, widowed, or separated; it is lower among smokers and the obese; and it values education and income. It is sensitive to where people live, and picks up negative amenities, like aircraft noise or pollution. Education is valued for more than its instrumental role in generating income, and unemployment is disliked by more than is warranted by its instrumental role in reducing income. Viewed in this way, subjective wellbeing seems like something of a holy grail. It captures what economists think it ought to capture, like income, but has a much wider applicability to things that people care about.
Subjective wellbeing measures can also be used to derive shadow prices. For example, if a given quantum of particulate pollution reduces subjective wellbeing by X, we can then calculate what reduction in income would also reduce subjective wellbeing by X, which is thus the money equivalent of the quantum of pollution. This income equivalent is a shadow price that can be used in CBA to evaluate a project, presumably with some sort of distributional weighting applied to the income equivalences according to who experiences them. Of course, nothing requires that the accounting be done this way, and it would be entirely possible to do CBA or other policy evaluation in units of life satisfaction, just as health evaluations are done in terms of quality adjusted life years (QALYs.) This second approach
CHAPTER 1
24 |
is developed in Chapter 4. Except when money equivalents cannot be calculated – for example when the outcome is not affected by income – the two approaches are equivalent. But there is a distributional case for breaking down net benefits according to the existing wellbeing levels of those they accrue to.
As should be clear already, and as we shall see further below, subjective wellbeing numbers, or their financial equivalents, are far from perfect, sometimes quite rough and ready, and subject to a number of unresolved difficulties. Even so, what is required is not a justification of perfection for such measures. Instead, what we need is a consideration of whether or not these numbers are better or worse than the shadow prices and imputations that are currently used in public decision making. That is a much easier case to make. In particular, for many of the factors that affect people’s wellbeing, and that are picked up by the life-evaluation measures, other approaches offer little or nothing.
So what are the problems and health warnings? For one thing, the fact that subjective wellbeing is sensitive to many things does not imply that it is all that people care about, or that they do not trade off life evaluation for other things that are important to them. If so, we can make public decisions that will improve people’s subjective wellbeing, but that they would have not made for themselves. Of course, this is even truer for the standard income-based measures, which cover even less of what people care about than do the subjective wellbeing measures.
The second problem is that the basic tool for calculating money equivalence is a regression equation in which subjective wellbeing is regressed on a set of factors – like marital status, education, sex, income, race – and where the coefficients can be used directly, or the income coefficient can be used to convert other factors into their money equivalent. Sometimes these regressions make sense, but often they do not. For example, if people are better off in good weather than in bad weather, we know what to make of the finding, and make a reasonable calculation of what people would pay to avoid bad weather. But if we find that people who have children are better or worse off than those who do not, or that those who live in Somerset are better off than those who live in Rutland, the interpretation is obscure. People choose whether or not to have children, and a sensible interpretation would be that people who like having children have children, while those who do not have none, and that there is no reason to expect one group to be better off or worse off than the other, any more than people who like oranges can be expected to be better or worse off than those who like apples, or at least not for that reason alone. Of course, children may cost money, or be more attractive to the educated, so the null result should hold only conditional on the appropriate covariates. Indeed, that null result seems at least roughly consistent with the data in the US and other rich countries. Similarly, if people are unhappy in Somerset, they are free to move to Rutland, or perhaps not if there are moving costs or differences in housing costs. It is not generally the case that when people have a choice, there should be no differences in wellbeing – that is clearly not correct – but what is true is that the mechanical inclusion of choice (or partially chosen) variables in happiness regressions cannot be justified. We need to have some idea of why people live where they do, or why some have children and some do not. Econometricians like to claim that these sorts of problems have technical solutions, such as instrumental variables or the like. But this is wrong; we just substitute one indefensible assumption for another and silence counterarguments by spurious appeals to the supposed higher technical understanding of economists.
CHAPTER 1
| 25
23. Schwarz and Strack (1999): 61–84
Another issue for measuring wellbeing is the existence of pronounced context effects in the answers to questions about subjective wellbeing. Schwarz and Strack23 argue that “SWB judgements do not reflect a stable inner state of wellbeing. Rather they are judgments that individuals form on the spot … resulting in pronounced context effects.” In the US Gallup daily poll, when people are asked about whether they approve of the direction the country is going before they are asked about their own life evaluation, their answer to the first question profoundly affects their answer to the second. This is exactly what Schwarz and Strack predict: people do not carry around with them any notion of how their lives are going and, when asked, look around for something that might serve as an answer. In the Gallup case, this is the judgement they have just formed about how the country is going, not how they are going. The effect of this is large enough to swamp everything else, and while a ‘cleansing’ or transition question after the country question reduces the size of the effect, it does not eliminate it. Recent work at Cornell has shown that the subjective wellbeing-rankings of different social groups is sensitive to the number of call-backs, and in the Gallup data, asking people to rate President Obama’s performance before the subjective wellbeing question causes a reordering of the relative subjective wellbeing standing of whites and blacks.
Questionnaires can be designed to minimise these problems, questions that are likely to distort the measures can be avoided before subjective wellbeing questions and, in some cases, key questions can be asked first (see Chapter 2). The general view of the Commission is that such methods will be enough to preserve the integrity and usefulness of the subjective wellbeing measures. Yet it would be good to have more experimental work to substantiate these beliefs; for now, there remains at least the possibility that the deep problem is not questionnaire design, but that people do not have a firm notion of their satisfaction with their lives. Questions about hedonic experience seem much more concrete and less sensitive to context effects, but, as we have seen, they are less appropriate for policy evaluation.
CONCLUSIONSConventional cost-benefit analysis – using market or shadow prices – is familiar and long-used, but its familiarity should not disguise its problems or the enormously important issues that it does not take into account. Life-evaluation measures, although less familiar and more recently used, have problems of their own, but can provide a method for policy evaluation that holds out hope of giving answers that are more relevant to what is really important in people’s lives.
26 |
CHAPTER 2
MEASURING SUBJECTIVE WELLBEING2

CHAPTER 2
| 27
24. Even where national statistical offices publish measures of subjective wellbeing, these are often reported as ‘experimental’ and not official statistics. Measures of subjective wellbeing used by the research and academic community are mainly collected by private companies, e.g. Gallup World Poll, or researchers’ associations, e.g. World Values Survey
25. Stiglitz et al. (2009), p216
INTRODUCTIONThe notion that subjective perceptions are a fundamental component of quality of life is an old one. Epicurus articulated such a position in ancient Greece, and Bentham made “the greatest happiness for the greatest number” the basis of utilitarian moral philosophy in the late eighteenth century. Since the 1870s, the conceptual underpinnings of modern economics have been based on a utilitarian framework that assumes people act to maximise their subjective preferences. More prosaically, we implicitly acknowledge the significance of subjective perceptions whenever we ask a friend or relative “how are you?” or respond to a doctor asking “tell me if this hurts”.
Despite the centrality of subjective perceptions to both academic and day-to-day conceptions of quality of life, subjective wellbeing has traditionally been regarded as largely not measurable. Consequently, modern attempts to measure quality of life have usually emphasised those dimensions of life that could be measured objectively, and have particularly focused on command over resources. This is reflected in official statistics, where national statistical offices have, with a few notable exceptions, largely been reluctant to collect and publish measures of subjective wellbeing.24
Over the last two decades, there has been an increasing interest in measures of subjective wellbeing from economists and sociologists. This reflects mounting evidence that it can be measured in a valid and reliable fashion. Following the academic literature on subjective wellbeing have come demands from policy makers and NGOs that measures of subjective wellbeing should be available to monitor progress and inform decision making. This has placed measures of subjective wellbeing firmly at the centre of debates about how best to measure quality of life. Perhaps the most high-profile demand of this sort came from the 2009 Report by the Commission on the Measurement of Economic Performance and Social Progress, chaired by Joseph Stiglitz, Amartya Sen, and Jean-Paul Fitoussi. In particular, the Commission noted that:
Recent research has shown that it is possible to collect meaningful and reliable data on subjective wellbeing … National statistical offices should incorporate questions on subjective wellbeing in their standard surveys to capture people’s life evaluations, hedonic experiences and life priorities.25
Following on from the Commission on the Measurement of Economic Performance and Social Progress, an increasing number of statistical agencies have launched initiatives aimed at measuring subjective wellbeing. However, these measures are not necessarily collected in a consistent manner nor do they follow the same

CHAPTER 2
28 |
26. OECD (2013)27. For example, “A New Gauge to See What’s
Beyond Happiness”, New York Times, May 16, 201128. Stiglitz et al. (2009), ONS (2011), OECD (2013) 29. Kahneman et al. (1999), Helliwell and Barrington-
Leigh (2010)
methodology. While subjective wellbeing has been examined extensively in academic literature, including from the perspective of which subjective wellbeing measures to collect, and how to collect them, there was until now no consistent set of guidelines for national statistical agencies drawing on this research. Providing a single, self-contained reference document tailored to the needs of official producers of statistical information in this field was the main motivation for developing the OECD Guidelines on Measuring Subjective Wellbeing.26 The Guidelines published on March 21, 2013 thus represent an important step forward in moving the measurement of subjective wellbeing from a primarily academic activity to the sphere of official statistics.
DEFINING SUBJECTIVE WELLBEINGMeasures of subjective wellbeing are often conflated with, or simply described as, measures of happiness. More disparagingly, the study of measures of subjective wellbeing is often labelled ‘happiology’.27 The implication is that to be concerned with subjective wellbeing is to focus on trivial or fleeting emotions, and that subjective wellbeing is a fuzzy and imprecise topic.
The former view – that subjective wellbeing is trivial or fleeting – is built on the intuition that a full life involves more than just being happy. This line of argument too has a long tradition. In Homer’s Odyssey, Odysseus’s crew are detained in the “land of the Lotus eaters” where they consume the local food and fall into a happy, but apathetic state. It is clear from the poem that passive drugged happiness is one of the hazards that Odysseus must avoid in order to return home to Ithaca, rather than an outcome to be welcomed. Similarly, the US Declaration of Independence identifies “the pursuit of happiness”, rather than its achievement, as one of the inalienable rights of individuals.
The second line of argument is that happiness is a vague and fuzzy topic that cannot be properly defined. Happiness, it is argued, means different things to different people. According to this line of argument it is not possible to put a precise definition around what constitutes happiness, and attempts to measure happiness are therefore fundamentally flawed.
Both arguments would have some weight if the measurement of subjective wellbeing primarily focused around some vaguely defined concept of happiness. This, however, is not the case. In fact, the measurement of subjective wellbeing is about more than simply the measurement of happiness, and there is an emerging consensus in the literature around the nature of the concepts to be measured.28 The framework used by the OECD identifies three broad concepts of subjective wellbeing:
• life evaluation,
• affect, and
• eudaimonia (psychological ‘flourishing’).
Life evaluations capture a reflective assessment of how one’s life is going. They are the result of a cognitive evaluation on the part of the subject rather than a description of current emotional state. A strength of measures of life evaluation is that they appear to be close to the same underlying construct that people use when they decide that one course of action is preferable to another.29 It is for this reason that life evaluations are sometimes characterised as measures of ‘decision

CHAPTER 2
| 29
30. Kahneman and Krueger (2006)31. Kahneman et al. (1999)32. Kahneman and Krueger (2006)33. Kahneman et al. (2004)34. Huppert et al. (2009), Nef (2009), Clark and
Senik (2011)
utility’.30 However, this strength also comes with some disadvantages. In particular, life evaluations draw more on how we remember things, rather than how we experience them. Psychologists note that our memories of an experience tend to be characterised by the peak/end rule.31 The peak/end rule states that our evaluation of an experience tends to be dominated by the most intense (peak) emotion felt during the experience and the emotion felt at the end of the experience rather than on the average or integral of emotional intensity across the experience.
Many of the most commonly used measures of subjective wellbeing are evaluative measures. This reflects the fact that both academic economists and policy makers have a strong interest in the basis on which people make decisions, even if those decisions are based on how they remember things rather than how they experience them. Life evaluations also have the virtue that producers of official statistics, including national statistical offices, tend to find them relatively easy to measure in standard household surveys.
Affect is the term psychologists use to describe a person’s feelings. Measures of affect can be thought of as measures of particular feelings or emotional states, and are often measured with reference to a particular point in time. Such measures capture how people experience life rather than how they remember it.32 While an overall evaluation of life can be captured in a single measure, affect has at least two distinct hedonic dimensions: positive affect and negative affect. Positive affect captures positive emotions such as the experience of happiness, joy, and contentment. Negative affect, on the other hand, comprises the experience of unpleasant emotional states such as sadness, anger, fear, and anxiety. While positive affect is thought to be largely uni-dimensional (in that positive emotions are strongly correlated with each other), negative affect is more multi-dimensional. For example, it is possible at one given moment to feel anger and also fear or sadness.
The measurement of affect is more challenging for official statistics producers than life evaluation. They find it difficult to ask people to recall affective states in the past and responses may be affected by recall biases such as the peak/end rule mentioned above. One way of measuring affect is the experience sampling method (ESM), often referred to as the gold standard, where an electronic device is used to prompt people to record their feelings and perhaps the activity they are undertaking at either random or fixed points over a period of time. While the ESM produces an accurate record of affect, it is also expensive to implement and intrusive for respondents. A more viable approach is the use of the day reconstruction method (DRM), in which respondents are questioned about events from a time-use diary recorded on the previous day. Research has shown that DRM produces results comparable with ESM, but with an acceptable respondent burden for including questions on affect in national time-use surveys33 At the cost of slightly less detail, it is also possible to obtain meaningful responses to questions in a standard household survey as to whether a person experienced particular affective states on the previous day.
Eudaimonic wellbeing comprises a range of different mental attributes and functionings that are thought to constitute mental ‘flourishing’ .34 This includes a sense of meaning or purpose in life, as well as feelings of agency and locus of control. While there is now a general consensus on the distinction between life evaluations and measures of affect, the conceptual structure of eudaimonic wellbeing is less well fleshed out. It is not clear, for example, whether eudaimonic wellbeing describes a uni-dimensional concept in the sense of life evaluation, or whether the term is

CHAPTER 2
30 |
35. Dolan et al. (2008), Deaton and Stone (2014)36. Kahneman et al. (2004)37. Nef (2009)38. This analysis is based on correlations at the
level of individuals from the Gallup World Poll data. The correlation is highest between the two measures of affect (-0.3855), and lowest between purpose and negative affect (-.091). Life satisfaction has a correlation about half as strong with both measures of affect (0.229, -0.231), and half that with purpose (0.134). Similar patterns emerge if the analysis is conducted at the level of country averages. See also Clark and Senik (2011)
39. Gilbert (2006), Helliwell et al. (2012), and Diener and Suh (1999)
used to cover a range of different sub-concepts. It is, however, clear that eudaimonic measures of wellbeing capture important aspects of subjective perceptions about wellbeing not covered by life evaluations or affect. For example, having children has been shown to have a negligible (or even mild negative) correlation with average levels of life evaluation,35 and child care (even of one’s own children) has been shown to be associated with high levels of both positive and negative affect.36 However, people with children report much higher levels of meaning or purpose in their lives.37
Life evaluation, positive and negative affect, and eudaimonic wellbeing are all conceptually distinct. But are they empirically distinct? Analysis of correlations between people’s responses to measures of life evaluation, positive affect, negative affect, and eudaimonic wellbeing shows that the measures are related in the expected direction – i.e. life evaluation, positive affect, and eudaimonic wellbeing are positively correlated with each other and negatively correlated with negative affect. However, all of these correlations are below 50 percent, indicating that the measures capture distinct concepts.38
Feeling happy is an example of positive affect. However, adequately measuring subjective wellbeing also requires separately measuring negative affect, life evaluations, and eudaimonic wellbeing. Although these concepts are related to one another they are distinct. In a sense, criticisms of ‘happiology’ are justified in that wellbeing is more than just happiness. However, the measurement of subjective wellbeing is not just the measurement of happiness.
Before proceeding any further, whatever the definition used, it is worth asking: Is there real information content in how people answer questions about their wellbeing? Overwhelming evidence confirms that there is.39 First, we can go a long way to explaining the answers, as this and the next chapter show. Second, the answers have major predictive power: they help predict whether people will quit their jobs, leave their spouses, and even how long they will live (holding constant their initial health). Moreover, what people say about themselves is quite well correlated with what their friends say about them, and also with objective measurement of electrical activity in the relevant brain areas.
A MODULAR APPROACH TO MEASURING SUBJECTIVE WELLBEINGGiven the range of different concepts covered by the term subjective wellbeing it is not possible to identify a single correct way to measure subjective wellbeing as a whole. Different measures capture different concepts, and the most appropriate measure will vary depending on the circumstances. Any strategy for measuring subjective wellbeing needs to address this issue.
For national statistical offices, collecting information on subjective wellbeing means using survey instruments. In selecting questions to incorporate into existing or new survey vehicles, statistical agencies face trade-offs between the time taken to ask any new questions, the potential impact of new questions on responses to existing questions, and the added information gained from the new questions. These trade-offs will come under particularly severe scrutiny if the survey in question refers to an important and well-established concept (e.g. household income or unemployment).

CHAPTER 2
| 31
Core measures of subjective wellbeingCore measures of subjective wellbeing are those for which there is the most evidence of validity and relevance, for which the results are best understood, and for which policy uses are most developed. Although limited to a few questions, the core measures provide the foundation for comparisons of the level and distribution of life evaluations and affect between countries, over time, and between population groups (see Box 1).
Data producers are thus encouraged to use the core measures in their entirety. The entire module should take less than two minutes to complete in most instances. It includes a basic measure of overall life evaluation and three affect questions. A single experimental eudaimonic measure is also included.
There are two elements to the core measures module. The first is the primary measure of life evaluation (question A1). This represents, in the OECD assessment, the absolute minimum required to measure subjective wellbeing, and it is recommended that all national statistical agencies include this measure in one of their annual household surveys. The primary measure is intended to be collected consistently across countries and should be the first question included in surveys where the measurement of subjective wellbeing is considered.
The second element consists of a short series of affect questions and the experimental eudaimonic question. These measures complement the primary
BOX 1. OECD CORE MEASURES OF SUBJECTIVE WELLBEING
PRIMARY MEASUREThe following question asks how satisfied you feel, on a scale from 0 to 10. Zero means you feel ‘not at all satisfied’ and 10 means you feel ‘completely satisfied’.
A1. Overall, how satisfied are you with life as a whole these days? [0–10]
ADDITIONAL CORE MEASURESThe following question asks how worthwhile you feel the things you do in your life are, on a scale from 0 to 10. Zero means you feel the things you do in your life are ‘not at all worthwhile’, and 10 means ‘completely worthwhile’.
A2. Overall, to what extent do you feel the things you do in your life are worthwhile? [0–10]
The following questions ask about how you felt yesterday on a scale from 0 to 10. Zero means you did not experience the feeling ‘at all’ yesterday while 10 means you experienced the feeling ‘all of the time’ yesterday. I will now read out a list of ways you might have felt yesterday.
A3. How about happy? [0–10]
A4. How about worried? [0–10]
A5. How about depressed? [0–10]
Source: OECD, 2013
CHAPTER 2
32 |
40. Please imagine a ladder with steps numbered from zero at the bottom to ten at the top. Suppose we say that the top of the ladder represents the best possible life for you and the bottom of the ladder represents the worst possible life for you. If the top step is 10 and the bottom step is 0, on which step of the ladder do you feel you personally stand at the present time?
41. Overall, how satisfied are you with your life nowadays?
42. Some versions of the satisfaction with life question use different response scales, such as a 5-point labelled Likert scale or a 1–10 scale. See Cummins and Gullone (2000)
43. See Larsen and Fredrickson (1999). Technically the Circumplex model implies that positive and negative affect are ends of a single dimension rather than a way of grouping several independent types of feeling. Here the Circumplex model is used as an organising framework to help impose some structure on the range of different affective states, without assuming continuity on the positive/negative axis
evaluative measure both because they capture different aspects of subjective wellbeing (with a different set of drivers) and because the different nature of the measures means that they are affected in different ways by cultural and other sources of measurement error. While it is highly desirable that these questions are collected along with the primary measure as part of the core, these questions should be considered a somewhat lower priority than the primary measure. In particular, the inclusion of the eudaimonic measure in the core should be considered experimental.
Choosing questions for the core measuresThe choice of questions to be included in the core measures is one of the most significant decisions to make.
There are essentially two candidate questions for the primary measure. These are the Self-Anchoring Striving Scale40 (the Cantril Ladder) and a version of the commonly used question on satisfaction with life.41 Both have been widely used and have an extensive literature attesting to their validity and reliability. Both questions focus on the evaluative aspect of subjective wellbeing and have been used in large-scale surveys across many different nations and cultures. The choice between the two measures comes down to a balancing of the strengths and weaknesses of each measure.
The Cantril Ladder is designed to be self-anchoring, meaning that the scale is explicitly framed relative to the respondent’s aspirations. While recent evidence suggests that the Cantril Ladder tends to produce a marginally wider distribution of responses than does satisfaction with life, the two measures are essentially equivalent. However, the Cantril Ladder question is relatively lengthy, requiring some explanation of the ladder concept involved to the person participating in the survey.
By way of contrast, the satisfaction-with-life question is simple and relatively intuitive. Although both measures have been extensively used, the satisfaction-with-life question has been the subject of more analysis than the Cantril Ladder, reflected in its inclusion not just in the World Values Survey, but also in crucial panel data sets such as the German Socio-Economic Panel and the British Household Panel Survey.
The Cantril Ladder and the satisfaction-with-life question are relatively similar in terms of their technical suitability for use as an over-arching evaluative measure, particularly if both use the same 11-point (0 to 10) scale.42 Given the above, the primary measure included in the core module has been chosen as a variant of the satisfaction-with-life question using a 0 to 10 scale. The decisive factor in favour of this choice is the relative simplicity of the question, which will make it easier for national statistical offices to incorporate in large-scale household surveys where respondent burden is a significant issue.
Three affect questions are also included in the core module. This is because affect is inherently multi-dimensional and no single question can capture overall affect. The various dimensions of affect can be classified in two ways. One relates to positive versus negative emotions, while the other relates to level of arousal. This classification gives four affect quadrants and is known as the Circumplex model.43 Figure 1 illustrates the Circumplex model. The quadrants are: positive low arousal (e.g. contentment); positive high arousal (e.g. joy); negative low arousal (e.g. sadness); and negative high arousal (e.g. anger, stress). A good set of affect measures might attempt to cover all four quadrants.

CHAPTER 2
| 33
44. Kahneman and Deaton (2010)45. Davern et al. (2007)46. Other moods, such as anger, are included in other
more detailed modules (see Box 2) 47. The European Social Survey flourishing module
contains questions on competence, engagement, meaning, optimism, positive relationships, resilience, self-esteem, emotional stability, vitality, and positive emotion. See Huppert and So (2008) for more detail
48. NEF (2012)
FIGURE 1. THE CIRCUMPLEX MODEL OF AFFECT
Source: Derived from Russell (1980)
Unlike overall life satisfaction, there is not an obvious choice of a simple affect measure that is suitable for inclusion in general household surveys. Most affect scales have been developed in the context of either the measurement of mental health or of more general psychological research. In the former case, many of the existing scales focus excessively on negative affect, while in the latter the questionnaire may be too long for practical use in a household survey. One model for collecting affect measures in a household survey is provided by the Gallup World Poll, which contains a range of questions on affect covering happiness, sadness, enjoyment, worry, anger, stress, and depression, as well as some physical indicators such as smiling or experiencing physical pain, experienced by the respondent over the previous day. These questions now have a significant history of use and analysis behind them.44 A very similar set of questions (on positive affect only) was proposed by Davern, Cummins, and Stokes.45
The affect questions contained in the core questions module are based on those in the Gallup World Poll and proposed by Davern et al. (2007), but reduced to questions covering the negative quadrants of the Circumplex model of affect and a single positive affect question. Only one positive question is used because the different aspects of positive affect are, in practice, relatively closely correlated. The moods proposed for measurement in the OECD core set are being happy, worried, and depressed.46 In each case, a 0 to 10 frequency scale is used for responses (ranging from ‘not at all’ to ‘all of the time’, which is similar to the scale anchors used in the European Social Survey47).
The eudaimonic question is based on a question trialled by the UK Office of National Statistics (ONS) in the Annual Population Survey: “To what extent do you feel the things you do in your life are worthwhile?” There is good evidence from the ONS data that this question captures information not provided by either life evaluation or affect measures.48 In addition, a similar question has been included in the ad hoc wellbeing module of the European Union Survey of Income and Living Conditions (EU-SILC) in 2013. The question proposed here is similar to that used
MISERY PLEASURE
DISTRESS
DEPRESSION
EXCITEMENT
CONTENTMENT
AROUSAL
SLEEPINESS

CHAPTER 2
34 |
49. For statistical agencies already using subjective wellbeing measures in their surveys, a crucial question will be whether the potential benefit of using improved and/or more internationally comparable measures outweighs the potential cost of disrupting an established time series. This is a choice for individual statistical agencies, and will depend on a number of factors, including the current and future intended uses of the data, how drastic the change may be, and how long the time series have been established. In any case, it is recommended that any changes to existing questions are phased in using parallel samples, so that the impact of the change can be fully documented and examined. This will enable insights into the systematic impact of changes in methodology and provide agencies with a potential method for adjusting previous data sets (e.g. Deaton, 2011)
50. OECD (2013)
by the ONS and in EU-SILC. However, because there is as yet no over-arching theory linking individual questions such as the one proposed to measure eudaimonia as a broad concept, the question should be regarded as experimental. In particular, although notions of meaning or purpose in life are a crucial part of eudaimonia, it is unclear as to whether a single question of this sort adequately captures all of the relevant aspects of it.
Additional measures beyond the core In recognition of the different user needs and resources available to statistics producers, the OECD Guidelines do not present a single approach to gathering information on subjective wellbeing. Instead, six question modules are presented in the Guidelines (see Box 2). In addition to the core module that measures all three aspects of subjective wellbeing (life evaluation, affect, and eudaimonia), additional modules (B to F) focus on more specific aspects of subjective wellbeing. Unlike for the core module, these additional modules are not intended to be used in their entirety or unaltered, but provide a reference for statistical agencies that are developing their own questionnaires.49
BOX 2. OECD QUESTION MODULES: BEYOND THE CORE
Much of the OECD Guidelines focus on the minimal set of questions for which international comparability is the highest priority. These are outlined in the core module (Module A in Box 1) containing the primary measure of life evaluation and a short set of questions addressing affect and eudaimonia. However, because the core questions are intended to be widely used, they are also brief. This brevity prevents the core module from dealing with any of the aspects of subjective wellbeing in great depth.
The remaining five modules in the OECD Guidelines address the issue of depth. The first three of these modules (modules B, C, and D) address the concepts of life evaluation, affect, and eudaimonic wellbeing in more detail. Each module includes a range of measures related to the concept including multi-item scales consisting of several separate questions and measures of the different sub-dimensions related to each concept.
Multi-item scales are important because some of these – such as the Satisfaction with Life Scale – are well tested and known to have higher statistical reliability than the single item questions contained in the core module. Although too long to include in the core, they may be valuable for national statistical offices to include in surveys where subjective wellbeing is an important focus and more time is available. Alternatively, they may be useful in more experimental contexts to help validate the single item measures used in the core.
Measures of sub-dimensions are particularly important for affect and eudaimonia. While the measures of affect included in the core will provide a useful summary, for some purposes more detailed information may be wanted. There is good evidence that the negative emotions in particular are only weakly correlated with each other and with positive affect.50 This means that measuring additional negative emotions (such as anger) adds unique value to measurement.

CHAPTER 2
| 35
51. UNICEF (2007)52. For example, Deaton (2011) notes that “even
with 30,000 observations … would mean that we would just be able to detect the predicted effects of a major macroeconomic upheaval”. Based on recommendations from an expert advisory group, the UK Office for National Statistics opted to collect measures of subjective wellbeing via the Annual Population Survey, with a sample size of approximately 170,000 and the Gallup Daily Poll in the US collects information on 1,000 respondents per day
Best practice in data collectionMeasuring subjective wellbeing in a consistent fashion requires not only using a common set of questions, but also taking into account a range of issues in survey design and implementation. It is important to consider the survey in which the subjective-wellbeing questions are to be included as this affects both the type of information that can be collected and the range of covariates that can be analysed. Beyond this, the specific details of survey and sample design, questionnaire design, and how the survey is implemented are also of crucial importance (see OECD Guidelines, 2013 for a detailed discussion). In particular, it is of crucial importance that the survey sample is either directly representative of individuals in the population of interest or able to be weighted for individual responses in the case of a household survey – a subjective evaluation of someone else’s life is not a substitute for a person reporting on their own state of mind. The survey sample will need to be relatively large, as many of the changes in levels of subjective wellbeing that are of interest will be relatively small. Hence, a large sample size is required to detect significant differences.52 Surveys should also be relatively frequent in order to distinguish between trend over time and noise in the data. The period during which the survey is collected can have a significant impact on responses. If it is not possible that enumeration take place over a full calendar year, then particular care will be needed to consider the impact of potential timing effects when analysing results. It is also important that, if at all possible, questions on subjective wellbeing should be placed near the start of a survey (ideally immediately after the demographic questions that determine eligibility to participate) in order to avoid context and
Module E is different to the previous modules in that it focuses on people’s evaluations of particular aspects of their life such as satisfaction with their health status or satisfaction with their personal relationships. These ‘domain evaluations’ are more specific than overall life evaluation, but can play an important role in measuring overall wellbeing and in explaining variation in overall life evaluation.
Finally, module F focuses on the measurement of experienced wellbeing through time-use diaries. Experienced-wellbeing measures involve collecting information on the moods and emotions people experience during different activities through the use of a time-use diary or via experience sampling where people record their activity and affective state whenever prompted to by a pager. Obviously such data cannot be collected through a standard household survey, and are thus not suitable for the core measures. But such data are extremely valuable and provide a different set of insights to the more standard survey questions. Module F provides two standard approaches for collecting experienced-wellbeing data that can be implemented in official time-use surveys.
All of the OECD question modules focus on information for surveys of the general population. However, there is also an important policy interest in the subjective wellbeing of children. The available evidence suggests that children are capable of responding effectively to subjective wellbeing questions from as young as age 11 with respect to measures of life evaluation and affective state.51 As the focus of the OECD Guidelines is on general population surveys, questions focused specifically at young children are therefore not provided in the question modules; however, this remains a significant gap that future work should address.

CHAPTER 2
36 |
53. Deaton (2011)54. OECD (2013)55. Deaton (2011), OECD (2013)
framing effects resulting from previous questions affecting how people respond to subjective-wellbeing questions (see Box 3).
NATIONAL INITIATIVES TO MEASURE SUBJECTIVE WELLBEINGAs mentioned in Box 3, subjective-wellbeing measures can be strongly affected by question structure and context, and the results from differently worded questions (or even a different ordering of similar questions) are likely to affect comparability. Yet comparability is a key point of interest for decision makers, who will often want to benchmark the situation of one region, country, or population group against another. Only national statistical offices working towards a common set of international
BOX 3. VALIDITY OF SUBJECTIVE WELLBEING MEASURES: CONTEXT AND PRIMING EFFECTS
The order and context in which a question is asked, the nature of preceding questions, and the time at which a question is asked can all have a significant impact on responses to subjective questions. There is also good evidence that the collection mode has an impact on responses to subjective-wellbeing questions (OECD, 2013). Although measures of subjective wellbeing are not uniquely susceptible to such effects – mode and context will impact on all survey responses to some extent – the effect is relatively large in the case of subjective wellbeing. For example, unlike measures of educational attainment or marital status, for which it does not usually matter at what point during the year the data are collected, the precise timing of the collection period can have a significant impact on measured subjective wellbeing. Deaton53 shows that responses in the Gallup Daily Poll to the Cantril-ladder question – a measure of life evaluation – were significantly influenced by a preceding question on the direction in which the country was headed.
Context and priming effects are thus significant, but this does not suggest that subjective measures of wellbeing entirely lack validity. Despite the impact of these effects, subjective-wellbeing measures show correlations both with other proxies for a respondent’s sense of wellbeing (including frequency of smiling, ratings by friends and family members, ratings by strangers, and changes in behaviour) and with the main factors thought to drive wellbeing (income, health, social contact, not being unemployed).54 There is signal, as well as noise, in measures of subjective wellbeing.
With sound questionnaire design, bias due to priming and context effects can be significantly reduced. In particular, there is evidence to suggest that appropriately worded introductory text and buffer questions before questions on subjective wellbeing can help reduce the impact of context and priming on respondents.55 For many purposes, however, simply holding the bias constant by standardising the question used and the order of questions between survey waves and countries will help a lot. Standardisation ensures that the bias is in the same direction across the most important groups for analysis, while a large sample size helps distinguish the signal from noise.

CHAPTER 2
| 37
standards have the ability to collect the sufficiently large, high quality data sets that will address these problems and thus allow measures of subjective wellbeing to be effectively used for policy. It is for this reason that progress in the uptake of measures of subjective wellbeing in official statistics is so important.
TABLE 1. AVAILABILITY OF OFFICIAL NATIONAL STATISTICS ON SUBJECTIVE WELLBEING
COUNTRY PRIMARY MEASURE
OTHER CORE MEASURES
PERIODICITY DATE FOR COMPARABLE DATA
SOURCE
LIFE EVALUATION AFFECT EUDAIMONIA
Canada Yes* Yes** No Yearly 1985 General Social Survey (GSS), Statistics Canada
France Yes* No No To be determined 2011 Enquête sur la qualité de la vie, INSEE
No Yes* No To be determined 2010 Enquête Emploi du temps, INSEE
Italy Yes* No No Yearly 2012 Annual survey, Aspects of everyday life (Indagine multiscopo Aspetti della vita quotidiana), ISTAT
Mexico Yes* Yes* No Every two years 2012 Encuesta Nacional de Gastos de los Hogares, Subjective wellbeing (Bienestar Autorreportado – BIARE), INEGI
No No Yes* Quarterly 2013 Consumer Confidence Survey (ENCO), INEGI
Morocco Yes* No No To be determined 2012 Enquête Nationale sur le Bien-être, Haut Commissariat au Plan
New Zealand Yes** No Yes** Every two years 2014 New Zealand General Social Survey (NZGSS), Statistics New Zealand
United Kingdom
Yes* Yes* Yes* Quarterly 2011 Annual Population Survey (APS), Office for National Statistics
Yes* Yes* Yes* Yearly 2012 Crime Survey for England and Wales, Office for National Statistics
Yes* Yes* Yes* Yearly 2011 Wealth and Assets Survey, Office for National Statistics
United States No Yes*** Yes*** To be determined 2011 American Time Use Survey, Bureau of Labour Statistics
European Union
Yes* Yes** Yes* To be determined (potentially every six years)
2013 EU-SILC 2013, Module Wellbeing
* In line with the OECD Guidelines on Measuring Subjective Wellbeing
** Intend to be in line with the OECD Guidelines on Measuring Subjective Wellbeing
*** The US included subjective wellbeing indicators on experienced affect and eudaimonia in the American Time Use Survey 2011 (ATUS). These use a 0 to 6
scale but otherwise adopt a similar methodology to the OECD (and informed the OECD Guidelines).

CHAPTER 2
38 |
When the OECD produced the first How’s Life? report in 2011,56 providing broad measures of progress in OECD countries, the chapter on subjective wellbeing had to draw entirely on non-official sources of data. At the time, France and Canada were the only two OECD countries with high-quality official measures of life evaluation similar to that which was eventually selected as the primary measure in the Guidelines. In the two years since then, the situation has significantly changed. Table 1 lists the OECD countries that are either currently producing official measures of subjective wellbeing that align with the OECD Guidelines or that are in the process of planning for such a collection within the next 12 to 18 months. In particular, the table focuses on those countries that collect either the OECD primary measure or something directly equivalent to it.
One of the most important developments identified in Table 1 is the inclusion of a wellbeing module as an add-on to the main EU survey of living conditions (EU-SILC). This module includes a question on life evaluation directly comparable to the OECD primary measure and a eudaimonic question that is very close to the one in the OECD core measures. As EU-SILC covers 27 EU countries as well as Croatia, Iceland, Norway, Switzerland, and Turkey, this will extend the available data from approximately a quarter of the OECD (those countries listed in Table 1) to the majority of the OECD, albeit with data updated only when the wellbeing module is run every six years. More importantly, although the decision has not been finalised, Eurostat (the EU Statistical Agency) has indicated that it is also considering including the primary life-evaluation measure in the core of EU-SILC. This would make high quality annual data on life satisfaction available for the majority of the OECD.
Beyond the information contained in Table 1 there is considerable interest in subjective data from many other countries both within the OECD and beyond. It is to be expected that over the next 18 months a significant number of additional countries will be added to the table.
POLICY USES OF SUBJECTIVE WELLBEING DATA Measures of subjective wellbeing are important because they provide relevant information that other, more traditional, measures cannot. In particular, measures of subjective wellbeing can:
• Complement existing wellbeing measures at an aggregate national level;
• Enable us to understand better the drivers of subjective wellbeing at the level of the individual, and quantify the importance of different outcomes; and
• Assist in understanding human behaviour and decision making, particularly where non-market outcomes are involved, for input for other analyses, particularly cost-benefit analysis.
Complement existing wellbeing measuresMeasures of subjective wellbeing provide an alternative and complementary measure of overall progress to more conventional measures that is firmly grounded in aspects of life that actually matter to people. Because it provides an overall picture, subjective wellbeing can help identify situations where more traditional indicators 56. OECD (2011)

CHAPTER 2
| 39
57. Grimes et al. (2012)58. See Chapter 159. Dolan et al. (2008)60. Helliwell (2008)61. Frey and Stutzer (2000)62. Clark and Oswald (2002), Dolan and
Metcalfe (2008)63. Dolan and Metcalfe (2008)
are missing something important by highlighting that different measures are moving in different ways. For example, Grimes, Oxley, and Tarrant (2012)57 show that life satisfaction adds significant explanatory power to a model of migration flows across the OECD over and above GDP per capita, indicating that life satisfaction captures aspects relevant to people’s actual choices other than traditional economic measures.
Better understand the drivers of subjective wellbeing Subjective-wellbeing measures can be used to test empirically which objective conditions are significant components of individual wellbeing. With appropriate analysis this may allow the estimation of the relative importance of different factors and how this impact may differ across different population groups. Subjective wellbeing provides analysts with valuable information about what matters and what is most important to individuals beyond the relatively limited inferences that can be drawn from market prices.58
In general, the evidence from subjective wellbeing supports intuitive views as to what matters to people – health, income, not being unemployed, and social contact are all important.59 However, it can also provide some more surprising results, such as that procedural issues have an intrinsic contribution to wellbeing, not just an instrumental one. For example, both feelings of confidence in government and public institutions,60 and the level of direct democratic engagement through referenda and other means61 are associated with high levels of subjective wellbeing.
Input for other analyses, particularly cost-benefit analysis Analysis of subjective-wellbeing measures can shed light on some of the fundamental assumptions about human behaviour. For example, the axiom that efficiently functioning markets maximise wellbeing depends crucially on the extent to which people are able to make choices that will in effect enhance their wellbeing. Subjective-wellbeing measures can take the debate beyond a simple theoretical argument about whether there are externalities present or whether people are fully rational, and enable analysis of what sorts of errors people actually make in forecasting their future affective states, and how significant errors in judgements of this sort are compared to other factors. This type of information is crucial to policy making, since a lot of public policy is focused on altering the behaviour of individuals. For example, retirement income policy is largely justified on the basis that individuals are not good judges of their own future wellbeing, or that their future wellbeing is given relatively little weight in decision making compared to current wellbeing.
One particularly important policy use of measures of subjective wellbeing is in the treatment of non-monetary outcomes in cost-benefit analysis.62 Existing ways of obtaining values of non-monetary outcomes for cost-benefit analysis – such as willingness to pay or the use of shadow prices – are expensive to collect and known to produce results that are neither always intuitively plausible, nor internally consistent, and which can be heavily affected by strategic decisions on the part of those surveyed.63 Measures of subjective wellbeing are cheaper to collect, produce relatively consistent results, and are mostly immune to strategic manipulation by respondents. For example, by looking at the marginal impact on subjective wellbeing of say, an improvement in health status as opposed to moving from employment to unemployment, it is possible to estimate the effects of a given output on wellbeing. Combining this information with figures for the cost of purchasing each output, it is
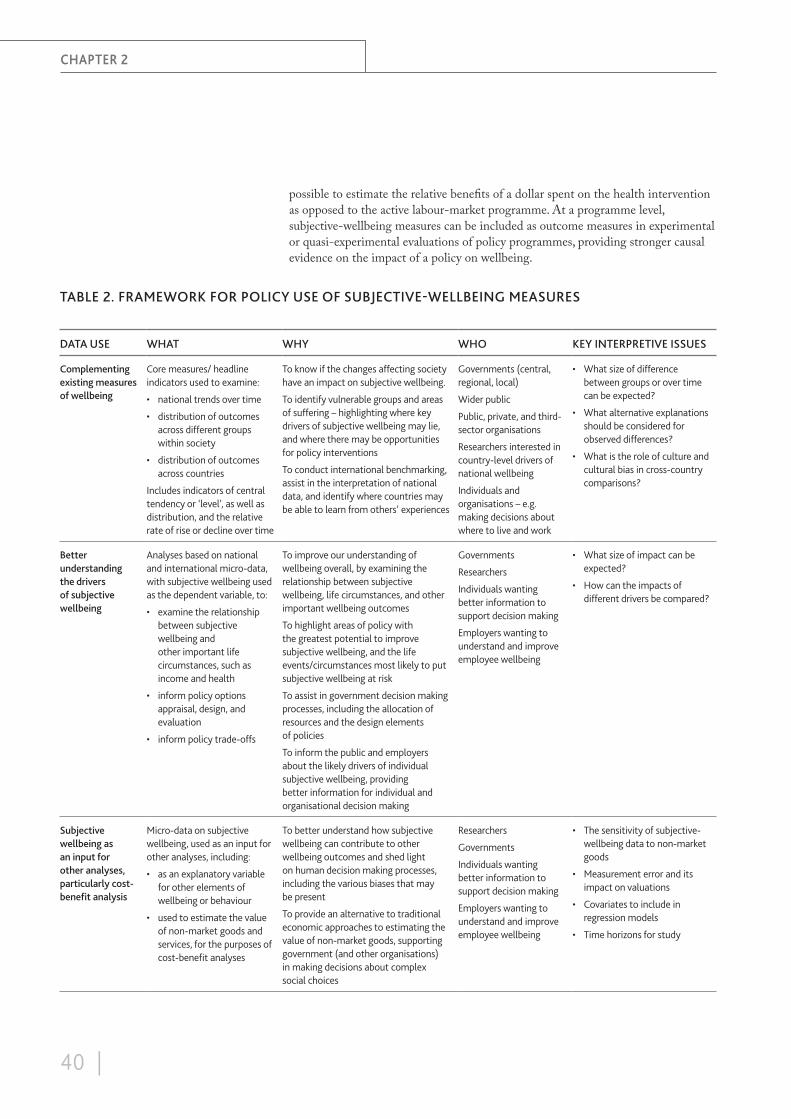
CHAPTER 2
40 |
possible to estimate the relative benefits of a dollar spent on the health intervention as opposed to the active labour-market programme. At a programme level, subjective-wellbeing measures can be included as outcome measures in experimental or quasi-experimental evaluations of policy programmes, providing stronger causal evidence on the impact of a policy on wellbeing.
TABLE 2. FRAMEWORK FOR POLICY USE OF SUBJECTIVE-WELLBEING MEASURES
DATA USE WHAT WHY WHO KEY INTERPRETIVE ISSUES
Complementing existing measures of wellbeing
Core measures/ headline indicators used to examine:
• national trends over time
• distribution of outcomes across different groups within society
• distribution of outcomes across countries
Includes indicators of central tendency or ‘level’, as well as distribution, and the relative rate of rise or decline over time
To know if the changes affecting society have an impact on subjective wellbeing.
To identify vulnerable groups and areas of suffering – highlighting where key drivers of subjective wellbeing may lie, and where there may be opportunities for policy interventions
To conduct international benchmarking, assist in the interpretation of national data, and identify where countries may be able to learn from others’ experiences
Governments (central, regional, local)
Wider public
Public, private, and third-sector organisations
Researchers interested in country-level drivers of national wellbeing
Individuals and organisations – e.g. making decisions about where to live and work
• What size of difference between groups or over time can be expected?
• What alternative explanations should be considered for observed differences?
• What is the role of culture and cultural bias in cross-country comparisons?
Better understanding the drivers of subjective wellbeing
Analyses based on national and international micro-data, with subjective wellbeing used as the dependent variable, to:
• examine the relationship between subjective wellbeing and other important life circumstances, such as income and health
• inform policy options appraisal, design, and evaluation
• inform policy trade-offs
To improve our understanding of wellbeing overall, by examining the relationship between subjective wellbeing, life circumstances, and other important wellbeing outcomes
To highlight areas of policy with the greatest potential to improve subjective wellbeing, and the life events/circumstances most likely to put subjective wellbeing at risk
To assist in government decision making processes, including the allocation of resources and the design elements of policies
To inform the public and employers about the likely drivers of individual subjective wellbeing, providing better information for individual and organisational decision making
Governments
Researchers
Individuals wanting better information to support decision making
Employers wanting to understand and improve employee wellbeing
• What size of impact can be expected?
• How can the impacts of different drivers be compared?
Subjective wellbeing as an input for other analyses, particularly cost-benefit analysis
Micro-data on subjective wellbeing, used as an input for other analyses, including:
• as an explanatory variable for other elements of wellbeing or behaviour
• used to estimate the value of non-market goods and services, for the purposes of cost-benefit analyses
To better understand how subjective wellbeing can contribute to other wellbeing outcomes and shed light on human decision making processes, including the various biases that may be present
To provide an alternative to traditional economic approaches to estimating the value of non-market goods, supporting government (and other organisations) in making decisions about complex social choices
Researchers
Governments
Individuals wanting better information to support decision making
Employers wanting to understand and improve employee wellbeing
• The sensitivity of subjective-wellbeing data to non-market goods
• Measurement error and its impact on valuations
• Covariates to include in regression models
• Time horizons for study

CHAPTER 2
| 41
Are there constraints facing national official statistical agencies in responding to this new policy demand? In most countries, these agencies are under increasing resource pressures. This takes the form of both budget cuts, which preclude collecting all the information for which there is a potential demand, and issues of response burden. Even where funding exists to collect information, official statistical agencies must be careful not to over-burden respondents and jeopardise the good will on which high-quality responses depend. Because of this, collecting measures of subjective wellbeing will have an opportunity cost in terms of other data that will not be collected in order to produce such measures. If subjective-wellbeing measures are to be included in official statistics, therefore, it is essential to be clear about their usefulness for policy. The following framework identifies three main ways in which measures of subjective wellbeing are used and notes what the measures are used for, why the information is valuable, who the target audience is, and what the key issues at stake are (see Table 2).
CONCLUSIONSThe demand for measures of subjective wellbeing can be expected to grow as both policy makers and the general public become more familiar with the use of such measures. This demand should not be viewed solely through the lens of alternatives to GDP, but needs to take into account the crucial role that such measures can play in helping policy makers evaluate the relative importance of fundamentally different outcomes.
How and when national statistical offices respond will vary from country to country. The recently published OECD Guidelines provide both a common suite of measures on which international comparisons can be based, as well as methodological support for national statistical offices wanting to develop more detailed sets of questions to inform domestic policies. Early signs are encouraging and, if data collection by national statistical agencies continues at its current pace, the information base available to inform policy will transform over the next few years. The OECD Guidelines will be followed up by a review of progress on the measurement of subjective wellbeing by national statistical offices with a view to deciding whether they need revising and whether it is possible and desirable to move towards a greater degree of international standardisation.

42 |
CHAPTER 3
THE DRIVERS OF SUBJECTIVE WELLBEING3

CHAPTER 3
| 43
INTRODUCTIONIt is one thing to measure the distribution of wellbeing in the population, but it is more important to be able to influence it. For that purpose two things are necessary: first, we must know what factors most influence wellbeing; and, second, we must have an analytical framework for using that knowledge to improve the wellbeing of the population.
For purposes of public policy the natural concept of wellbeing is life satisfaction – the way people evaluate their own lives. If you are a democrat, this seems the most natural way – to rely on people’s own evaluation of their experience rather than on what politicians or public servants think about it. Fortunately, there has been more research on the causes of life satisfaction than on the causes of any other concept of wellbeing.
FIGURE 2. IMPACT OF POLICY A UPON LIFE SATISFACTION
We can divide the main factors influencing life satisfaction as follows:
• Economic: income; education; work
• Social: family life; community life and values; environment
• Personal: physical health; mental health
Income
Employment
Education
Family
Community
Environment
Physical Health
Mental Health
LIFESATISFACTIONPOLICY A

CHAPTER 3
44 |
64. Note that results obtained from regressions in the current equilibrium would not carry over exactly if major policy changes altered the general equilibrium
65. Helliwell et al. (2012), Chapter 3. In what follows we rely on that summary and do not give detailed references – which can be found in the report
66. Stevenson and Wolfers (2008)67. Layard et al. (2010)
Policy makers need to know how important each of these channels are in determining life satisfaction. Knowing this, they can then choose areas of life where new policy options may be worth developing. And having developed each option, they can then evaluate this against alternative ways of spending the same amount of money.
Thus there are two main steps: knowing what factors determine life-satisfaction and by how much,64 and then using this knowledge to evaluate particular policies. Figure 2 illustrates both steps.
The right-hand side of the diagram shows what factors affect wellbeing and research increasingly tells us by how much – for example, how much a person’s life satisfaction rises when his income rises by one unit, and so on. This is a model of wellbeing.
But then we come to policy evaluation. Policy makers need to know how the policy being considered (say, Policy A) affects the wellbeing of each citizen. For this they need to know how the policy would affect the main determinants of life satisfaction (income, etc.) – that is the left-hand side of Figure 2.
Then, by also using the right-hand side of the diagram, policy makers can work out the total effect of the policy upon overall life satisfaction. When they have done this for each group of the population, they can combine the effects on all the groups to get a measure of the overall effect on the whole of society. Needless to say, this could be positive or negative – it all depends on whether the policy is any good. And, if it turns out to be good, there is still one further test – is it good enough to justify its cost?
In this chapter we look at the first step in the process – what determines wellbeing. In the following chapter, we examine how, armed with the relevant information, we could evaluate any specific policy.
THE DRIVERS OF WELLBEINGThere have been hundreds of studies that have looked at how the factors in Figure 2 affect life satisfaction, and they have been summarised fully in the first World Happiness report.65 Here we shall concentrate on the main generally agreed findings.
Income matters. But, on the external side of our life, the most important thing is the quality of our personal relationships – at home, at work (including whether we have it), and within the community. And even more important is our internal state – our physical health, but even more importantly our mental health. The effects of bad health upon life satisfaction are huge and bigger than the effect of losing a large fraction of your income.
So let us review the effects of each variable in turn.
IncomeThe effect of income on life satisfaction is significant in almost every good study in any country, and the size of the effect is similar in most countries.66 Similarly, people in rich countries are generally more satisfied with their life than people in poorer countries. Over time, however, as countries have become richer, some have become happier, while others have not (including Germany and the USA, where rising inequality has meant that the typical family has seen very little growth in real income).67 Moreover, within any country income differences explain a small proportion (under two percent) of the variation of life satisfaction across the population.

CHAPTER 3
| 45
68. See for example Layard (2011), Online Annex 5.2.69. Layard et al. (2008)70. Grün et al. (2010), Wulfgramm (2011), Gyarmati
et al. (2008)71. A one-point increase in the percentage rate of
unemployment reduces average happiness by twice as much as a one-point increase in the percentage rate of inflation – see Di Tella et al. (2003). However, in the long run it is impossible to reduce unemployment below a certain level without ever-rising inflation – see Layard et al. (2005) – but that critical level of unemployment can be heavily influenced by microeconomic policy measures
72. For example, Kahneman et al. (2004)73. See Layard (2011), Online Annex 5.2
This does not mean that people do not worry about income. They do. People are often asked in surveys how satisfied they are with different domains of life, including financial satisfaction, and in such analyses, financial satisfaction emerges as one of the biggest determinants of life satisfaction.68 But financial satisfaction is quite weakly related to actual income as it also depends a lot on what commitments people enter into.
From a policy perspective, higher incomes are clearly good. But it also matters who they accrue to – an extra dollar raises wellbeing by more if you are poor than if you are rich. This is the so-called “diminishing marginal utility of income”. Life satisfaction is linearly related to the logarithm of income,69 this means for example that a poor person values an extra dollar ten times more than a person who is ten times richer than him. This has always been a key argument for progressive taxation – limited always by the loss in efficiency that occurs when tax rates get too steep.
EducationSince education raises income, it also raises life satisfaction. But its direct effect on individual wellbeing is less clear than many educationists assume – as the evidence varies. More important perhaps are the external effects of education, for example, on the quality of political life.
WorkBy contrast, work certainly provides much more than income. It also provides a social framework and a sense of being useful and wanted. Unemployment is a terrible experience for most people – as bad, according to most surveys, as bereavement or separation. And unlike many experiences, unemployment is not something that people adjust to. In fact, evidence from the German Socio-Economic Panel shows that almost any job is better for wellbeing than no job, even if this is not always obvious to everyone who is unemployed.70
A high unemployment rate also spreads fear among those in work. From time-series studies we can evaluate the overall loss of life satisfaction due to unemployment, including the effects on both the unemployed and the employed. The effect on the employed is substantial and because there are so many more people in work it accounts for two-thirds of the overall effect of the unemployment rate on the wellbeing of the population. So there is an overwhelming policy case for aiming at low unemployment.71
For those in work, the quality of their job also makes a big difference. People greatly value job security and the degree of autonomy the job provides. They are also much happier if they have an understanding boss. In some time-use studies, people have been asked about how happy they were at different times of the day as well as about who they were with at the time.72 On average they were least happy when they were with their boss – a sad reflection on the quality of some management. There are lessons here for employers in both private and public sectors.
Family lifeIn every country that has been studied, the quality of home life emerges as a key explanation of a person’s life satisfaction.73 That is not surprising: it is where a person is rooted and supported, and for most people it is where they spend more time than anywhere else.

CHAPTER 3
46 |
74. Helliwell and Wang (2011)75. Diener et al. (2011)76. Meier and Stutzer (2008)
People who are married or cohabiting are happier than people who are single, separated, divorced, or widowed. But is this a causal relationship or are happier people more likely to get married? Both are true. From panel data we find that the same person becomes happier if he or she marries and stays with the same partner. However, if the marriage is miserable enough, both partners gain from separation (especially the men). Children almost always lose from bad marriages and are more likely to become depressed.
So relationships at home and at work are crucial to our wellbeing. But so too is the quality of the community in which we live. A major determinant of wellbeing is whether you feel that other people are on your side – or whether, by contrast, you feel they are a source of threat. This matters at the workplace and in the family, as we have seen, but it also matters in the community. To study this, we have to compare communities or nations.
Community: trust, support, freedom and valuesIn many surveys people have been asked the following thought-provoking question: “In general, do you think that most people can be trusted, or alternatively that you can’t be too careful in dealing with people?”. The answers to this question across countries are found to be good predictors of life satisfaction in the community.74 However, there are many different areas of trust and mistrust. Do you trust people to care for you in trouble? Do you trust them not to interfere with your basic freedoms? Do you trust people in public office or private business not to be corrupt? The Gallup World Poll measures these three variables (support, freedom, and corruption) for every country in the world. It also measures the average level of life-evaluation in each country. It turns out that the inter-country variation in average life-evaluation can be quite well explained by six variables only: the levels of support, freedom, corruption, family break-up, life expectancy, and GDP per head – with all six variables having similar levels of explanatory power.
These variables are very important. But what else produces trustworthy behaviour in a community? This has been surprisingly little studied. Across countries there appears to be some correlation between levels of trust and income equality. But the direction of causality is unclear and there is no conclusive evidence that income inequality as such reduces average life satisfaction. What is clear is that norms of behaviour matter and are quite tenacious – among Canadian and US citizens their level of trust is well correlated with the level of trust in the country from which their family originated.
So teaching high standards of behaviour has to be a major role for any school system. Religious people may say this is already one of the roles of religion and there is a great deal of evidence that religion increases life satisfaction, especially when times are tough.75 But in a secular state there also have to be secular mechanisms for promoting morality.
The effectiveness of moral teaching owes much to the fact that behaving morally can give a positive emotional pay-off. Evidence for this comes from many sources – from laboratory studies and neuroscience to naturalistic studies of volunteering. For example, when two groups are given money – one group to spend on themselves and one to spend on others – the second group becomes happier; and, when the reunification of Germany reduced opportunities for volunteering in East Germany, previous volunteers experienced the greatest drop in happiness.76

CHAPTER 3
| 47
77. See references in Chapter 5. Again, if policy changes the equilibrium, this needs to be allowed for in policy analysis
78. This is not a tautology. Mental health is an important predictor of life-satisfaction even if it is measured eight years earlier than life-satisfaction. Moreover, measures of mental health include answers to questions about depression, anxiety, irrational fear, rage, irritation, tension, fatigue, and psychosomatic symptoms – which are not the same as life-satisfaction
79. Helliwell et al. (2013), p.40, Table 180. Layard et al. (2013). This study uses the
British Cohort Study. Life-satisfaction at 34 is regressed (1) on adult outcomes and (2) on child characteristics and family background. The partial correlation coefficients indicate how far variation of the factor in question helps to explain the variation of life-satisfaction, other factors held constant. (1) The partial correlation coefficients on the adult outcomes are as follows: income .06, education .04, unemployment .09, criminality .07, married/cohabiting .12, self-reported health .07, mental health eight years earlier .20. (2) The partial correlation coefficients on the childhood variables are: intellectual performance .05, conduct .09, emotional health .17, family economic .06, family psycho-social .03. While these partial correlation coefficients (or ‘standardised’ regression coefficients) show how far factor X helps to explain the inequality in life-satisfaction, it does not show how a policy change affecting factor X would affect life-satisfaction. This requires us to use the ‘unstandardised’ regression coefficient, i.e. how factor X affects life-satisfaction when both are measured in natural units
EnvironmentAnother important feature of a community is the physical environment – are there places to meet, are there open spaces with trees, are the streets clean? There has been limited research on these issues, but it generally points to the importance for most people of places to meet and some contact with the natural world. This emerges both from comparing people in different environments (which has obvious problems) but also from randomised trials where one group has contact with nature and the other does not.77
Physical and mental healthThis brings us to the more personal causes of life satisfaction – your physical and mental health. Everyone knows that physical health matters, but as a predictor of life satisfaction mental health is even more important.78 Indeed, it is the single biggest factor explaining the cross-sectional variation of life satisfaction in the population.
This is true if we look at any one birth-cohort. It is also true if we look at the population of all ages, which we can do using panel studies from Britain, Germany, and Australia. Both in cross-section and panel analysis, mental illness is a more important predictor of life satisfaction than physical illness, income, employment, or family status.79 One reason why mental illness is so important is that it is so common. As household surveys show, some 20 percent of the adult population in advanced countries would be diagnosed with mental illness – most commonly clinical depression or chronic anxiety disorders.
However, this raises a further (general) question. We have so far looked mainly at the immediate determinants of life satisfaction – the attributes of the individual at the current moment. But from a policy point of view we are interested in possible ways of changing these attributes. In some cases our best hope will be to intervene much earlier to change the antecedent causes of the attribute.
THE ROLE OF CHILDHOODThis requires that we study the determinants of wellbeing in a life-course perspective. Such models are only now beginning to be constructed. One example is given in Figure 3. In it, family background and genes affect the characteristics of the child, all of which then affect the attributes of the adult, and his or her life satisfaction.
Policy makers cannot easily influence family background, but they can influence children’s test performance, their behaviour, and their emotional health. So which of these is the most important? One recent study80 suggests that it is children’s emotional health, mainly because of its effect on their mental health as adults. Next is their behaviour as children, which has a huge effect on their family formation and law abidingness as adults. Least important in this study is intellectual performance. Intellectual ability, as everyone knows, has a big effect on educational success and on income, but these are relatively minor elements in a life that satisfies.
GenesFinally, our genes. All of our life is the story of the interaction between our genes and our experience. For example, we can measure the wellbeing of adults who are identical twins and of adults who are non-identical twins. In one study the

CHAPTER 3
48 |
81. Lykken (1999)82. One way forward is through studies of twins and
adoptees. But increasingly it will become possible to identify relevant genes in the DNA – see Plomin et al. (2013)
correlation between the wellbeing of identical twins was 0.44, whether they were reared together or apart.81 For non-identical same-sex twins it was 0.08. This is a very much lower figure and shows the large role that genes are playing (jointly with experience) in affecting our life satisfaction.
Social science has barely begun to grapple with the implications of genetics.82 Because good genes and good experience are positively correlated, much current social science almost certainly exaggerates the effect of good experience. Even so, experience is all we can change and we have to hope that the bias from ignoring the genes is similar when we study different types of experience – so that we can at least say what is the relative importance of different types of experience.
FIGURE 3. A MODEL OF ADULT LIFE SATISFACTION
CONCLUSIONFrom this brief summary four main points emerge about what determines a satisfying life:
• Mental health is a major determinant. So (to a somewhat lesser extent) is physical health. Within any society the difference in life satisfaction between people with good and bad health (mental or physical) is much greater than the difference between people who are rich and those who are poor.
• Unemployment is a major cause of misery and this is mainly for psychological rather than financial reasons.
• People are much happier in communities in which there is high interpersonal trust and freedom-loving, non-corrupt governments.
• More generally, these results show that when we consider disadvantage, we need a much wider concept of deprivation than simple lack of income.
FAMILYBACKGROUND
CHILDCHARACTERISTICS
ADULTOUTCOMES
‘FINALOUTCOME’
Economic
Psycho-social
Genetic
Intellectual performance
Conduct
Emotional health
Income
Employment
Qualifications
Family status
Conduct
Physical health
Emotional Health
Adult life satisfaction
| 49
CHAPTER 4
BETTER POLICY MAKING4
CHAPTER 4
50 |
83. Kahneman et al. (1999)
WHY A DIFFERENT APPROACH IS NEEDEDHow should we use our knowledge about wellbeing to make better policy choices? At present in Britain and many other countries, policy decisions are meant to be informed by cost-benefit analysis. The benefits and costs to an individual are measured by estimating what they would be willing to pay for having the benefit or avoiding the cost, and the unit of measurement is money.
This is fine where willingness-to-pay can be well-inferred from market prices or from behaviour. Thus in areas of policy like transport, industry, education, or (sometimes) the environment, traditional cost-benefit should continue to be the dominant mode of policy evaluation.
But the bulk of public expenditure is on health, elderly care, child wellbeing, law and order, and welfare benefits. We cannot value a vaccination programme by what the recipients would pay for it. Nor can we evaluate a system of family courts that way, or a system of taxes and transfers. The problems here include externalities, public goods, information asymmetries, and equity – in fact, all the main arguments for state involvement.
As has been shown repeatedly, asking people hypothetical questions about how they value these things produces nonsensical answers.83 But data on the wellbeing effects of these activities offer a new prospect for evidence-based policy making. So how could we use information on wellbeing to make better policy choices?
What we already know has obvious implications for broad priorities. It can help us think about which areas deserve more attention and which areas deserve less, and thus to develop new policy options. But to evaluate these options requires a lot more. Ideally we would do a properly controlled experiment or other convincing analysis that would measure directly the impact of the policy upon wellbeing. It would also need to measure carefully not only the direct cost of the policy but also its indirect cost implications (it might subsequently lead to savings, for example, on welfare benefits; or it might involve additional costs, for example, on extra years of education).
But many interventions have effects over quite long periods and we may only have time to measure their immediate effects. If we had a good enough model of the life course, we could then plug in the (known) short-run effect and use the model to simulate the longer-term effects on wellbeing and cost. This would require a much more elaborate model than exists so far. The model would need to trace the detailed effects of people’s upbringing at home, their child care, schooling, further education, brushes with the law, and so on. Such models are under construction and will soon become widely available.

CHAPTER 4
| 51
84. If a variable is cardinal, we can say that the difference between a value of x and (x+1) is the same as the difference between a value of y and (y+1), whatever the values of x and y. The evidence on whether wellbeing measures are truly cardinal is limited. Krueger and Schkade (2008) found that test-retest differences were independent of the level of reported wellbeing, which if generally true would support cardinality. On comparability Davidson (1992) measured electrical activity in relevant brain areas and found some correlation across people with their reported wellbeing. A high correlation would be supportive of comparability
85. We return later to the issue of whether more weight should be given to reducing misery than to increasing existing happiness
86. If there are two mutually exclusive policies of different cost, this approach has to be modified
So let us assume that for each policy option we knew its impact on the wellbeing of the population year after year, and its impact on public expenditure. How would we combine these data to help us decide whether to adopt the policy or not? In what follows we give a highly idealised version of one possible approach in which evaluation is done using wellbeing as the criterion of benefit. This is a novel endeavour and we hope that what we propose can begin a major discussion at government level on how this can be done. It does, of course, assume (like the research reported in Chapter 3) that wellbeing is cardinal (like temperature) and can be compared between one person and another.84 Further detail of our approach is set out in the Technical Annex.
A NEW FORM OF COST-BENEFIT ANALYSISWe can begin with the standard problem of how to spend the taxpayer’s money. To keep this manageable, let us take the size of the state (as defined by total public expenditure) as given. And let us assume initially that the problem is how to maximise the aggregate life satisfaction of the population, subject to that constraint.85 The answer in principle is to rank all possible policies in terms of the net wellbeing they generate per dollar of public expenditure.86 We then undertake as many policies as it is possible to operate before the total money available for public expenditure is exhausted. In the process of doing this we shall discover the net wellbeing-gain per pound spent on that policy that just squeezes through. This figure is the appropriate ‘price of public expenditure’ (in units of wellbeing) for when we evaluate individual projects. It can be discovered by trial and error.
This approach cuts through one major problem. If we did not take public expenditure as given, we should have to measure the cost of public expenditure in terms of the loss of wellbeing caused by the taxes that finance it. But estimates of the impact of income on wellbeing vary considerably and our calculations would be extremely sensitive to what number was adopted. By taking public expenditure as given we cut through that problem – making the whole endeavour much more convincing. So when we evaluate any particular project, we calculate the wellbeing gains to the gainers (the wellbeing benefits) minus the wellbeing losses to the losers (the wellbeing costs) minus the cost of the public expenditure in units of wellbeing. If the result is positive, we go for the policy.
The same procedure applies when we are considering a regulation or a licensing procedure: exactly the same approach should be adopted except that no public expenditure is involved. We can also use wellbeing effects when we are considering how to raise the money to pay for public expenditure. Here we do have to convert units of income into units of wellbeing but we do not have to compare the value of money with the value of other non-financial benefits. So, provided we use a consistent system for valuing income changes affecting different income groups, the task is feasible.
QALYSIf this all sounds very abstract, it is worth mentioning that something quite like it has been used in health policy in the UK for the last decade with wide public support. When the relevant government agency evaluates a new medical treatment it measures the benefits in units of quality adjusted life years (QALYs); so when a person is treated, they may feel better, with a better quality of life, and they may

CHAPTER 4
52 |
87. The valuation is in terms of the number of years of healthy life that the respondent would be willing to sacrifice in order to avoid the condition for one year – see Dolan (1997)
88. See annexes 5.1 and 5.2 of Layard and Clark (2014) available at cep.lse.ac.uk/thriveannex.pdf
89. See, for example, Layard (2011), pp 312–1390. For data on replies to these questions see
Helliwell et al. (2012), chapters 2 and 3
live longer. The quality of life is measured by a subjective valuation (described below) with a range between 0 (as good as dead) and 1 (full health). In this way it is possible to compute how the treatment affects the total number of quality-adjusted life years that the patient will experience. Since not all treatments can be afforded, the agency approves all treatments for which the cost per additional QALY is less than about £30,000. This procedure has been used successfully for a decade and has attracted worldwide interest. Good as it is, we think it could be better.
The assessment of quality of life is made as follows. For each treatment we know how it affects a person in five important dimensions: physical pain, mental pain, ability to move, ability to care for yourself, and ability to perform your usual social functions. But how to weight these five dimensions? At present it is done by asking the general population (most of whom have never been seriously ill) how they would value conditions with different scores on the different dimensions.87 It would be much better to use a wellbeing approach. For example, we could simply take a sample of the population and find out how these different dimensions affect their life satisfaction. This has been done and it gives a much higher weight to mental pain and a much lower weight to physical mobility.88 A more radical approach (not yet attempted) would be to study directly how different illnesses of different severity affect a person’s life satisfaction. Such a study is urgently needed.
In the meantime the UK governmental body NICE (the National Institute for Health and Care Excellence), which does the calculations, has performed a signal service. It has shown to the world that the wellbeing approach can become an acceptable basis for public policy. There remain, however, some major conceptual problems we need to consider. These include: the interpersonal distribution of wellbeing, the discount rate, and the length of life.
THE INTERPERSONAL DISTRIBUTION OF WELLBEINGA key issue is how we should aggregate the changes in wellbeing for people whose initial wellbeing is low with the changes for those whose wellbeing is high. In the procedure advocated by Bentham and used so far in this discussion, we should simply add them up. But there are good arguments for giving more weight to gains and losses that occur to people who have lower life satisfaction.89 This is an ethical question not easily open to empirical analysis (though the population can be asked for their sets of weights). One approach would be to report effects separately for people at each original level of wellbeing. An extreme approach would be to focus only on the extent to which a policy reduced the number of people with life satisfaction below a certain cut-off. Interestingly, the influences that predict low life satisfaction (below a selected cut-off ) have very similar weights to those that predict life satisfaction in general. But since low wellbeing is a special problem, we should surely give special weight in policy analysis to improving life satisfaction where it is initially low. That is one version of what social justice means.
Another option is to use a quite different measure of individual wellbeing. For example, we could focus exclusively on negative emotion as measured by replies to questions like ‘How sad/worried/frustrated/angry were you yesterday?’90 Alternatively we could use time-use data, where individuals are asked about each episode in the previous day, with questions for each episode about the extent of various positive and negative emotions. As Kahneman and Krueger have proposed, we could then rate an

CHAPTER 4
| 53
91. Krueger et al. (2009). See also Layard (2009)92. These are real amounts (inflation adjusted) 93. Stern (2007) argues that 1.5% is too high94. That is not how it is labelled. It is normally
labelled ‘not at all satisfied’
episode as miserable if the most powerful negative emotion was more powerful than the most positive emotion.91 From this we could find what fraction of the day each person spent being miserable – what they called their ‘misery’ index. And we could make the average misery index into our measure of social welfare.
Such an exercise, however, is very data-intensive and requires the collection of time-use data. At this stage of development, the simplest approach is probably to record benefits and costs occurring to people at different levels of original life satisfaction, and then use sensitivity analysis on the weights attaching to each level of life satisfaction to see how far the ranking of projects differs according to the weights.
DISCOUNT RATESFor most individuals the effects of a policy change are spread over a number of years, and indeed some policies affect people yet born. So what discount rate should we use to combine effects that occur in different years? In traditional cost-benefit analysis the discount rate consists of two elements that are added together. The first element (the ‘pure time social discount rate’) reflects the general uncertainty about the future; the second reflects the fact that future generations are expected to be richer and therefore to have a lower marginal utility of income. In the current UK Treasury Green Book the first element is put at 1.5 percent per annum and the second at two percent92. There is clearly a case for a pure time social discount rate, but when our measurements are in units of wellbeing, declining marginal utility of income ceases to be relevant, although there is still the distributional issue of how we should allow for differences in wellbeing between different generations (or indeed different years of one person’s life). There is no neat solution to this problem, and where it is severe it must be shown explicitly in the analysis. Where it is not, the pure time discount rate may suffice.93
If this is the approach to discounting wellbeing, how should we discount future public expenditure? In principle there should be a separate price attached to public expenditure in each period. But in practice, if the path of public expenditure is reasonably smooth, we can probably assume that the price of public expenditure in units of current wellbeing would remain the same from one year to the next. This would mean that the price of future public expenditure in units of today’s wellbeing should fall at the same discount rate as is used for future wellbeing.
THE LENGTH OF LIFE AND NUMBER OF BIRTHSAlmost everyone would agree that a long life is better if the quality of life is unchanged. But how to combine the two? First, we have to measure quality of life in units of healthy life years. This means moving from a cardinal measure of quality of life (where the origin of measurement is immaterial) to a ratio scale lying between 0 and 1. With measures of life satisfaction, this can be done at a stretch, by asserting that the 0 really is zero.94 Then there is an act of faith involved in asserting that every year of life from birth onwards is of equal value (if of given quality). This assumption can of course be changed but any change involves considerable controversy. Finally there is the issue of the numbers born. For most practical purposes we should take this number as exogenous. But some policies clearly do affect the number of births, and some countries like France, India, China, and Japan have all tried to influence the fertility of their populations.
CHAPTER 4
54 |
95. See Broome (2004)96. Fujiwara (2010) and Fujiwara and
Campbell (2011)
The issues here are really difficult. We can imagine two extreme positions. One position says the only thing that counts is the proportional distribution of QALYs among all those who are born and that the number of people born is immaterial. So a world of 1 million people is as good as one of 7 billion who are equally happy. The opposite position says that what matters are total QALYs, added up over all the people born.95 According to that position we should prefer a trebling of births even if it halved the QALYs per person born. Probably most people would hold some intermediate position, but no one of a liberal disposition would want government regulation of births – at most, perhaps, incentives one way or the other.
RELATION TO TRADITIONAL COST-BENEFIT ANALYSISThis completes our outline discussion of a new form of cost-benefit analysis conducted in units of wellbeing. But could it not just as well be conducted with money as the unit of measurement instead of wellbeing? After all, money has a given impact on every person’s wellbeing (its ‘marginal utility’), so we could always measure a person’s change in wellbeing by the change in money that would produce the same change in wellbeing. In the jargon this is known as the ‘equivalent variation’. Why not use that?
The most obvious problem is that the marginal utility of income differs widely between people, as we saw in Chapter 3. It is much lower for richer than for poorer people. Can this problem be handled within the existing money-based framework of cost-benefit analysis? One approach would be to show separately the money-equivalent net benefits for different income groups, as the Treasury does now. But this could miss some important distributional issues. For example, if mental illness were properly treated, this would mainly benefit people who were miserable; but if the breakdown were by income class, the benefits would be shown as evenly spread. The most natural approach is to do the analysis in units of wellbeing, and then show net benefits separately for people with different levels of wellbeing. But in parallel it would also be reasonable to show a breakdown of the changes (in units of wellbeing or of money) for people in different brackets of income.
That concludes our analysis of policy evaluation where the main effects cannot be measured directly in terms of willingness to pay. But there are many policies where the main measurements of benefit are in money, and it is natural to stick to those units throughout the analysis. These policy areas may include education, industry, employment, and transport. However in all of these there will be some elements of non-pecuniary effects where the original measurements are in units of wellbeing. For example, a policy to reduce unemployment will increase wage income and profits, but we also know that it will have major psychological benefits for the people who get employed (in addition to their extra income). The natural approach here is to convert these wellbeing changes into money, rather than vice versa. This can be done in the standard way by calculating the equivalent variation in money income.96
CONCLUSIONIn much of public policy analysis evaluation in terms of willingness to pay is impracticable. In such areas we believe that governments should develop new methods of analysis where wellbeing is taken as the measure of benefit. Even with existing knowledge, such an approach suggests new policy priorities discussed in

CHAPTER 4
| 55
the next chapter. But to discriminate effectively between specific interventions on a scientific basis, such as that outlined in the Technical Annex, will require much more detailed study. This should become one of the main focuses for social science. It would include much more detailed models of the life-course, and more properly controlled experiments.
At the moment much policy is based on little more than a hunch. We firmly believe that a more scientific element can be introduced into the process. It will never be decisive, and ultimately decisions have to be made by elected politicians accountable to the electorate. But their decisions can be based on much better information. So from this chapter emerge three key recommendations:
• For policies where willingness to pay is not a feasible measure of benefit, governments should develop new methods of policy analysis based on wellbeing as the measure of benefit.
• This means that it should become a major objective of social science (and of its funders, such as the UK’s Economic and Social Research Council) to throw light on the causes of subjective wellbeing and how it can be enhanced and at what cost.
• In addition there needs to be more experimentation to provide the detailed information on benefits and costs needed for reliable policy evaluation.

56 |
CHAPTER 5
SOME IMPLICATIONS FOR POLICY5

CHAPTER 5
| 57
If wellbeing was the goal of policy makers, what difference would it make to their priorities? From our analysis in Chapter 3 we can already see some obvious areas where more should be done. These are the focus of this chapter, but this does not necessarily mean that overall state activity should increase. Many of the new priorities are surprisingly inexpensive, and all are enabling rather than coercive. Moreover, some less important activities could also be shed.
BOX 4. SOME POLICY PRIORITIES
MENTAL HEALTH AND CHARACTER BUILDING
• Treat mental ill-health as professionally as physical ill-health.
• Support parents.
• Build character and resilience in schools.
COMMUNITY
• Promote volunteering and giving.
• Address loneliness.
• Create a built environment that is sociable and green.
INCOME AND WORK
• Promote economic growth.
• Reduce unemployment through active welfare.
• More wellbeing at work.
GOVERNANCE
• Treat citizens with respect and empower them more.
• Measure wellbeing and make it a policy goal.
• Give citizens the wellbeing data they need.

CHAPTER 5
58 |
97. Layard et al. (2013)98. Layard and Clark (2014)99. Mykletun et al. (2009)100. Clark (2011)
By tradition, strategic policy reviews tend to start with economic growth. However, we start elsewhere as a focus on wellbeing leads us to place greater weight on the human factors that explain the big differences in wellbeing, but that tend to be pushed to the margins in traditional policy making. These include mental health; the importance of human relationships, compassion and care; and a sense of personal agency and control. Box 4 above lists the policy areas we develop in this chapter. It is not an exhaustive list; and many old areas remain important, including economic growth.
MENTAL HEALTH AND CHARACTER BUILDING
Treating mental ill-health as professionally as physical ill-healthAs we have seen, if we wish to predict an adult’s satisfaction with life the best single predictor is their emotional health – their levels of depression and anxiety. That is the case whether the prediction is made when the person is a child or when the person is already an adult.97
Many factors determine anxiety and depression, including genes, parenting style, school environment, and adult experience. To prevent anxiety disorders and depression, it seems clear we need better support for parents, better schools, and better workplaces. We shall return to all of these. But first there is the immediate challenge of helping those who are currently suffering from diagnosable depression or anxiety conditions. In advanced countries these are roughly one in six of all adults. But shockingly, at present only one in four of those affected are in any form of treatment, compared with most people with serious physical illnesses. This is unacceptable because effective treatments exist that should be made as readily available as treatments are for physical illness.
For some conditions medication is recommended and all conditions benefit from modern evidence-based psychological therapy. For moderate to severe depression, anti-depressants lead to 50 percent recovery rates during treatment, compared with 20 percent if untreated. Modern evidence-based psychological therapy is equally effective and it also reduces subsequent relapse rates. For most anxiety disorders, psychological therapy again achieves 50 percent recovery rates.
The treatments are extremely cost-effective98 and many of those who get better go back to work or keep jobs they would otherwise have lost. The resulting savings more than pay for the cost of the therapy. Moreover, as mental wellbeing improves, so frequently does physical health; and the savings in physical healthcare are of similar size to the cost of the psychological therapy. (Depression reduces life-expectancy as much as smoking does.)99 For these reasons, in 2008 the British government launched a new service for adults called Improving Access to Psychological Therapies.100 Described as “world-beating” by the journal Nature, the programme now treats nearly half a million people a year, although waiting lists are rising, as the unmet need is so great. Expansion of such services would help in every country.
There is a parallel unmet need for therapy in childhood. In most countries at least one in ten children and adolescents need help with anxiety, depression, or behaviour problems, but only a quarter of these children are in treatment. The cost of this unmet need is enormous in terms of educational failure, juvenile delinquency, and

CHAPTER 5
| 59
101. Frijters et al. (2011)102. National Scientific Council on the Developing
Child (2005/2014), Field (2010), Kiernan and Mensah (2009), Flouri (2004), Furstenberg and Kiernan (2001)
103. Cowan and Cowan (2000)104. Scott et al. (2013)105. NICE (2009)106. Duckworth and Seligman (2005), Duckworth et
al. (2012), Duckworth et al. (2007), Duckworth et al. (2011), Tsukayama et al. (2010)
107. Seldon (2013)
subsequent benefit dependence as an adult. The main problem is an inadequate supply of services. Good treatments exist, and need to be more widely available. Services are often too remote and every school would benefit from having a named member of a local mental health service visit regularly.
In conclusion, people with mental illnesses such as depression and anxiety disorders should have access to evidence-based treatment on exactly the same basis as people with physical illnesses. This is as important for children as it is for adults.
We have started with the treatment of mental illness for three reasons. The first is social justice. How can we possibly not treat people who are currently suffering, when good treatments exist? Second, we have impressive evidence on what works and how cost-effective such treatment is, although ideally we should prevent mental illness rather than waiting till it has developed – something can do a lot about. Third, whatever doubts anyone might have about what constitutes a good life – the happiness versus capability debate – all are agreed that lowering anxiety and misery is unambiguously worthwhile. If we are not yet systematically building a good society let us at least build a ‘not bad’ one.
Supporting parentsThe foundations for satisfying and fulfilling lives are laid in our earliest years of development. Emotional development is crucial here, and so too is the acquisition of social and cognitive skills.101 All of these depend strongly on the relationship between parent and child, and on the relationship between the two parents.102 So it is vital that parents have access to the best possible information available and, where things go wrong, to support.
At least four things can be done, all based on well-evidenced trials:
• Both parents can be offered classes on parenting around the time of childbirth. These would cover emotional as well as physical aspects of child-rearing and the emotional impact of children on the couple’s relationship.103
• Health visitors, or their equivalent, can be trained to detect maternal depression and refer the mother for treatment if necessary.
• If a child becomes difficult, parents can be offered classes in parent training such as the Incredible Years Programme, which has been shown to improve children’s behaviour seven years later.104
• If the couple fall out, Behavioural Couples Therapy can be offered, with well-established benefits.105
Building character and resilience in schoolsAfter parents, schools are the next major influence on how children develop. Learning ‘hard’ skills are important, but so too is a capacity for empathy, resilience, and other ‘soft’ skills. Self-control, perseverance, the capacity to delay gratification, and the ability to cope with shocks are strong predictors of positive adult outcomes.106 Soft skills are beneficial not only for the wellbeing of the person who acquires them, but for all those they meet. These traits are in turn linked to higher subjective wellbeing in adult life.
The best schools have long been aware of the importance of these broader skills, and inspired teachers and head teachers have always sought to nurture them.107
CHAPTER 5
60 |
108. Baumeister et al. (2006), Seligman (1994), Seligman (1996)
109. Durlak et al. (2011) 110. Bailey (2013)111. Brunwasser et al. (2009) 112. Rempel (2012), Weare (2013), Zoogman
et al. (2014)113. Rilling et al. (2002)
Although these skills are often referred to as ‘soft’, there is no reason for them to be valued any less. And we can bring more rigour into the way we develop them. There is a growing literature on how to develop empathy, mindfulness, self-control, resilience, and the ability to savour what life offers. This literature is showing us that, just like other skills, these are skills – not innate qualities – that can be acquired through practice, learning, and skilful teaching.108
There are now literally hundreds of programmes for social and emotional learning (SEL) in British schools, which have been subjected to controlled trials. A meta-analysis of these programmes found that on average the programmes increased emotional wellbeing by about ten percentile points, and children’s behaviour by the same amount.109 Strikingly, they also increased academic achievement by ten percentile points. As you would expect, happier children learn better.
There is no conflict, as some politicians believe, between improving child wellbeing and academic achievement. They are complementary. It is noteworthy that in Finland, an education system with longstanding world-beating educational performance, the primary focus of the system from pre-school through (late-entry) primary school is on the social and emotional development of the child. They have concluded that if they can get this right, educational attainment follows – and their results seem to back them up.
There are other key lessons from the experience of the SEL programmes: they work best if they are highly structured, including detailed manuals for the teacher; they work best if they focus mainly on what children should do (positive things) rather than on what they shouldn’t do (like drugs); and, regrettably, their effects fade over time. So, rather than simply taking around 20 hours out of a child’s life as most of these programmes do, we need to find a way to ensure their effects do not fade. One possibility that is being investigated is having weekly life-skills courses, based on properly evaluated materials. At least one such trial is under way.110
Many of the best curricula now include all of the following. First, resilience: the pioneering example of this is the Penn Resiliency Programme developed by Martin Seligman and his colleagues.111 Second, mindfulness: this ancient practice helps people of all ages establish control over their attention, focusing especially on the present moment and on such features as breathing. It has been shown to reduce depression and to improve school achievement and behaviour.112 And third, values: if we want a happier society, we have to become more kind, considerate, and respectful of others. As the neuroscience shows, this benefits not only the recipient of the kindness but also the giver.113 We shall return to kindness later, when we come to community life. But clearly the seeds of good community life should be sown in schools.
So what will make schools give greater attention to the wellbeing of their children? In an age of measurement the most obvious answer is: measure it. If schools measured the wellbeing of their children at regular intervals using standard measures, that would tell them and the community at large how well the school was doing. It is also vital that schools notice if their children are emotionally distressed, or behaviourally disturbed, and, if necessary, make sure they get professional psychological support. For this to happen, all teachers must be trained in the basics of mental health and those who teach SEL will need more in-depth training.
There is one other point that is important for child wellbeing. Children hate schools where they cannot learn because there is too much disorder. But teachers, like

CHAPTER 5
| 61
114. Baker-Henningham et al. (2012), Hutchings et al. (2007)
115. World Values Survey116. Dunn and Norton (2013)
parents, can be taught how to induce their children to behave. In fact the Incredible Years Programme provides an excellent one-week course for teachers that can transform their classes.114
To conclude, much can be done in schools to promote wellbeing. A good approach would involve:
• Systematic structured teaching of life-skills and values throughout school life.
• The regular measurement of children’s wellbeing (after suitable piloting).
• The training of all teachers in mental health and the management of child behaviour.
COMMUNITY
Volunteering and givingHow can we build not just better schools, but better communities? No person is an island and as we saw in Chapter 3, wellbeing depends heavily on the feeling that others are on your side. Social trust – feeling that most people can be trusted – is a consistent correlate of higher wellbeing at both community and national level. It varies substantially across countries and regions: around 60 percent or more of Swedes, Finns, and Danes say that most people can be trusted, while that figure is typically only 30–40 percent in Anglo-Saxon countries, 20–30 percent in Southern Europe, and less than ten percent in a number of African countries.115
Whether people are trustworthy is largely determined in childhood – through family, school, and college. One powerful way to develop pro-social attitudes is through the promotion of volunteering and giving. Clearly volunteering should benefit the recipient of the volunteers’ efforts. But the positive effects fall both on the recipient and the giver. For example, across mentoring programmes for young people, the benefits for the mentor are typically double the size of those for the mentee.
The London Olympics in 2012 showed the potential of mass volunteering with 70,000 people volunteering and contributing an estimated eight million hours of voluntary work. Many more wanted to volunteer – there were a quarter of a million applications – and those that participated, and the nation, were uplifted by the experience. Similarly, giving away money to charity is consistently found to be associated with higher wellbeing in both cross-sectional and time-series data.116 This was also shown in an ingenious experiment where people were given $20 and randomly assigned to spend it on themselves or someone else. Those asked to spend the $20 on someone else subsequently showed significantly higher subjective wellbeing than those asked to spend the money on a treat for themselves.
But if volunteering and giving makes people feel good they would do it anyway so why should the government get involved? Three factors make the case for intervention.
First, giving and volunteering are associated with strong spillover effects. Unlike the negative externalities associated with income (when our neighbours get a fancy new car we feel less happy with our old car), volunteering and reciprocity are associated with positive externalities, or spillovers. In other words, if you live in a community
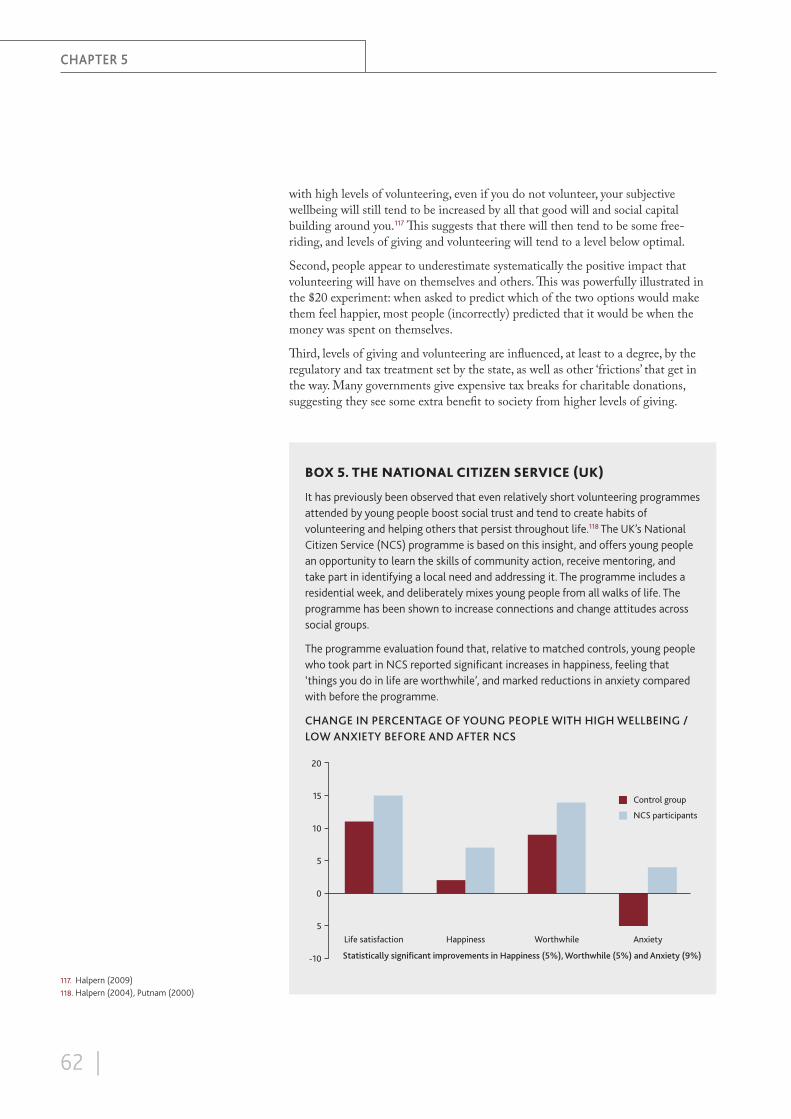
CHAPTER 5
62 |
117. Halpern (2009)118. Halpern (2004), Putnam (2000)
with high levels of volunteering, even if you do not volunteer, your subjective wellbeing will still tend to be increased by all that good will and social capital building around you.117 This suggests that there will then tend to be some free-riding, and levels of giving and volunteering will tend to a level below optimal.
Second, people appear to underestimate systematically the positive impact that volunteering will have on themselves and others. This was powerfully illustrated in the $20 experiment: when asked to predict which of the two options would make them feel happier, most people (incorrectly) predicted that it would be when the money was spent on themselves.
Third, levels of giving and volunteering are influenced, at least to a degree, by the regulatory and tax treatment set by the state, as well as other ‘frictions’ that get in the way. Many governments give expensive tax breaks for charitable donations, suggesting they see some extra benefit to society from higher levels of giving.
BOX 5. THE NATIONAL CITIZEN SERVICE (UK)
It has previously been observed that even relatively short volunteering programmes attended by young people boost social trust and tend to create habits of volunteering and helping others that persist throughout life.118 The UK’s National Citizen Service (NCS) programme is based on this insight, and offers young people an opportunity to learn the skills of community action, receive mentoring, and take part in identifying a local need and addressing it. The programme includes a residential week, and deliberately mixes young people from all walks of life. The programme has been shown to increase connections and change attitudes across social groups.
The programme evaluation found that, relative to matched controls, young people who took part in NCS reported significant increases in happiness, feeling that ‘things you do in life are worthwhile’, and marked reductions in anxiety compared with before the programme.
CHANGE IN PERCENTAGE OF YOUNG PEOPLE WITH HIGH WELLBEING / LOW ANXIETY BEFORE AND AFTER NCS
Life satisfaction Happiness Worthwhile Anxiety
-10
5
0
5
10
15
Statistically significant improvements in Happiness (5%), Worthwhile (5%) and Anxiety (9%)
20
Control group
NCS participants

CHAPTER 5
| 63
119. Putnam (2000)120. See Mauss, M. The Gift (1954) for a classic
approach to reciprocity, and Grant, A. Give and Take (2013) for a more recent analysis of whether giving should be regarded as pure altruism or simply a form of reciprocity
121. Victor and Yang (2012) 122. Griffin (2010)123. Cable et al. (2013), Ertel et al. (2008)124. Cable et al. (2013), Putnam (2000)125. Glass et al. (2006)
In the USA, falling levels of volunteering have been documented since the 1960s.119 This appears to be generationally based, with a steady fall in each generation after the civic heyday of the Second World War returners. In other countries, the patterns are less clear, but often not encouraging. For example, in the UK, while overall levels of volunteering and giving have held up, this appears to be largely due to a shrinking but more active minority.
Controversy continues around what policy makers can do to increase volunteering and giving. There is good evidence that the experience of volunteering in youth sets up the habit for later life, supporting the case for national or local programmes (such as Americorps, or the UK’s National Citizen Service – see Box 5). Other factors that appear to increase volunteering and giving include: encouraging more public or visible forms, since this leads to modelling and cascade giving; encouraging giving through peer networks; and simply making it easier, such as through easy payroll giving, or via QR codes and mobile phones. The state can also act to remove barriers to volunteering, such as excessive personal security checks and supporting e-platforms that make it easier to identify opportunities at convenient times and locations. One advantage of these nudges towards giving and volunteering more is that they are a lot less costly to the taxpayer than charitable deductions and more efficient as the latter have high deadweight costs.
Encouraging higher levels of volunteering, reciprocity,120 and giving appears to be a powerful way of increasing subjective wellbeing. For the most part this needs to be led by citizens themselves, but governments and communities can help by creating opportunities for people to volunteer, and by removing the frictions that get in the way.
Addressing lonelinessAn unexpected side-effect of modern life, and to some extent of affluence, has been the rise of loneliness. Loneliness is a subjective measure and is distinct from social isolation, which is measured objectively. Both are important from a public-policy perspective but it is fair to say that policy makers have traditionally focused on isolation, and that subjective loneliness provides an important new perspective that supports renewed focus and attention to this important issue. Research published last year found that six percent of adults in the UK consider themselves to be lonely ‘all or most of the time’, with a further 21 percent ‘sometimes’ lonely.121 Over a quarter – or 3.1 million people aged over 65 – say they often go for more than a week without seeing any friends, family, or neighbours. Age UK estimates the prevalence of loneliness in older people at around 30 percent. Loneliness is also an issue for younger generations: in 2010 11 percent of people aged 35–54 and 12 percent of people aged 18–34 described themselves as ‘often lonely’.122
Several studies123 suggest that having a well-integrated friendship network is a source of psychological wellbeing among middle-aged adults. These relationships are independent of education, material status, and prior psychological health.124 More recent analysis has found that social engagement is protective of depressive symptoms in later life.125 There is also evidence that social isolation varies cross-nationally, with a negative correlation to social trust.
The implications of isolation and loneliness on health and wellbeing are increasingly well-known. Perhaps the most eye-catching finding yet presented is that loneliness is as bad for physical health as smoking 15 cigarettes a day, or moderate alcohol

CHAPTER 5
64 |
126. Holt-Lunstad et al. (2010)127. Hawkley et al. (2010) 128. Thurston and Kubzansky (2009) 129. Lund et al. (2010)130. Holwerda et al. (2014) 131. http://tyze.com/ 132. Helliwell and Barrington-Leigh (2010)133. Office of National Statistics (2013), Department
for Communities and Local Government (2013)134. Halpern (1995)
abuse.126 This is not the only physiological impact: loneliness has been shown to increase the risks of high blood pressure,127 cardiovascular disease,128 and onset of disability,129 and dementia.130 Hence a wellbeing focus suggests policies designed to tackle loneliness and social isolation should be examined.
Designing sensitive and effective policy interventions remains a challenge. One interesting approach is to turn the challenge on its head, and ask the socially isolated if they would like to help others. For example, a school-based programme in Baltimore recruited retired older people in two-year cohorts to provide extra support and nurturing in primary schools. The friendships formed among the volunteer cohorts were found to survive beyond the end of the two-year programme, to have created real sense of purpose, and to have made a great contribution to the children.
Another policy approach is to support platforms that make it much easier for people to support the isolated and vulnerable. The Canadian platform Tyze131 illustrates the approach. Tyze is a dedicated platform that facilitates the forming of a ring of support and care around an individual, either built up by a caring friend or relative, or by the person themselves. It is unique in that it aims to bring together formal and informal networks – family and friends with doctors, nurses, and care workers. For example, someone may be very willing to help an elderly neighbour, but may not know what would be helpful and when. Meanwhile a son or daughter might live too far away to be able to deal with everyday issues such as opening the door to a repair man or picking up a small item of shopping. The platform makes these connections in a private but convenient way. Similarly, UK-based care4care, modelled loosely on the Japanese care-ticket system, encourages the ‘young old’ to offer some care and help to the frail or very elderly. In exchange, carers can collect credits, or ‘thank yous’ that they can give to someone else or that they can save for use by themselves in the future. Such reciprocal platforms have the potential to boost both the wellbeing of carers and the cared-for.
In conclusion, developing policies that address loneliness is one of the great policy challenges that we face today. For some, solitude is a choice. For many, social isolation is a real problem that merits extra attention when viewed through the lens of wellbeing and public health, but with promising and low-cost policy responses available.
Creating a built environment that is sociable and greenThe spaces and places that we live in have a significant impact on our wellbeing. Variations in wellbeing across Canadian Provinces,132 and similarly across UK Local Authority areas,133 are only partly explained by variations in income. Other factors explaining this variance include knowing one’s neighbours, feeling that others can be trusted, shorter commutes, and access to green spaces and water.
The physical environment strongly affects the character and frequency of our interactions with other people – a pivotal influence on our wellbeing. The environment can also lower our wellbeing as a result of exposure to environmental stressors such as noise or pollution, and can raise our wellbeing, through giving us a sense of connection to the natural world.
There are links between the physical environment and social relationships. A series of studies has shown that the magic formula is having easy opportunities for social interaction but retaining the ability to choose when, who, and where we meet.134
CHAPTER 5
| 65
135. Baum and Valins (1977)136. Thompson (2013) 137. Transport for London (n.d.)138. Baum and Davis (1980) 139. Halpern (1995)140. White et al. (in press)141. Grahn and Stigsdotter (2003) 142. Marselle et al. (2013)
Spaces that create opportunities for people to dwell and meet, be they parks, porches, or post offices, provide the soil for the seeds of friendship and connection to grow. School gates – whatever the original intention – become places where parents meet, talk, and form connections. But enforced interaction, be it through enclosed corridors shared by many dwellings, impersonal walkways in the sky, or mass-transit systems instead encourage withdrawal – a result replicated in controlled conditions.135 In the words of Robert Frost, “good fences make good neighbours” – or are at least part of the formula, since they enable people to regulate their social interactions with others.
There are relatively few intervention studies that give policy makers reliable evidence on methods of increasing social trust and positive social relationships. But the evidence that does exist suggests good approaches involve supporting community facilities and spaces that make it easier for people to socially interact, but in ways that they can choose and shape – plazas, pubs, and post offices. Policies can also encourage leisure usage of these outdoor spaces.136 In addition to fostering good fitness, such initiatives can improve wellbeing by encouraging social contact. For example, improving street design and furniture on The Cut, London SE1, has increased pedestrians by 35 percent and made the street a more sociable and desirable place to be.137 This has been achieved by adding trees and benches, and improving outdoor dining zones.
There is also plenty of evidence of what not to do. The modernist housing developments of the ’60s and ’70s, with large blocks of flats and deck access spaces, created environments with few buffers between public and private space. This leads to places where residents struggle to separate fellow residents from strangers, tending to an abandonment of public spaces and a cycle of fear, withdrawal, and social isolation.
Low-cost interventions may also prove effective. For example, an early intervention study found that simply dividing a long corridor into smaller visual spaces could eliminate many of the negative effects on social interaction and withdrawal.138 Similarly, promising simple interventions include communities supporting and distributing neighbourhood directories that help people know their neighbours, and online ‘street banks’ that enable people to share and exchange goods and equipment, and get to know each other as they do.
Environmental stressors such as noise, pollutants, or volume of traffic also affect subjective wellbeing. Interestingly, there is some evidence that some of the less-obvious stressors, such as airborne irritants, may have bigger impacts than some of those stressors that are more obvious, such as noise, since people may be more likely to misattribute the cause of their irritation.139
On a more positive note, physical or visual access to green spaces, water, or natural light appears to have a surprisingly powerful direct impact on subjective wellbeing. Residents of urban English areas with higher levels of green space showed lower levels of mental distress and higher levels of life satisfaction, controlling for other contextual variables.140 Swedish participants who visited green spaces more frequently reported less stress and stress-related illness, controlling for demographic variables.141 Recent research found that taking group walks in green corridors had a significant association with less perceived stress and negative affect, compared to people walking in urban environments.142 Parks and green spaces in cities where people may not have access to their own gardens are valuable tools in helping to mitigate life stresses.

CHAPTER 5
66 |
143. Walch et al. (2005) 144. Ulrich (1984), Raanaas et al. (2011)145. Global warming is a massive challenge but can be
handled without major constraints on economic growth. See Stern (2007)
146. Kahneman et al. (1999)
Similar effects are found in clinical studies too. A 2004 study of patients undergoing elective cervical and lumbar spinal surgeries randomly assigned them to either the bright or dim side of a ward after their operations.143 The results of this study revealed that the patients exposed to more natural light experienced less perceived stress and pain, took less analgesic medication per hour, and had less pain-medication costs. Similarly, in one retrospective study of patients recovering from gall-bladder surgery, those who had a view of trees left hospital, on average, three-quarters of a day earlier, and took less pain medication than those patients who had a view of a brick wall.144
In conclusion, planners and developers need to incorporate evidence of how the physical environment affects wellbeing into the design of our cities, buildings, and communities. This needs to go beyond the traditions of intuition and design, and instead systematically factor in the ability of built environments to create opportunities for controlled social interaction by residents, and a sense of connection to the natural environment.
INCOME AND WORK
Promote economic growthWe come now to the economic aspects of life – income and work. It is sometimes implied that economic growth and wellbeing are contradictory objectives. We do not take that view. Other things being equal, growth is good for wellbeing. Economic growth can enable citizens and states to build health and welfare systems, protecting or ameliorating against hazards of ill-health and loss of income. Growth can give more time free from time-consuming domestic chores, releasing time and resources for leisure, arts and education.
But growth is not the only thing that is good. We should be careful not to over-sacrifice other aspects of life (such as family life, community cohesion, or low unemployment) in the name of economic growth.145 Growth gives us choices, but by itself offers no guarantee of increased wellbeing.
One very clear lesson emerges from wellbeing research. You lose more wellbeing from a fall in income than you gain in wellbeing from an equal rise in income. This is the phenomenon of loss-aversion made famous by the Nobel prize-winning psychologist Daniel Kahneman.146
This means that policy should aim above all at a stable rate of growth, rather than growth that (even if higher on average) includes periods of recession.
Reduce unemployment through active welfareA somewhat different issue is that of unemployment. Comparing decades, there is no clear relation between the average rate of economic growth and the average unemployment rate. In this timeframe, the unemployment rate is determined by the structure of the labour market. But one of the most universal findings of wellbeing research is the devastating effect of unemployment – with effects on wellbeing similar in scale to the effects of bereavement. After all, in each case you cease to be needed. Thus the impact of unemployment is much larger than can be explained by the loss of income alone.
CHAPTER 5
| 67
147. Jahoda et al. (1971)148. Clark et al. (2008), Clark et al. (2001), Gallie,
D. (2013). The second study shows that the effect of unemployment is reduced when many others around you are also unemployed. In addition, the third study found that the impact of unemployment on wellbeing is weaker in the Nordic countries than other countries and the research highlighted the role of welfare systems in sharply reducing the financial deprivation experienced by the unemployed as an important factor in explaining this difference
149. See for example, Layard et al. (2005)150. Grün et al. (2010), Department of Work and
Pensions (2012)151. Proudfoot et al. (1997), McCrone et al. (2004),
Lagerveld et al. (2012) 152. See for example, Green and Tsitianis (2005), and
Blanchflower and Oswald (1999) presented at Cornell University
153. Kahneman et al. (2004) 154. Deci and Ryan (1985)155. Marmot (2004), Gallie and Zhou (2013)156. Knight and Haslam (2010) 157. Council of Civil Service Unions, Cabinet Office
and UCL (2004) 158. Dewhurst et al. (2009), Robertson and Cooper
(2011), Lundberg and Cooper (2011)159. Ariely D., working paper, Duke University
This effect, first explored in detail by Jahoda147 in her famous Marienthal studies in the first half of the twentieth century, is widely agreed to be due to the many other non-economic benefits that employment brings. These benefits include a sense of purpose, challenge, and the social connections that work brings. On top of this, a period of unemployment has a significant impact on a person’s wellbeing, even in the years following their re-employment. We do not adapt to unemployment and a period of unemployment also has an adverse effect on our wellbeing after we have got back into work.148
So our aim must be low and stable unemployment. This requires suitable labour market measures.149 It will not happen if unemployment benefits are handed out unconditionally. It will happen, as international evidence shows, if there are active measures to help people back into work, on the understanding that those who refuse help cannot continue to draw benefit. Such measures normally include, after a time, the provision of temporary work to keep the person in touch with the labour market. The wellbeing evidence shows clearly that people helped in this prescriptive way feel better than people just left on benefit.150
In addition, it is crucial to tackle any mental health problems that affect people on unemployment or incapacity benefits. At present, under half of British people on incapacity benefits for mental health reasons are in any form of treatment. But there is striking evidence of how evidence-based psychological therapy and Employee Assistance Programmes speed the return to work.151
Thus the wellbeing literature strongly makes the case for active labour-market policies to get people out of unemployment as fast as possible. Secondarily, the evidence makes the case for support for a jobseeker’s mental health, resilience, and confidence, and the treatment of depression and anxiety.
More wellbeing at workThat said, not all jobs are a bed of roses. Job satisfaction is on a long-term downward trend in most advanced countries,152 and people rank time spent with their manager as among their least happy moments in the day.153
There are four generally agreed features of a workplace that provides for high wellbeing.154 First, workers must have a clear idea of what is expected of them and how it relates to a wider whole. Second, they must have reasonable freedom over how they do the work. This sense of control or agency is a universal human need155 and includes the need for people to be consulted over things that obviously affect them, like the arrangement of space in the office.156
Next there is the need for support and recognition. People like to be rewarded in ways that make them feel personally valued by their employer.157 Such rewards are not necessarily financial. Many studies have found that workers view non-financial incentives, like praise from line managers and opportunities to do better work, as equally (or more) effective compared with cash bonuses, pay increases, or stock options.158 A field experiment illustrates the power of praise relative to financial incentives. While financial rewards led to a surge in worker performance when they were introduced, performance subsequently dipped dramatically so that the overall effect was negative. In contrast, praise from managers led to a similar improvement, but the subsequent dip was smaller, and the final effect was still positive.159 This
CHAPTER 5
68 |
160. Frey (2013)161. Eurofound (2013)162. De Neve and Oswald (2012), Helliwell et al.
(2013), Chapter 4163. Isen et al. (1991) 164. Anik et al. (2013)165. www.bitc.org.uk/programmes/workwell
illustrates a point that is frequently made: financial rewards can ‘crowd out’ other forms of motivation, like the natural desire to do a job well.160
Finally, people need a reasonable work-life balance. A recent European study found that people working over 40 hours a week have lower wellbeing.161 As we have seen, social relationships and feeling part of a community are significant drivers of positive wellbeing, so we should favour policies on flexible working, weekend working, and annual leave that allow people time to spend on friends, family, and leisure activities.
Why would an employer take the wellbeing of the employees into account? Because it affects their performance. Positive mood states have been repeatedly found to boost productivity and creativity, reduce sickness absence, and increase customer satisfaction.162 As an example, medics put into a more positive mood have been shown to make faster, more accurate, and more considered diagnoses.163 Similarly, an experiment boosting wellbeing in the workplace (through encouraging small gifts between workers) led to significant increases in productivity.164
If worker morale is so important for an employer it must be in the employer’s interest to measure it. It is also vital that employers are sensitive to mental health problems in their workforce, since mental health problems account for nearly half of all sickness absence. All of this applies as strongly to government as an employer as it does to private-sector employers.
In general, the evidence suggests that it is strongly in the interests of businesses themselves to promote wellbeing at work (see Box 6). However, governments and intermediaries can catalyse this shift by improving the information available to workers about the satisfaction of workers through indices such as the Sunday Times Best Companies to Work For.
BOX 6. THE BUSINESS IN THE COMMUNITY WORKWELL MOVEMENT
The Business in the Community Workwell movement165 is a coalition of businesses who have agreed to work towards greater understanding of workplace wellness and its benefits. Marks & Spencer’s wellbeing programme, Plan A, won the Bupa Workwell Award in 2013. The scheme is centred on a website, www.planAhealth.com, which gives employees information and support for a range of wellbeing issues and links to online assessment tools for a number of conditions. Corporate wellbeing challenges enable employees to make a pledge aimed at improving their health and wellbeing. Since the launch of Plan A, over 13,000 employees have used the website and 10,500 have undertaken a challenge. Since launch, turnover rates have improved, sickness absence fell seven percent in a month, and there was a reduction of 18 percent in referrals for muscular-skeletal conditions.

CHAPTER 5
| 69
166. Bosma et al. (1997) 167. Ipsos Mori (2006)168. Information Collection Budget Office of
Management and Budget (2012)169. Holmes and Rahe (1967)
GOVERNANCE
Treat citizens with respect, and empower them moreOne of the clear lessons of the wellbeing literature, from both cross-sectional and laboratory evidence, is that agency and control matter. It is generally not stress per se that leads to higher levels of psychosomatic symptoms and lowered wellbeing, but rather the combination of external stress combined with an inability to control the situation – what might be called the curse of responsibility without power. It is this combination that is thought to help explain why people at the top of large organisations experience lower physical and psychological symptoms.166
It is unsurprising, therefore, to find that institutions and practices that give people real power and control are associated with higher levels of satisfaction and wellbeing. For example, it has long been known that by far the most powerful driver of variations in satisfaction with healthcare is not clinical outcomes, but the sense of being treated with respect and dignity.167 Of course, patients and relatives do want good clinical outcomes, but too often this has dominated over the more human touch. This is seen in most extreme form in end-of-life care, when sometimes the clinical imperative to do everything possible to extend life ends up destroying its quality in the process – at both financial and wellbeing cost.
A more prosaic way in which public services affect wellbeing is through the many everyday ways in which they touch our lives through bureaucracy, and sometimes hassle. It is estimated that Americans spent 9.14 billion hours filling out federal forms in 2011.168 Curiously, such activity is rarely separately identified in time-budget studies, but it seems unlikely to be an activity associated with positive affect. Everyday hassles are associated with negative impacts on mental health, as people like to be treated as if they were trustworthy.169
Some state institutions seem almost designed to decrease wellbeing, however well-intentioned they may be. For example, the legal system often seems to encourage conflict by pushing family disputes and other conflicts into the courts for what can be a lengthy process. The impact of family breakdown is very clear in the wellbeing data and people do adapt to divorce and separation in the long run. But do the courts and legal processes help this adaption process or lengthen the conflict and misery? It is a fair hypothesis that faster, less confrontational mediation approaches might be more beneficial to adaption and improving wellbeing.
To improve public services, one key step is to create stronger feedback loops between the subjective experiences of users and those who provide the service, as well as other users who might vote with their feet. An early example of this was Canada’s ‘Citizen First’ feedback system, which was credited with stimulating changes that increased public satisfaction with services by an unprecedented ten percent. The UK’s recent promotion of net-recommender scores is a recent, larger-scale version of such a system. From 2013, millions of patients and their relatives have been asked if they would recommend a given service or ward to their friends and relatives. This approach is producing data on the experiences of millions of people a year and is likely to have a dramatic impact on the character and subjective experience of public services, as well as create a real sense of empowerment among users.
So respect for the citizen is one crucial role for government; empowerment is another. As we show in Chapter 3, measures of freedom to control your life explain

CHAPTER 5
70 |
170. See also Inglehart et al. (2008)171. Diaz-Serrano and Rodríguez-Pose (2011) 172. Halpern and Reid (1992) 173. Lamberton et al. (2013) 174. Helliwell et al. (forthcoming)
as much of the variance of wellbeing across countries as is explained by GDP per head.170 Cross-national analyses similarly suggest that areas and cities with greater decentralisation, and particularly fiscal decentralisation, are associated with significantly higher life satisfaction. 171
These patterns are strongly consistent with the powerful role played by a sense of personal control and agency. In essence, the results reinforce the common-sense view that feeling safe from the arbitrary exercise of power, and feeling personally empowered in everyday life, have significant positive impacts on wellbeing. ‘Natural’ experiments show similar results. For example, people exposed to the threat of demolition of their homes – even in the absence of any actual demolition – show significant increases in general practitioner visits for a wide range of somatic and physical symptoms, compared with control populations, and when the threat is lifted, symptoms drop back to normal.172
The headline policy conclusion is obvious: give communities and citizens more power. Possible responses range from participatory budgets that give citizens a direct say in how money is spent, to citizen juries, to referenda on issues of national significance. However, the experience of referenda in California is mixed, and finance ministers around the world are nervous of hard hypothecation as unglamorous, but vitally important, programmes might be starved of funds. Some laboratory evidence suggests that citizens appear to get a real boost to their wellbeing simply by having an opportunity to guide or advise on even a small proportion of spending.173
Recent results from the OECD suggest that improvements in governance quality are associated with changes in wellbeing. The ten countries that most improved governance quality between 2005–2012 increased average life evaluations by as much of an increase as would be caused by a 40 percent increase in per-capita incomes, compared to the ten countries with worsened delivery quality.174
Of course, there is far more to the design of political institutions than can be found in the wellbeing equations of psychologists and behavioural economists. But there are some interesting results beginning to emerge. Future work might usefully establish whether particular forms and levels of decentralisation have stronger impacts on wellbeing, and establish the direction of causation.
Taken together, the evidence strongly suggests that respect, empowerment, and freedoms are associated with greater wellbeing, and that these become an increasingly important determinant in wealthier nations. The evidence reinforces the case for devolution and local empowerment, particularly for fiscal decentralisation, and encourages alternative forms of consultation.
Measure wellbeing and make it a policy goalFinally, we come back to the measurement of wellbeing. If we want a society with better wellbeing, governments must have the data on wellbeing, and then use it. And so must individuals.
The first task for governments at every level is to measure wellbeing – as it is for employers and for schools. This will show them how their population is faring – and the more comparable the data are, the more the scope for benchmarking. This is why the OECD guidelines on measurement, explained in detail in Chapter 2, are so valuable.

CHAPTER 5
| 71
There are clear advantages to developing a comparable measurement framework across countries. Debate continues about which are the best measures to use, but our view is that these should include evaluative measures (such as life satisfaction or ‘ladder of life’), affective measures (such as feelings of happiness or anxiety), and eudaimonic measures (such as a sense of life being worthwhile). We recommend that such questions be included early on in surveys, since we know that they are affected by the questions that precede them. We also urge continuing work to develop light-touch and incidental measures, such as the analysis of semantic social-media content, that offer the potential for low-cost, high-volume measures in future years.
Next we need to understand what is causing wellbeing, so research on wellbeing should become a priority for publicly funded social research. All organisations should be encouraged to include routine questions on wellbeing in any survey they undertake.
Policy progress and applications are greatly limited by the rarity of intervention studies – essentially policy interventions that enable before and after comparisons, ideally a control group, and include subjective-wellbeing measures. Such measures can often be added to policy evaluations at very low cost and administrative burden: the four primary personal wellbeing questions used in the UK typically take only 75 seconds to administer. These can in turn provide policy makers with powerful evidence of the marginal cost-effectiveness of very different interventions on wellbeing.
The aim is to improve wellbeing. This means that in the choice of public policies wellbeing should be a serious and important criterion. Policy evaluation should increasingly be done in the ways discussed in Chapter 4, especially in areas of policy where willingness-to-pay provides no good guidance. Ideally, most policy changes would be informed by a prior controlled experiment, but in practice, a variety of data will normally influence any policy analysis. In a democratic society, the ultimate decision has to be political, but a wise politician will take seriously the best possible estimate of how citizens would themselves evaluate the impact of the policy upon them.
So for policy makers in all walks of life the message is:
• Measure wellbeing and include it in any survey you do,
• Support research that helps you understand it, and
• Make it a major criterion in policy choice.
Give citizens the wellbeing data they needIn the end, most of the choices that matter most are made by individuals, not governments. Better data on wellbeing can often improve their choices. Efficient markets, and lives well led, rest on people making informed decisions. But often this information is not present. We can compare the price and fuel consumption of a new car, but it is hard for us to know the impact it will have on our wellbeing. We can see the pay and qualifications required for a given job, but it is much harder to estimate the impact it will have on our wellbeing. In short, wellbeing effects are often shrouded, so it is unsurprising that we are sometimes disappointed in our choices.

CHAPTER 5
72 |
175. Tversky and Kahneman (1974)176. Gilbert (2006), Loewenstein and Lerner (2003)177. Luca (2011)178. Occupations with n<200 dropped from analysis.
From Cabinet Office (2014)
Further, the evidence from behavioural science strongly suggests that we are all prone to systematic errors when making such judgements. We overweight recent and peak experiences, both good and bad, misremembering how good a holiday, or how painful an experience was.175 We often misjudge what we will regret, and mis-predict what will make us most happy or sad.176 Such effects help to explain the growing interest in nudge-style policy levers built around the world. The idea of nudging, or libertarian paternalism, is to protect and enhance personal agency, but seek to shape the inevitable choice architecture to favour outcomes that are positive for busy consumers and citizens.
The basic point is that people who are better informed about choices, including their wellbeing outcomes, are likely to make better choices. Wellbeing data should be made widely available to help de-shroud everyday choices. Some consumer markets are beginning, in effect, to offer this type of data, such as showing us feedback from other people on how much they enjoyed a given film, recipe, or hotel, and these forms of feedback are in turn powerfully reshaping markets.177
But there are many domains where wellbeing data remain shrouded. Young people choosing a career should be able to look up the average life satisfaction of different professions as easily as they can the earnings or grades required. With new data, often derived from public surveys, this is rapidly becoming possible (see Figure 4). Such data often have public-good characteristics: they are of potential benefit to everyone once gathered but impose costs on those who collect it. This flags a key role for governments: to gather and disseminate better wellbeing information for people and communities to make better informed choices for themselves.
Thus one of the most powerful, but simple, ways that governments can boost the wellbeing of their citizens is put in their hands better information about the relationship between everyday choices and subjective wellbeing. Ultimately, this will be data gathered from citizens, shared with citizens. In this way, citizens’ own better-informed choices will reshape markets and societies for the better.
FIGURE 4. LIFE SATISFACTION BY OCCUPATION FOR MID-CAREER AGE GROUPS178
Gross annual salary £ (Annual Survey of Hours and Earnings 2013)
Mea
n lif
e sa
tisf
acti
on
(Ann
ual P
opul
atio
n Su
rvey
201
1–13
)
0 20000 40000 60000 80000 100000 1200006
7
6.5
7.5
8.5
8
Chief executives and senior officials
Construction
Care escorts
Playworkers
Fitnessinstructors
Companysecretaries
Farmers
Clergy
Managers in agriculture Medicalpractitioners
Financial managers & directors
Schoolcrossingpatrol
Telephone sales
Legal officialsEconomistsand statisticians
IT & telecomdirectors
Quantity surveyors
Publicans

CHAPTER 5
| 73
179. www.ons.gov.uk/ons/rel/ashe/annual-survey-of-hours-and-earnings/2013-provisional-results/stb-ashe-statistical-bulletin-2013.html
Figure 4 shows life satisfaction by occupation for mid-career age groups (35–50) to broadly control for career stage. Wage data is from the 2013 Annual Survey of Hours and Earnings179 and occupations with less than 200 observations were eliminated to ensure a reasonable sample for the analysis. The curvilinear relationship between income and wellbeing is clear, and it is interesting to see how occupations with high life satisfaction, like clergy, company secretaries, and farmers, differ from construction and telephone salespersons despite similarities in income.
There are clearly differences in wellbeing by occupation. Subjective-wellbeing data can provide extra information, on top of potential future earnings, that can help people in making their career choices.
CONCLUSIONThis report reflects a widespread wish to reappraise the goals of our society. Organisations such as the EU and the OECD have for some years been discussing issues such as ‘What is progress?’ or ‘Beyond GDP’. We hope our report contributes to this debate, and shows how the lens of wellbeing can lead to concrete changes of direction. These changes include new ways of policy analysis and new policy priorities. Worldwide, people long for a more satisfying life. If leaders focus more on that objective, we could indeed have a better world.
74 |
TECHNICAL ANNEX
TECHNICAL ANNEX COST-BENEFIT ANALYSIS IN TERMS OF WELLBEING

TECHNICAL ANNEX
| 75
This Annex spells out more formally and in more detail the argument in Chapter 4.
THE CONCEPTUAL OBJECTIVEThe government’s aim is, we assume, to maximise the wellbeing of the population (initially considered as the sum of each individual’s wellbeing, Wi ). This has to be done subject to the usual constraints of endowments, technology, and tastes, working their way through the market mechanism. To affect things, the government has three main types of policy instrument.
i) The first is programmes involving public expenditure. We include in these not only public services but also transfer payments, in order to highlight the choice between giving people money and giving services that help people to help themselves. There is thus an array of possible programmes (P~ ). Each programme Pj involves an expenditure Ej. Not all possible programmes can be activated, since there is a public expenditure constraint, E (assumed given):
∑j
Ej ≤ E (1)
ii) The second type of policy is tax policy, which determines the way in which public expenditure is financed. Again there is an array of different possible taxes (S~ ). Each tax Sk will yield its own tax-take Tk and altogether these tax receipts must finance the total of public expenditure:
∑k
Tk ≥ E (2)
iii) Finally there are regulations, where public revenue and expenditure are not the main issue. There is an array of possible regulations (R~ ) from which the government has to choose which to switch on.
(Clearly many actual policies are mixtures of those we have discussed, but this poses no problems.)
Therefore, we can think of the welfare of each individual as being determined by which expenditure programmes, taxes, and regulations are switched on:
Wi = Wi (P~ ,S~ ,R~ ) (i=1,…,n) (3)

TECHNICAL ANNEX
76 |
180. This needs modifying if there are some very large projects or projects that are mutually exclusive but differ in public expenditure cost
The government’s job then is to choose P~ , S~ and R~ to maximise ∑Wi subject to constraints (1), (2), and (3).
This task, if correctly undertaken, would throw up a shadow price of public expenditure (in units of wellbeing) corresponding to constraint (1). This price (call it þE) would measure the gain in wellbeing per pound of expenditure resulting from the marginal public expenditure programme. It would also throw up a shadow price of tax receipts (in units of wellbeing) corresponding to constraint (2). This price (call it þT ) would measure the loss of wellbeing per pound of tax receipts resulting from the most damaging tax that squeezed through.
One would hope that these two shadow prices were the same. If the shadow price of expenditure were higher than that of taxes, it would suggest that E should be higher. But issues of this kind must be left to the politicians. So we shall assume that þE = þT = þ.
DECENTRALISATIONMaximising ∑Wi subject to (1) – (3) describes the outcome we would like to achieve. But the same result can be achieved not through one single massive optimisation, but through a decentralised process whereby each possible programme, tax, or regulation is looked at on its own.181 For each possible change, we start from the existing configuration of policy and ask whether the change will be for the better. The answer is Yes if:
∑∆Wi – þ(∆E – ∆T) > 0 (4)
By trial and error we should soon find a value for þ that allowed the right number of expenditure programmes to pass the test. Equation (4) provides the basic rule for all cost-benefit analysis where wellbeing is the criterion.
i) For public expenditure programmes it says that the net gain in human welfare must exceed the net cost to the Treasury times the shadow price of Treasury funds. Perhaps more intuitively, it can also be written:
∑∆Wi (∆E – ∆T) > þ (5)
In other words, the welfare gain per pound of net Treasury cost must exceed some crucial value þ. In some parlance this approach is called cost-effectiveness analysis, since the calculations of costs and effects are in different units (in this case costs being measured in pounds and effects in units of wellbeing). If that designation makes the approach more acceptable, that is how it should be described.
ii) For taxation, the following is perhaps the most intuitive formulation:
∑∆Wi – ∆T < þ (6)
The loss of welfare per pound of taxes raised must be below some critical level.
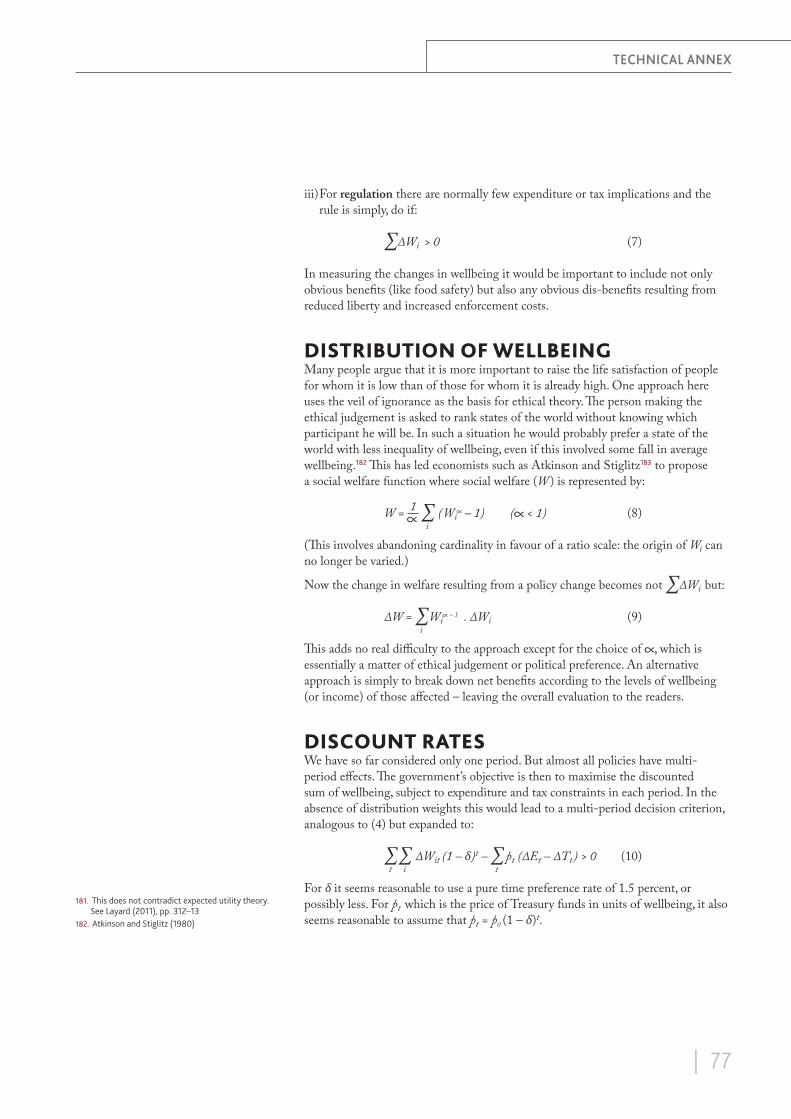
TECHNICAL ANNEX
| 77
181. This does not contradict expected utility theory. See Layard (2011), pp. 312–13
182. Atkinson and Stiglitz (1980)
iii) For regulation there are normally few expenditure or tax implications and the rule is simply, do if:
∑∆Wi > 0 (7)
In measuring the changes in wellbeing it would be important to include not only obvious benefits (like food safety) but also any obvious dis-benefits resulting from reduced liberty and increased enforcement costs.
DISTRIBUTION OF WELLBEINGMany people argue that it is more important to raise the life satisfaction of people for whom it is low than of those for whom it is already high. One approach here uses the veil of ignorance as the basis for ethical theory. The person making the ethical judgement is asked to rank states of the world without knowing which participant he will be. In such a situation he would probably prefer a state of the world with less inequality of wellbeing, even if this involved some fall in average wellbeing.182 This has led economists such as Atkinson and Stiglitz183 to propose a social welfare function where social welfare (W ) is represented by:
W = ∑i
(Wi – 1) ( < 1) (8)
(This involves abandoning cardinality in favour of a ratio scale: the origin of Wi can no longer be varied.)
Now the change in welfare resulting from a policy change becomes not ∑∆Wi but:
∆W = ∑i
Wi – 1 . ∆Wi (9)
This adds no real difficulty to the approach except for the choice of , which is essentially a matter of ethical judgement or political preference. An alternative approach is simply to break down net benefits according to the levels of wellbeing (or income) of those affected – leaving the overall evaluation to the readers.
DISCOUNT RATESWe have so far considered only one period. But almost all policies have multi-period effects. The government’s objective is then to maximise the discounted sum of wellbeing, subject to expenditure and tax constraints in each period. In the absence of distribution weights this would lead to a multi-period decision criterion, analogous to (4) but expanded to:
∑t∑
i ∆Wit (1 – δ)t – ∑
t þt (∆Et – ∆Tt ) > 0 (10)
For δ it seems reasonable to use a pure time preference rate of 1.5 percent, or possibly less. For þt which is the price of Treasury funds in units of wellbeing, it also seems reasonable to assume that þt = þ0 (1 – δ)t.

TECHNICAL ANNEX
78 |
LENGTH OF LIFEThe analysis so far takes person-years as given. If we follow standard practice and take births as exogenous, we shall simply add an extra, discounted, ∆Wi for each additional year that comes about through increased life expectancy.
MEASURING ∆WISo much for the framework; the much greater problem is the measuring of ∆Wi . As Chapter 2 points out, there are important problems in measuring Wi . But, even if these are (roughly) overcome, there are major difficulties in measuring the ∆Wixresulting from a policy change. The ideal approach would be a randomised controlled trial (RCT) but this is often not feasible. And it only gives data for as many years as the trial is continued.
This is where life-course models of the kind discussed in Chapter 3 can help. If an intervention raises, say, childhood emotional health by one unit, adult life satisfaction would rise by an amount predicted by the model in Figure 2. But this depends on the model being truly causal. To derive more causal models will require a lot more work. This has got to be one of the main tasks of social science in the years to come.
MEASURING (∆E – ∆T)An equally important task is to get better measurements of the net change in Treasury funding as a result of a policy. The immediate cost is usually fairly clear, but the subsequent impact through additional costs and cost savings is much less so. There have been many notable cases of over-claiming in this field. For example, early work on the Perry Pre-School Programme showed that programme participants later received both more education and higher earnings than the control group. The higher earnings were credited to the programme without deducting the cost of the extra education.
To trace the year-by-year impact of a policy on the individual’s use of public services is an absolutely critical need. Life-course models will help in this, as will experimental designs (for example where a new mental-health programme is introduced in some areas and the subsequent savings on NHS physical healthcare are evaluated against control areas).
RELATION TO TRADITIONAL COST-BENEFIT ANALYSISAs is said in Chapter 4, traditional cost-benefit analysis should continue to be used in some areas. But this raises two questions:
1) How can non-pecuniary factors (such as X) be valued in money units? The best available approach is as follows. If we have a wellbeing equation in which both X and log income (log Y) appear, such as:
Wi = aXi + b logYi + etc (11)

TECHNICAL ANNEX
| 79
it follows that the equivalent variation for a change in Xi is:
∆Yi = Yi (∆Xi ) (12)
2) If some policies are evaluated in units of wellbeing and others in money, how do we compare policies in those two different categories? The problem here is that there is a wide range of estimates of the marginal utility of money at any particular income level (though not of the ratios between the marginal utility at different income levels). So in practice it may be necessary to have two separate pots of money – one for policies evaluated in money units and one for policies evaluated in units of wellbeing.
CONCLUSIONPresent methods of cost-benefit analysis give little guide to the cost-effectiveness of much of public policy. The only way forward is through direct measurement of wellbeing and causal models of how it is determined. This is still in its infancy. But, as Chapter 3 showed, even existing knowledge indicates the need for major new priorities. And, as knowledge accumulates, the evaluation of specific projects in terms of wellbeing outcomes will become increasingly feasible. We urge the British Treasury to take a lead in making this happen, as they once did with traditional cost-benefit analysis.

80 |
BIBLIOGRAPHY
BIBLIOGRAPHY

BIBLIOGRAPHY
| 81
Anik, L., Aknin, L. B., Norton, M. I., Dunn, E. W., and Quoidbach, J. “Prosocial Bonuses Increase Employee Satisfaction and Team Performance”, PLoS ONE, 8, no. 9 (2013).
Ariely D., Working paper, Duke University, 2014.
Atkinson, A. B., and Stiglitz, J. E. Lectures on Public Economics. (Maidenhead: McGraw-Hill, 1980).
Bailey, L. Developing Healthy Minds in Teenagers Project – Briefing Paper. (Hertfordshire County Council, 2013). Available at www.thegrid.org.uk/learning/hwb/ewb/prp/thrive/documents/dev_healthy_minds_teenagers_briefing_sep13.pdf
Baker-Henningham, H., Scott, S., Jones, K., and Walker, S. “Reducing Child Conduct Problems and Promoting Social Skills in a Middle-income Country: Cluster Randomised Controlled Trial”, British Journal of Psychiatry, 201 (2012): 101–8.
Baum, A., and Davis, G. E. “Reducing the Stress of High-density Living: An Architectural Intervention”, Journal of Personality and Social Psychology, 38, no. 3 (1980):471–81.
Baum, A., and Valins, S. Architecture and Social Behaviour: Psychosocial Studies of Social Density (New Jersey: Hillsdale, 1977).
Baumeister, R. F., Gailliot, M., DeWall, C. N., and Oaten, M. “Self-regulation and Personality: How Interventions Increase Regulatory Success, and How Depletion Moderates the Effects of Traits on Behavior”, Journal of Personality, 74 (2006):1773–1801.
Blanchflower, D. G., and Oswald, A. J. “Well-Being, Insecurity and the Decline of American Job Satisfaction”. Presented at Cornell University (1999), accessed from www.dartmouth.edu/~blnchflr/papers/JobSat.pdf
Bosma, H., Marmot, M. G, Hemingway, H., Nicholson, A. G., Brunner, E., and Stansfeld, A. “Low Job Control and Risk of Coronary Heart Disease in Whitehall II (Prospective Cohort) Study”, British Medical Journal, 314 (1997): 558–65.
British Academy. Prospering Wisely: How the Humanities and Social Sciences Enrich our Lives. (London: British Academy, 2014). Available at www.britishacademy.ac.uk/prosperingwisely

BIBLIOGRAPHY
82 |
Broome, J. Weighing Lives. (Oxford: Oxford University Press, 2004).
Bruni, L., Comim, F., and Pugno, M. (eds.). Capabilities and Happiness. (Oxford: Oxford University Press, 2008).
Brunwasser, S. M., Gillham, J. E., and Kim, E. S. “A Meta-analytic Review of the Penn Resiliency Program’s Effect on Depressive Symptoms”, Journal of Consulting and Clinical Psychology, 77, no. 6 (2009): 1042–54.
Cabinet Office. “Life Satisfaction by Occupation in Mid-career”, unpublished analysis (2014).
Cable N., Bartley, M., Chandola, T. and Sacker, A. “Friends are Equally Important to Men and Women, but Family Matters More for Men’s Well-being”, Journal of Epidemiology and Community Health, 67, no. 2 (2013):166–71
Clark, A., and Oswald, A. “A Simple Statistical Method for Measuring How Life Events Affect Happiness”, International Journal of Epidemiology, 31 (2002): 1139–44.
Clark, A., and Senik, C. “Is Happiness Different from Flourishing? Cross-country Evidence from the ESS”, Paris School of Economics Working Paper, no. 4 (2011).
Clark, A. E, Diener, E., Georgellis, Y., and Lucas, R. “Lags and Leads in Life Satisfaction: A Test of the Baseline Hypothesis”, The Economic Journal, 118, no. 529 (2008): F222–43.
Clark, A. E., Georgellis, Y., and Sanfey, P. “Scarring: The Psychological Impact of Past Unemployment”, Economica, 68, no. 270 (2001): 221–41.
Clark, D. M. “Implementing NICE Guidelines for the Psychological Treatment of Depression and Anxiety Disorders: The IAPT Experience”, International Review of Psychiatry, 23 (2011): 318–27.
Council of Civil Service Unions, Cabinet Office and UCL (ed. Ferrie, J.), Work Stress and Health: The Whitehall II Study (London: Public and Commercial Services Union on behalf of Council of Civil Service Unions/Cabinet Office, 2004).
Cowan, C. P., and Cowan, P.A. When Partners Become Parents: The Big Life Change for Couples. (Mahwah, New Jersey: Lawrence Erlbaum Associates, 2000).
Cummins, B., and Gullone, E. “Why We Should Not Use 5-point Likert Scales: The Case for Subjective Quality of Life Measurement” in Proceedings, Second International Conference on Quality of Life in Cities, National University of Singapore, (2000):74–93.
Davern, M., Cummins, R., and Stokes, M. “Subjective Wellbeing as an Affective-Cognitive Construct”, Journal of Happiness Studies, 8, (2007): 429–49.
Davidson, R. J. “Emotion and Affective Style: Hemispheric Substrates”, Psychological Science, 3, no. 1 (1992): 39–43.
Deaton, A. “The Financial Crisis and the Well-being of Americans”, Oxford Economic Papers, 64, (2011): 1–26.
Deaton, A., and Stone, A. “Evaluative and Hedonic Wellbeing Among Those With and Without Children at Home.” Proceedings of the National Academy of Sciences, 111, no. 4 (2014): 1328–33.
BIBLIOGRAPHY
| 83
Deci, E. L., and Ryan, R.M. Intrinsic Motivation and Self-Determination in Human Behavior. (New York: Plenum, 1985).
De Neve, J., and Oswald, A. J. “Estimating the Influence of Life Satisfaction and Positive Affect on Later Income Using Sibling Fixed Effects.” Proceedings of the National Academy of Sciences, 109, no. 49 (2012): 19953–58.
Department for Communities and Local Government. Understanding Differences in Life Satisfaction Between Local Authority Areas (2013). Available at www.gov.uk/government/publications/understanding-differences-in-life-satisfaction-between-local-authority-areas
Department of Work and Pensions. Evaluation of the Support for Very Long Term Unemployed Trailblazer, Research Report 824 (London: Department of Work and Pensions, 2012).
Dewhurst M., Guthridge, M., and Mohr, E. “Motivating People: Getting Beyond Money”, McKinsey Quarterly¸ (November 2009). Available at www.mckinsey.com/insights/organization/motivating_people_getting_beyond_money?cid=other-eml-ttn-mip-mck-oth-1312.
Diaz-Serrano, L. and Rodríguez-Pose, A. “Decentralization, Happiness and the Perception of Institutions”, paper provided by Instituto Madrileño de Estudios Avanzados (IMDEA) Ciencias Sociales in its series “Working Papers”, no. 2011– 07 (2011).
Diener, E., and Suh, E. “National Differences in Subjective Wellbeing” in D. Kahneman, E. Diener and N. Schwarz (eds.), Well-Being: The Foundations of Hedonic Psychology. (New York: Russell Sage Foundation, 1999).
Diener, E., Helliwell, J., and Kahneman, D. (eds.). International Differences in Well-Being. (Oxford: Oxford University Press, 2010).
Diener, E., Tay, L., and Myers, D.G. “The Religion Paradox: If Religion Makes People Happy, Why Are So Many Dropping Out?”, Journal of Personality and Social Psychology, 101, no. 6 (2011): 1278–90.
Di Tella, R., MacCulloch, R., and Oswald, A.J.. “The Macroeconomics of Happiness”, Review of Economics and Statistics, 85, no. 4 (2003): 809–27.
Dolan, P. “Modeling Valuations for Euroqol Health States”, Medical Care, 35 (1997): 1095–108.
Dolan, P., Hallsworth, M., Halpern, D., King, D., and Vlaev, I. Mindspace: Influencing Behaviour Through Public Policy. (London: Cabinet Office and Institute for Government, 2010).
Dolan, P., and Metcalfe, R. Comparing Willingness-To-Pay and Subjective Well-Being in the Context of Non-Market Goods, CEP Discussion Paper, no. 890 (London: London School of Economics, 2008).
Dolan P., Peasgood, T., and White, M. “Do We Really Know What Makes Us Happy? A Review of the Economic Literature on the Factors Associated with Subjective Well-being”, Journal of Economic Psychology, 29, (2008): 94–122.

BIBLIOGRAPHY
84 |
Duckworth, A. L., Kirby, T. A., Tsukayama, E., Berstein, H., and Ericsson, K. A. “Deliberate Practice Spells Success: Why Grittier Competitors Triumph at the National Spelling Bee”, Social Psychological and Personality Science, 2 (2011): 174–81.
Duckworth, A. L., Peterson, C., Matthews, M. D., and Kelly, D. R. “Grit: Perseverance and Passion for Long-term Goals”, Journal of Personality and Social Psychology, 92 (2007): 1087–101.
Duckworth, A. L., Quinn, P. D., and Tsukayama, E. “What No Child Left Behind Leaves Behind: The Roles of IQ and Self-control in Predicting Standardized Achievement Test Scores and Report Card Grades”, Journal of Educational Psychology, 104, (2012): 439–51.
Duckworth, A. L., and Seligman, M. E. “Self-discipline Outdoes IQ in Predicting Academic Performance of Adolescents”, Psychological Science, 16, (2005): 939–44.
Dunn, E., and Norton, M. Happy Money: The Science of Smarter Spending (London: Oneworld Publications, 2013).
Durlak, J. A., Weissberg, R. P., Dymnicki, A. B., Taylor, R. D. and Schellinger, K. B. “The Impact of Enhancing Students’ Social and Emotional Learning: A Meta-analysis of School-based Universal Interventions”, Child Development, 82, no. 1 (2011): 405–32.
Ertel K. A., Glymour M. M., and Berkman L. F. “Effects of Social Integration on Preserving Memory Function in a Nationally Representative US Elderly Population”, American Journal of Public Health, 98, no. 7 (2008):1215–20.
Eurofound. Third European Quality of Life Survey – Quality of Life in Europe: Subjective Well-being. (Luxembourg: Publications Office of the European Union, 2013).
European Social Survey. Final Source Questionnaire, Amendment 03, (2007). Available at www.europeansocialsurvey.org/
Eurostat. Guidelines for the Development and Criteria for the Adoption of Health Survey Instruments, (Luxembourg: Eurostat, 2005).
Eurostat. Guidelines on Harmonised European Time Use Surveys, (Luxembourg: Eurostat, 2004).
Fesseau, M. and Mattonetti, M. “Distributional Measures across Households Groups in a National Accounts Framework”, OECD Statistics Working Paper. no. 53 (2013).
Field, F. “The Foundation Years: Preventing Poor Children Becoming Poor Adults”, The Report of the Independent Review on Poverty and Life Chances. (London: Cabinet Office/HM Government, 2010).
Flouri, E. “Subjective Well-being in Midlife: The Role of Involvement of and Closeness to Parents in Childhood”, Journal of Happiness Studies, 5, no. 4 (2004): 335–58.
Frey, B. S. “How Should People be Rewarded for Their Work?” in A. Oliver, Behavioural Public Policy. (Cambridge: Cambridge University Press, 2013).

BIBLIOGRAPHY
| 85
Frey, B. S., and Stutzer, A. “Happiness, Economy and Institutions”, The Economic Journal, 110, no. 466 (2000): 918–38.
Frijters, P., Johnston, D. W., and Shields, M.A. “Destined for (Un) Happiness: Does Childhood Predict Adult Life Satisfaction?” IZA Discussion paper series//Forschungsinstitut zur Zukunft der Arbeit, no. 5819 (2011).
Fujiwara, D. “The Department for Work and Pensions Social Cost-Benefit Analysis Framework: Methodologies for Estimating and Incorporating the Wider Social and Economic Impacts of Work in Cost-Benefit Analysis of Employment Programmes”, Working Paper No. 86. (London: Department for Work and Pensions, 2010).
Fujiwara, D., and Campbell, R.. “Valuation Techniques for Social Cost-Benefit Analysis: Stated Preference, Revealed Preference and Subjective Well-Being Approaches. A Discussion of the Current Issues”. (London: HM Treasury/Department for Work and Pensions, 2011).
Furstenberg, F., and Kiernan, K. “Delayed Parental Divorce: How Much Do Children Benefit?”, Journal of Marriage and the Family, 63 (2001): 446–57.
Gallie D. Economic Crisis, Quality of Work and Social Integration: Topline Results from Rounds 2 and 5 of the European Social Survey. (London: Centre for Comparative Social Surveys, 2013).
Gallie, D., and Zhou, Y. “Job Control, Work Intensity and Work Stress” in D. Gallie (ed.), Economic Crisis, Quality of Work and Social Integration. (Oxford: Oxford University Press, 2013).
Gallup Organisation, Indexes and Questions. (Gallup, 2012).
Gilbert, D. Stumbling on Happiness. (New York: Knopf, 2006).
Glass, T. A., De Leon, C. F. M., Bassuk, S. S., and Berkman, L. F., “Social Engagement and Depressive Symptoms in Late Life Longitudinal Findings”, Journal of Aging Health, 18, no. 4 (2006): 604–28.
Grahn, P., and Stigsdotter, U. A. “Landscape Planning and Stress”, Urban Forestry & Urban Greening, 2, no. 1 (2003):1–18.
Grant, A. M. Give and Take: A Revolutionary Approach to Success. (London: Penguin, 2013).
Green, F., and Tsitianis, N. “An Investigation of National Trends in Job Satisfaction in Britain and Germany”, British Journal of Industrial Relations, 43, no. 3 (2005): 401–29.
Griffin, J. The Lonely Society? (London: Mental Health Foundation, 2010).
Grimes, A., Oxley, L., and Tarrant, N. “Does Money Buy Me Love? Testing Alternative Measures of National Wellbeing”, Motu Working Paper, Motu Economic and Public Policy Research, 12, no. 9 (2012).
Grün, C., Hauser, W., and Rhein, T. “Is Any Job Better Than No Job? Life Satisfaction and Re-Employment”, Journal of Labor Research, 31 (2010): 285–306.

BIBLIOGRAPHY
86 |
Gyarmati, D., de Raaf S., Palameta, B., Nicholson, C. and Hui, T. “Encouraging Work and Supporting Communities: Final Results of the Community Employment Innovation Project”. (Ottawa: Social Research and Demonstration Corporation, 2008).
Halpern, D. Mental Health and the Built Environment: More Than Bricks and Mortar? (London: Taylor & Francis, 1995).
Halpern, D. Social Capital. (London: Polity, 2004).
Halpern, D. The Hidden Wealth of Nations. (London: Polity, 2009)
Halpern, D., and Reid, J. “Effect of Unexpected Demolition on Announcement on Health of Residents”, British Medical Journal, 304 (1992):1229–30.
Hawkley, L. C., Thisted, R. A., Masi, C. M., and Cacioppo, J. T. “Loneliness Predicts Increased Blood Pressure: 5-year Cross-lagged Analyses in Middle-aged and Older Adults”, Psychology and Aging, 25, no. 1 (2010): 132–41.
Helliwell J. F. “Life Satisfaction and the Quality of Development” in NBER Working Paper No. 14507, National Bureau of Economic Research, (2008).
Helliwell, J. F., and Barrington-Leigh, C. “Measuring and Understanding Subjective Well-being” in NBER Working Paper No. 15887, National Bureau of Economic Research, (2010).
Helliwell J. F., Huang, H., Grover S., and Wang, S. “Good Governance and National Well-being: What are the Linkages?”, OECD Governance Committee (forthcoming).
Helliwell, J. F., Layard, R., and Sachs, J. (eds.). World Happiness Report. (New York: The Earth Institute, Columbia University, 2012).
Helliwell, J. F., Layard, R., and Sachs, J. (eds.). World Happiness Report 2013. (New York: UN Sustainable Development Solutions Network, 2013).
Helliwell, J. F., and Wang, S. “Trust and Wellbeing”, International Journal of Wellbeing, 1, no. 1 (2011): 42–78.
Holmes, T. H., and Rahe, R. H. “The Social Readjustment Rating Scale”, Journal of Psychosomatic Research, 11, no. 2 (1967): 213–8.
Holt-Lunstad, J., Smith, T. B., and Layton, J. B. “Social Relationships and Mortality Risk: A Meta-analytic Review”, PLoS Med, 7, no. 7 (2010).
Holwerda T. J., Deeg, D. J., Beekman, A. T., van Tilburg, T. G., Stek, M. L., Jonker, C., Schoevers, R. A., “Feelings of Loneliness, But Not Social Isolation, Predict Dementia Onset: Results from the Amsterdam Study of the Elderly (AMSTEL)”, Journal of Neurology, Neurosurgery and Psychiatry, 85, no. 2 (2014): 135–42.
Huppert, F., Marks, N., Clark, A., Siegrist, J., Stutzer, A., Vitterso, J., and Wahrendorf, M. “Measuring Well-being Across Europe: Description of the ESS Well-being Module and Preliminary findings”, Social Indicators Research, (2009): 301–15.
Huppert, F., and So, T. “Deriving an Objective Definition of Well-being”, Working Paper. (Cambridge: Well-being Institute, University of Cambridge, 2008).

BIBLIOGRAPHY
| 87
Hutchings, J., Daley, D., Jones, K., Martin, P., Bywater, T., and Gwyn, R. “Early Results from Developing and Researching the Webster-Stratton Incredible Years Teacher Classroom Management Training Programme in North West Wales”, Journal of Children’s Services, 2, no. 3 (2007): 15–26.
Huxley, A. Brave New World. (London: Penguin, 1932).
Information Collection Budget Office of Management and Budget (2012). Available at www.whitehouse.gov/omb/inforeg_infocoll#icbusg
Inglehart, R., Foa, R., Peterson, C., and Welzel, C. “Development, Freedom, and Rising Happiness: A Global Perspective (1981–2007)”, Perspectives on Psychological Science, 3, no. 4 (2008): 264–85.
INSEE, Enquete Emploi du Temps. (INSEE, 2010).
Ipsos MORI. Understanding Patient and Public Attitudes to the NHS, Report for the Healthcare Commission (2006).
Isen, A. M., Rosenzweig, A. S., and Young, M. J. “The Influence of Positive Affect on Clinical Problem Solving”, Medical Decision Making, 11, (1991): 221–27.
Jahoda, M., Lazarsfeld, P. F. and Zeisel, H. Marienthal: The Sociography of an Unemployed Community. (Aldine, Atherton, 1971).
Kahneman, D., and Deaton, A. “High Income Improves Life Evaluation But Not Emotional Well-being”, Proceedings of the National Academy of Sciences, 107, no. 38 (2010): 16489–93.
Kahneman, D., Diener, E., and Schwarz, N. (eds). Well-being: The Foundations of Hedonic Psychology. (New York: Russell Sage Foundation, 1999).
Kahneman, D., and Krueger, A. B. “Developments in the Measurement of Subjective Well-Being”, Journal of Economic Perspectives, 20, no. 1 (2006): 19–20.
Kahneman, D., Krueger, A. B., Schkade, D. A., Schwarz, N., and Stone, A. A. “A Survey Method for Characterizing Daily Life Experience: The Day Reconstruction Method (DRM)”, Science, 306 (2004): 1776–80.
Kahneman, D., and Riis, J. “Living, and Thinking About It: Two Perspectives on Life” in F. Huppert, N. Baylis and B. Keverne (eds.), The Science of Well-being. (Oxford: Oxford University Press, 2005): 285–305.
Kahneman, D., Ritov, I., and Schkade, D. “Economic Preferences or Attitude Expressions? An Analysis of Dollar Responses to Public Issues”, Journal of Risk and Uncertainty, 19 (1999): 220–42.
Keynes, J. M. The General Theory of Employment, Interest and Money, (London: Palgrave Macmillan,1935).
Kiernan, K. E., and Mensah, F. K. “Poverty, Maternal Depression, Family Status and Children’s Cognitive and Behavioural Development in Early Childhood: A Longitudinal Study”, Journal of Social Policy, 38, no. 4 (2009): 569–88.
Knight, C. P., and Haslam, S. A. “The Relative Merits of Lean, Enriched, and Empowered Offices: An Experimental Examination of the Impact of Workspace Management”, Journal of Experimental: Applied, 16, (2010):158–72.

BIBLIOGRAPHY
88 |
Knight, J., and Gunatilaka, R. “Great Expectations? The Subjective Well-being of Rural-urban Migrants to China”, World Development, 38, no. 1 (2010): 113–24.
Krueger, A. B., Kahneman, D., Schkade, D., Schwarz, N., and Stone, A. A. “National Time Accounting: The Currency of Life” in A. B. Krueger (ed.), Measuring the Subjective Well-Being of Nations: National Accounts of Time Use and Well-Being, 9, no. 86. (Chicago: University of Chicago Press 2009).
Krueger, A. B., and Schkade, D. A. “The Reliability of Subjective Well-Being Measures”, Journal of Public Economics, 92, no. 8–9 (2008): 1833–45.
Lagerveld, S. E., Blonk, R. W. B., Brenninkmeijer, V., Wijngaards-de Meij, L., and Schaufeli, W. B. “Work-focused Treatment of Common Mental Disorders and Return to Work: A Comparative Outcome Study”, Journal of Occupational Health Psychology, 17, no. 2 (2012): 220–34.
Lamberton, C. P., De Neve, J., and Norton, M. I. “Eliciting Taxpayer Preferences Increases Tax Compliance”, SSRN Working Paper, (2013). Available at SSRN: http://ssrn.com/abstract=2365751.
Larsen, R. J., and Fredrickson, B. L. “Measurement Issues in Emotion Research: Well-being”, The Foundations of Hedonic Psychology, (1999): 40–60.
Layard, R. “Can We Afford More Therapy?” LSE CEP mimeo, (2014). Available at cep.lse.ac.uk/layard
Layard, R. Happiness: Lessons from a New Science. 2nd ed. (London: Penguin, 2011).
Layard, R. “Well-Being Measurement and Public Policy.” in A. B. Krueger (ed.), Measuring the Subjective Well-Being of Nations: National Accounts of Time Use and Well-Being. (Chicago: University of Chicago Press, 2009): 145–54.
Layard, R., and Clark, D. M. Thrive: The Revolutionary Potential of Evidence-Based Psychological Therapies (Provisional Title). (London: Penguin, 2014).
Layard, R., Clark, A. E., Cornaglia, F., Powdthavee, N. and Vernoit, J. “What Predicts a Successful Life? A Life-course Model of Well-being”, CEP Discussion Paper No. 1245. (London: LSE Centre for Economic Performance, 2013).
Layard, R., Mayraz, G., and Nickell, S. J. “Does Relative Income Matter? Are the Critics Right?” in E. Diener, J. F. Helliwell, and D. Kahneman, International Differences in Well-Being. (New York: Oxford University Press, 2010): 139–65.
Layard, R., Nickell S., and Jackman, R. Unemployment: Macroeconomic Performance and the Labour Market, 2nd ed. (Oxford: Oxford University Press, 2005).
Layard, R., Nickell, S., and Mayraz, G. “The Marginal Utility of Income.” Journal of Public Economics, Special Issue: Happiness and Public Economics, 92, no. 8–9 (August 2008): 1846–57.
Little, I. M. D., and Mirrlees, J. A. Project Appraisal and Planning for Developing Countries. (New York: Basic Books, 1974).
Loewenstein, G. and Lerner, J. S. “The Role of Affect in Decision Making” in R. Davidson, H. Goldsmith, and K. Scherer, Handbook of Affective Science. (Oxford: Oxford University Press (2003): 619–42.
Luca, M. “Reviews, Reputation, and Revenue: The Case of Yelp.com.” Harvard Business School Working Paper, no. 12–016 (2011).

BIBLIOGRAPHY
| 89
Lund, R., Nilsson, C. J., and Avlund, K. “Can the Higher Risk of Disability Onset Among Older People Who Live Alone be Alleviated by Strong Social Relations? A Longitudinal Study of Non-disabled Men and Women”, Age Ageing, 39, no. 3 (2010).
Lundberg, U. and Cooper, C. L. The Science of Occupational Health: Stress, Psychobiology and the New World of Work. (Oxford: Wiley-Blackwell, 2011).
Lykken, D. Happiness: The Nature and Nurture of Joy and Contentment. (New York: St Martin’s Griffin, 1999).
Manski, C. F. Public Policy in an Uncertain World Analysis and Decisions. (Cambridge: Harvard University Press, 2013).
Marmot, M. Status Syndrome. (London: Bloomsbury, 2004).
Marselle, M. R., Irvine, K. N., and Warber, S. L. “Walking for Well-Being: Are Group Walks in Certain Types of Natural Environments Better for Well-Being than Group Walks in Urban Environments?” International Journal of Environmental Research and Public Health, 10, no. 11 (2013): 5603–28.
Mauss, M. The Gift: Forms and Functions of Exchange in Archaic Societies, no. 378 (WW Norton & Company, 1954).
McCrone, P., Knapp, M., Proudfoot, J., Ryden, C., Cavanagh, K., Shapiro, D. A., Tylee, A. “Cost-effectiveness of Computerised Cognitive-behavioural Therapy for Anxiety and Depression in Primary Care: Randomised Controlled Trial”, British Journal of Psychiatry, 185 (2004): 55–62.
Meier, S. and Stutzer, A. “Is Volunteering Rewarding in Itself ?”. Economica, 72, no. 1 (2008): 39–59.
Mykletun, A., Bjerkeset, O., Overland, S., Prince, M., Dewey, M., and Stewart, R. (2009), “Levels of Anxiety and Depression as Predictors of Mortality: The HUNT Study”, British Journal of Psychiatry, 195 (2009): 118–25.
National Scientific Council on the Developing Child. “Excessive Stress Disrupts the Architecture of the Developing Brain”, Working Paper 3 (2005/2014). Updated edition, retrieved from www.developingchild.harvard.edu.
NEF. National Accounts of Wellbeing. (London UK: New Economics Foundation, January 2009): 55–56,
NEF. Well-being Patterns Uncovered: An Analysis of UK Data. (London UK: New Economics Foundation, 2012).
NICE. Depression in Adults: The Treatment and Management of Depression in Adults (Clinical Guideline 90). (London: National Institute of Health and Clinical Excellence, 2009).
Nussbaum, M. and Sen, A. The Quality of Life. (Oxford: Oxford University Press, 1993).
OECD. How’s Life: Measuring Well-Being. (Paris: OECD Publishing, 2011).
OECD. OECD Guidelines on Measuring Subjective Well-being. (Paris: OECD Publishing, 2013).

BIBLIOGRAPHY
90 |
Oliver, A. Behavioural Public Policy (Cambridge: Cambridge University Press, 2013).
ONS. Initial Investigations into Subjective Well-being from the Opinions Survey. (United Kingdom: ONS, 2011).
ONS. “Personal Well-being Across the UK 2012/13”, Statistical Bulletin, (2013). Available at www.ons.gov.uk/ons/rel/wellbeing/measuring-national-well-being/personal-well-being-across-the-uk--2012-13/sb---personal-well-being-across-the-uk--2012-13.html
ONS. Subjective Well-being: A Qualitative Investigation of Subjective Well-being Questions. (United Kingdom: ONS, 2012).
Plomin, R., DeFries, J. C., Knopik, V. S., and Neiderhiser, J. M. (eds). Behavioral Genetics, 6th ed. (New York: Worth Publishers, 2013).
Proudfoot, J., Guest, D., Carson, J., Dunn, G., and Gray, J. “Effect of Cognitive-behavioural Training on Job-finding Among Long-term Unemployed People”, Lancet, 350 (1997): 96–100.
Putnam, R. Bowling Alone: The Collapse and Revival of American Community (New York: Simon and Schuster, 2000).
Raanaas, R. K., Patil, G. G., and Hartig, T. “Health Benefits of a View of Nature Through the Window: A Quasiexperimental Study of Patients in a Residential Rehabilitation Center”, Clinical Rehabilitation, 26, no. 1 (2011): 21–32.
Rempel, K. D. “Mindfulness for Children and Youth: A Review of the Literature with an Argument for School-based Implementation”, Canadian Journal of Counselling and Psychotherapy, 46, no. 3 (2012): 201–20.
Rilling, J., Gutman, D., Zeh, T., Pagnoni, G., Berns, G., and Kilts, C. “A Neural Basis for Social Cooperation”, Neuron, 35 (2002): 395–405.
Robertson, I., and Cooper, C. L. Well-Being: Productivity and Happiness at Work. (London: Palgrave Macmillan, 2011).
Russell, J. “A Circumplex Model of Affect”, Journal of Personality and Social Psychology, 39, no. 6 (1980): 1161–78.
Schwarz, N., and Strack, F. “Reports of Subjective Well-being: Judgmental Processes and Their Methodological Implications”, Well-being: The Foundations of Hedonic Psychology, (1999): 61–84.
Scott, S., Briskman, J., and O’Connor, T. G. “Strategies for Early Prevention of Antisocial Personality: Long-term Follow-up of Two Randomized Controlled Trials Comparing Indicated and Selective Approaches”, American Journal of Psychiatry, (2013).
Seldon, A. “Why the Development of Character is More Important than Exam Results in Schools”, Priestley Lecture 2013, Jubilee Centre for Character and Values, University of Birmingham. Available at www.jubileecentre.ac.uk/media/news/article/15/The-Priestley-Lecture-23rd-January-2013.
Seligman, M. What You Can Change and What You Can’t. (New York: Knopf, 1994).
Seligman, M. The Optimistic Child: Proven Program to Safeguard Children from Depression & Build Lifelong Resilience. (New York: Harper Collins, 1996).

BIBLIOGRAPHY
| 91
Sen, A. Commodities and Capabilities. (Oxford: Oxford University Press, 1985).
Skidelsky, R., and Skidelsky, E. How Much is Enough?: The Love of Money and the Case for the Good Life. (London: Penguin, 2012).
Stern, N. The Economics of Climate Change: The Stern Review (Cambridge: Cambridge University Press, 2007).
Stevenson, B., and Wolfers, J. “Economic Growth and Subjective Well-Being: Reassessing the Easterlin Paradox”, Brookings Papers on Economic Activity, no. 1 (2008): 1–87.
Stiglitz, J. E., Sen, A., and Fitoussi ,J. P. Report by the Commission on the Measurement of Economic Performance and Social Progress. (Paris: 2009).
Thaler, R. H., and Sunstein, C. R. Nudge: Improving Decisions About Health, Wealth, and Happiness. (New Haven: Yale University Press, 2008).
Thompson, C. W. “Activity, Exercise and the Planning and Design of Outdoor Spaces”, Journal of Environmental Psychology, 34, (2013): 79–96.
Thurston, R. C., and Kubzansky, L. D. “Women, Loneliness, and Incident Coronary Heart Disease”, Psychosomatic Medicine, 71, no. 8 (2009): 836–42.
Transport for London. (n.d.). “Case Studies: The Cut” Retrieved from: web.archive.org/web/20120816020154/http://urbandesign.tfl.gov.uk/Design-Guidance/Case-Studies/Surface/TheCut.aspx
Tsukayama, E., Toomey, S. L., Faith, M. S., and Duckworth, A. L. “Self-control as a Protective Factor Against Overweight Status in the Transition from Childhood to Adolescence”, Archives of Pediatrics & Adolescent Medicine, 164 (2010): 631–35.
Tversky, A., and Kahneman, D. “Judgement Under Uncertainty: Heuristics and Biases”, Science, 185 (1974): 1124–31.
Ulrich, R. S. “View Through a Window May Influence Recovery from Surgery”, Science, 224 (1984): 420–21.
UNECE. Manual on Victimization Surveys. (United Nations: UNECE Secretariat, 2010).
UNECE. Revised Terms of Reference of UNECE/WHO/Eurostat Steering Group and Task Force on Measuring Health Status. (United Nations: UNECE Secretariat, 2009).
UNICEF. “Child Poverty in Perspective: An Overview of Child Well-being in Rich Countries”, Innocenti Report Card (2007): 7.
United Nations Statistical Division. Handbook of Household Surveys. (New York: United Nations, 1984).
United Nations Statistical Division. National Household Survey Capability Programme, Sampling Frames and Sample Designs for Integrated Survey Programmes. Preliminary version. (New York: United Nations, 1986).
Victor, C., and Yang, K. “The Prevalence of Loneliness Among Adults: A Case Study of the United Kingdom”, The Journal of Psychology: Interdisciplinary and Applied, 146, no. 1–2 (2012): 85–104.

BIBLIOGRAPHY
92 |
Walch, J., Rabin, B. S., Williams, J. N., Choi, K., and Kang, J. D. “The Effect of Sunlight on Post-Operative Analgesic Medication Usage: A Prospective Study of Spinal Surgery Patients”, Psychometric Medicine, 67 (2005): 156–63.
Weare, K. “Developing Mindfulness with Children and Young People: A Review of the Evidence and Policy Context”, Journal of Children’s Services, 8, no. 2 (2013): 141–53.
White, M., Alcock, I., Wheeler, B. W., and Depledge, M. H. “Would You be Happier Living in a Greener Urban Area? A Fixed-effects Analysis of Panel Data”, Psychological Science, (in press).
World Values Survey. Available at www.worldvaluessurvey.org
Wulfgramm, M. “Can Activating Labour Market Policy Offset the Detrimental Life Satisfaction Effect of Unemployment?”, Socio-Economic Review, 9 (2011): 477–501.
Zoogman, S., Goldberg, S. B., Hoyt, W. T., and Miller, L. “Mindfulness Interventions with Youth: A Meta-analysis”, Mindfulness, published online (15 January 2014).

Legatum Institute 11 Charles Street Mayfair London W1J 5DW United Kingdom
t: +44 (0) 20 7148 5400
Twitter: #prosperity @LegatumInst
www.li.comwww.prosperity.com
BUILDING A MORE PROSPEROUS WORLD THROUGH LIBERTY AND RESPONSIBILITY
MARCH 2014
9 781907 409578
978-1-907409-57-8
“This masterful report highlights an inspiring set of domains in which measures of wellbeing should be used to guide policies that are both humane and effective.”
Daniel Kahneman, Nobel Laureate in Economics; Author of Thinking, Fast and Slow; Professor Emeritus of Psychology and Public Affairs at Princeton University
“The global financial and economic crisis had a dramatic impact on millions of people across the world. As the global economy recovers, it is crucial to remember that a better future depends not only on GDP growth but also on the quality of people’s lives which cannot only be measured by the growth of GDP. As rigorous as it is relevant, I found that this fascinating analysis provides important insights for policymakers as they seek not only to promote solid, sustainable and balanced growth but also ultimately, the improvement of human wellbeing.”
Christine Lagarde, Managing Director, International Monetary Fund (IMF)
“Today, in the aftermath of the worst economic and financial crisis of our lifetime, a ‘growth as usual approach’ is simply not enough. By focusing on new measures of wellbeing and their usefulness for policy making, this report shows us the way ahead to improve people’s lives today and tomorrow.”
Angel Gurría, Secretary-General, The Organisation for Economic Co-operation and Development (OECD)
“In a world that was a vale of tears, public policy was rightly centred on the relief of misery. As education and abundance increase and suffering decreases, a new definition of prosperity is called for: one in which wellbeing stands shoulder to shoulder with relief of misery as the twin aims of public policy. This ground-breaking report points the way to the new prosperity.”
Martin Seligman, Zellerbach Family Professor of Psychology and Director of the Positive Psychology Center, University of Pennsylvania
“Public policy should, in large measure, be about the potential of people to prosper in terms of their ability to live the kind of life they value. In other words, it should seek to foster their wellbeing. This fine and important report provides a very valuable examination of the key issues around wellbeing and should be read by all those who think seriously about understanding the objectives of public policy.”
Nicholas Stern, Lord Stern of Brentford, I. G. Patel Professor of Economics and Government at LSE and President of the British Academy