Legal framework and economic feasibility of neighborhood ... · Legal framework and economic...
23
10. Internationale Energiewirtschaftstagung an der TU Wien IEWT 2017 Seite 1 von 23 Legal framework and economic feasibility of neighborhood energy storage systems Fabian Scheller (1)1 , Mario Götz (2) , Balthasar Burgenmeister (3) , Stephan Seim (1) , Rosa Haberland (1) , David Georg Reichelt (4) , Hendrik Kondziella (2) , Stefan Kühne (5) , Thomas Bruckner (1,2) (1) Institute for Infrastructure and Resources Management (IIRM), University Leipzig (2) Fraunhofer Center for International Management and Knowledge Economy (IMW), Leipzig (3) Industrielle Werke Basel (IWB), Basel (4) Institute for Applied Informatics (InfAI), Leipzig (5) University Computing Center, University Leipzig Abstract: Battery technologies for electricity storage applications have been available on the market for several years. Although they are often regarded as decisive for the integration of renewables, batteries still lack business models for their widespread implementation at the distribution grid level. According to different publicly funded projects, electricity storage systems on a neighborhood scale might represent a sustainable and economic solution. In this sense, this research paper aims to identify regulatory challenges as well as to assess economic opportunities of neighborhood energy storage systems (NES-systems). The future of the legal framework and regulations for battery storages remains uncertain. As of now, the legal definition of a NES-system is still deficient and comprises additional financial burdens which reflect neither their current role nor their potential in the future energy system. While the NES-system reveals poor economic conditions for today the economic situation could improve significantly over the years, especially by taking into account the requested legal conditions as well as the current cost trends. Nonetheless, an economic success requires the inclusion of the social, the technical and the environmental advantages of NES-systems. Keywords: neighborhood energy storage system, municipal energy system optimization, business models for renewable energy integration, legal and economic analysis 1. Innovative energy storage concepts Battery technologies for electricity storage applications have been available on the market for several years. Although they are often regarded as decisive for the integration of renewables, batteries still lack business models for their widespread implementation at the distribution grid level [1]. According to different publicly funded projects, electricity storage systems, on a neighborhood scale, might represent a sustainable and economic solution. Such neighborhood energy storage systems (NES-systems; also designated as Quartierspeicher) are defined as “’facilities which are able to receive energy and then release it again […] in the 1 Jungautor, Universität Leipzig, Grimmaische Straße 12, 04109 Leipzig, [email protected]
-
Upload
truongtuong -
Category
Documents
-
view
230 -
download
3
Transcript of Legal framework and economic feasibility of neighborhood ... · Legal framework and economic...
10. Internationale Energiewirtschaftstagung an der TU Wien IEWT 2017
Seite 1 von 23
Legal framework and economic feasibility of neighborhood energy storage systems
Fabian Scheller(1)1, Mario Götz(2), Balthasar Burgenmeister(3), Stephan Seim(1),
Rosa Haberland(1), David Georg Reichelt(4), Hendrik Kondziella(2), Stefan
Kühne(5), Thomas Bruckner(1,2)
(1)Institute for Infrastructure and Resources Management (IIRM), University Leipzig (2)Fraunhofer Center for International Management and Knowledge Economy (IMW), Leipzig
(3)Industrielle Werke Basel (IWB), Basel (4)Institute for Applied Informatics (InfAI), Leipzig
(5) University Computing Center, University Leipzig
Abstract:
Battery technologies for electricity storage applications have been available on the market for
several years. Although they are often regarded as decisive for the integration of renewables,
batteries still lack business models for their widespread implementation at the distribution
grid level. According to different publicly funded projects, electricity storage systems on a
neighborhood scale might represent a sustainable and economic solution. In this sense, this
research paper aims to identify regulatory challenges as well as to assess economic
opportunities of neighborhood energy storage systems (NES-systems). The future of the
legal framework and regulations for battery storages remains uncertain. As of now, the legal
definition of a NES-system is still deficient and comprises additional financial burdens which
reflect neither their current role nor their potential in the future energy system. While the
NES-system reveals poor economic conditions for today the economic situation could
improve significantly over the years, especially by taking into account the requested legal
conditions as well as the current cost trends. Nonetheless, an economic success requires the
inclusion of the social, the technical and the environmental advantages of NES-systems.
Keywords: neighborhood energy storage system, municipal energy system optimization,
business models for renewable energy integration, legal and economic analysis
1. Innovative energy storage concepts
Battery technologies for electricity storage applications have been available on the market for
several years. Although they are often regarded as decisive for the integration of renewables,
batteries still lack business models for their widespread implementation at the distribution
grid level [1]. According to different publicly funded projects, electricity storage systems, on a
neighborhood scale, might represent a sustainable and economic solution. Such
neighborhood energy storage systems (NES-systems; also designated as Quartierspeicher)
are defined as “’facilities which are able to receive energy and then release it again […] in the
1 Jungautor, Universität Leipzig, Grimmaische Straße 12, 04109 Leipzig, [email protected]
10. Internationale Energiewirtschaftstagung an der TU Wien IEWT 2017
Seite 2 von 23
form of electricity […] at a later time’ [2]. Additionally, community electricity storages provide
services based on balancing strategies for an association of prosumers, renewable energy
producers and loads that are connected to the same distribution grid. At least one of the
following operation strategies has to be implemented: maximizing self-consumption for all
participants, increasing shareholder’s profits in electricity markets, or optimizing community
welfare. Optionally the operation strategy should be grid supportive and increase the grid’s
hosting capacity for decentral renewable generation.” [3].
Despite significant efforts of utilities to promote technological innovations like these, major
barriers still prevail: uncertainties in unpredictable policy frameworks, lacking profitability of
projects, insufficient budgets for innovation, and the possibility of expensive mistakes, to
name but a few [4] [5]. In view of those uncertainties, this research paper aims to assess
economic opportunities of NES-systems systems. Due to the diverse uncertainties, this
research follows an interdisciplinary research approach: first, a deep-reaching qualitative
examination of legal, social and technical opportunities and challenges from a societal
perspective; second, a scenario-based quantitative evaluation of costs and earnings from
actors' perspective. While the first part of the research question is answered by reviewing
and synthesizing literature, the second part of the research is carried out by applying
scenario-based modelling and mixed integer optimization. Although this applied research
focuses on the conditions of the German energy system, general statements are derived
where possible.
2. Neighborhood energy storage systems
NES-systems might represent a sustainable and economic business model. For a
comprehensive understanding, this chapter outlines the qualitative analysis of the business
model in order to lay the foundation for the subsequent model based analysis (chapter 3 and
chapter 4). Thereby, the structural design of NES-systems and the legal framework in which
they are embedded, as well as the economic, ecologic and social implications are discussed.
Next to that, this chapter finishes with an overview of current market applications in
Germany.
2.1 Model structure
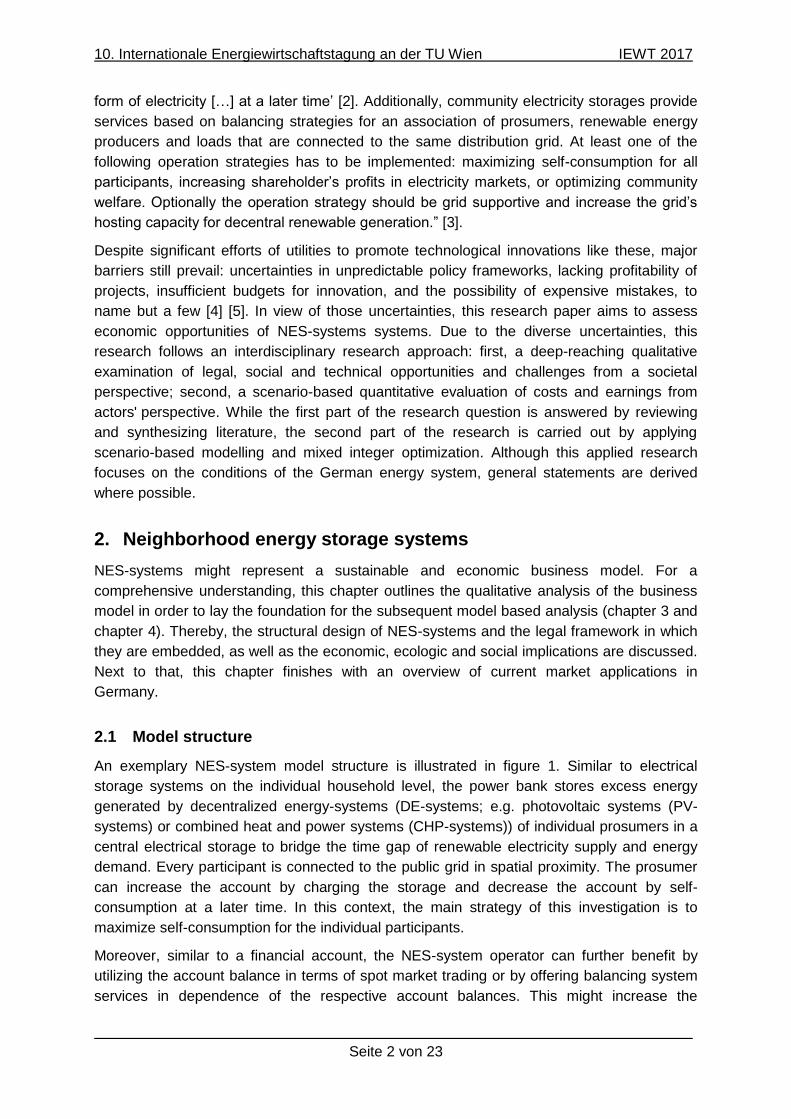
An exemplary NES-system model structure is illustrated in figure 1. Similar to electrical
storage systems on the individual household level, the power bank stores excess energy
generated by decentralized energy-systems (DE-systems; e.g. photovoltaic systems (PV-
systems) or combined heat and power systems (CHP-systems)) of individual prosumers in a
central electrical storage to bridge the time gap of renewable electricity supply and energy
demand. Every participant is connected to the public grid in spatial proximity. The prosumer
can increase the account by charging the storage and decrease the account by self-
consumption at a later time. In this context, the main strategy of this investigation is to
maximize self-consumption for the individual participants.
Moreover, similar to a financial account, the NES-system operator can further benefit by
utilizing the account balance in terms of spot market trading or by offering balancing system
services in dependence of the respective account balances. This might increase the
10. Internationale Energiewirtschaftstagung an der TU Wien IEWT 2017
Seite 3 von 23
profitability of the storage technology as well as grid reliance and goes also in line with the
one of the formulated operation strategy.
NES-systemCust2
Custn
Cust1
Cust3
Bi-directional
flow of energy
P1P2
PnP3
Spotmarket and
balancing marketoptimization
potential
Energy
consumption andgeneration
Cust 1 Cust 2 Cust n
Balance [kWh] [kWh] [kWh]
Balance [€] [€] [€]
Energy
accountingsystem
NES-system
operation andoptimization
distributiongrid
Figure 1: Urban quarter sharing a neighborhood storage system (cust = customer)
2.2 Legal framework
A legal definition of NES-systems does not exist. Moreover, the legal definition of electrical
storage systems in general is deficient [2]. In accordance with the Federal Supreme Court
(BGH), electrical storage systems are legally treated as final consumers in Germany, since
electrical energy is converted into chemical energy and back. This classification has been
criticized by the Bundesverband Energiespeicher (BVES) for being neither convincing from a
scientific perspective nor reasonable from an energy policy standpoint [6].
Final consumers currently are subject to full fees and levies, which causes severe
consequences for “NES” business models. The operation of NES-systems comprises two
steps: the intermediate storage of electrical energy (Prosumer -> Grid -> Battery) and the
feed-in of stored electrical energy (Battery -> Grid -> Prosumer). Both steps involve the grid
and thus might be associated with grid fees and levies. While the German regulatory
framework for the storage of energy provides some exemptions from fees, it is fragmented
and the applicability for the (individual) NES case remains partly vague. The relevant
legislation for an NES in Germany is outlined below.
The EEG (Renewable Energy Sources Act) regulates the development of renewable energy
sources in Germany. The newest revision of the EEG 2017 still does not provide any
clarification for the legal status of electrical storage systems. However, article § 61k
terminates the double burden of the EEG surcharge, which originally incurred both when the
battery is charged and discharged. According to the BVES [7], this also holds true for mixed
use storage systems, i.e. where the stored electricity is partly transferred to the grid and
10. Internationale Energiewirtschaftstagung an der TU Wien IEWT 2017
Seite 4 von 23
partly self-consumed by producers. Still, the EEG surcharge has to be paid for all electricity
that is taken out of storage, with no exemption for self-consumption.
The EnWG (Energiewirtschaftsgesetz) includes the regulation concerning the grid fees and
further fees, namely the offshore liability levy, the concession fee, the cogeneration levy, the
§ 19 StromNEV levy and the levy for deferrable loads. § 118 EnWG exempts newly installed
electrical storage systems from the grid fees for 20 years. With respect to the other fees,
there exist different perspectives. According to the Bundesnetzagentur, an exemption from
the grid fees through § 118 does not include the exemption from all other fees, which incur
regardless [8]. The BVES on the other hand refers to § 9 Abs. 7 KWKG (Kraft-Wärme-
Kopplungsgesetz) to argue, that the cogeneration levy is considered an annex to the grid fee
and can thus only incur when grid fees incur. The remaining fees should be treated
accordingly [9].
The electricity tax is regulated in StromStG and incurs every time electricity is consumed.
Pumped-storage power plants are explicitly exempted from this, batteries or other types of
energy storage systems however are not mentioned. Furthermore, § 9 StromStG provides an
exemption for the case of spatial proximity between the generation and the storage of
electricity. However, as there is no clear definition of spatial proximity provided the
applicability of the concept for a given NES remains uncertain [3].
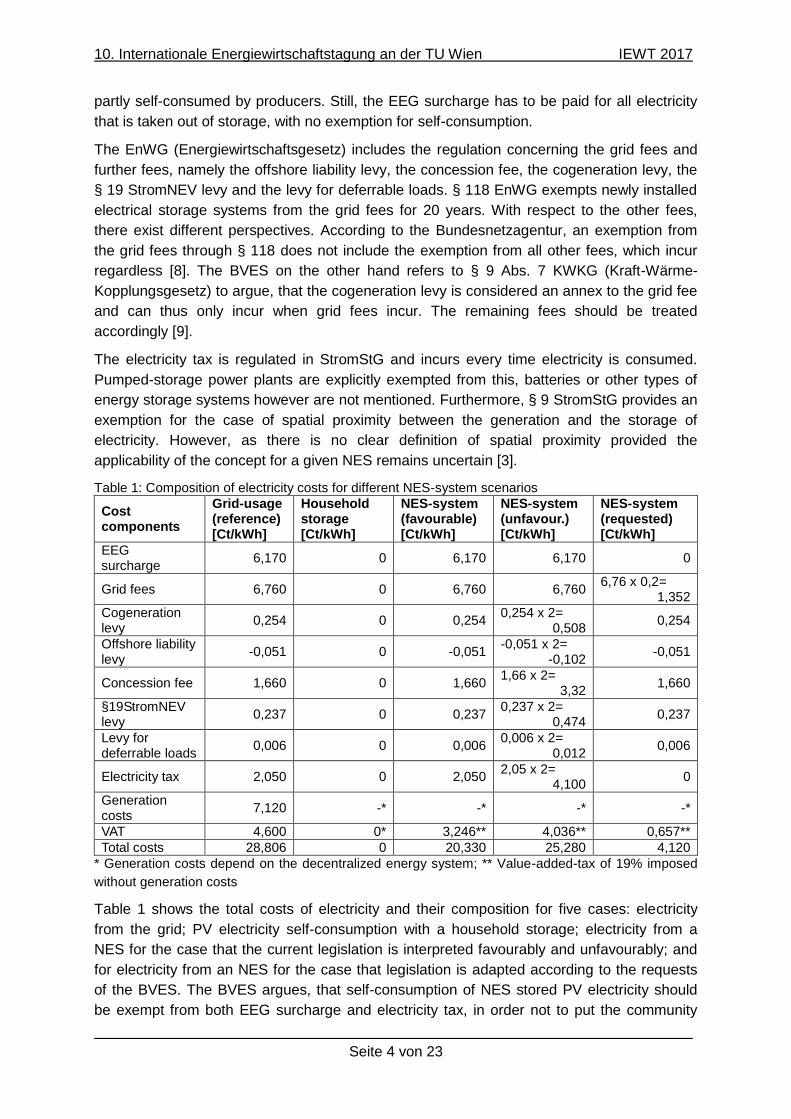
Table 1: Composition of electricity costs for different NES-system scenarios
Cost components
Grid-usage (reference) [Ct/kWh]
Household storage [Ct/kWh]
NES-system (favourable) [Ct/kWh]
NES-system (unfavour.) [Ct/kWh]
NES-system (requested) [Ct/kWh]
EEG surcharge
6,170 0 6,170 6,170 0
Grid fees 6,760 0 6,760 6,760 6,76 x 0,2=
1,352
Cogeneration levy
0,254 0 0,254 0,254 x 2=
0,508 0,254
Offshore liability levy
-0,051 0 -0,051 -0,051 x 2=
-0,102 -0,051
Concession fee 1,660 0 1,660 1,66 x 2=
3,32 1,660
§19StromNEV levy
0,237 0 0,237 0,237 x 2=
0,474 0,237
Levy for deferrable loads
0,006 0 0,006 0,006 x 2=
0,012 0,006
Electricity tax 2,050 0 2,050 2,05 x 2=
4,100 0
Generation costs
7,120 -* -* -* -*
VAT 4,600 0* 3,246** 4,036** 0,657**
Total costs 28,806 0 20,330 25,280 4,120
* Generation costs depend on the decentralized energy system; ** Value-added-tax of 19% imposed
without generation costs
Table 1 shows the total costs of electricity and their composition for five cases: electricity
from the grid; PV electricity self-consumption with a household storage; electricity from a
NES for the case that the current legislation is interpreted favourably and unfavourably; and
for electricity from an NES for the case that legislation is adapted according to the requests
of the BVES. The BVES argues, that self-consumption of NES stored PV electricity should
be exempt from both EEG surcharge and electricity tax, in order not to put the community

10. Internationale Energiewirtschaftstagung an der TU Wien IEWT 2017
Seite 5 von 23
solution worse off than the private solution, i.e. the household storage. Modern measuring
technology allows us to determine in which cases self-consumption occurs. Furthermore, the
exemption from the electricity tax should be possible even though the prosumer and the NES
operator are not the same person. Additionally, the BVES claims NES are eligible for
reduced grid fees when they are operated in a way that relieves the distribution net in
question. Indeed, § 19 Abs. 2 S. 1 StromNEV (Stromnetzentgeltverordnung) regulates grid
fee reductions for so-called atypical consumers, the maximum reduction being 80% [9].
From the comparison of the electricity costs shown in table 1 and figure 2 it becomes
apparent, that incurring fees and levies can make the business model NES prohibitively
expensive. Summing up, the existent regulatory framework for NES-systems is fragmented
and not consistent, and possibly distorts competition, both between electricity storage
systems and other flexibility options, and within the field of different storage solutions [10].
Hence, the regulatory framework is considered the most crucial influencing factor for the
future development of NES solutions [11].
Figure 2: Cost components for NES-system scenarios
In contrast to utilization of the public grid, the establishment of a local microgrid could also be
feasible. All grid-dependent fees could be avoided for electricity stored in the power bank.
However, due to specific legal requirements and significant extra costs, this solution is not
fostered here.
2.3 Optimal utilization
The optimal capacity of an NES that aims to maximize the self-consumption rates (SC) of PV
electricity for households is smaller than the aggregated capacities of all individual household
storage systems it replaces. This is because load profiles vary between households. A
reduction of capacity translates into lower specific investment costs and lower material use.
So far, there exist limited insights about the optimal dimensioning of an NES and the capacity
reduction that can be achieved.
10. Internationale Energiewirtschaftstagung an der TU Wien IEWT 2017
Seite 6 von 23
A study by German network solbat showed a capacity reduction potential of 25% for LI-
batteries and of 15% for Vanadium-Redox-Flow batteries, which have a lower efficiency. The
starting point of the study design was the assumption that the self-consumption rate of the
home storage case should be achieved with the NES-system (which was about 72% [12]).
Furthermore, it could be shown that when the load profile of a household changes (a young
couple turns into a family, a family turns into a retired couple, …), it leads to a non-optimal
dimensioning of the individual storage solution and the SC might drop during the lifetime of
the storage. In the NES, individual changes of load profiles balance each other out, and the
SC rate remained fairly stable in the changed scenario.
In practice, these considerations are sometimes neglected altogether. For example, the
NES-system pilot in Epplas by IBC solar has been dimensioned for a power input of 70 kW
and a capacity of 330 kWh to store peaks above a certain threshold, based on the
assumption that all participating PV systems simultaneously feed in with maximum power,
whilst no consumption takes place [13].
While the direct comparison of household storage systems and NES-systems is of interest, it
should be highlighted that an NES-system is not limited in its function to the maximization of
PV SC rates in households. The optimal dimensioning of an NES-system turns out to be
more complex when it includes more and diverse user groups (commercial customers,
households without own PV systems), when a complementary mixture of PV- and CHP-
systems, which possesses further beneficial characteristics for the system, is applied [9] or
when participation in the reserve control or spot market is pursued. This is reflected in the
wide range of current market applications for NES-systems (cf. table 2 in chapter 2.7).
Consequently, the optimal dimensioning of the capacity and power of a NES-system has
been rated the most pressing research issue by participants of the 1st international
Community Electricity Workshop at the HTW Berlin in February 2016 [11].
2.4 Economic foundation
Assessing the economic foundation of NES-systems, the electricity costs arising from the
legal framework compared to the reference cases of grid electricity and household storage
systems (sf. chapter 2.2), additional revenue streams that can be achieved and costs that
can be avoided with an NES need to be considered.
With respect to the legal framework, it has already been demonstrated that the incurring fees
and levies have substantial influence on the NES business model. For the case that the
current legislation is interpreted unfavourably, NES is clearly not competitive (cf. table 1).
The favourable NES case requires a more differentiated look. While the same fees occur as
for grid electricity, which would leave a margin in the amount of the generation costs, the
feed-in remuneration for renewable energy needs to be taken into account as well. For PV
systems below 10 kWp it is currently 12,31 Ct/kWh. Consequently, the prosumer would be
better off feeding the excess electricity into the grid for the remuneration and buying grid
electricity for consumption at a later point than using the NES option. The NES (requested)
case is currently not applicable but demonstrates how the economic performance of NES
could change in case the legal framework is altered in the future.
10. Internationale Energiewirtschaftstagung an der TU Wien IEWT 2017
Seite 7 von 23
In view of the technology costs (investment costs, O&M and replacement costs), NES
provide economic advantages over household storages due to scale effects. This is
especially true when household storages are virtually connected to participate in the control
reserve market, which is associated with higher expenditures for the necessary control
systems. Currently, household PV battery systems amount to average net system prices
(storage system including battery, without assembly) of approximately 2,300 €/kWh for
lithium-based systems and 1,300 €/kWh for lead-based systems with a significant trend to
decreasing prices, especially for lithium-based systems [14]. The costs of NES are estimated
to be significantly lower with approximately 800 €/kWh [15]. Experiences from the
“Strombank” model project show costs of 15 ct/kWh to cycle electricity in the NES [9]. Or in
other words, if the NES-system is scaled large enough (larger than 18 residential storages
according to the experiences of the Strombank model), one can even assume half price per
kWh compared to residential storage systems [16].
Next to avoided costs, additional revenue streams can increase the profitability of the NES-
system for the operator as well as for the prosumer. The stored energy but also the free
capacity can be used for trading on the spot market or to offer system services depending on
the state of charge. A survey with participants of the “Strombank” model project showed, that
a majority has no desire to actively control the marketing of their excess electricity, but rather
wants the operator to achieve moderate profits for them [17]. The attractive prices in the
primary balancing energy market in particular, however, might decrease over time for
multiple large scale battery operators offering these services [18].
In summary, the current economic viability of NES-systems is questionable. However, this
might change in the near future. In addition to the the influence of the regulatory framework,
trends that need to be observed include decreasing feed-in tariffs, decreasing technology
costs and high grid electricity prices. Furthermore, additional system benefits provided by
NES become more important with the progress of the energy transition although their
remuneration might decrease.
2.5 Ecologic expediency
Ecological advantages of an NES-system over household storage systems arise throughout
their life cycle. The materials for different battery technologies are associated with a
substantial cumulative energy demand (CED) and global warming potential (GWP). The
reduction potential of the overall capacity results in a lower material use and thus decreased
environmental impacts in the cradle-to-gate stage. A comparative life cycle assessment of
four stationary battery technologies found that the impacts attributed to losses in the use
phase of batteries are even higher [19]. NES solutions offer an increased harmonization
between supply and demand of electricity, thereby reducing these use phase losses as well
as their associated impacts.
2.6 Social anchorage
There are a number of social benefits potentially arising from the deployment of an NES. For
prosumers, the neighbourhood storage has a distinct potential to enhance the social
interaction in the community, establishing a regional identity of participants. While household
storages only benefit owners of PV systems and are normally applied to increase their self-
10. Internationale Energiewirtschaftstagung an der TU Wien IEWT 2017
Seite 8 von 23
consumption rate, NES schemes provide the opportunity to both integrate other consumers
and pursue further goals, for example participation in the reserve control market. Thereby,
they increase participation in the energy transition, which also fosters a higher level of
acceptance [3]. Furthermore, in contrast to household storages, the investment costs for the
NES are initially carried by the operator and not the prosumer. In this context, current
investigations show that around 75% of respondents clearly prefer the NES-system to
residential storage systems [16].
Beyond the individual perspective, the community as a whole can benefit by improving its
image in terms of environmental protection and innovativeness. This can be enhanced by
linking further innovative business models to the NES, for example eMobility loading stations.
Moreover, the energy management as well as the operation and maintenance of the asset
can contribute to regional value creation.
2.7 Market application
Table 2 briefly outlines particular projects with respect to NES-systems in Germany. In this
context, most of the projects still rely on public funds.
Table 2: Overview of selected NES-system projects in Germany
Provider Project Description
KACO new
energy
Model project
“Weinsberg”
- 150 kWh storage capacity (Li-ion)
- 23 households
- 145 kW PV and 11 kWel CHP
- meeting 97% of electrical energy demand
- heat pump 35 kWel, 1 central + 18 small thermal
storages
- start of operation: Nov. 2013
MVV Energie Model project
“Strombank”
- 100 kWh storage capacity (Li-ion)
- max. power input: 100 kW
- 14 households, 4 commercial customers
- PV and CHP
- start of operation: Dec. 2014
IBC Solar Model project
“Epplas”
- 330 kWh storage capacity (Li-ion) (660 kWh in
final phase)
- max. power input: 70 kW
- 13 households
- 287 kW PV
- start of operation: Apr. 2015
TUM /
Kraftwerke Haag
GmbH
Model project
EEBatt / TUM Energy
Neighbor
- 250 kWh storage capacity (Li-ion)
- max. power input: 200 kW
- 20 households
- 300 kW PV
- start of operation: Oct. 2015
ENTEGA AG Model project
“Solarsiedlung”
- 800 kWh storage capacity (Li-ion)
- max. power input: 250 kW (final phase)
- 24 households (82 in final phase)
- PV
- start of operation: Sep. 2016
10. Internationale Energiewirtschaftstagung an der TU Wien IEWT 2017
Seite 9 von 23
3. Model based analysis
To assess the present and the future economic potential of NES-systems, this research
paper deploys a scenario based analysis at neighborhood scale, considering different market
actors, electrical loads, storage systems and photovoltaic components as well as different
system relations and strategic initiatives. The evaluation period has been set to twenty years
(2015-2035). Potential future states of the energy system are investigated by applying a
green scenario (strong increase of renewables) and a fossil scenario (slow transition towards
renewables). The model parameters of the scenarios are based mainly on the following
developments: spot market prices and balancing power prices as well as the respective
consumer retail prices, EEG levies, feed-in tariffs, electrical load profiles, technology
specifications and environmental data. In this context, three optimization models have been
applied to receive answers with respect to different levels of aggregation as well as to
different levels of time horizon.
3.1 Optimization system
Major objective of this research paper is to assess present and future system behavior
regarding optimal NES-system design while optimizing the customer costs and the utility
profits. To determine optimal energy and finance flows according to the objectives, the
energy model IRPsim (Integrated Resource Planning and Simulation) is applied [20]. The
bottom-up techno-economic model with a municipal scope, which is implemented in
GAMS/CPLEX and embedded in a client-server-architecture, allows for solving mixed-integer
problems in a quarter-hourly resolution for perennial periods. In the context of this research,
the rolling optimization horizon comprises the quarter-hours of two days. While the
optimization results of the first day are stored, the results of the second day are neglected
but the second day displays the starting point of the new optimization horizon and so on.
Central purpose is the evaluation of innovative business models in a dynamic market
environment from different actors’ perspectives. In this context, the modular structure allows
the configuration and optimization of various energy systems in general and of NES-systems
in particular. The specific modules are described by actors, technologies, energy flows,
power measurements, dependencies, tariffs as well as the market and the environment.
The objective function of the optimization maximizes the total profit of individual actors’
variable financial flows, while the operational planning of system components is optimized by
a dispatch model. In the framework of this paper, the model works with an actor related two-
step optimization systematic. The model firstly optimizes from an aggregated customer
perspective, determining the residual energy demand and excess energy supply with all
components the customers have regulative access to. With respect to the first optimization
step (customer optimization), especially the tariff scheme as well as the variable costs of
decentral energy systems are decisive. In the subsequent step, the model optimizes all other
energy and financial flows from the utilities’ perspective, considering all residual energy
demand and supply. A regional energy deficit might be balanced by storage systems,
generation plants activities and by spot market trading. Excess energy is sold to the spot
market or stored to storage systems. Next to that, operating reserve like spinning reserve
and non-spinning reserve can be pooled and offered at the operating reserve market. With
respect to the second optimization step (organization optimization), especially the market
10. Internationale Energiewirtschaftstagung an der TU Wien IEWT 2017
Seite 10 von 23
prices as well as the variable costs of the central and decentral energy systems are decisive.
This two-step optimization process results in a multi-perspective optimization and attempts to
reflect realistic market conditions. From a conceptual point of view, this idea of a multi-level-
entity oriented optimization approach (which is similar to the two-step approach selected
here) has been already presented by authors in earlier studies [21] [22]. The approach also
goes in line with the applied operation strategy of an NES-system in this research:
self-consumption is maximized by electrical load coverage with respect to NES-
system participants and their tariff scheme,
charging and discharging behavior of NES-system participants is transferred to and is
considered by the NES-system operator
storage utilization is maximized by spot market trading and balancing system service
offerings with respect to NES-system operator.
The optimization model IRPsim determines the net present value (NPV) of payment series of
individual customer groups as well as business divisions, by the sum of variable and fixed
cash flows [20].
MICOES-Reserve LICOES-EuropeMICOES-Europe
Markets
Utility
Application
Control
Power: PR/SR/MR
Spot Market:
Day-ahead
Investments
& Capacity Remuneration
IRPsim
Sales GridTradeGeneration Services
Electricity Heat Gas
Power-
to-HeatDSM/DR
NES-
system
Direct
marketing…
Business Models
Time Horizonshort term long term
Ag
gre
gati
on
le
ve
l
…
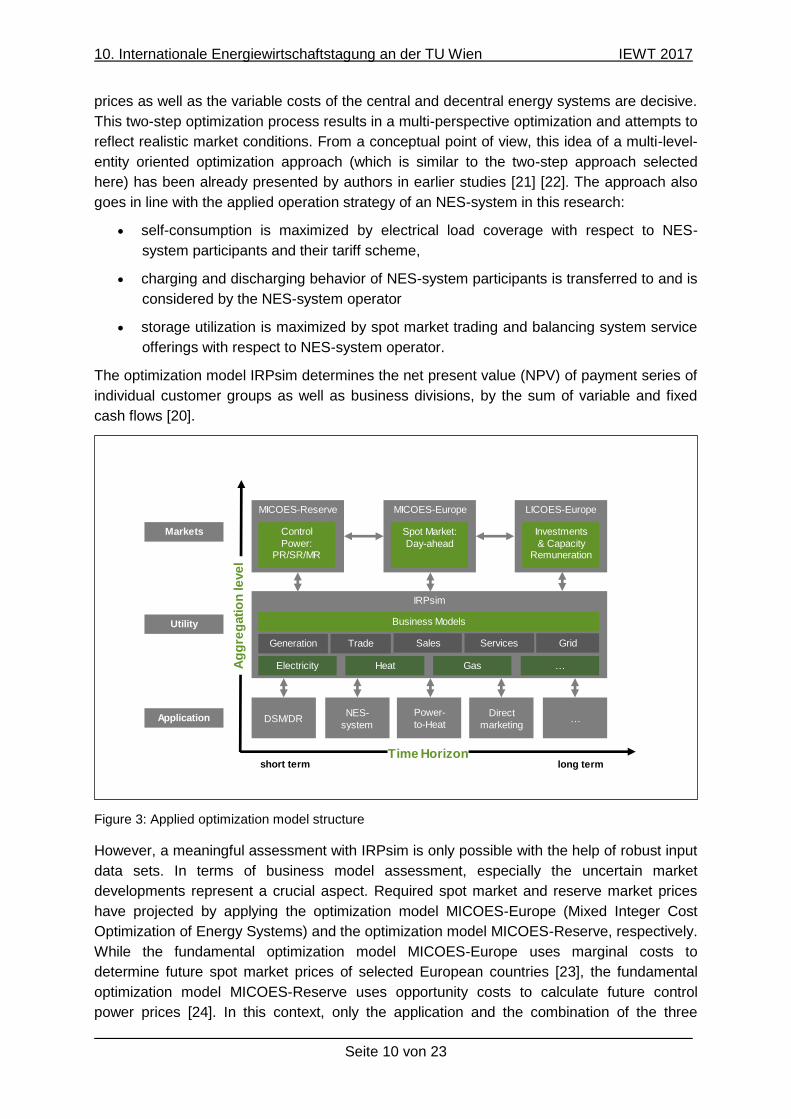
Figure 3: Applied optimization model structure
However, a meaningful assessment with IRPsim is only possible with the help of robust input
data sets. In terms of business model assessment, especially the uncertain market
developments represent a crucial aspect. Required spot market and reserve market prices
have projected by applying the optimization model MICOES-Europe (Mixed Integer Cost
Optimization of Energy Systems) and the optimization model MICOES-Reserve, respectively.
While the fundamental optimization model MICOES-Europe uses marginal costs to
determine future spot market prices of selected European countries [23], the fundamental
optimization model MICOES-Reserve uses opportunity costs to calculate future control
power prices [24]. In this context, only the application and the combination of the three
10. Internationale Energiewirtschaftstagung an der TU Wien IEWT 2017
Seite 11 von 23
optimization models allows a fundamental analysis of the economic potential of business
models in general as well as of NES-systems in particular. An overview of the described
optimization model landscape is given in Figure 3.
3.2 Scenario foundation
Based on content of the World Energy Outlook of 2013 [25], two future scenarios are defined
for the model-based scenario analysis: a green (G) scenario and a fossil (F) scenario, which
relate back to the ‘450 scenario’ and the ‘current policy scenario’ of the above publication.
The fossil scenario, thus, depicts a baseline picture of how the global energy system would
evolve, if current trends in energy demand and supply remain unabated. The green scenario,
on the other hand, represents a global energy market scenario, which allows for significant
chance for successful climate change abatement with regard to staying below the global
warming target of a maximum global mean temperature change of two 2 °C (compared to the
pre-industrial level). It thereby depicts a much more transformative scenario with regard to a
de-carbonization of the energy system.
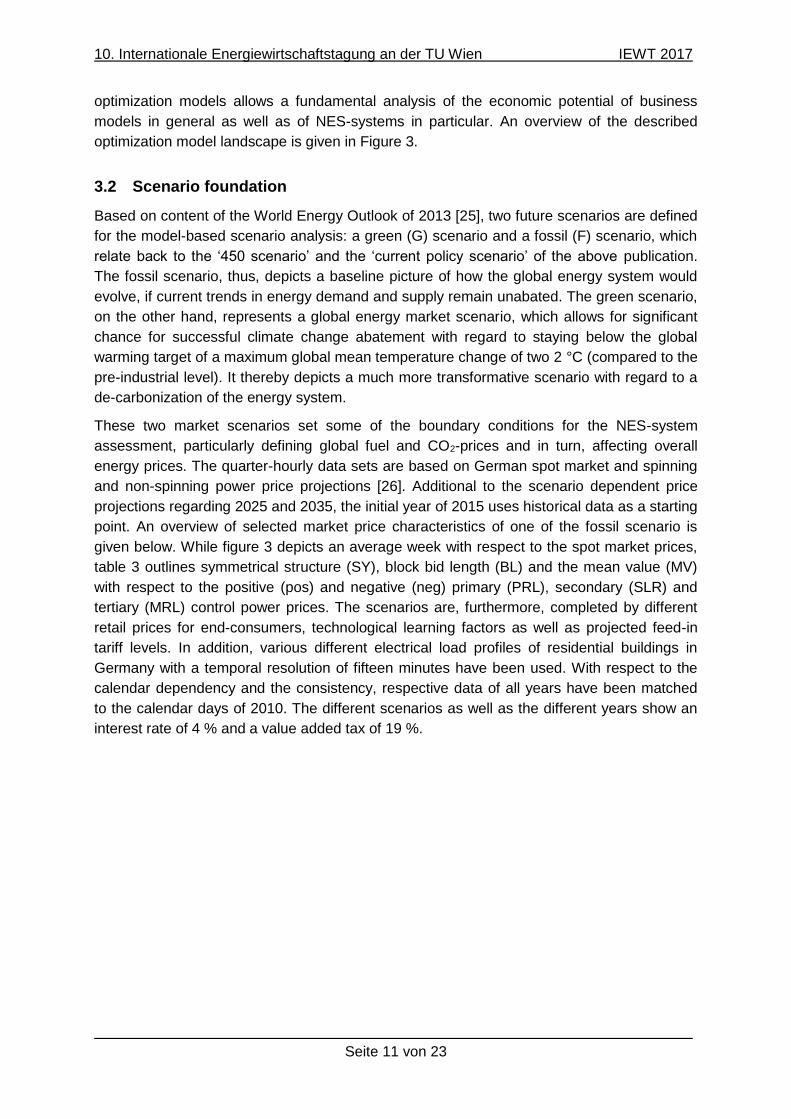
These two market scenarios set some of the boundary conditions for the NES-system
assessment, particularly defining global fuel and CO2-prices and in turn, affecting overall
energy prices. The quarter-hourly data sets are based on German spot market and spinning
and non-spinning power price projections [26]. Additional to the scenario dependent price
projections regarding 2025 and 2035, the initial year of 2015 uses historical data as a starting
point. An overview of selected market price characteristics of one of the fossil scenario is
given below. While figure 3 depicts an average week with respect to the spot market prices,
table 3 outlines symmetrical structure (SY), block bid length (BL) and the mean value (MV)
with respect to the positive (pos) and negative (neg) primary (PRL), secondary (SLR) and
tertiary (MRL) control power prices. The scenarios are, furthermore, completed by different
retail prices for end-consumers, technological learning factors as well as projected feed-in
tariff levels. In addition, various different electrical load profiles of residential buildings in
Germany with a temporal resolution of fifteen minutes have been used. With respect to the
calendar dependency and the consistency, respective data of all years have been matched
to the calendar days of 2010. The different scenarios as well as the different years show an
interest rate of 4 % and a value added tax of 19 %.
10. Internationale Energiewirtschaftstagung an der TU Wien IEWT 2017
Seite 12 von 23
0
10
20
30
40
50
60
70
80
90€/M
Wh
2015
2025
2035
Figure 3: Average week of the spot market prices for 2015, 2025 and 2035 of the fossil scenario [26]
Next to that, the customer base includes ten residential prosumers. The prosumers
demonstrate slightly differing electrical load profiles with respective valleys and peaks. The
load profiles are based on the temporal highly resolved residential profile set of HTW Berlin
[27] and have been integrated from one-minute time steps to fifteen-minute time steps. The
average energy consumption of a prosumer per year has been fixed to 3.800 kWh. Next to
that, every single prosumer is equipped with a similar PY-system and connected to the NES-
system. Every single household can consume or store energy as qualitatively described in
chapter 2.
Table 3: Spot- and reserve market price characteristics of the fossil scenario [26]
2015 2025 2035
SY
[-]
BL
[h]
MV
[€/MW p.h.]
SY
[-]
BL
[h]
MV
[€/MW p.h.]
SY
[-]
BL
[h]
MV
[€/MW p.h.]
PRL
pos YES 24 21,7703 NO 4 2,1256 NO 4 0,3059
PRL
neg YES 24 21,7703 NO 4 0,1184 NO 4 0,2014
SRL
pos NO 4 2,9274 NO 1 4,5984 NO 1 1,0639
SRL
neg NO 4 1,3316 NO 1 0,0141 NO 1 3,0E-05
TER
pos NO 4 0,5746 NO 1 0,1408 NO 1 0,4511
TER
neg NO 4 1,7865 NO 1 0,0107 NO 1 1,1E-06
With respect to the tariff scheme, a subdivision into flat and variable tariffs has been applied.
The grid electricity flat tariff in the 2015 scenario is given by historical data. For every time
step in 2015, the customer pays 28.81 Ct/kWh proportionally to sales side, grid side and
political side. To derive a variable tariff for 2015, the cost component ‘sales’ was
10. Internationale Energiewirtschaftstagung an der TU Wien IEWT 2017
Seite 13 von 23
deconstructed into the spot market price and the utility margin. Given the average spot
market price in 2015 of 3.16 Ct/kWh, the remaining 3.96 Ct/kWh of the ‘sales’ cost
component is assumed to be the utility margin. The variable tariff thus consists of the spot
market price of this point in time and the fixed margin of 3.96 Ct/kWh. The flat and variable
tariff for the projected green and fossil scenarios has been determined in the same way.
While the ‘grid’ and ‘political’ components have been kept constant, the ‘sales’ component
has been derived with the projected spot market prices. This is largely consistent with BMWi
[28] and in the range of projections by Öko-Institut [29].
The feed-in remuneration is fixed for 20 years, while the time of initial operation determines
the respective level of feed-in remuneration. A growing customer base results in new
customers starting their initial operation at different years with respective feed-in tariffs. In
this context, it is assumed that every year the same amount of customers adopts the NES-
system to reflect a customer growth dynamic. This leads to different feed-in tariffs (FIT) with
respect to the individual NES-system participants. Since this research concentrates on
average costs and profits, this will be harmonized among the whole customer group by
taking the weighted average of respective year-dependent feed-in tariff and year-dependent
customers starting initial PV-system operation. The values of projected PV-based feed-in
remuneration in 2035 are extracted from Agora Energiewende [30], while the values for the
year 2025 were linearly interpolated.
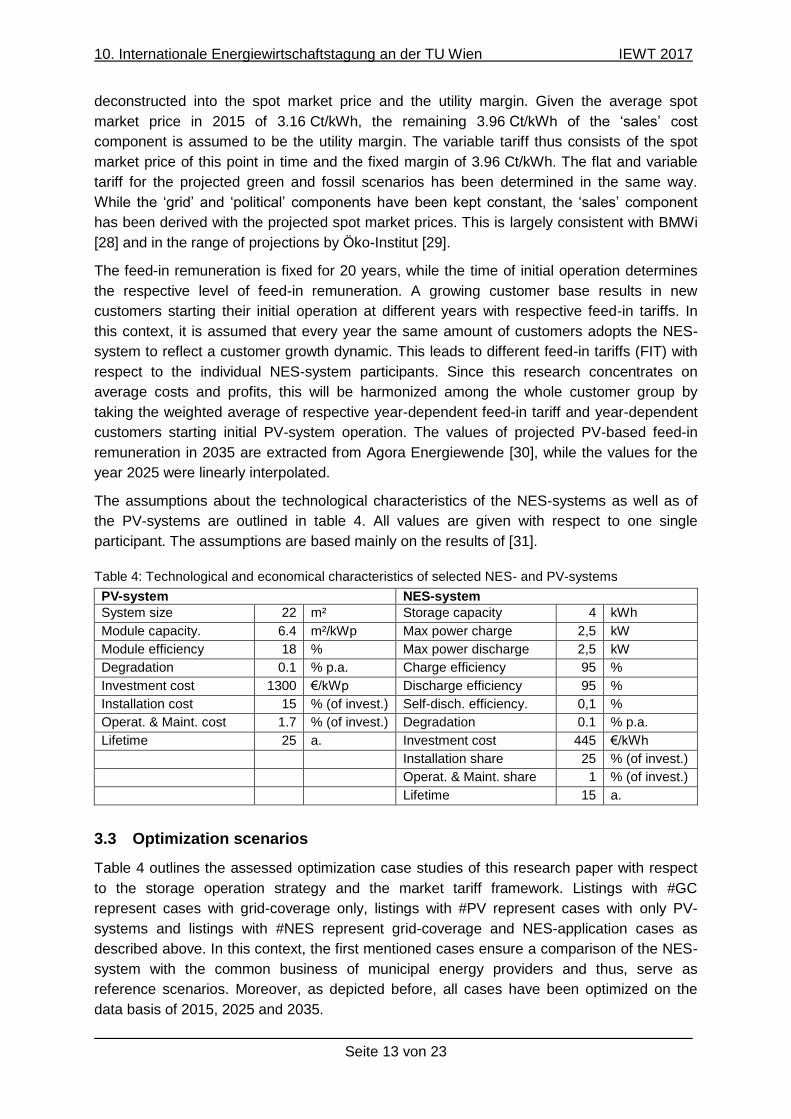
The assumptions about the technological characteristics of the NES-systems as well as of
the PV-systems are outlined in table 4. All values are given with respect to one single
participant. The assumptions are based mainly on the results of [31].
Table 4: Technological and economical characteristics of selected NES- and PV-systems
PV-system NES-system System size 22 m² Storage capacity 4 kWh
Module capacity. 6.4 m²/kWp Max power charge 2,5 kW
Module efficiency 18 % Max power discharge 2,5 kW
Degradation 0.1 % p.a. Charge efficiency 95 %
Investment cost 1300 €/kWp Discharge efficiency 95 %
Installation cost 15 % (of invest.) Self-disch. efficiency. 0,1 %
Operat. & Maint. cost 1.7 % (of invest.) Degradation 0.1 % p.a.
Lifetime 25 a. Investment cost 445 €/kWh
Installation share 25 % (of invest.)
Operat. & Maint. share 1 % (of invest.)
Lifetime 15 a.
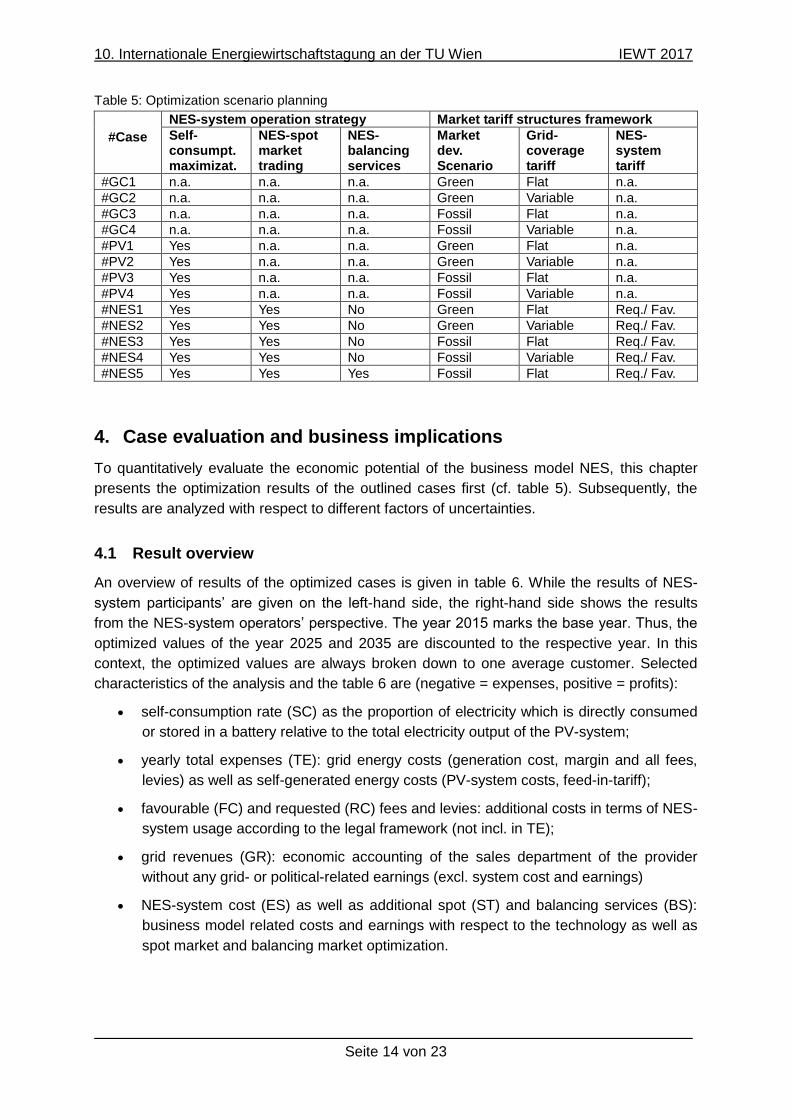
3.3 Optimization scenarios
Table 4 outlines the assessed optimization case studies of this research paper with respect
to the storage operation strategy and the market tariff framework. Listings with #GC
represent cases with grid-coverage only, listings with #PV represent cases with only PV-
systems and listings with #NES represent grid-coverage and NES-application cases as
described above. In this context, the first mentioned cases ensure a comparison of the NES-
system with the common business of municipal energy providers and thus, serve as
reference scenarios. Moreover, as depicted before, all cases have been optimized on the
data basis of 2015, 2025 and 2035.
10. Internationale Energiewirtschaftstagung an der TU Wien IEWT 2017
Seite 14 von 23
Table 5: Optimization scenario planning
#Case
NES-system operation strategy Market tariff structures framework Self-consumpt. maximizat.
NES-spot market trading
NES-balancing services
Market dev. Scenario
Grid-coverage tariff
NES-system tariff
#GC1 n.a. n.a. n.a. Green Flat n.a. #GC2 n.a. n.a. n.a. Green Variable n.a. #GC3 n.a. n.a. n.a. Fossil Flat n.a. #GC4 n.a. n.a. n.a. Fossil Variable n.a. #PV1 Yes n.a. n.a. Green Flat n.a. #PV2 Yes n.a. n.a. Green Variable n.a. #PV3 Yes n.a. n.a. Fossil Flat n.a. #PV4 Yes n.a. n.a. Fossil Variable n.a. #NES1 Yes Yes No Green Flat Req./ Fav. #NES2 Yes Yes No Green Variable Req./ Fav. #NES3 Yes Yes No Fossil Flat Req./ Fav. #NES4 Yes Yes No Fossil Variable Req./ Fav. #NES5 Yes Yes Yes Fossil Flat Req./ Fav.
4. Case evaluation and business implications
To quantitatively evaluate the economic potential of the business model NES, this chapter
presents the optimization results of the outlined cases first (cf. table 5). Subsequently, the
results are analyzed with respect to different factors of uncertainties.
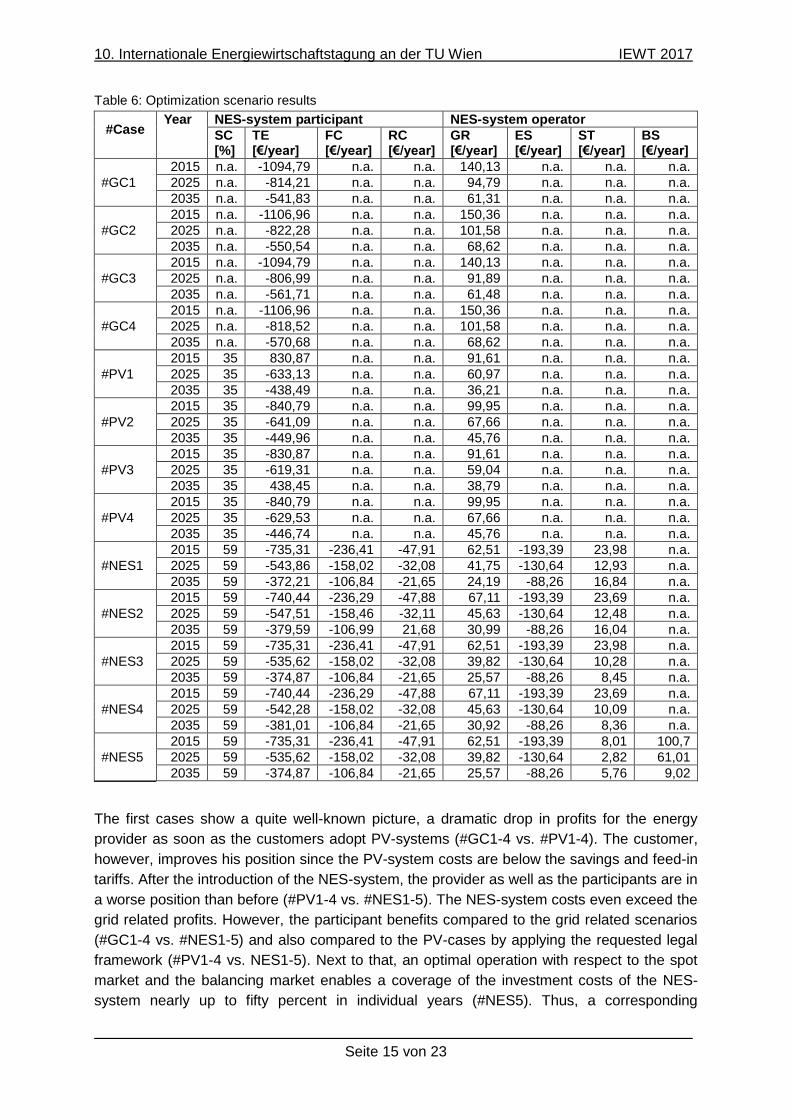
4.1 Result overview
An overview of results of the optimized cases is given in table 6. While the results of NES-
system participants’ are given on the left-hand side, the right-hand side shows the results
from the NES-system operators’ perspective. The year 2015 marks the base year. Thus, the
optimized values of the year 2025 and 2035 are discounted to the respective year. In this
context, the optimized values are always broken down to one average customer. Selected
characteristics of the analysis and the table 6 are (negative = expenses, positive = profits):
self-consumption rate (SC) as the proportion of electricity which is directly consumed
or stored in a battery relative to the total electricity output of the PV-system;
yearly total expenses (TE): grid energy costs (generation cost, margin and all fees,
levies) as well as self-generated energy costs (PV-system costs, feed-in-tariff);
favourable (FC) and requested (RC) fees and levies: additional costs in terms of NES-
system usage according to the legal framework (not incl. in TE);
grid revenues (GR): economic accounting of the sales department of the provider
without any grid- or political-related earnings (excl. system cost and earnings)
NES-system cost (ES) as well as additional spot (ST) and balancing services (BS):
business model related costs and earnings with respect to the technology as well as
spot market and balancing market optimization.
10. Internationale Energiewirtschaftstagung an der TU Wien IEWT 2017
Seite 15 von 23
Table 6: Optimization scenario results
#Case Year NES-system participant NES-system operator
SC [%]
TE [€/year]
FC [€/year]
RC [€/year]
GR [€/year]
ES [€/year]
ST [€/year]
BS [€/year]
#GC1
2015 n.a. -1094,79 n.a. n.a. 140,13 n.a. n.a. n.a.
2025 n.a. -814,21 n.a. n.a. 94,79 n.a. n.a. n.a.
2035 n.a. -541,83 n.a. n.a. 61,31 n.a. n.a. n.a.
#GC2
2015 n.a. -1106,96 n.a. n.a. 150,36 n.a. n.a. n.a.
2025 n.a. -822,28 n.a. n.a. 101,58 n.a. n.a. n.a.
2035 n.a. -550,54 n.a. n.a. 68,62 n.a. n.a. n.a.
#GC3
2015 n.a. -1094,79 n.a. n.a. 140,13 n.a. n.a. n.a.
2025 n.a. -806,99 n.a. n.a. 91,89 n.a. n.a. n.a.
2035 n.a. -561,71 n.a. n.a. 61,48 n.a. n.a. n.a.
#GC4
2015 n.a. -1106,96 n.a. n.a. 150,36 n.a. n.a. n.a.
2025 n.a. -818,52 n.a. n.a. 101,58 n.a. n.a. n.a.
2035 n.a. -570,68 n.a. n.a. 68,62 n.a. n.a. n.a.
#PV1
2015 35 830,87 n.a. n.a. 91,61 n.a. n.a. n.a.
2025 35 -633,13 n.a. n.a. 60,97 n.a. n.a. n.a.
2035 35 -438,49 n.a. n.a. 36,21 n.a. n.a. n.a.
#PV2
2015 35 -840,79 n.a. n.a. 99,95 n.a. n.a. n.a.
2025 35 -641,09 n.a. n.a. 67,66 n.a. n.a. n.a.
2035 35 -449,96 n.a. n.a. 45,76 n.a. n.a. n.a.
#PV3
2015 35 -830,87 n.a. n.a. 91,61 n.a. n.a. n.a.
2025 35 -619,31 n.a. n.a. 59,04 n.a. n.a. n.a.
2035 35 438,45 n.a. n.a. 38,79 n.a. n.a. n.a.
#PV4
2015 35 -840,79 n.a. n.a. 99,95 n.a. n.a. n.a.
2025 35 -629,53 n.a. n.a. 67,66 n.a. n.a. n.a.
2035 35 -446,74 n.a. n.a. 45,76 n.a. n.a. n.a.
#NES1
2015 59 -735,31 -236,41 -47,91 62,51 -193,39 23,98 n.a.
2025 59 -543,86 -158,02 -32,08 41,75 -130,64 12,93 n.a.
2035 59 -372,21 -106,84 -21,65 24,19 -88,26 16,84 n.a.
#NES2
2015 59 -740,44 -236,29 -47,88 67,11 -193,39 23,69 n.a.
2025 59 -547,51 -158,46 -32,11 45,63 -130,64 12,48 n.a.
2035 59 -379,59 -106,99 21,68 30,99 -88,26 16,04 n.a.
#NES3
2015 59 -735,31 -236,41 -47,91 62,51 -193,39 23,98 n.a.
2025 59 -535,62 -158,02 -32,08 39,82 -130,64 10,28 n.a.
2035 59 -374,87 -106,84 -21,65 25,57 -88,26 8,45 n.a.
#NES4
2015 59 -740,44 -236,29 -47,88 67,11 -193,39 23,69 n.a.
2025 59 -542,28 -158,02 -32,08 45,63 -130,64 10,09 n.a.
2035 59 -381,01 -106,84 -21,65 30,92 -88,26 8,36 n.a.
#NES5
2015 59 -735,31 -236,41 -47,91 62,51 -193,39 8,01 100,7
2025 59 -535,62 -158,02 -32,08 39,82 -130,64 2,82 61,01
2035 59 -374,87 -106,84 -21,65 25,57 -88,26 5,76 9,02
The first cases show a quite well-known picture, a dramatic drop in profits for the energy
provider as soon as the customers adopt PV-systems (#GC1-4 vs. #PV1-4). The customer,
however, improves his position since the PV-system costs are below the savings and feed-in
tariffs. After the introduction of the NES-system, the provider as well as the participants are in
a worse position than before (#PV1-4 vs. #NES1-5). The NES-system costs even exceed the
grid related profits. However, the participant benefits compared to the grid related scenarios
(#GC1-4 vs. #NES1-5) and also compared to the PV-cases by applying the requested legal
framework (#PV1-4 vs. NES1-5). Next to that, an optimal operation with respect to the spot
market and the balancing market enables a coverage of the investment costs of the NES-
system nearly up to fifty percent in individual years (#NES5). Thus, a corresponding

10. Internationale Energiewirtschaftstagung an der TU Wien IEWT 2017
Seite 16 von 23
allocation of the costs between the operator and the participants as well as an optimal
operation might lead to a sustainable and economic business model of local municipalities.
Nonetheless, an economic success is only possible by taking into account the social,
technical and environmental advantages. Selected issues are presented below.
4.2 Market development
Two future scenarios have been implemented: a green scenario and a fossil scenario. In
terms of all of the optimized cases, the effect of the different scenarios is almost negligible.
While the green scenario is slightly more expensive compared to the fossil scenario in year
2025, the fossil scenario is slightly more expensive than the green scenario in year 2035
(#NES1 vs. #NES3). This can be attributed to the spot market price projections. In this
context, one assumes that in the medium-term the average spot prices of a fossil scenario
are lower than the average spot prices of a green scenario. In the long-term it is exactly the
other way round. Worth mentioning is, that the customer is even in a slightly better position
although the feed-in remuneration is lower in the green scenario compared to the fossil
scenario. Next to that, a green scenario might demonstrate a steeper fall of battery storage
system prices. Since the investment costs account for a large share of the economic
feasibility of the business model the market development might play a more decisive role
than initially recognizable.
4.3 Pricing policy
As can be seen in #GC1 vs. #GC2, given the same average annual electricity consumption,
a variable tariff scheme always leads to slightly higher annual household costs. This is not
surprising, since the variable tariff directly passes on spot market price fluctuations to the
end-consumer. With their conventional demand pattern, the end-consumers in all scenarios
have their peak demand in times with higher prices (due to an overall peak demand). Since
they cannot adapt their consumption pattern in this setting, they face higher costs in this
research. An equivalent effect can be observed for the annual utility profit.
The NES-model in this research is not really affected. The participants are only allowed to
store renewable energy into the NES-system (#NES1-5). A completely different picture might
arise if the participants are also allowed to charge grid energy to the NES-system.
4.4 Trading revenues
Additional revenue streams can increase the profitability of the NES-system for the operator
as well as for the participant. Especially spot market trading as well as balancing market
services demonstrate a promising approach. The question is to what extent the extra income
can cover the investment costs. In this context, this research takes two possibilities into
account: spot market trading only as well as joint spot and balancing market optimization. At
a first glance, the results reveal a sobering result. The trading benefits of spot market trading
only cover around 10% of the investment costs today (#NES1). However, they increase to
18% in 2035. Moreover, by joint spot market and balancing market optimization a much
higher share of up to 50% is reachable (#NES5). Since it is assumable that the control power
prices are higher in the green scenario, the market revenues could even be greater.
10. Internationale Energiewirtschaftstagung an der TU Wien IEWT 2017
Seite 17 von 23
4.5 Legal provisions
The legal framework also plays an important role with respect to the economic feasibility.
Compared with the reference #PV cases, a single customer would even benefit of a NES-
system by applying the requested legal framework. While the system participant has total
costs of 830,87 € to cover his demand in case #PV1 in the year 2015, he only has total costs
of 782,51 € (735,31 € + 47,91 €) in case #NES1 in the year 2015. In this context, the
participant could bear a certain amount of investment costs without having any serious
disadvantages. In this context, in case #NES5 nearly all of the investment cost could be
covered by market revenues of the provider and savings of the customer. On the same time,
by applying the favourable framework the customer is in a slightly poorer position compared
to the #PV cases. Thus, a legal rethink with respect to batteries in general and NES-systems
in particular demonstrate a crucial aspect for the economic feasibility.
4.6 Capacity utilization
Due to varying load profiles, the optimal capacity of an NES can be smaller than the
aggregated capacities of all individual household storage systems. This reduction might
translate into lower specific investment costs and lower material use. To get first insights into
the proper dimensioning of the NES-system, it is helpful to identify the amount of time steps
in which the state of charge (SOC) of the storage system is higher than a certain percentage.
For this purpose, the optimization results of #NES5 have been selected for in-depth analysis.
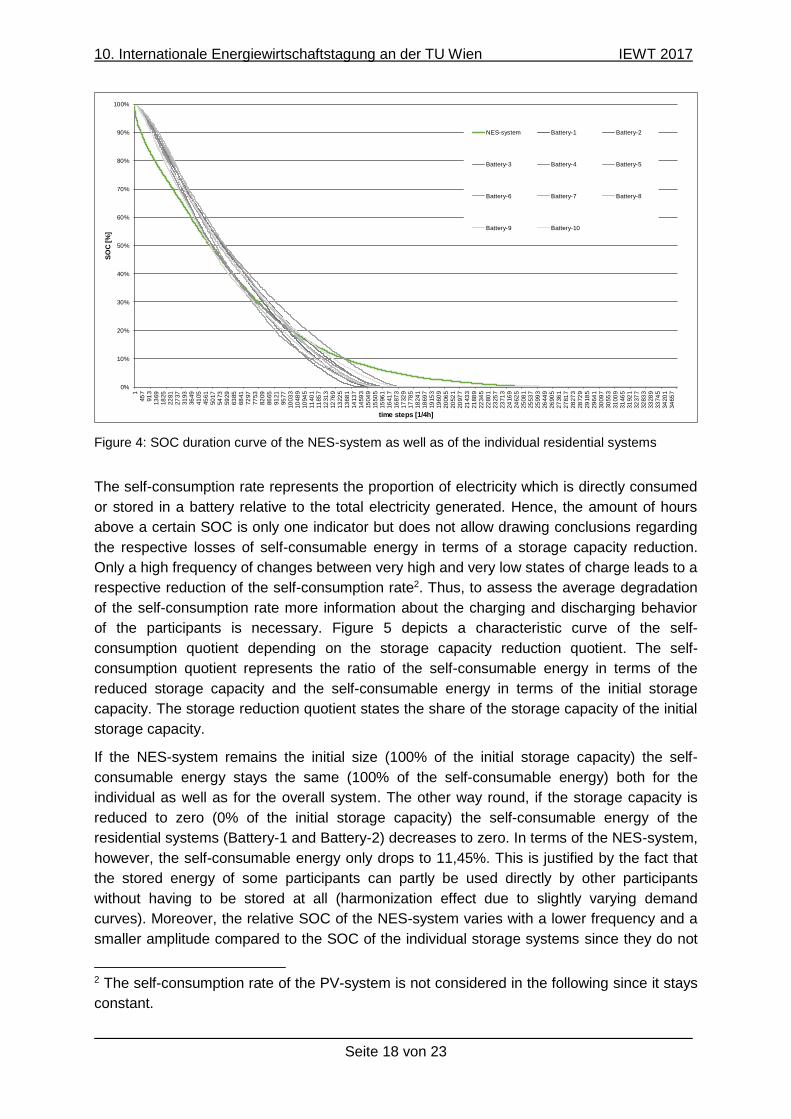
Figure 4 displays the sorted annual SOC duration curve of the NES-system and of the
individual residential storage systems. In this context, the sorted annual SOC duration curve
illustrates the variation of the SOC of the batteries in a downward form such that the greatest
SOC is plotted in the left and the smallest one in the right.
It is visible that the SOC duration curve for the NES-system is steeper at the beginning and
more flat at the end than the SOC duration curves of the individual residential storage
systems. In concrete terms, while the large system only possesses a SOC equal or greater
than 90% (around 400 quarter-hourly time steps) less than one weak of the year the smaller
systems possess a SOC of equal or greater than 90% around two weeks of the year. Thus, a
potential reduction of the NES-system does not have to result in an equivalent utilization
restriction. Nonetheless, individual participants would be placed in a slightly less favourable
position regarding the self-consumption rate in the case of a reduction than before. On the
same time, also a moderate storage reduction could have an impact on potential trading
profits. Thus, to identify an optimal economic solution a more detailed analysis is necessary.
10. Internationale Energiewirtschaftstagung an der TU Wien IEWT 2017
Seite 18 von 23
0%
10%
20%
30%
40%
50%
60%
70%
80%
90%
100%
145
791
313
69
18
25
22
81
27
37
31
93
36
49
41
05
45
61
50
17
54
73
59
29
63
85
68
41
72
97
77
53
82
09
86
65
91
21
95
77
10
03
310
48
910
94
511
40
111
85
712
31
312
76
913
22
513
68
114
13
714
59
315
04
915
50
515
96
116
41
716
87
317
32
917
78
518
24
118
69
719
15
319
60
920
06
520
52
120
97
721
43
321
88
922
34
522
80
123
25
723
71
324
16
924
62
525
08
125
53
725
99
326
44
926
90
527
36
127
81
728
27
328
72
929
18
529
64
130
09
730
55
331
00
931
46
531
92
132
37
732
83
333
28
933
74
534
20
134
65
7
SO
C [%
]
time steps [1/4h]
NES-system Battery-1 Battery-2
Battery-3 Battery-4 Battery-5
Battery-6 Battery-7 Battery-8
Battery-9 Battery-10
Figure 4: SOC duration curve of the NES-system as well as of the individual residential systems
The self-consumption rate represents the proportion of electricity which is directly consumed
or stored in a battery relative to the total electricity generated. Hence, the amount of hours
above a certain SOC is only one indicator but does not allow drawing conclusions regarding
the respective losses of self-consumable energy in terms of a storage capacity reduction.
Only a high frequency of changes between very high and very low states of charge leads to a
respective reduction of the self-consumption rate2. Thus, to assess the average degradation
of the self-consumption rate more information about the charging and discharging behavior
of the participants is necessary. Figure 5 depicts a characteristic curve of the self-
consumption quotient depending on the storage capacity reduction quotient. The self-
consumption quotient represents the ratio of the self-consumable energy in terms of the
reduced storage capacity and the self-consumable energy in terms of the initial storage
capacity. The storage reduction quotient states the share of the storage capacity of the initial
storage capacity.
If the NES-system remains the initial size (100% of the initial storage capacity) the self-
consumable energy stays the same (100% of the self-consumable energy) both for the
individual as well as for the overall system. The other way round, if the storage capacity is
reduced to zero (0% of the initial storage capacity) the self-consumable energy of the
residential systems (Battery-1 and Battery-2) decreases to zero. In terms of the NES-system,
however, the self-consumable energy only drops to 11,45%. This is justified by the fact that
the stored energy of some participants can partly be used directly by other participants
without having to be stored at all (harmonization effect due to slightly varying demand
curves). Moreover, the relative SOC of the NES-system varies with a lower frequency and a
smaller amplitude compared to the SOC of the individual storage systems since they do not
2 The self-consumption rate of the PV-system is not considered in the following since it stays
constant.

10. Internationale Energiewirtschaftstagung an der TU Wien IEWT 2017
Seite 19 von 23
vary synchronously. These two aspects lead to the fact, that the self-consumption as a
percentage falls considerably more sharply in terms of a capacity reduction of the individual
storage system compared with the overall system. Thus, in contrast to individual systems a
moderate NES-system reduction has a far slighter effect on the customer benefit regarding
self-consumption. In concrete terms, a reduction of 20% of the storage capacity results in
only a restriction of the enabled self-consumable energy of the NES-system (-5,74 %) half
the rate of individual storage systems (-12,08 %). Thus, if a NES-system operator wants to
implement an energy tariff regarding the discharging of the system it is necessary to identify
the optimal economic solution between the revenue regarding customer related discharging
and the savings regarding the system related investment costs.
Figure 5: Characteristic curve of the storage reduction quotient and the self-consumption quotient
4.7 Business implications
The results of the optimization cases (#GC1-4 vs. #PV1-4) demonstrate the necessity of new
business models for energy utilities. Regional and municipal utilities are predestined to take
an active role in shaping the energy transition, due to their decentralization, their customer
relation and interrelation in local politics and administration. In terms of green market
development NES-systems display one economic feasible opportunity, if they are optimally
designed and operated (#NES5). Based on the municipal conditions and in cooperation with
the neighborhood, a NES-system operator needs to find appropriate configurations (#NES1-
5) to following key issues to develop a successful business model:
Operation strategy: self-consumption vs. system-welfare,
Demand behavior: grid tariff vs. feed-in tariff,
Storage sizing: investment cost vs. trading profits,
10. Internationale Energiewirtschaftstagung an der TU Wien IEWT 2017
Seite 20 von 23
Capacity reduction: investment savings vs. customer payments,
Legal dependency: public grid vs. private grid,
Customer expenses: variable expenses vs. fix expenses.
5. Research summary and future work
The future of the legal framework and regulations for NES-systems remain uncertain. As of
now, the legal definition of electrical storages is still deficient and comprises additional
financial burdens which reflect neither their current role nor their potential in the future energy
system. Furthermore, the electricity tax exemption in the spatial context of generating and
storing electricity remains uncertain, as there is no clear definition of spatial proximity in § 9
StromStG. Nevertheless, taking into account the requested legal framework (as well as the
current trends (decreasing technology costs, decreasing feed-in tariffs, higher grid electricity
prices), the business model of NES-systems might become more and more economically
viable. Next to that, it possesses different beneficial opportunities in comparison to residential
storage systems and comprises additional revenues on the basis of an optimal utilization.
However, as discussed different possibilities might also have a drawback with respect to the
consumer or the operator.
While this work gives a first insight of the optimal NES-system operation in general, future
work needs to evaluate different cases in more detail especially with respect to the balancing
market. Furthermore, future work should focus on the right sizing of the NES-system in
particular. On the one hand, the effect of higher or lower system capacities as well as the
nominal charging and discharging power needs to be investigated. On the other hand, the
reduction opportunities need to be analyzed with respect to investment savings but also with
respect to trading losses. The point of intersection between optimal marketing strategy and
investment costs must be determined. Doing this, for robust results, the future research
should include multi-energy carrier (e.g. system fit in terms of a heat pump roll-out) and a
more diverse consumer structure (e.g. system fit within a neighborhood of commercial and
residential consumers).
10. Internationale Energiewirtschaftstagung an der TU Wien IEWT 2017
Seite 21 von 23
Literature
[1] Malhotra, A.; Battke, B.; Beuse, B.; Stephan, A; Schmidt, T. (2016): Use cases for
stationary battery technologies: A review of the literature and existing projects,
Renewable and Sustainable Energy Reviews, Vol. 56, pp. 705-721,
http://dx.doi.org/10.1016/j.rser.2015.11.085.
[2] BDEW (Ed.) (2014): Definition des Begriffes "Energiespeicher". Begriffsdefinition und
Vorschlag fur eine Befreiung von Letztverbraucherabgaben. Bundesverband der
Energie- und Wasserwirtschaft e.V. (BDEW), online:
https://www.bdew.de/internet.nsf/id/20140606-o-definition-des-begriffes-
energiespeicher-de/$file/2014-06-06_Definition_Energiespeicher_final_ohne-
Ansprechpartner.pdf/, checked on 4/11/2016.
[3] Gaudchau, E.; Resch, M.; Zeh, A. (2016): Quartierspeicher: Definition, rechtlicher
Rahmen und Perspektiven, Ökologisches Wirtschaften, Vol. 31, pp. 26-27.
[4] Edelmann, H. (2014): Nachhaltige Geschäftsmodelle für Stadtwerke und EVU.
Stadtwerkestudie, online:
http://www.ey.com/Publication/vwLUAssets/Stadtwerkestudie_2014_-
_Management_Summary/$FILE/EY-Stadtwerkestudie-2014-Summary.pdf, checked on
11/4/2015.
[5] Edelmann, H. (2015): Gewohnte Wege verlassen. Innovation in der Energiewirtschaft.
Stadtwerkestudie, online: https://www.bdew.de/internet.nsf/id/20150819-pi-neue-
stadtwerkestudie-von-ey-und-bdew-de/$file/Stadtwerkestudie_2015.pdf, checked on
11/4/2015.
[6] Speicher-Bar (2016): EEG 2017 – Chance für Energiespeicher genutzt? BVES ist
enttäuscht. Interview mit BVES-Referentin Helena Teschner, online:
https://www.speicher-bar.de/eeg-2017-chance-fuer-energiespeicher-genutzt-bves-ist-
enttaeuscht/, checked on 12/12/2016.
[7] BVES (2016): BVES meldet Erfolg im EEG 2017: Keine Belastung mit EEG-Umlage bei
gemischtem Speicherbetrieb, Pressemeldung vom 16.12.2016, online:
http://www.bves.de/bves-meldet-erfolg-im-eeg-2017-keine-belastung-mit-eeg-umlage-
bei-gemischtem-speicherbetrieb, checked on 18/12/2016.
[8] Bourwieg, K. (2015): Eine regulatorische Einordnung von Stromspeichern im aktuellen
Rechtsrahmen, presentation BMWi Plattform Netze – AG Flexibilität Berlin, 20. Januar
2015 Available online: https://www.bmwi.de/BMWi/Redaktion/PDF/A/ag-2-plattform-
strommarkt-sitzung-20150120-praesentation-
1,property=pdf,bereich=bmwi2012,sprache=de,rwb=true.pdf, checked on 4/11/2016.
[9] BVES (2016): Positionspapier zu den regulatorischen Rahmenbedingungen fur Speicher
im Rahmen des Forschungsprojektes Strombank. Edited by Bundesverband
Energiespeicher e.V. (BVES).
[10] Sailer, F. (2014): Rechtliche Rahmenbedingungen für Speicher im Kontext eines
flexiblen Stromsystems, presentation BMWi Plattform Netze - AG Flexibilität der
Plattform Strommarkt, Berlin, 20. Januar 2015, online: http://stiftung-
10. Internationale Energiewirtschaftstagung an der TU Wien IEWT 2017
Seite 22 von 23
umweltenergierecht.de/fileadmin/pdf_aushaenge/SAILER_Speicher_Flexibilitaet.pdf,
checked on 5/12/2016.
[11] iCES (2016): Zusammenfassung der Arbeitsgruppe 3: Aktuelle Projekte und
Fragestellungen für den Speichermarkt der Zukunft, online: http://reiner-lemoine-
institut.de/wp-content/uploads/2016/02/iCES_Gruppe_3.pdf, checked on 18/12/2016.
[12] Schäffler, H. (2015): Geringere Investitionskosten, höherer Wirkungsgrad, ZfK Zeitung
für kommunale Wirtschaft, Vol. 11, 2015. (s. auch solbat
http://www.solbat.de/blog/quartierspeicher-effizienter-als-heimspeicher/), checked on
4/11/2016.
[13] IBC SOLAR Blog (2015): Das Photovoltaik-Dorf Epplas hat jetzt einen Speicher für
Sonnenstrom, online: https://www.ibc-blog.de/2015/05/das-photovoltaik-dorf-epplas-hat-
jetzt-einen-speicher-fuer-sonnenstrom, checked on 4/11/2016.
[14] Kairies, K.-P.; Magnor, D.; Sauer, D.U. (2015): Scientific Measuring and Evaluation
Program for Photovoltaic Battery Systems(WMEP PV-Speicher), Energy Procedia, Vol.
73, pp. 200-207, http://dx.doi.org/10.1016/j.egypro.2015.07.672.
[15] Sieg, M. (2015): Ein Konto fur Solarstrom. pv magazine, online: http://www.pv-
magazine.de/nachrichten/details/beitrag/ein-konto-fr- solarstrom_100019430/, checked
on 4/11/2016.
[16] Kühl, A. (2016): Quartierspeicher können zur Zukunft der dezentralen Energiewende
werden http://www.energynet.de/2016/05/20/quartierspeicher-dezentrale-
energiewende/, checked on 16/11/2016.
[17] Thomann, R.; Schubert, M.; Pickford, G.; Natour, A. (2016): Projekt Strombank,
Zwischenbericht anlässlich des Statuskolloquiums Umweltforschung Baden-
Württemberg 2016 am 3. und 4. Februar 2016 im Haus der Wirtschaft, Karlsruhe.
[18] Poyry Management Consulting (2016): Primarregelleistung durch Batteriespeicher:
Preisverfall erhoht Investitionsunsicherheit. pv magazine, online: http://www.pv-
magazine.de/unternehmensmeldungen/details/beitrag/primrregelleistung-durch-
batteriespeicher--preisverfall-erhht-investitionsunsicherheit_100021761/, checked on
4/12/2016.
[19] Hiremath, M.; Derendorf, K.; Vogt, T. (2015): Comparative Life Cycle Assessment of
Battery Storage Systems for Stationary Applications, Environmental Science &
Technology Vol. 49, Issue 8, pp. 4825-33.
[20] Scheller, F.; Burgenmeister, B.; Wellnitz, P.; Kondziella, H.; Bruckner, T. (2016):
Geschäftsmodellanalyse kommunaler Energieversorger im liberalisierten Energiemarkt -
Problemformulierung und Modellentwicklung, 14. Symposium Energieinnovation, Graz,
Austria.
[21] Morrison, R.; Wittmann, T.; Bruckner, T. (2004): Energy Sustainability through
Representative Large-Scale Simulation: The Logical and Physical Design of xeona,
Proceedings of the International Conference on Sustainability Engineering and Science
(ICSES), Auckland, New Zealand.
10. Internationale Energiewirtschaftstagung an der TU Wien IEWT 2017
Seite 23 von 23
[22] Morrison, R.; Wittmann, T.; Heise, J.; Bruckner, T. (2005): Policy-oriented Energy
System Modeling with 'xeona', Proceedings of ECOS 2005, 18th International
Conference on Efficiency, Cost, Optimization, Simulation and Environmental Impact of
Energy Systems “Shaping our Future Energy Systems”, Trondheim, Norway.
[23] Böttger, D., Götz, M.; Theofilidi, M; Bruckner, T. (2015): Control power provision with
power-to-heat plants in systems with high shares of renewable energy sources - An
illustrative analysis for Germany based on the use of electric boilers in district heating
grids.Energy, Vol. 82, pp. 157-167. DOI: 10.1016/j.energy.2015.01.022.
[24] Böttger, D.; Bruckner, T. (2015): Market design improvements in the German balancing
power market – A fundamental model analysis, 10th Conference on Energy Economics
and Technology “Sustainable Energy Security”, Dresden.
[25] IEA (2013): World energy outlook 2013. International Energy Agency (World Energy
Outlook), Paris, online:
http://www.iea.org/publications/freepublications/publication/WEO2013.pdf, checked on
6/24/2016.
[26] Götz, M. (2015): Langfristszenarien für den Day-Ahead Spotmarkt und Leistungspreise
für Regelenergie, Fraunhofer-Zentrum für Internationales Management und
Wissensökonomie (IMW), (unpublished).
[27] Hochschule für Technik und Wirtschaft HTW Berlin (2015): „Reprasentative elektrische
Lastprofile für Einfamilienhäuser in Deutschland auf 1-sekündiger Datenbasis“,
Datensatz, Berlin.
[28] BMWi (Ed.) (2014): Entwicklung der Energiemärkte - Energiereferenzprognose. Prognos
AG; Energiewirtschaftliches Institut an der Universität zu Köln (EWI); Gesellschaft für
Wirtschaftliche Strukturforschung mbH (gws) (Projekt Nr. 57/12), online:
http://www.bmwi.de/BMWi/Redaktion/PDF/Publikationen/entwicklung-der-
energiemaerkte-energiereferenzprognose-
endbericht,property=pdf,bereich=bmwi2012,sprache=de,rwb=true.pdf, checked on
7/16/2016.
[29] Öko-Institut (2015): Die Entwicklung der EEG-Kosten bis 2035. Wie der Erneuerbaren-
Ausbau entlang der langfristigen Ziele der Energiewende wirkt. Agora Energiewende,
online: https://www.agora-energiewende.de/fileadmin/Projekte/2015/EEG-Kosten-bis-
2035/Agora_EEG_Kosten_2035_web_05052015.pdf, checked on 7/16/2016.
[30] Agora Energiewende (Ed.) (2016): Online EEG-Rechner, online: https://www.agora-
energiewende.de/de/themen/-agothem-/Produkt/produkt/130/Online+EEG-Rechner/,
checked on 8/15/2016.
[31] Beck, T.; Kondziella, H.; Huard, G.; Bruckner, T. (2017): Optimal operation,
configuration and sizing of generation and storage technologies for residential heat
pump systems in the spotlight of self-consumption of photovoltaic electricity, Applied
Energy, Vol. 188, pp. 604-619, http://dx.doi.org/10.1016/j.apenergy.2016.12.041.


![VOLUME 2: TRAFFIC STUDIES & ECONOMIC FEASIBILITY …...feasibility study for one detailed engineering design and legal framework for operation of one mchinji [malawi]/mwami [zambia](https://static.fdocuments.in/doc/165x107/5e9745402a3aa179c01e9848/volume-2-traffic-studies-economic-feasibility-feasibility-study-for-one.jpg)