Left Ventricular Outflow Tract Planimetry by Cardiovascular ... · measurements from healthy...
6
Journal of Cardiovascular Magnetic Resonance (2006) 8, 741–746 Copyright c 2006 Informa Healthcare ISSN: 1097-6647 print / 1532-429X online DOI: 10.1080/10976640600737383 Left Ventricular Outflow Tract Planimetry by Cardiovascular Magnetic Resonance Differentiates Obstructive from Non-Obstructive Hypertrophic Cardiomyopathy Jeanette Schulz-Menger, MD, 1,∗ Hassan Abdel-Aty, MD, 1,2,∗ Andreas Busjahn, PhD, 3 Ralf Wassmuth, MD, 1 Bernhard Pilz, MD, 1 Rainer Dietz, MD, 1 and Matthias G. Friedrich, MD, F.E.S.C. 1,2 Franz-Volhard-Klinik, Helios-Klinikum Berlin, Kardiologie, Charit´ e Campus Berlin-Buch, Humboldt-Universit ¨ at zu Berlin; Berlin, Germany 1 Stephenson CMR Centre, Department of Cardiac Sciences, University of Calgary, Canada 2 HealthTwiSt GmbH, Berlin, Germany 3 ABSTRACT The relation to the pressure gradient as assessed by echocardiography and the CMR-derived planimetry of the LVOT is not known, no values for the differentiation of obstruction exist. We studied 37 patients with hypertrophic cardiomyopathy and 14 healthy controls using standard sequences with 3D coverage of the left ventricular outflow tract. A cutoff value of 2.7 cm 2 identified obstruction as defined by echocardiography with 100% accuracy. CMR planimetry at rest is a promising tool to evaluate patients with hypertrophic cardiomyopathy. INTRODUCTION A crucial step in the diagnostic work-up of patients with hy- pertrophic cardiomyopathy (HCM) is to differentiate between obstructive and non-obstructive forms of the disease. In patients with obstruction of the left ventricular outflow tract (LVOT), the Doppler echocardiography-derived pressure gradient (PG) is currently the accepted approach (1, 2); however, it is lim- ited by the variability of the measurements (3) and the need to apply stress to detect the ‘latent’ obstruction (4). Furthermore, Keywords: Hypertrophic Cardiomyopathy, Cardiovascular Magnetic Resonance, Left Ventricular Outflow Tract, Echocardiography. Received 12 November 2005; accepted 8 March 2006. ∗ Both authors contributed equally to this work. Correspondence to: Jeanette Schulz-Menger, MD Franz-Volhard-Klinik Charit´ e-Campus-Buch, Kardiologie Universit¨ atsmedizin Berlin Helios-Klinikum Berlin Wiltbergstr. 50, D-13125 Berlin Germany tel: 49 30 9417-2593/2552 fax: 49 30 9417-2560 email: [email protected] PG measurements vary significantly in relation to hemodynamic conditions (5, 6). More than 20 years ago, Spirito et al. (7) in- troduced the planimetry of LVOT-area by transthoracic echocar- diography. The method however was not applicable in clinical routine due to technical limitations of available ultrasound tech- nique. Recently, 3D echocardiography partly overcame this lim- itation (8), yet complex image processing is needed (9), and a significant fraction of patients may not be evaluated due to poor image quality (8). Transesophageal 3D-echocardiography was also used to measure the LVOT in HCM patients before and after myectomy (10). However, the technique is relatively invasive, frequently requires sedation and is not very well tolerated by many patients. Finally, in all echocardiographic approaches, the actual position of the obtained views cannot be easily controlled for accuracy. A unique feature of CMR is the ability to provide non- invasive, reproducible and direct planimetric quantification of complex-shaped structures such as stenotic valves (11–13). We have shown the feasibility and relevance of LVOT planime- try using CMR (14). The results correlate well with the clin- ical severity of the disease both before and after septal artery embolization. Yet, there are no reports using CMR or 3D echocardiogra- phy that attempted to assess the LVOT area in the full scale of HCM, i.e., obstructive, latent obstructive and non obstruc- tive HCM. Furthermore, there are neither CMR-LVOT area 741
Transcript of Left Ventricular Outflow Tract Planimetry by Cardiovascular ... · measurements from healthy...

Journal of Cardiovascular Magnetic Resonance (2006) 8, 741–746Copyright c© 2006 Informa HealthcareISSN: 1097-6647 print / 1532-429X onlineDOI: 10.1080/10976640600737383
Left Ventricular Outflow Tract Planimetryby Cardiovascular Magnetic Resonance
Differentiates Obstructive from Non-ObstructiveHypertrophic Cardiomyopathy
Jeanette Schulz-Menger, MD,1,∗ Hassan Abdel-Aty, MD,1,2,∗ Andreas Busjahn, PhD,3 Ralf Wassmuth, MD,1
Bernhard Pilz, MD,1 Rainer Dietz, MD,1 and Matthias G. Friedrich, MD, F.E.S.C.1,2
Franz-Volhard-Klinik, Helios-Klinikum Berlin, Kardiologie, Charite Campus Berlin-Buch, Humboldt-Universitat zu Berlin; Berlin, Germany 1
Stephenson CMR Centre, Department of Cardiac Sciences, University of Calgary, Canada 2
HealthTwiSt GmbH, Berlin, Germany 3
ABSTRACT
The relation to the pressure gradient as assessed by echocardiography and the CMR-derivedplanimetry of the LVOT is not known, no values for the differentiation of obstruction exist. Westudied 37 patients with hypertrophic cardiomyopathy and 14 healthy controls using standardsequences with 3D coverage of the left ventricular outflow tract. A cutoff value of 2.7 cm2
identified obstruction as defined by echocardiography with 100% accuracy. CMR planimetry atrest is a promising tool to evaluate patients with hypertrophic cardiomyopathy.
INTRODUCTION
A crucial step in the diagnostic work-up of patients with hy-pertrophic cardiomyopathy (HCM) is to differentiate betweenobstructive and non-obstructive forms of the disease. In patientswith obstruction of the left ventricular outflow tract (LVOT),the Doppler echocardiography-derived pressure gradient (PG)is currently the accepted approach (1, 2); however, it is lim-ited by the variability of the measurements (3) and the need toapply stress to detect the ‘latent’ obstruction (4). Furthermore,
Keywords: Hypertrophic Cardiomyopathy, CardiovascularMagnetic Resonance, Left Ventricular Outflow Tract,Echocardiography.Received 12 November 2005; accepted 8 March 2006.∗Both authors contributed equally to this work.Correspondence to:Jeanette Schulz-Menger, MDFranz-Volhard-KlinikCharite-Campus-Buch, KardiologieUniversitatsmedizin BerlinHelios-Klinikum BerlinWiltbergstr. 50, D-13125BerlinGermanytel: 49 30 9417-2593/2552 fax: 49 30 9417-2560email: [email protected]
PG measurements vary significantly in relation to hemodynamicconditions (5, 6). More than 20 years ago, Spirito et al. (7) in-troduced the planimetry of LVOT-area by transthoracic echocar-diography. The method however was not applicable in clinicalroutine due to technical limitations of available ultrasound tech-nique. Recently, 3D echocardiography partly overcame this lim-itation (8), yet complex image processing is needed (9), and asignificant fraction of patients may not be evaluated due to poorimage quality (8). Transesophageal 3D-echocardiography wasalso used to measure the LVOT in HCM patients before and aftermyectomy (10). However, the technique is relatively invasive,frequently requires sedation and is not very well tolerated bymany patients. Finally, in all echocardiographic approaches, theactual position of the obtained views cannot be easily controlledfor accuracy.
A unique feature of CMR is the ability to provide non-invasive, reproducible and direct planimetric quantification ofcomplex-shaped structures such as stenotic valves (11–13). Wehave shown the feasibility and relevance of LVOT planime-try using CMR (14). The results correlate well with the clin-ical severity of the disease both before and after septal arteryembolization.
Yet, there are no reports using CMR or 3D echocardiogra-phy that attempted to assess the LVOT area in the full scaleof HCM, i.e., obstructive, latent obstructive and non obstruc-tive HCM. Furthermore, there are neither CMR-LVOT area
741

measurements from healthy subjects available nor a valida-tion against the well-established PG measurements in HCMpatients. CMR assessment of the LVOT area would allow forrelating obstruction to tissue changes such as edema or focalfibrosis.
This study was designed to measure LVOT area by CMRin different forms of HCM and healthy subjects in com-parison to pressure gradient measurements as the standardtechnique.
METHODS
Patients
Thirty-seven HCM patients were consecutively enrolled.HCM was defined based on the echocardiographic demonstra-tion of a hypertrophied (wall thickness of 15 mm or more),non-dilated left ventricle in the absence of another related car-diac or systemic disorder. The clinical status of the patientswas classified depending on the degree of dyspnea followingthe classification of the New York Heart Association (NYHA).Exclusion criteria were atrial fibrillation with large RR-interval-variations, contraindications to CMR and poor ultrasound imag-ing conditions.
Control group
Fourteen healthy subjects (10 males, 28 ± 10 years) with nocurrent or previous cardiovascular disorders and with normalECG served as our control group. Those subjects underwentonly CMR but not Doppler echocardiography.
Echocardiography
Echocardiographic examinations were performed on a com-mercially available instrument (Acuson Sequoia C256, SiemensMedical Solutions, Erlangen, Germany) with a 3.2 MHz trans-ducer. Left-ventricular dimensions, ejection fraction and wallthickness of the anteroseptal and posterior wall were measuredin the parasternal long axis according to the guidelines of the
American Society of Echocardiography. Maximum thickness ofthe septal wall was measured in the apical four-chamber viewusing 2D-echocardiography. The maximum velocity within theLVOT was measured at rest and after Valsalva maneuver in thefive-chamber view, applying multiple PW- and CW-Doppler-measurements. We cautiously tried to avoid contamination ofthe Doppler-signal by flow from mitral regurgitation or flowthrough the aortic valve. The maximum PG was calculated fromvelocity measurements.
Patients were divided into 3 groups based on their PG: a) non-obstructive HCM (HNCM) (PG < 30 at rest and after provoca-tion, n = 12); b) latent obstructive HCM (LHOCM) (PG < 30 atrest and >30 after provocation, n = 8) and c) obstructive HCM(HOCM) (PG > 30 at rest, n = 17).
CMR
CMR studies were performed in a 1.5 Tesla system (SignaCV/i , GE medical systems, Milwaukee, WI, USA) using a four-element phased array coil with the patient in the supine position.Breath-hold, real-time scout images and a subsequent series ofbreath-hold gradient-echo images (SSFP/steady-state free pre-cession, TR 4.5 ms, TE 1.8 ms, matrix: 256 × 192, FOV: 32 ×32–38 × 38 cm, number of phases: 20–30) were used for local-ization of the LVOT (Fig. 1). Based on long-axis views of theLVOT, a stack of cross-sectional views was obtained to coverthe whole LVOT (cine mode, 6–8 slices, slice thickness 5 mm,no gap). The LVOT in HCM was defined as the whole regionbounded by the anterior mitral valve leaflet and the septal wall.The smallest LVOT area obtained in theses slices was measuredduring systole, including the effect of the systolic anterior move-ment of the anterior mitral valve leaflet. The smallest area duringsystole was accepted as hemodynamic relevant and was docu-mented . A reader blinded to other subject-related data manuallytraced the LVOT area using the anterior mitral valve leaflet andthe septum as anatomical borders. Figure 2 shows the LVOT indifferent forms of disease.
Figure 1. Localization and planimetry of the left ventricular outflow tract - Stepwise localization of LVOT: Left: LVOT defined by the interventricularseptal wall and the anterior leaflet of the mitral valve with lines visualizing the slices for coverage of the LVOT. It is demonstrated in a patient withHNCM; Middle: short axis through the LVOT; Right: short axis through the LVOT with region of interest giving the quantified area of the LVOT.
742 J. Schulz-Menger et al.
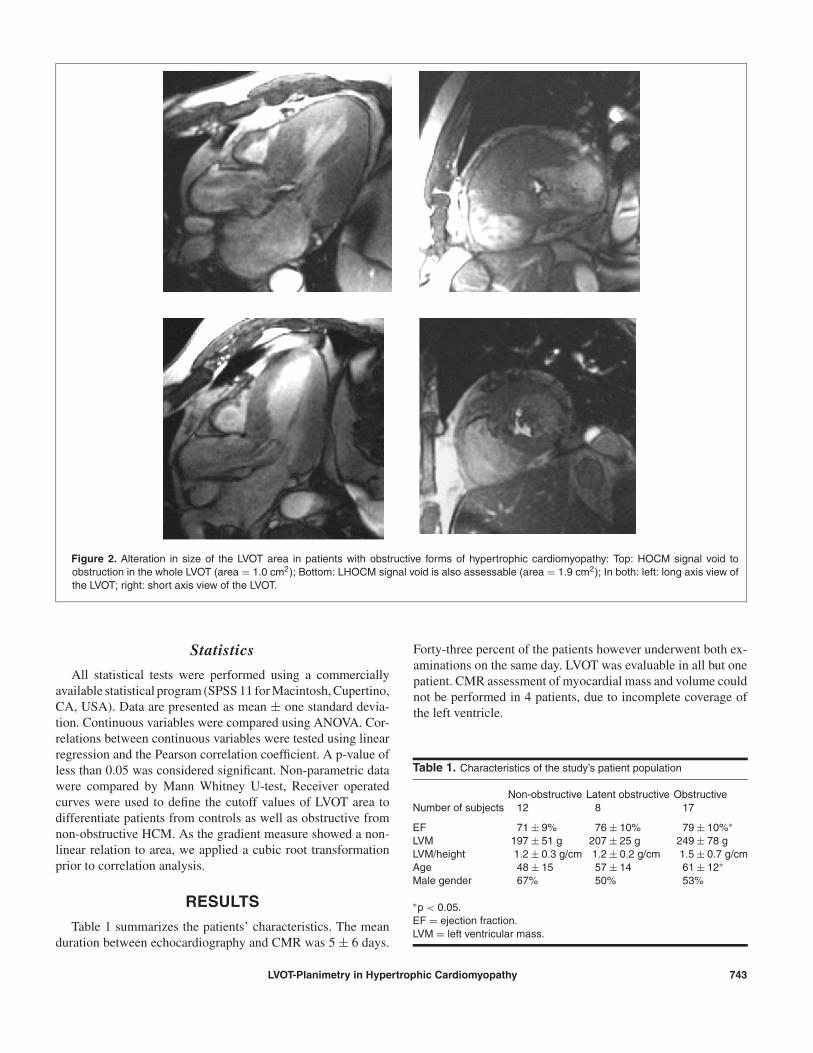
Figure 2. Alteration in size of the LVOT area in patients with obstructive forms of hypertrophic cardiomyopathy: Top: HOCM signal void toobstruction in the whole LVOT (area = 1.0 cm2); Bottom: LHOCM signal void is also assessable (area = 1.9 cm2); In both: left: long axis view ofthe LVOT; right: short axis view of the LVOT.
Statistics
All statistical tests were performed using a commerciallyavailable statistical program (SPSS 11 for Macintosh, Cupertino,CA, USA). Data are presented as mean ± one standard devia-tion. Continuous variables were compared using ANOVA. Cor-relations between continuous variables were tested using linearregression and the Pearson correlation coefficient. A p-value ofless than 0.05 was considered significant. Non-parametric datawere compared by Mann Whitney U-test, Receiver operatedcurves were used to define the cutoff values of LVOT area todifferentiate patients from controls as well as obstructive fromnon-obstructive HCM. As the gradient measure showed a non-linear relation to area, we applied a cubic root transformationprior to correlation analysis.
RESULTS
Table 1 summarizes the patients’ characteristics. The meanduration between echocardiography and CMR was 5 ± 6 days.
Forty-three percent of the patients however underwent both ex-aminations on the same day. LVOT was evaluable in all but onepatient. CMR assessment of myocardial mass and volume couldnot be performed in 4 patients, due to incomplete coverage ofthe left ventricle.
Table 1. Characteristics of the study’s patient population
Non-obstructive Latent obstructive ObstructiveNumber of subjects 12 8 17
EF 71 ± 9% 76 ± 10% 79 ± 10%∗LVM 197 ± 51 g 207 ± 25 g 249 ± 78 gLVM/height 1.2 ± 0.3 g/cm 1.2 ± 0.2 g/cm 1.5 ± 0.7 g/cmAge 48 ± 15 57 ± 14 61 ± 12∗Male gender 67% 50% 53%
∗p < 0.05.EF = ejection fraction.LVM = left ventricular mass.
LVOT-Planimetry in Hypertrophic Cardiomyopathy 743
Figure 3. Step-wise reduction in the LVOT-area from controls, non-obstructive to obstructive HCM.
LVOT area by CMR
Figure 3 shows the relation of the size of the LVOT areato the presence or absence of the pressure-gradient-defined ob-struction. Compared to volunteers with a mean LVOT area of4.8 ± 0.8 cm2, the area was significantly smaller in patients withHNCM (3.6 ± 1.1 cm2, p < 0.004), LHOCM (2.2 ± 1.5 cm2,p < 0.002.) and HOCM (1.6 ± 0.6 cm2, p < 0.0001), respec-tively. Patients with HNCM had significantly larger LVOT thanlatent (p = 0.013) or HOCM (p < 0.0001), respectively. Whenthe latent obstructive and obstructive forms were considered to-gether as obstructive HCM, significant differences in LVOT stillexisted between the obstructive and non-obstructive (1.8 cm2 ±1.0 vs. 3.6 ± 1.1 cm2, p < 0.0001) forms of the disease. No sig-nificant difference was found between the LVOT in LHOCM andHOCM (p = 0.478) (Fig. 3). The comparison of the mean values(Bland-Altman plots) in a representative sample showed an ex-cellent agreement between readers (correlation = 0.97). Basedon ROC analysis, a cutoff value of 3.7 cm2 could be shown todifferentiate patients from controls (sensitivity 83%, specificity100%, positive and negative predictive values 100% and 70%,respectively). On the other hand, a cutoff value of 2.7 cm2 wasable to differentiate HOCM from HNCM with a sensitivity andspecificity of 100%.
Correlation between PG and LVOT
There was no significant relation of area or gradient withheight and weight. Age showed a significant inverse correlationto area (r = −0.68), even after restricting the analysis to patientsonly (r = −0.50). There was no significant correlation betweenage and gradient (r = 0.22). The correlation between area andgradient was −0.67 and remained significant after correction forage (partial correlation r = −0.68) (Fig. 4).
Figure 4. Inverse nonlinear relation between the LVOT area andpressure gradient in Doppler echocardiography.
DISCUSSION
This is the first report describing CMR planimetry of theLVOT in different forms of HCM compared to healthy subjects.We could verify the step-wise reduction of the LVOT area fromHNCM, LHOCM to HOCM, as expected by the disease defi-nition. These findings can be explained by the inverse relationbetween flow velocity and the size of the anatomic structure,mainly described by the smallest systolic LVOT area. Basedon this theory, however, one would expect a linear correlationbetween LVOT area and PG, which was not the case neither inours nor in previous reports using 3D echocardiography (8, 10).This is likely related to two factors: first, the susceptibility of PGmeasurements to minor changes in loading conditions (6) and/orthe variability of PG measurement from day to day (3). This isespecially true for LVOT areas with borderline hemodynamicrelevance at rest. Second, based on simple considerations onflow dynamics in obstructed vessels, the linearity between flowvelocity and a narrowed LVOT is expected to get lost once a‘critical’ LVOT area range is reached. In such a case (likely tobe accompanied by symptoms in HCM patients), small changesas induced by preload variations may lead to a significantincrease of resistance and thus of measured pressure gradients.
The finding that the LVOT area was significantly reduced atrest in apparently non-obstructive forms of HCM (LHOCM andHNCM) deserves special attention. Panza et al. (15) found thata reduction of the LVOT diameter in children with HNCM waspredictive of the future development of SAM and significantobstruction. Although extrapolation of these results to adult pa-tients should be taken with care, it seems conceivable that a mildobstruction although not yet hemodynamically overt will havea relevant predictive value.
A LVOT cutoff value of 3.7 cm2 appears to offer a promis-ing screening tool to rule out the disease whereas a LVOT value
744 J. Schulz-Menger et al.
of 2.7 cm2 has an accuracy of 100% to differentiate obstruc-tive from non-obstructive HCM. This value is larger than the2.0 cm2 identified by Qin et al. (8) using 3D echocardiography.The reason of this difference is most likely related to the PG cut-off value to define obstructive HCM. Whereas we used a valueof 30 mmHg (1), Qin et al. defined obstruction as values above50 mmHg.
Clinical implications
An emerging role of CMR to evaluate HCM is beingshaped with unique features to assess tissue structure andventricular function (16–20). Planimetry of the LVOT areaprovides relevant additional information and may have animportant role within a comprehensive CMR exam of HCMpatients.
Limitations and technical considerations
The major limitation of this study is the limited number ofpatients in the subgroups. The aim however was to validate theconcept that LVOT is related to the degree of obstruction. Futurestudies in larger patient cohorts are definitely warranted. Due tothe known day-to-day variation in PG measurements it wouldhave been ideal to perform both Doppler and CMR on the sameday. For logistical reasons, this demand was fulfilled in only43% of our patients. Yet, the correlation between PG and LVOTarea measurement remained significant even after correcting forthe inter-study duration.
CONCLUSION
CMR planimetry of the LVOT accurately differentiates ob-structive from non-obstructive HCM without the need for hemo-dynamic provocation .
ABBREVIATIONS
CMR = cardiovascular magnetic resonanceHCM = hypertrophic cardiomyopathyHOCM = hypertrophic obstructive cardiomyopathyHNCM = hypertrophic non-obstructive cardiomyopathyLHOCM = latent hypertrophic obstructive cardiomyopathyLVOT = left ventricular outflow tractPG = pressure gradientEcho = echocardiography
ACKNOWLEDGMENTS
We would like to thank Kerstin Kretschel, Evelyn Polzinand Ursula Wagner for their technical assistance and MelanieBochmann for her help in recruiting patients.
We also thank Andreas Kumar, Anja Zagrossek and PhilippBoye for their help in scanning the patients.
REFERENCES1. Maron BJ, McKenna WJ, Danielson GK, et al. American College
of Cardiology/European Society of Cardiology clinical expert con-sensus document on hypertrophic cardiomyopathy. A report of theAmerican College of Cardiology Foundation Task Force on Clin-ical Expert Consensus Documents and the European Society ofCardiology Committee for Practice Guidelines. J Am Coll Cardiol2003;42:1687–713.
2. Maron MS, Olivotto I, Betocchi S, et al. Effect of left ventricularoutflow tract obstruction on clinical outcome in hypertrophic car-diomyopathy. N Engl J Med 2003;348:295–303.
3. Kizilbash AM, Heinle SK, Grayburn PA. Spontaneous variabilityof left ventricular outflow tract gradient in hypertrophic obstructivecardiomyopathy. Circulation 1998;97:461–6.
4. Marwick TH, Nakatani S, Haluska B, Thomas JD, Lever HM. Provo-cation of latent left ventricular outflow tract gradients with amyl ni-trite and exercise in hypertrophic cardiomyopathy. Am J Cardiol1995;75:805–9.
5. Klues HG, Leuner C, Kuhn H. Left ventricular outflow tract ob-struction in patients with hypertrophic cardiomyopathy: increasein gradient after exercise [see comments]. J Am Coll Cardiol1992;19:527–33.
6. Paz R, Jortner R, Tunick PA, et al. The effect of the ingestion ofethanol on obstruction of the left ventricular outflow tract in hyper-trophic cardiomyopathy. N Engl J Med 1996;335:938–41.
7. Spirito P, Maron BJ. Significance of left ventricular out-flow tract cross-sectional area in hypertrophic cardiomyopathy:a two-dimensional echocardiographic assessment. Circulation1983;67:1100–8.
8. Qin JX, Shiota T, Lever HM, et al. Impact of left ventricular outflowtract area on systolic outflow velocity in hypertrophic cardiomyopa-thy: a real-time three-dimensional echocardiographic study. J AmColl Cardiol 2002;39:308–14.
9. Salustri A, Kofflard MJ, Roelandt JR, et al. Assessment of left ven-tricular outflow in hypertrophic cardiomyopathy using anyplane andparaplane analysis of three-dimensional echocardiography. Am JCardiol 1996;78:462–8.
10. Franke A, Schondube FA, Kuhl HP, et al. Quantitative assess-ment of the operative results after extended myectomy andsurgical reconstruction of the subvalvular mitral apparatus inhypertrophic obstructive cardiomyopathy using dynamic three-dimensional transesophageal echocardiography. J Am Coll Cardiol1998;31:1641–9.
11. John AS, Dill T, Brandt RR, et al. Magnetic resonance to assessthe aortic valve area in aortic stenosis: how does it compare tocurrent diagnostic standards? J Am Coll Cardiol 2003;42:519–26.
12. Friedrich MG, Schulz-Menger J, Poetsch T, Pilz B, Uhlich F, DietzR. Quantification of valvular aortic stenosis by magnetic resonanceimaging. Am Heart J 2002;144:329–34.
13. Strohm O, Schulz-Menger J, Hanlein D, Dietz R, Friedrich MG.Magnetic resonance planimetry of the vena contracta as a newapproach to assessment of stenotic heart valves: an in vitro study.J Magn Reson Imaging 2001;14:31–4.
14. Schulz-Menger J, Strohm O, Waigand J, Uhlich F, Dietz R,Friedrich MG. The value of magnetic resonance imaging of theleft ventricular outflow tract in patients with hypertrophic obstruc-tive cardiomyopathy after septal artery embolization. Circulation2000;101:1764–6.
15. Panza JA, Maris TJ, Maron BJ. Development and determinants ofdynamic obstruction to left ventricular outflow in young patientswith hypertrophic cardiomyopathy. Circulation 1992;85:1398–405.
16. Choudhury L, Mahrholdt H, Wagner A, et al. Myocardial scarringin asymptomatic or mildly symptomatic patients with hypertrophiccardiomyopathy. J Am Coll Cardiol 2002;40:2156–64.
LVOT-Planimetry in Hypertrophic Cardiomyopathy 745

17. Moon JC, McKenna WJ, McCrohon JA, Elliott PM, Smith GC,Pennell DJ. Toward clinical risk assessment in hypertrophic car-diomyopathy with gadolinium cardiovascular magnetic resonance.J Am Coll Cardiol 2003;41:1561–7.
18. van Dockum WG, ten Cate FJ, ten Berg JM, et al. Myocardialinfarction after percutaneous transluminal septal myocardial ab-lation in hypertrophic obstructive cardiomyopathy: evaluation bycontrast-enhanced magnetic resonance imaging. J Am Coll Car-diol 2004;43:27–34.
19. Ennis DB, Epstein FH, Kellman P, Fananapazir L, McVeigh ER,Arai AE. Assessment of regional systolic and diastolic dysfunctionin familial hypertrophic cardiomyopathy using MR tagging. MagnReson Med 2003;50:638–42.
20. Dong SJ, MacGregor JH, Crawley AP, et al. Left ventric-ular wall thickness and regional systolic function in pa-tients with hypertrophic cardiomyopathy. A three-dimensionaltagged magnetic resonance imaging study. Circulation 1994;90:1200–9.
746 J. Schulz-Menger et al.