Leeds Joint Strategic Assessment2021
97
2021 Leeds Joint Strategic Assessment Leeds Joint Strategic Assessment
Transcript of Leeds Joint Strategic Assessment2021

2021
Leeds Joint Strategic Assessment
Leeds Joint Strategic Assessment

2
Contents Introduction and Purpose ......................................................................................................... 6
What is the Joint Strategic Assessment (JSA)? ......................................................................... 6
Producing the JSA during a global pandemic ........................................................................... 6
How to use the JSA ............................................................................................................... 9
Structure ....................................................................................................................... 10
Deprived Leeds terminology ............................................................................................ 10
Accessibility ................................................................................................................... 10
Updates ............................................................................................................................ 10
Section 1: A Changing City: Population Trends .......................................................................... 12
Headlines .......................................................................................................................... 12
Overview .......................................................................................................................... 12
Population growth centered in our most disadvantaged communities ..................................... 13
A more diverse population .................................................................................................. 14
Population is still ageing ..................................................................................................... 15
More children and young people ......................................................................................... 16
Policy implications ............................................................................................................. 17
Section 2: Starting Well - Child-Friendly Leeds........................................................................... 18
Headlines .......................................................................................................................... 18
Population ........................................................................................................................ 19
Child poverty ..................................................................................................................... 19
Safeguarding ..................................................................................................................... 20
Health .............................................................................................................................. 21
Infant mortality .............................................................................................................. 21
Child obesity .................................................................................................................. 22
Activity levels ................................................................................................................. 23
Breastfeeding ................................................................................................................ 23
Vaccinations .................................................................................................................. 24
Oral health .................................................................................................................... 25
Young people and alcohol ............................................................................................... 25
Mental health ................................................................................................................ 26
Sexual and reproductive health ........................................................................................ 26
Education and learning ....................................................................................................... 27
Early years ..................................................................................................................... 27
Key stage 2 .................................................................................................................... 28
Key stage 4 and beyond .................................................................................................. 28
Support for children with special educational needs .............................................................. 29

3
School attendance during Covid-19 ...................................................................................... 30
Policy implications ............................................................................................................. 31
Section 3A: Living Well – Health and Wellbeing ........................................................................ 32
Headlines .......................................................................................................................... 32
Immediate and direct health impacts of Covid-19 .................................................................. 33
Longer-term trends – the health / wealth gap ....................................................................... 34
Life expectancy .................................................................................................................. 35
Preventable mortality ......................................................................................................... 36
Suicide rates ...................................................................................................................... 37
Alcohol related admissions ................................................................................................. 38
Liver disease mortality ........................................................................................................ 39
Respiratory disease mortality .............................................................................................. 39
Circulatory disease mortality ............................................................................................... 40
Cancer mortality ................................................................................................................ 40
Smoking prevalence ........................................................................................................... 41
Smoking attributable mortality ............................................................................................ 41
Obesity ............................................................................................................................. 42
Diabetes ........................................................................................................................... 42
Mental health .................................................................................................................... 43
Policy implications ............................................................................................................. 44
Section 3B: Living Well – Thriving Communities ........................................................................ 45
Headlines .......................................................................................................................... 45
Socio-economic inequality .................................................................................................. 46
Geography of inequality .................................................................................................. 46
Communities of interest .................................................................................................. 47
Poverty ............................................................................................................................. 48
Leeds’ vibrant third sector .................................................................................................. 49
Community resilience ......................................................................................................... 50
Family support ............................................................................................................... 50
Civic participation ........................................................................................................... 51
Social connections .......................................................................................................... 52
Safe communities .............................................................................................................. 52
Digital inclusion ................................................................................................................. 53
Housing ............................................................................................................................ 53
Housing delivery ............................................................................................................. 54
Affordable housing development ..................................................................................... 55
Housing costs .................................................................................................................... 56
Policy implications ............................................................................................................. 58

4
Section 3C: Living Well - Climate Change .................................................................................. 60
Headlines .......................................................................................................................... 60
Carbon emissions ............................................................................................................... 60
Air quality ......................................................................................................................... 63
Energy efficiency and fuel poverty ....................................................................................... 66
Food ................................................................................................................................. 67
Transport .......................................................................................................................... 68
Walking and cycling ........................................................................................................ 68
Public transport.............................................................................................................. 69
Access to green space......................................................................................................... 70
Policy implications ............................................................................................................. 71
Section 4: Working Well - Inclusive Growth .............................................................................. 73
Headlines .......................................................................................................................... 73
Economic impact of Covid-19 .............................................................................................. 73
Employment ...................................................................................................................... 74
Earnings ............................................................................................................................ 77
Business performance – growth, diversity and productivity .................................................... 80
Policy implications ............................................................................................................. 82
Section 5: Ageing Well - Age-Friendly Leeds .............................................................................. 84
Headlines .......................................................................................................................... 84
Demography and housing ................................................................................................... 85
Healthy ageing ................................................................................................................... 87
Life expectancy .............................................................................................................. 87
Physical health conditions ............................................................................................... 87
Frailty ........................................................................................................................... 88
Mental health ................................................................................................................ 88
The impact of Covid-19 ................................................................................................... 88
Active, included and respected ............................................................................................ 89
Active............................................................................................................................ 89
Included ........................................................................................................................ 90
Loneliness ..................................................................................................................... 90
Mobility and accessibility ................................................................................................ 90
Employment and Learning .................................................................................................. 92
Labour market ............................................................................................................... 92
Caring and carers............................................................................................................ 92
Policy implications ............................................................................................................. 92
Section 6: Implications of the Analysis (To be developed further) ................................................ 94
A Changing City: Population Trends ...................................................................................... 94

5
Starting Well - Child-Friendly Leeds ...................................................................................... 94
Living Well – Health and Wellbeing ...................................................................................... 95
Living Well – Thriving Communities ...................................................................................... 95
Living Well - Climate Change ............................................................................................... 96
Working Well - Inclusive Growth .......................................................................................... 96
Ageing Well - Age-Friendly Leeds ......................................................................................... 97

6
Introduction and Purpose
What is the Joint Strategic Assessment (JSA)? The JSA provides a holistic and reliable source of data and analysis about key demographic, socio-economic and health trends in Leeds. It aims to present an up-to-date picture of the issues driving health and wellbeing in the city, providing deeper insights which help us to understand the interrelated nature of the challenges which affect people’s lives. The JSA does not attempt to set out the current policy response, rather, its primary purpose is to inform commissioners and policy makers about the future needs of the city to better enable effective strategic planning, priority setting and commissioning decisions – helping to make the most of the resources available, deliver the best possible outcomes for Leeds citizens in a joined-up way, and engage everyone to play their part. In Leeds we put the wider determinants of health and wellbeing at the core of our JSA, recognising the way factors including the economy, education, environment and housing impact on health outcomes and wider wellbeing over a person’s lifetime and are therefore crucial to our ambition to improve the health of the poorest fastest. The JSA also provides valuable insight in assessing the future health and care needs of our changing population, helping to inform change and development in the health and care system. It underpins Leeds’s strategic framework including the statutory Health and Wellbeing strategy, our Inclusive Growth strategy and is available to support the future planning of other partners and organisations across the city. From 2021 the JSA will provide a valuable evidence base and context for the agreement of a new city plan for Leeds which describes our shared vision and ambitions for the future. While much of the JSA is focused on analysing the drivers of need across Leeds, we also adopt the city’s asset-based approach to reflect where there are strengths on which we can build. Guiding us in this effort are the voices and lived experiences of people living in Leeds, especially those living in our low-income communities and those facing personal or environmental challenges in their lives.
Producing the JSA during a global pandemic Most of the background research and analysis which has informed the JSA was undertaken in the spring and early summer of 2021 when Leeds, the UK and the rest of the world is still dealing with the Covid-19 pandemic. The pandemic has caused social and economic change on a scale not seen in our lifetimes, and its lasting medium and longer-term effects remain unclear particularly on issues such as mental health and wellbeing. Producing an accurate analysis of the current and future challenges the city faces in this context is very challenging. Much of the data available is partial in nature or is yet to show the full effects of Covid-19. In other cases, it is too early to draw any conclusions about how Leeds will recover following the pandemic. Therefore, throughout this summary report we have highlighted areas where there should be further lines of inquiry over the coming months to assess the impact of Covid-19, and we will publish further analysis and reporting on the Leeds Observatory. Despite this ongoing uncertainty, we can offer some analysis of the pandemic’s impact with assurance. There are headlines common to places across the UK which we have experienced in Leeds, the most striking of which is clearly the direct impact on human life. Since March 2020 we have seen significantly higher excess deaths as a direct result of Covid-19 when compared to the 2015-2019 average (Figure 1: Deaths in 4-week groupings, variation with 2015-19Figure 1).

7
As of 30 July 2021, there have been 1,739 deaths recorded in Leeds with Covid-19 on the death certificate, and there have been 90,411 total cases in the city by the same date1.
Figure 1: Deaths in 4-week groupings, variation with 2015-19
Source: Leeds Public Health Intelligence, June 2021
Crucial to the purposes of the JSA, Covid-19 has not affected all populations equally. There has been a clear disproportionate impact of the virus on older people. With the exception of the 90+ age group, where the highest number of cases have occurred, case rates have generally been higher in younger populations. Despite this the majority of hospitalisations and 93% of all Covid-19 deaths in Leeds have affected people aged over 602.
Figure 2: Cumulative Covid-19 cases in Leeds by age, March 2020 – August 2021
Source: Leeds Public Health Intelligence, August 2021
The virus can also be seen to exacerbate existing inequalities with case rates higher in areas already experiencing disadvantage (Figure 2Error! Reference source not found.). Along with more diagnoses there is a higher likelihood of people losing their lives to Covid-19, with mortality rates in the most disadvantaged communities more than double the least nationally and survival rates remaining lower
1 GOV.UK Covid-19 Dashboard 2 Covid-19 deaths by age group (Leeds Public Health Intelligence, August 2021)

8
after adjusting for sex, age and ethnicity – particularly for those of working age where the risk of death almost doubled3. Within Leeds itself these differences are less pronounced in the data, although the mortality rate in the most deprived decile according to the Indices of Multiple Deprivation (IMD) remains higher than the Leeds average and the true impact may be masked by the overall geography of the city.
Figure 3: Index of Multiple Deprivation 2019 and total Covid-19 cases in England
Source: Indices of Multiple Deprivation (2019) and Leeds City Council (2021)
Covid-19 poses increased risk to individuals based on their ethnicity too. In England the highest diagnosis rates per 100,000 population were in Black ethnic groups (486 per 100,000 in females and 649 per 100,000 in males) and the lowest were in White ethnic groups (220 per 100,000 in females and 224 per 100,000 in males). In these cases the increased risk is not specifically related to a genetic vulnerability in minority communities, but instead is likely to be the outcome of structural and cultural economic and societal issues which shape where people live and the jobs they do, resulting in increased exposure and elevated risk for some Black, Asian and ethnic minority communities. Proportionally more people from these communities have also been significantly ill with Covid-19, perhaps exacerbated by the additional issue of higher rates of long-term underlying conditions than in the population as a whole.
3 Disparities in the risk and outcomes of Covid-19 (Public Health England, August 2020)

9
Figure 4: Cumulative Covid-19 cases in Leeds by ethnicity, March 2020 – August 2021
Source: Leeds Public Health Intelligence, August 2021
Looking at Leeds specifically, the city has also experienced significantly higher case numbers in Black and Asian ethnic groups compared to White ethnic groups. Black African, Other Black, Pakistani and Other Asian ethic groups have been most affected, and while the Indian population has seen a rate lower than the Leeds average it has still been notably higher than for White ethnic groups. The Chinese population in Leeds has experienced very low case rates, perhaps supported by different established cultural norms including regular mask wearing. More detailed analysis of the ongoing impacts of Covid-19 across all aspects of life in Leeds is contained within the main chapters of this report. We have sought to explore the differential impacts of the disease on the health and economic prospects of people and communities throughout, in addition to presenting analysis about the way the pandemic has affected the behaviours and experiences of the city’s population over the last 18 months. While Covid-19 has undoubtedly had a huge impact on the health and wellbeing of people in Leeds, and aspects of this will continue for some time to come, it is important the JSA does not become solely focused on this. Analysis of the pandemic’s impact is contextualised as we consider a wide range of longer-term trends and prominent issues the city faces in the years ahead.
How to use the JSA This summary report provides an overview of the key issues and implications identified in the latest data and analysis available. It provides a snapshot in time of the headline challenges and opportunities for Leeds, and provides signposts to more detailed data, analysis, themed reports and geographic profiles. In producing the JSA we recognise the complexity of a city like Leeds. Where localised geographic analysis is included to help understand the issues encountered in different localities and communities, we adopt the most appropriate boundary for the data cited rather than enforcing a single geography across all topics. For example, this might include locally defined geographies such as school clusters

10
and local care partnerships in addition to ward boundaries, middle super output areas (MSOAs)4 and lower super output areas (LSOAs)5.
Structure The JSA examines health and wellbeing issues, including the wider determinants of health, for the Leeds population at all ages. This summary report therefore groups the analysis into chapters structured primarily around life course stages under the following headings:
1. Population
2. Starting Well – Child-Friendly Leeds
3A. Living Well – Health and Wellbeing
3B. Living Well – Thriving Communities
3C. Living Well – Climate Change
4. Working Well – Inclusive Growth
5. Ageing Well – Age-Friendly Leeds
6. Implications of the Analysis
Deprived Leeds terminology Part of Section 2: Child-Friendly Leeds and Section 3A: Health and Wellbeing draw specifically on the latest health and wellbeing indicators tracked by the Public Health Intelligence team. This analysis provides an overview of the progress in the city, and where possible separates out city-wide progress and that of those parts of the city most likely to experience multiple factors of deprivation, i.e. those communities identified as 10% most deprived in Index of Multiple Deprivation 2019. In these sections and in this specific context, those communities are identified as ‘deprived Leeds’.
Accessibility The JSA is an evolving product hosted on the Leeds Observatory (observatory.leeds.gov.uk) where you will find further supporting reports alongside a wealth of detailed data and analysis which could not be included in this summary report. The Leeds Observatory’s self-serve capability allows data to be mapped using a range of ‘administrative’ boundaries. The building blocks for the analysis are usually comprised of the statistical geographies of either LSOAs or MSOAs depending on the availability of data. This summary report is best read on screen. If you have any queries or require further support accessing the JSA please contact us at [email protected].
Updates The JSA is currently undertaken every three years and a summary report produced. Increasingly commissioners, policy makers and providers want access to real-time intelligence about the city which can help them to respond more quickly to changing needs and circumstances at a community level. Moving forward the JSA will aim to provide this insight in a useful, interactive way through further development of the Leeds Observatory’s functionality, with more frequent updates as new
4 MSOAs are built up from 3-7 individual LSOAs. The average number of people living in an MSOA is 7,000. There are 107 MSOAs in Leeds. 5 LSOAs typically have an average 1,500 residents and 650 households. There are 482 LSOAs in Leeds.

11
information becomes available and the inclusion of more real-time dashboards providing key data and analysis in an easily digestible format. This online platform will also enable more effective sharing of qualitative data, case studies and lived experience insights gathered by the council and its partners alongside existing intelligence.

12
Section 1: A Changing City: Population Trends
Headlines
• In line with national patterns, ageing population trends continue, with the 80+ age group growing fastest.
• The population profile of children and young people is becoming more diverse and focused in communities most likely to experience poverty.
• The birth-rate ‘bulge’ of the 2010s has fallen back since 2017, though the 8 years of ‘bulge’ (10,000+) cohorts are now beginning to go through secondary school, with potentially significant mid-term implication for post-16 support and opportunities beyond.
• There are variations in the geography of population change, with growth primarily focused in inner-city communities.
• It is perhaps too early to assess any full impact of exiting the EU on patterns of immigration and/or on some existing communities. However, the pandemic has been an additional factor on masking any more deep-rooted changes.
Overview According to the Office for National Statistics (ONS) mid-year estimates for 2019, there were 793,000 people living in Leeds, up by over 41,000 from the 2011 Census6. Given that the Census is now a decade old, GP registrations can provide an additional source of insights into population trends. Data drawn from our Public Health population model (based on GP registrations, but accounting for cross district registrations) suggests the population might be as large as 870,0007 though care is needed with this figure as duplicate GP registrations can result in over-counting, especially in cities like Leeds with its large student population. That said it is unlikely the scale of the disparity can be fully explained by this over-counting. We await the forthcoming 2021 Census with interest. However, it is how the composition of our population has changed which is of specific interest, with the GP registration data, birth rates and the results from the annual School Census, all pointing to a far more diverse population.
6 ONS Population Estimates 2011 Census Population Count 7 GP ethnicity October 2020

13
Figure 5: 2017 Mid-year population estimates for Leeds (teal) and England and Wales (orange)
Source: ONS mid-year estimate of population 2019
The comparative analysis of the city’s population highlights both the broad similarities with national trends, but also where the city diverges. The city has an ageing population in-line with national trends. However, it has also seen growth in the population profile of children and young people, which the data suggests is becoming more diverse and concentrated in our inner areas. In addition, Leeds has one of the highest student populations in the UK with over around 70,000 students attending the city’s universities, with students heavily concentrated in the city centre and Inner West areas.8
Population growth centered in our most disadvantaged communities ONS population estimates, the School Census and GP registrations all point to an expansion in population in our inner-city areas, which are often our most disadvantaged communities. Intelligence regarding the demand for services confirms these often quite rapid demographic changes, not only driven by immigration, but also heavily influenced by the local housing tenure, Figure 6 below illustrates these changes.
8 HESA Student Population

14
Figure 6: Population Change by Electoral Ward 2011-2019
Source: ONS Mid-Year Estimates 2011 & 2016
A more diverse population The city’s population has continued to become more diverse since the 2011 Census, in terms of age, countries of origin and ethnicity. Again drawing on GP records for insights in to how our city is increasingly diverse, the Black, Asian and ethnic minority population represents almost a third of all those registered in 2020, whilst accounting for 19% of the city’s population in the 2011 Census. The most notable difference is in the Other White ethnic group, which in the 2011 Census had a population of 23,000, but in the 2020 GP registar stands at 78,000, pointing to the growth in economic immigration primarily from the EU over the last decade. That said most minority groups appear to have grown in population, with the exception of the Carribean (Black and Mixed) and Irish groups which look to have reduced in size (this could be due to identification or disclosure barriers as much as immigration). The White British group also appears to have reduced in size. Anyone wishing to work in the UK needs a National Insurance Number, analysis of non-British National Insurance Number (NINo) applicants, can be also provide insights into economic migration9. The latest data from 2019/20 confirms applications have decreased to the lowest levels since 2011, the extent to which this is due to Covid-19 restrictions or exiting the EU and associated changes to government
9 2019-20 NINO Data Leeds –file includes further core cities and nationality charts

15
policy is uncertain, though applications have been on a downward trend since 2016. The largest proportion of applications in recent years have been from Romanian and Polish nationals, though these have seen a significant decline in since exiting the EU.
Population is still ageing The overriding backdrop to these localised pressures is the wider trend of the city’s ageing population. As the baby-boomer generation grows older there will be a range of implications for service provision. The over 50 population has grown by an estimated almost 30,000 between 2001 and 2019, a 12% to 17% increase in each of the 50 plus age groups, much of the city’s population growth has been concentrated in these age groups. In terms of future projections to 2041, the 50-59 population is projected to reduce and there will be little change for the 60-69 population, however the 70+ population is projected to substantially grow, with fastest growth amongst the 80+, which is expected to see a 50% increase.
Figure 7: Population of Leeds by age
Source: ONS Mid-Year Population estimates 2019 & Population Projections 2018
The distribution of the city’s older population should also be considered. There are currently higher numbers of older people living in the city’s outer areas, however this could change as the recent shifts in the composition and spatial concentration of the population work through, resulting in a far more ethnically diverse older population, with a greater concentration in the city’s inner areas. Figure 8 below presents the current population profile by age, against the IMD 2019 deciles. This confirms the overall population concentration in our inner areas, which are often those which are most disadvantaged, primarily driven by housing density. However, it also highlights that the single largest over 65 population are also found in these areas.

16
Figure 8: Age Profile for each Index of Multiple Deprivation 2019 decile
Source: Index of Multiple Deprivation 2019 Mid-Year Population Estimates 2019
More children and young people The Leeds birth rate increased rapidly from the early 2000s and plateaued at around 10,000 per annum for eight years until 2016. However, the number of births has now fallen consecutively for four years and was 12% lower than 2016 in 2020. Latest intelligence shows that the number of births will be lower still in 2021 (circa 8,400). However, the child population is still growing at a faster rate than the population of Leeds as a whole, but the growth is now concentrated in Secondary school-age groups.
Figure 9: Births within Leeds boundary between 1999 and 2020
Source: NHS Health Leeds / Wakefield / Bradford, contains data within the Leeds boundary only (2021)

17
The latest ONS projections suggest there will be 15,000 more young people aged between 11 and 19 years old in 2029 compared to 2019. Their data also suggests that this population has been growing faster in our communities most likely to experience deprivation.10 Data from the city’s schools show major change over the last few years. The proportion of pupils that are Black, Asian and ethnic minority has continued to grow to 36% in 2021. And while, other than White British, the largest broad ethnic groups are Asian, Black, Mixed and White Other; proportional growth has been highest in White Other, mirroring the wider trends driven by economic migration. Between 2010 and 2020, growth has been particularly high within White Eastern European and Gypsy Roma ethnicities. The number of children and young people with English as an additional language (EAL) has increased from 13% in 2010 to 20% in 2021. After English, the main languages spoken are Urdu, followed by Romanian and Polish. Altogether nearly 200 languages are spoken by children studying in Leeds schools.11 The proportion of school pupils who are eligible for, and claim, Free School Meals has significantly increased since 2018, from 16% to 25% in 2021. Meanwhile the number of pupils who have an Education Health and Care Plan has more than tripled from 824 in 2016 to 3,013 in 2021. All this shows that while rapidly growing, our teenage population are also becoming more diverse, and the indicators suggest growing more quickly in our more disadvantaged communities. With a backdrop of the Covid-19 pandemic and pressure on resources, our teenage population potentially face significantly growing challenges into the medium-term.
Policy implications
• The city’s population has continued to become more diverse, in terms of age, countries of
origin and ethnicity. There is a more work to do in understanding and responding to the
relationship between ethnicity, deprivation, social mobility and health and wellbeing.
• The city’s population is ageing, with the 80+ age group growing fastest. The older population
is also becoming more diverse, as the wider demographic trends are increasingly reflected in
our older generation. Although perhaps too early to be definitive, the socio-economic profile
of our older population may also be changing, with house-ownership less dominant, and
people working longer over a more varied career pattern. Future Age-Friendly Leeds work as
well as other service provision will need to take account of these factors.
• In terms of young people, the birth-rate ‘bulge’ of the last decade has fallen back, beginning to be reflected in a fall in demand for school reception places. However, the ‘bulge’ cohorts are now beginning to go through secondary school, with significant mid-term implications for post-16 education and skills support and routes of entry into the labour market. All this against the backdrop of the economic impact of the pandemic, that has been acutely felt by young people.
• It is too soon to assess any full impact of exiting the EU on patterns of immigration and/or on some existing communities. However, early indications suggest that economic immigration from the EU has slowed, with some evidence of skills and labour shortages feeding through to the local economy and potential longer-term implications for the inclusive growth agenda.
10 Census Data Intel 11 Citywide analysis of School Census 2020

18
Section 2: Starting Well - Child-Friendly Leeds
Headlines
• The pandemic has had a major impact on children and young people, with the disruption to
their education the most obvious. Covid-19 restrictions have led to concerns regarding
safeguarding and the disengagement of young people, particularly the most vulnerable.
• Since 2011, the number of children looked after has reduced by 7% in Leeds compared to an
22% rise over that period across England.
• Educational attainment, particularly of more disadvantaged children, is still a significant
challenge. Performance at Foundation and Key Stage Two is below regional and national
averages, especially amongst disadvantaged children. This performance recovers somewhat
by Key Stage 4, where the city’s performance (for non-disadvantaged children) is closer to the
national average.
• The number of pupils who have an Education Health and Care Plan has more than tripled
between 2016 and 2021.
• Child poverty is at the root of many poor outcomes for children and young people and their
families. In 2021 almost 24% of children (under 16s) were estimated to live in poverty in Leeds,
compared to 19% nationally.
• The population profile of children and young people is becoming more diverse and more likely
to live in communities experiencing poverty.
The city has a long-standing aspiration to be a Child-Friendly city, where young people enjoy growing up and achieve their potential to become successful citizens of the future. We want to make a difference to the lives of children and young people who live in Leeds, to have a positive impact on improving outcomes for all children, while recognising the need for outcomes to improve faster for children from disadvantaged and vulnerable backgrounds. Clearly Covid-19 has had a profound impact on children and young people, with the disruption to their education perhaps most obvious. However, Covid-19 restrictions have also raised very real concerns regarding safeguarding, including issues regarding the disengagement of young people, particularly the most vulnerable, which potentially could manifest in the form of increased involvement in gangs and youth crime, anti-social behaviour and radicalisation. These concerns are accompanied by a broader set of worries regarding the social, emotional and mental health of young people. These worries are exacerbated by the economic impact of Covid-19, where young people have often been the most severely impacted in terms of job losses or furlough as many start their career path in those sectors most affected by the restrictions caused by the pandemic. Although data is still relatively scarce regarding the long-term impacts, clearly this will be a theme for further analysis as new insights become available.

19
Population A more comprehensive population overview is set out in Section 1 of the JSA. The population profile of children and young people is becoming more diverse and poorer. The number of births have now fallen consecutively for four years, and was 12% lower than 2016 in 2020. Latest intelligence shows that the number of births will be lower still in 2021 (circa 8,400). However, the child population is still growing at a faster rate than the population of Leeds as a whole, but the growth is now concentrated in Secondary school-age groups. The latest ONS projections suggest there will be 15,000 more young people aged between 11 and 19 years old in 2029 compared to 2019. Their data also suggests that this population has been growing faster in our more deprived communities.12 The proportion of school pupils who are eligible for, and claim, Free School Meals has significantly increased since 2018, from 16% to 25% in 2021. Meanwhile the number of pupils who have an Education Health and Care Plan has more than tripled from 824 in 2016 to 3,013 in 2021. With a backdrop of the Covid-19 pandemic and pressure on resources, our teenage population potentially face significantly growing challenges into the medium-term.
Child poverty National child poverty data from the Households Below Average Incomes survey (HBAI) for 2019/20 estimates that there are 4.3m dependent children under 20 in Relative Poverty in the UK, after housing costs are deducted from income. This is a rate of 31% of dependent children under 20. This figure is not available to compare locally. Instead the DWP and HMRC produce an estimate for children in low income families under 16 at national and local levels, before housing costs are deducted from income. This data provides the best indication for child poverty levels across local geographies. Using this measure, in 2019/20 there were 2.4m children under 16 in relative poverty in the UK, before housing costs are deducted from income. This is a rate of 19% of all children under 16 in the population. Figure 10 below compares child relative poverty for Leeds against other core cities, West Yorkshire authorities and the UK as a whole.
12 Census Data Intel

20
Figure 10: Proportion of Children in Child Poverty - March 2021
Source: Department for Education and Leeds City Council
Considering child poverty proportionally somewhat masks the true picture on the ground in Leeds, however. Looking at West Yorkshire, rates of child poverty are significantly above the national average. The rates of children in relative poverty before housing costs are deducted from income in Leeds and Bradford are 24% and 38% respectively. In Leeds this equates to 36,496 children under the age of 16 living in relative poverty. When you consider the administrative boundaries of the two cities, both of which are wide and include notably more affluent outer areas, we can reliably assume rates of child poverty in inner-city areas will be higher still. Bradford (48,100) has the second highest number of children in poverty behind Birmingham, Leeds the fourth highest number and Kirklees (25,553) the seventh most. The Leeds child population is also growing fastest in the localities considered most deprived according to IMD. Between 2012 and 2018 to overall Leeds population grew by 4% and the child population (age 0-17) grew by 7%. However, in the 10% IMD’s most deprived areas the child population grew by 13%, and in the 3% most deprived it grew by 17%13.
Safeguarding Between 2011 and 2020 (the latest nationally available data) there has been a 7% reduction in the number of children looked after in Leeds. Across the same period, the number of children looked after in England rose by 22%. Between March 2020 and March 2021, children looked after numbers fell from 1,346 (80.0 per 10,000) to 1,278 (75 per 10,000). 48 of the 1,278 children looked after are unaccompanied asylum seekers, compared to 60 at the end of March 2020. The 2020/21 national data will be available in the autumn of 2021.
13 ONS 2012-18 estimates

21
Figure 11: Children looked after at March 2020: Change from 2011 and Change from 2019
Source: Department for Education and Leeds City Council
Figure 12: Children looked after rates per 100k since March 2011
Source: Department for Education, March 2020
At the end of March 2021, 33 per 10,000 Leeds children were subject to a child protection plan (560 children in total). The latest nationally available data covers up to the end of March 2020 when the England rate was 43 children per 10,000.
Health
Infant mortality ‘Infant mortality’ is the death of a live-born baby before their first birthday. Infant mortality rates have seen a gradual downward trend over the period 2006-2019 in Leeds. The gap between deprived Leeds and the city-average has fluctuated but data for the most recent period (2017-19) has shown an increase. For Leeds overall infant mortality rates are close to regional and national averages. The latest

22
analysis confirms the need to help ensure that parents are well prepared for pregnancy and that families with complex lives are identified early and supported.
Figure 13: Infant Mortality Rate per 1000 births
Source: GP registrations and ONS mortality data
Child obesity Analysis of healthy weight in children shows a gap between the most and least affluent communities across the city (though ‘deprived Leeds’ and ‘least deprived Leeds’ in this data set equates to the most and least deprived 20% according to IMD 2019, as opposed to 10% in the rest of the analysis). The gap has slightly narrowed in recent years, although this is due to faster reduction in health weight in more affluent communities, rather than an improvement in low income areas. The gap grows further as children get older, although Leeds also does increasingly slightly better than regional and national averages too.
Figure 14: Obesity % Healthy Weight in 4 to 5 year olds
Source: NHS National Child Measurement Program dataset

23
Figure 15: Obesity % Healthy Weight in 10 to 11 year-olds
Source: NHS National Child Measurement Program dataset
Activity levels The Active Lives survey undertaken by Sport England shows us that in 2019/20, Leeds children were generally more active than the West Yorkshire average, with a higher proportion classed as active (av. 60+ mins of activity per day), and a lower proportion classed as less active (av. Less than 30 mins activity per day). Using the same metrics, Leeds children are less active than the England average.
Figure 16: Children’s levels of activity – Academic year 2019-20
Source: Sport England Active Lives Survey 2019/20
Breastfeeding Breastfeeding initiation rates in Leeds are lower than national rates but have increased since 2014; and improvements have been observed in deprived Leeds. Breastfeeding continuation rates (6-8 weeks) are better in Leeds compared to national rates, although have dropped a little since 2013/14 and no improvement in deprived Leeds. The White population in Leeds has the lowest breastfeeding

24
initiation and continuation rates of all ethnicities. Young mothers are also much less likely to initiate breastfeeding.
Figure 17: Breastfeeding Initiation rates
Source: Public Health England Child and Maternal Health Profile
Vaccinations The Leeds Measles Mumps and Rubella (MMR) immunisation level does not meet recommended coverage (95%). However, the city is still performing better than England overall. By age 2, 91% of Leeds children have had one dose, higher than the England average. By the age of five, only 87% of Leeds children have received their second dose of MMR vaccination which, while not on target, is still just higher than the England rate of 87%.
Figure 18: MMR vaccination coverage – one dose for 2 year-olds
Source: Public Health England Child and Maternal Health Profiles

25
Oral health Dental health is marginally worse in Leeds than England with more than a quarter (26%) of Leeds 5 year-olds having experienced dental decay compared to 24% in England.
Figure 19: Percentage of 5 year-olds with experience of visually obvious dental decay
Source: Public Health England Child and Maternal Health Profiles
Young people and alcohol Nationally, the rate of hospital admissions of children and young people for conditions wholly related to alcohol is decreasing and this is also the case in Leeds. The admission rate in the latest period is similar to the England average.
Figure 20: Admission episodes for alcohol-specific conditions under 18s
Source: Public Health England Child and Maternal Health Profiles

26
Mental health Nationally, the rate of young people being admitted to hospital as a result of self-harm is increasing. This is not the case in Leeds, where there is no significant trend, although the latest admission rates are worse than the England average. Nationally, levels of self-harm are higher among young women than young men. When considering mental ill-health overall, the Leeds rate of child inpatient admissions for mental health conditions at 73.8 per 100,000 is better than the England average, although it has risen more sharply in recent years. This data of course does not capture in full the broader mental health and wellbeing of young people across the city.
Figure 21: Hospital admissions for mental health conditions under 18s
Source: Public Health England Child and Maternal Health Profiles
Sexual and reproductive health There are approximately 10,000 births per year in Leeds - a third to women residing in deprived Leeds. There has been an increase in the proportion of births to Black, Asian and ethnic minority women since 2009, with ethnic minority groups overrepresented in deprived Leeds. There has also been an increase in births to non-British born mothers. In 2018, approximately 24 in every 1,000 girls aged under 18 in Leeds conceived. This is higher than the national and regional rates; with the majority of births being to mothers in deprived Leeds.

27
Figure 22: Under 18s conception rate
Source: Public Health England Child and Maternal Health Profiles
12% of women smoke while pregnant. Smoking in pregnancy rates are higher in Leeds than national rates and are significantly higher amongst women who are under 18 years old at time of delivery – with no improvement since 2014.
Education and learning Covid-19 has had a significant impact on children and their learning, including no national assessment prior to key stage 4 (GCSE). Young people taking GCSEs and A-Levels have received teacher-assessed grades in place of national examinations and there has been some increase in grades. National analysis assessing the differential impact of these changes on groups of young people suggests most previous gaps have remained constant, although they have widened slightly for free school meal eligible children and those from Gypsy Roma Traveller backgrounds. Further analysis assessing impacts in Leeds will follow. As a result of these unique factors, data used for the JSA is predominantly up to 2019. Leeds has a longstanding gap between more and less advantaged children achieving their potential, particularly at pre-school and primary, and particularly for our most disadvantaged children. These issues are very likely to have been exacerbated further by Covid-19. Overall, however, at the key nationally monitored stages of 2 and 4 Leeds children as a whole make reasonable to good progress in learning, comparable to their peers nationally at key stage 2 and above national rates in Leeds secondary schools.
Early years There have been some encouraging improvements in the proportion of children achieving the expected level in the early learning goals, and the mean average total point score for the lowest attaining 20% of learners is improving consistently and is now above national rates. In 2019, 66% of Leeds children achieved a good level of development, up slightly from 2018. However, against this indicator, Leeds remains behind national levels, but the gap has closed from 6.8 points in 2016 to 5.4 points in 2019.

28
Children are measured across 17 early learning goals (ELGs) and it is determined whether their skills are ‘emerging’, ‘expected standard’, or ‘exceeding’. In Leeds, the percentage of children ‘exceeding’ is consistently above national across all ELGs (except one, which is in line). However, there are more pupils in Leeds than national in the ‘emerging’ category for ‘reading’, ‘writing’, ‘numbers’ and ‘shapes, space and measures’. This indicates that, despite Leeds children having some of the highest attainment nationally, there is also a significantly high level of low attainers.
Figure 23: Early Years Foundation Stage Profile – children achieving a good level of development (2015 to 2019)
Source: Department for Education and Leeds City Council
Key stage 2 Results at the end of Key Stage 2 focus on a child’s attainment and progress in maths, reading and writing. Writing is based on teacher assessment, reading and maths on end of key stage tests. 62% of Leeds year 6 children achieved the expected standard in reading, writing and maths, compared to 65% per cent of children nationally. There was a 6% increase between 2017 and 2018 in the proportion of disadvantaged pupils gaining the expected standard in reading, writing and maths. However, this figure remained at 45% in 2019, still 6% points below the national level for disadvantaged pupils. There remains a gap of 26% in attainment between disadvantaged and non-disadvantaged pupils in Leeds, six points greater than the national gap between these cohorts.
Key stage 4 and beyond Headline measures at key stage 4 are based on the results of eight GCSEs or equivalent, including English and maths. The overall achievement is known as Attainment 8. In 2019, the average Attainment 8 score per pupil in Leeds was 45.1, which is slightly higher than in 2018 when it was 44.8. The gap to national narrowed slightly, from 1.8 points in 2018 to 1.6 points. Disadvantaged children in Leeds perform less well than their non-disadvantaged peers, gaining an average point score of 35.4, compared to 49.4. This is also below the national figure for disadvantaged pupils which stands at 36.8. 42% of Leeds pupils achieved a strong pass in English and maths (grade five of higher) in 2019, very slightly higher than in 2018. The national average for 2019 was 43%.

29
Figure 24: Key Stage 4 – pupils achieving a strong pass (2017 to 2019)
Source: Department for Education and Leeds City Council
At age 19 when young people are moving into adulthood, marginally over half of Leeds young people achieved a level 3 qualification in 2019, 7% lower than nationally. For level 2 marginally over three quarters achieved this level of qualification, 5.5% below national rates. For young people who were eligible for fee school meals at 16, 51% attained a level 2 qualification in 2019 and 25% Level 3. This reflects in Leeds gaps are wider for our less advantaged pupils as measured by FSM eligibility, evident at all ages.
Support for children with special educational needs
Leeds has an inclusive model, reflected in how funding is directed to schools, which contributes to lower rate of children having Education and Health Care Plans (EHC plans) relative to other local authorities, especially in the primary years. Just over 2% of the school age population attending school has an EHC plan, compared to 3% in Core Cities and almost 4% across England. Leeds like England is seeing significant increases in EHC plans. In January 2021, the number of plans maintained by Leeds City Council was 4,689, an increase of 350 on the previous year (or 8%). Growth is continuing and by June 2021 numbers had risen to 4,952.

30
Figure 25: EHC plans maintained by Leeds City Council, 2011 to 2021
Source: Department for Education SEN2 returns, January 2021
Leeds maintains a lower proportion of EHC plans in younger age groups than national averages and comparators – 2% for under-5s and 24% for ages 5-10. The reverse is true for older young people, with the 24% for 16-19 old and 14% for 20-25 both higher than national and comparators. The largest proportion of EHC plans in Leeds are within the 11-15 age group in 2021 (35%).
16% of all pupils who attend a primary school in Leeds are recorded as having a special educational need, 1% of whom have an EHC Plan. For secondary schools in Leeds 1% of secondary school pupils have an EHC plan and 12% are recorded as SEN support, 13% in total. The overall number of secondary school pupils with SEND has grown by 26% since 2016.
In Leeds maintained schools the most common type of need for those with an EHC plan is Autistic Spectrum Disorders and for those with SEN support Speech, Language and Communication needs. This is reflected in Leeds primary schools where the most prevalent SEN primary need is speech, language and communication needs at 41%, an increase in proportion for the past four years and greater than national and comparators. Social, emotional and mental health is the most prevalent SEN primary need in Leeds secondary schools at 25% of the cohort, this includes being the most common need for those with an EHC plan followed closely by autism. Considering SEND primary needs against deprivation some needs such as speech and language and moderate learning difficulties are weighted to more disadvantaged areas, other needs like autism spectrum disorder are reflected more evenly in all communities.
School attendance during Covid-19 School attendance has been severely disrupted due to Covid-19, with rates varying significantly in line with national regulations:
• Attendance was just below 2% from March to May 2020 as school was open to only children of key workers and vulnerable children.
• Attendance rose to 17% in June and July 2020 with school open to a small number of additional year groups.

31
• With school open as normal, attendance at the start of the 2020/21 academic year was 83%, affected by the collapse of ‘bubbles’.
• Attendance fell again to 20% in January 2021 when lockdown was reimposed.
• Since March 2021, attendance has risen back to 85%, although Covid-19 absences continue to affect this figure.
In the autumn term 2020/21 the number of school enrolments in Leeds that missed at least one session due to a Covid-19 related absence was 66.8%14. DfE analysis suggests an overall Leeds school absence rate of 5% plus an additional 9% due to Covid-19. For England, it was 5% and lower Covid-19 additionality of 7%. Leeds overall absence rate inclusive of Covid-19 was in line with the region. For autumn 2019 the Leeds absence rate was 5%.
Policy implications
• Covid-19 has had a major impact on children and young people, with the disruption to their
education and concerns regarding safeguarding and disengagement, particularly the most
vulnerable. However, it is perhaps the mental health of our young people that is of greatest
concern. Although on Leeds rates on indicators like child inpatient admissions for mental
health conditions are below national averages, they have risen more sharply in the city in
recent years. Responding to the mental health challenges increasingly facing young people
will be a key challenge going forward.
• Closing the educational attainment gap for the children and young people most likely to be
experiencing poverty and disadvantage remains a significant challenge. Promoting positive
engagement with education for young people and their families from the outset and
strengthening pathways to continued education, skills development and employment
opportunities are all likely to be needed.
• Linked to the point above, child poverty is at the root of many poor outcomes for children and
young people including education, health and wellbeing and even routes into care, and factors
influencing the scale and severity of child poverty in the city are broad-based. Strengthening
linkages between interventions and strategies aimed at young people and our wider approach
to inclusive growth will be vital in working to realise the full potential of our young people.
14 School Census

32
Section 3A: Living Well – Health and Wellbeing
Headlines
• Even prior to the Covid-19 pandemic, tackling poverty and inequality was central to our
approach, with evidence of an intensification of inequalities, often based in our most
disadvantaged communities and an increasing requirement for us and partners to respond
more collaboratively.
• The pandemic has exacerbated inequalities, with data establishing a link between number of
deaths and deprivation, driven by a combination of underlying health conditions including
smoking, obesity and limited opportunities to follow healthy-living, and exposure to the virus,
for groups such as key workers, those unable to work from home, those in low income or
multi-generational housing and those more reliant on public transport. Poverty is the
common factor in these drivers.
• The health-wealth gap risks becoming wider in the wake of Covid-19. Poverty and financial
insecurity, employment, our homes and the places we live and the air we breathe, all affect
physical and mental health directly. They also affect behaviours like being physically active,
smoking, having a poor diet and drinking too much.
• Over recent years, the influence of wider determinants of health and wellbeing have come
under sharper scrutiny, regardless of the pandemic. The 2019 study, Health Equity in England:
The Marmot Review 10 Years On, identified a range of concerns, which are mirrored in the JSA
analysis.
• A particular concern is the stalling of improvements in life expectancy for people living in low
income areas and growth in mental health issues across all communities.
• The proportion of adults reporting mental health issues increased during the pandemic, with
some groups particularly affected including: young adults and women; shielding older adults;
adults with pre-existing mental health conditions, and Black, Asian and ethnic minority adults.
• These mental health impacts are likely to continue as the economic impact of the pandemic
manifest themselves, with concerns about job security and debt levels likely to increase.
Our ambition articulated in the city’s Health and Wellbeing Strategy is that ‘Leeds will be a healthy and caring city for all ages, where people who are the poorest improve their health the fastest’. Even prior to the Covid-19 pandemic, tackling poverty and inequality was central to our approach, with evidence of an intensification of inequalities, often based in our most disadvantaged communities and an increasing requirement for us and partners to respond more collaboratively. The pandemic has exacerbated these long-standing and deep-rooted inequalities, with more and more data establishing a link between the most severe impacts of the pandemic and deprivation, driven by a combination of underlying health conditions including smoking, obesity and limited opportunities to follow healthy living, and exposure to the virus, for groups such as key workers, those unable to work from home, those in low income or multi-generational housing and those more reliant on public transport. Poverty is the common factor in both these drivers.

33
More than ever, realising our ambition requires improvements in all factors that support healthy lives: the social determinants - particularly employment and skills; living conditions - such as housing, air quality, access to green space; and healthy living - including physical activity levels, food choices, alcohol intake and smoking.
Immediate and direct health impacts of Covid-19 As stated in the Introduction to the JSA, producing an accurate analysis of the current and future challenges the city faces in this context is very challenging. Much of the data available is partial in nature or is yet to show the full effects of Covid-19., this is particularly true of health data, often with a delay in the availability of meaningful data. However, in terms of the immediate and direct health impacts of Covid-19, a wide range of primarily national analysis has been undertaken. In June last year Public Health England (PHE), published the findings of its review into how different factors such as age, sex and ethnicity affect Covid-19 risks and outcomes. Analysis undertaken by our Public Health team during the pandemic over the last year also drew some similar conclusions15. Both pieces of work confirmed that the virus’ impact mirrored existing health inequalities and, in many cases, increased them further, identifying those groups seemingly at most risk, specially:
• Older People - the largest disparity found was by age, of people diagnosed with Covid-19,
those who were 80+ were seventy times more likely to die than those under 40.
• Men – deaths of those diagnosed with Covid-19 are higher in males than females.
• People from disadvantage areas - mortality rates from Covid-19 in the most deprived areas
according to IMD were more than double the least deprived, for both males and females.
• Those from Black and ethnic minority communities - death rates from Covid-19 were highest
among people of Black and Asian ethnic groups.
• People in low-paid or low-skilled occupations - security guards, taxi drivers, chefs, care
workers and bus drivers are the occupations with the highest death rates involving
coronavirus.
• People with underlying health conditions - among deaths with Covid-19 mentioned on the
death certificate, a higher percentage mentioned diabetes, hypertensive diseases, chronic
kidney disease, chronic obstructive pulmonary disease and dementia.
The operational strain on health and social care have also seen significant analysis, with daily reports and regular dashboards produced to inform our collective response. Since March 2020 we have seen significantly higher excess deaths as a direct result of Covid-19 when compared to the 2015-2019 average (Figure 26). As of 14 June 2021, there have been 1,629 deaths recorded in Leeds with Covid-19 on the death certificate, and there have been 66,650 total cases in the city by the same date16.
15 COVID-19 Health Inequalities: Summary of Evidence and Recommendations, Leeds PH Team 16 GOV.UK Covid-19 Dashboard

34
Figure 26: Deaths in 4 week periods in comparison to average deaths 2015 - 2019
Source: Public Health Intelligence
Longer-term trends – the health / wealth gap Since the 2018 JSA, the impact of wider determinants of health and wellbeing have come into even sharper focus, notwithstanding the pandemic. The 2019 study, Health Equity in England: The Marmot Review 10 Years On, commissioned by the Health Foundation to mark 10 years on from the landmark Marmot Review highlighted a range of concerns:
• people can expect to spend more of their lives in poor health.
• improvements to life expectancy have stalled and declined for the poorest 10% of women.
• the health gap has grown between wealthy and deprived areas.
• place matters - living in a deprived area in the North of England is worse for your health than
living in a similarly deprived area in London, to the extent that life expectancy can be nearly
five years less.
The 2018 JSA mirrored many of these finding. The analysis set out in this section of the 2021 JSA again seeks to examine progress against a range of indicators over time, and also provides valuable baselines from which to assess progress, identify specific concerns, identify further lines of enquiry, and perhaps most importantly explore and strengthen links with the wider determinants of health and wellbeing. We will publish further analysis and reporting on the Leeds Observatory as it becomes available. The health-wealth gap risks becoming wider still in the wake of Covid-19. Poverty and financial insecurity, employment, our homes and the places we live and the air we breathe, all affect physical and mental health directly. They also affect behaviors like being physically active, smoking, having a poor diet and drinking too much.

35
Life expectancy
Figure 27: Female Life Expectancy (Life Expectancy Sharing)
Figure 28: Male Life Expectancy (Life Expectancy Sharing)
Source: GP registrations and ONS mortality data
Female life expectancy has stagnated in recent years, with the gap between deprived Leeds and the city average widening in the decade up to 2019. In deprived Leeds, the life expectancy at birth figure appears to have fallen back slightly in recent years, however, none of these changes are classed as statistically significant. In terms of wider comparisons, Leeds lags regional and national averages for female life expectancy. Male life expectancy has also remained constant in Leeds. Though life expectancy in deprived Leeds has seen a slight uplift since 2016-18. Once again none of these changes in deprived Leeds is statistically significant. Looking more widely, male life expectancy in Leeds also lags regional and national averages. Figure 29 below highlights the variations in life expectancy by ward across the city. It highlights the gap in life expectancy between of some of our most and least affluent areas as illustrated by a difference in life expectancy of 12 years for women and 11 years for men, between the ward of

36
Burmantofts and Richmond Hill in the inner city, and that of Adel and Wharfedale in the outer area. It is also important to note there will be differences in life expectancy within ward areas.
Figure 29: Ward / deprivation inequalities Male/Female
Source: GP registrations and ONS mortality data
In summary, the widely reported recent slowing in life expectancy gains at a national level are reflected in the latest data for the city. The data also confirms the stubborn gap in life expectancy between our most deprived and least deprived communities emphasizing the need to improve the socio-economic conditions in our most challenging communities.
Preventable mortality Preventable deaths are a measure of the success of Public Health interventions where deaths could have been prevented. Preventable mortality saw a steady decline at local, regional and national levels in the period up to 2019. The extent to which the direct and indirect impact of the pandemic has influenced this trajectory is not yet clear.

37
Figure 30: U75 mortality rate from causes considered preventable
Source: Public Health England (based on ONS source data)
Suicide rates Rates for persons (the rate for all people rather than male and female separately) show the clearest picture. The inequality gap is quite pronounced, though it appears to have closed in recent years. Clearly the socio-economic impact of the pandemic has clearly had some profound impacts on mental health. It is uncertain what extent these pressures affect suicide rates. Care needs to be taken in looking at Female rates of suicide due to the low numbers, However, male suicides, due to the larger number are more statistically reliable.
Figure 31: Suicide Rate (persons) FT is age standardised per 100,000 - Leeds

38
Figure 32: Suicide Rate (persons) FT is age standardised per 100,000 - Male/Female
Source: LCC PHI GP data and ONS mortality
Alcohol related admissions Alcohol related admissions as represented by hospital admissions have picked up over the last few years, with rates for males are far higher than for females. Leeds remains above regional and national averages though the gap is closing.
Figure 33: Rate of alcohol SPECIFIC admissions to hospital per 100,000
Source: Calculated by Public Health England: Population Health Analysis (PHA) team using data from NHS Digital - Hospital Episode Statistics (HES) and Office for National Statistics (ONS) - Mid Year Population Estimates.

39
Liver disease mortality The gap between deprived Leeds and the city average for liver disease mortality has narrowed over recent years, with a decline in rates in deprived areas and a slight increase in the overall Leeds average. City rates are above regional and national averages.
Figure 34: Alcoholic liver disease mortality, under 75
Source: LCC PHI GP data and ONS mortality
Respiratory disease mortality Respiratory disease mortality is much higher in deprived Leeds than the Leeds average, and is growing again. This inequality gap is related to factors such as smoking, workplace and air quality.
Figure 35: Respiratory mortality U75
Source: LCC PHI GP data and ONS mortality

40
Circulatory disease mortality Circulatory disease has seen a steady downward trend, most noticeably in our communities experiencing deprivation, with a closing of the gap between the overall city average. However, rates remain above regional and national rates.
Figure 36: Circulatory Disease Mortality U75
Source: PHI and Annual Population Survey (APS
Cancer mortality Again, a downward trend for cancer mortality, although the ‘deprivation gap’ is not closing. Leeds rates are significantly above regional and national averages.
Figure 37: Cancer Mortality U75
Source: PHI and Annual Population Survey (APS

41
Smoking prevalence Leeds prevalence according to PHE, and using the ONS mid-year estimate population, figures shows Leeds to be very close to the regional rate and not significantly higher than England. The trend is generally downward for Leeds with the ‘deprivation gap’ narrowing.
Figure 38: Proportion of Adults over 18 that Smoke
Source: PHI and Annual Population Survey (APS)
Smoking attributable mortality Because of the lower smoking prevalence there has been a slow reduction in mortality from smoking attributable deaths across all geographies.
Figure 39: Smoking attributable mortality aged 35+
Source: Public Health England

42
Obesity Levels of obesity as measured by those adults with a BMI over 25, city-wide rates have seen a decline in recent years, with rates in Leeds now well below regional and national rates. However, the rates for deprived Leeds have remained fairly constant, leading to an increase in the ‘deprivation gap’.
Figure 40: Excess weight in adults % of Adults who have a BMI of over 25
Source: Leeds PHI and GP data
Diabetes The incidence of diabetes in Leeds is also below regional and national rates. However, rates are increasing across the city and are now more in line with modelled estimates, with a significant ‘deprivation gap’ remaining.
Figure 41: Diabetes Directly Age Standardised Rates 17+
Source: Leeds PHI and GP data

43
Mental health Table xx reflects the growth in mental health issues in recent years, across all communities in the city. The data is largely for the pre-pandemic period, and in-line with wider national evidence, the incidence of mental health issues has grown across all areas.
Figure 42: Common mental health issues prevalence (all ages)
Source: Leeds PHI and GP data
According to the most recent analysis by the ONS17, the proportion of adults aged 18 and over reporting a clinically significant level of psychological distress increased from 21% in 2019 to 30% in April 2020, although rates have been ‘up and down’ in nature during the pandemic, coinciding with the periods of national lockdown and high Covid-19 cases followed by easing of lockdown and reducing cases. Key symptoms include anxiety, depressive symptoms, loneliness, sleep and stress. However, the overall trends mask variations within the population. The analysis shows that the mental health and wellbeing impact of the Covid-19 has been different for different groups of people:
• Young adults and women have been more likely to report larger fluctuations in self-reported
mental health and wellbeing than older adults and men.
• Older adults who were recommended to shield were more likely to report higher levels of
depression, anxiety and loneliness.
• Adults with pre-existing mental health conditions also were more likely to have increase in
mental health issues during the pandemic.
• Although there is less data available, Black, Asian and ethnic minority adults were more likely
to report higher levels of depression and anxiety, with Bangladeshi and Pakistani men
reporting the largest declines in mental health.
These mental health impacts are likely to continue as the economic impact of the pandemic manifest themselves, with concerns about job security and debt levels likely to increase.
17Covid-19: mental health and wellbeing surveillance report, ONS June 2021.

44
Policy implications
• The relationship between poverty and inequality, and poor health and wellbeing outcomes is
well understood. The pandemic has exacerbated this negative correlation. Loosening the
relationship will need to continue to be a primary focus of our combined efforts, from
prevention and promotion/enabling of more healthy living, to tackling wider determinants
such as employment, education, housing and the environment, and improving access to
health and care.
• The proportion of people experiencing mental health issues increased during the pandemic,
with some groups particularly affected such as: young adults and women; shielding older
adults; adults with pre-existing mental health conditions, and Black, Asian and ethnic minority
adults. This trend is set against a backdrop of an increasing recognition of wider mental health
challenges, including loneliness and social isolation. Clearly it will be important to continue to
focus on reducing mental health inequalities, improving mental health across all ages, and
working to promote flexibility, integration and responsiveness in service provision.
• A common theme, across all sections of this report, is stronger integration of strategies and
interventions aimed at both addressing key challenges, but also better realising opportunities.
This is particularly true in promoting health and wellbeing, where those factors, often
described as key determinants, influence options, choices and patterns of behaviour, which
in turn shape health and wellbeing outcomes. Building on the collaborative strength of our
Covid-19 response will be vital here, both between agencies and the third sector, but also
within communities.

45
Section 3B: Living Well – Thriving Communities
Headlines
• The pandemic is likely to have intensified inequalities across the city and highlighted the very
dynamic and multi-faceted challenges often seen in our most disadvantaged communities.
The council and partners need to respond more collaboratively – particularly at each end of
the age-spectrum.
• The pandemic has shown the best of Leeds communities with people supporting one another,
but it has also highlighted some weaknesses in our community resilience and rising
experiences of loneliness. How do we hold on to this stronger sense of neighbourliness to
overcome underlying challenges?
• National estimates of ‘relative poverty after housing costs’ when applied to Leeds equate to
almost 175,000 people living in relative poverty.
• More recently we have seen growth of in-work poverty, with an estimated 74,000 working
age adults across the city being from working households and living in poverty.
• Over recent decades, there has been a fall in overall levels of crime, a trend that looked to be
starting to level-off before the pandemic. During the peak Covid-19 restrictions there were
significant reductions in crime. However, there are growing concerns regarding domestic
violence and abuse during the pandemic, as well as incidences of anti-social behaviour in some
localities.
• Up to 70,000 Leeds citizens have typically volunteered in the city each year, but numbers have
dropped through the pandemic and confidence levels remain low in some communities.
Leeds is a growing and richly diverse city with people of different ages, backgrounds, cultures and beliefs living and working alongside each other. To build thriving communities we need strong local leadership rooted in partnership; we need to value and promote the voices of local people; we need to increase community conversations to resolve problems and conflict locally; and we need to continue to raise aspirations, creating better links to social and economic opportunities for everyone. Thriving communities are resilient, aware of their challenges but also their strengths and assets, with strong community infrastructure and local people being more engaged and empowered to overcome their own challenges and reduce unnecessary dependence on public services. Never more so have we seen the strength and perseverance of our communities than over the last 18 months. The Covid-19 pandemic has brough real emotional and financial hardship to too many families, but it has also seen Leeds’ community spirit come into its own – truly the compassionate city in action. The pandemic threw a spotlight on stubborn and long-standing inequalities in the city, with data increasingly establishing a link between direct health impacts and deprivation, driven by a combination of underlying health conditions: including smoking, obesity and limited opportunities to follow healthy living; and exposure to the virus: for groups such as key workers, those unable to work from home, those in low income or multi-generational housing and those more reliant on public transport. Poverty is the common factor in both these drivers.

46
Socio-economic inequality Leeds’ diversity is reflected across all its communities and neighbourhoods, with a rich tapestry of cultures and identities being a strength of the city and a key part of its story over decades. There is diversity in the physical identity of Leeds neighbourhoods too, with the city’s wider geography, industrial heritage and economic development influencing the sharp distinctions in housing mix and connectivity seen in different parts of the city. This combination of factors – physical, societal, cultural and economic – also drives many of the stubborn underlying inequalities experienced in Leeds. Often these can be seen on both a geographical and individual or community-centred basis, both of which result in poorer health outcomes for some parts of the population. This is illustrated by the city’s model for considering health inequalities contained within the Leeds Tackling Health Inequalities Toolkit.
Geography of inequality The divergence of economic characteristics – driven in part by Leeds’ geography – is arguably the most prominent factor in understanding inequality in the city and is perhaps more pronounced than in other core cities. Using IMD 2019 to illustrate the divergent economic wellbeing of the city highlights that although there are concentrations of relative deprivation, there are significant areas of the city which are relatively affluent.
Figure 43: Index of Multiple Deprivation 2019
Source: ONS – Indices of Deprivation 2019

47
Analysis across a range of indicators suggests that there was some slight intensification in the concentration of the most deprived and least deprived neighbourhoods across the city since the IMD 2015. However, the pattern of relative deprivation is long-established, with wider analysis of child poverty, educational attainment, health and wellbeing, housing and debt in the city also showing that the same areas are the focus of disadvantage and poverty in Leeds.
Communities of interest Not all inequality or disadvantage can be seen through a geographical lens, however. This is perhaps most pertinent when examining health inequalities – the unfair and avoidable differences in health across the population, and between different groups in society. While there may be concentration of health inequality in some of the city’s low income communities, individual factors remain crucial. To support better understanding of the health needs of the whole Leeds population, specific assessments are undertaken for communities of interest – groups of people who share a particular identity or experience – more at risk of experiencing poorer health outcomes. Needs assessments have been undertaken for Black, Asian and ethnic minority people, Gypsies, Travellers and Roma groups, people who are pregnant, women and others – all of which can be found on the Leeds Observatory. An assessment of the needs of people with sensory impairment will follow in the coming months. Throughout work compiling the JSA it has become evident further assessments may be required for more communities of interest, including but not limited to:
• Asylum seekers and refugees
- There are no accurate figures on the total number of people seeking asylum or
refugees living in Leeds. Approximately 850 asylum seekers are supported by the
Home Office in Leeds at any one time, but Leeds Asylum Seekers Support Network
(LASSN) advises based on their experience that this is far below the true size of this
community in the city, with many no receiving support or accommodation from the
Home Office. Third sector destitution services in Leeds work with at least 500 asylum
seekers per year who receive no official support and therefore do not appear in Home
Office figures.
- The health needs of refugees and asylum seekers are well-documented18, including
untreated communicable diseases, poorly controlled chronic conditions, maternity
care, and mental health and specialist support needs. In addition a sizeable minority
continue to experience physical injuries and trauma from mistreatment and torture.
- Asylum seekers and refugees can face additional barriers to accessing or receiving
suitable health care as a result of language barriers, poverty, impact of existing
trauma, or if they have no recourse to public funds in the UK.
• Sex workers
- While there are no accurate local figures, there are estimate to be more than 70,000
sex workers in the UK19. Between 2014 and 2021 a ‘managed approach’ model had
been in operation in part of Leeds to help meet specific challenges of street-based sex
work, including the health and wellbeing of sex workers. This approach has now
ended.
18 Unique health challenges for refugees and asylum seekers - Refugee and asylum seeker patient health toolkit - BMA 19 Prostitution (parliament.uk)

48
- Sex workers are at increased risk of ill-health, experiencing violence and substance
misuse and can face additional barriers in accessing health care through fear or
discrimination20.
• People who are homeless or sleeping rough
- According to MHCLG there were 1,523 households in Leeds either homeless or at risk
of being so21. Through the Covid-19 pandemic the council provided emergency
accommodation for over 1,000 people either sleeping rough or at risk of doing so.
- Homeless people, especially those alone, are likely to have complex health needs
including inter-related mental health, drug misuse and alcohol dependency
challenges. They are also at increased risk of injury, pneumonia, tuberculosis, dental
problems and hypothermia22.
There may also be a need to expand further on a wider range of health needs for some population groups already partially considered, for example the LGBTQ+ community.
Poverty Poverty underpins a range of poorer outcomes for people and families, a pattern we have seen exacerbated through the pandemic. Figure 44 illustrates the strong correlation between relative disadvantages and the impact of Covid-19 clearly, using the Index of Multiple Deprivation data from 2019, mapped against the rates of Covid-19 in local authority areas in the autumn of 2020.
Figure 44: Index of Multiple Deprivation 2019 and Total Covid-19 Cases Autumn 2020
Source: Indices of Multiple Deprivation (2019) and Leeds City Council (2021)
20 Covid-19: Health needs of sex workers are being sidelined, warn agencies | The BMJ 21 Statutory homelessness, local authority tables (MHCLG, July 2021) 22 22.7 HEALTH AND HOMELESSNESS_v08_WEB_0.PDF (local.gov.uk)

49
Poverty affects individuals, families and neighbourhoods in multiple ways, and it impacts people at different times in their lives. Child poverty is at the root of many poor outcomes for children, young people and their families. According to the latest poverty and child poverty figures released by the DWP in March 2021, for the period 2019/20, 36,500 children under 16 are in ‘Relative Poverty before Housing Costs’23, a rate of 24% in Leeds. Above the national rate of 19%, but similar to that of the rest of West Yorkshire, with the exception of Bradford, where the rate is 38%. More broadly, taking the Government’s national estimates for ‘relative poverty after housing costs’ and applying them to Leeds, a national average of 22% equates to almost 175,000 people living in relative poverty in Leeds.24 In addition the Inclusive Growth analysis confirms growth of in-work poverty for some people in recent years, estimating that over 74,000 working age adults across the city are from working households and in poverty.25 Data from the Leeds Food Aid Network suggests that almost 42,000 people accessed a foodbank during the 2019/20 period, an increase of almost 24% on the previous year.26 Fuel poverty levels have been reducing over time, the latest data from 2018 estimated that 10% of Leeds households were in fuel poverty (35,000 households), around 2,000 households fewer compared to the previous year. The city’s rate follows the national average.27
Leeds’ vibrant third sector There are over 1,500 registered charities in Leeds and more than 2,000 other informal, emerging or un-constituted third sector organisations. In total almost 10,000 people work in the Leeds third sector, supported by volunteers estimated to number between 40,000 and 70,000. Around one third of the registered organisations are working directly in health and care related contexts, while more than three quarters have impacts related to the wider determinants of health28.
Figure 45: Leeds Third Sector organisations by size and typical income
Source: Forum Central – State of the Leeds Third Sector (2021)
Many of the micro and small organisations operating in the city will have no paid employees, and few if any volunteers. They are often very local, community-based and run entirely by the trustees. Those involved in running organisations will very often have lived experience of the issues on which they’re focused, representing a vast network of specialist expertise based in communities and perhaps often
23 Leeds Poverty Fact Book 24 Relative and Absolute Poverty 25 In work poverty 26 Food poverty 27 Fuel poverty 28 State of the Third Sector in Leeds (Forum Central, 2020)

50
being underutilised. These organisations are key elements of the community infrastructure on the ground in places across Leeds, although the pressure they face due to their limited capacity can make direct engagement with them by larger organisations or public bodies challenging. Third sector organisations are the backbone of the city’s asset-based approach to community development. Community Care Hubs, Neighbourhood Networks and ABCD Pathfinder organisations have all become embedded in their local areas are represent national best practice methods for involving and supporting citizens and communities, and all have been crucial to the city’s response to Covid-19. Their presence in communities also develops and improves access to physical spaces for the benefit of the community. Covid-19 has presented the Leeds third sector with significant challenges, responding to increased need in their communities and with fewer volunteers (71% of organisations in Leeds experiences a drop in volunteers during 2020) able to support their work. Their financial health has been hard hit too, with more than a third of organisations not expecting to be financially sustainable in the medium term29.
Community resilience In Leeds, we take an asset-based approach in our communities. We want communities to recognise and be connected to the things, people and places locally which can support them in their day-to-day lives, empowering individuals and communities to overcome challenges independently, resolve local conflict and support one another, reducing the need for top-down public service interventions. Throughout Covid-19 we have seen great examples of community resilience with people coming together to look after their neighbours, distribute food, or act as virtual befrienders for people experiencing isolation. But we also know there has been a pandemic of loneliness, with associated impacts on mental health most significantly affecting younger age groups, people who are separated or divorced, and those already experiencing depression or greater emotion regulation difficulties30. There are three important pillars required for people to build up their independence and thereby collectively their local community resilience: having support from family; being an active participant in their community; and benefitting from friendship and social connection.
Family support Not everyone has access to family support, and we’ve seen through the pandemic that living in a single person household can significantly increase the chances of feeling lonely31. Based on figures for Yorkshire and Humber, we can estimate that around 110,000 people in Leeds are living alone32. Figures are rising, the ONS estimates that by 2039 nearly 1 in 7 people will be living alone in the UK with people in middle age and older people most affected33. More than a quarter of women who live alone today are aged 45-6434. In the absence of family support, other social ties and community engagement become increasingly important.
29 16-December-Leeds-Third-Sector-Resilience-Survey.pdf (doinggoodleeds.org.uk) 30 https://www.ncbi.nlm.nih.gov/pmc/articles/PMC7513993/ 31 ONS Opinions and Lifestyles Survey, April 2021 32 Calculated from ONS Labour Force Survey – Households by size and region, 2015-2020 33 The cost of living alone - Office for National Statistics (ons.gov.uk) 34 The-State-of-Ageing-in-2019.pdf (ageing-better.org.uk)

51
Civic participation People being actively engaged in the success of their local area is a good indicator of how connected they feel to their places, communities and the people around them. There are no reliable measures of civic participation for Leeds, so here we look two proxies – local election turnout and prosocial volunteering. Voter turnout from the two most comparable recent local elections shows a slight reduction in Leeds from 35% in 2014 to 34% in 2018, similar to and following the trend across England and higher than the average across Metropolitan areas. Turnout dropped further in 2019 to 31%, however this took place alongside European Parliamentary elections that had not been expected to take place, which may have affected overall levels of confidence.
Figure 46: Total percentage election turnout at comparable local elections in England
Source: Leeds Data Mill and the Electoral Commission
The majority of third sector organisations in Leeds rely on volunteers and the expertise of their trustees to deliver their services, with very few organisations with incomes under £500k registering more than one full time equivalent employee. However, providing a more detailed understanding of the scale and value of volunteering activity is more challenging due to the wide variation of roles volunteers fulfil, and the fact that volunteering rates fluctuate. Forum Central estimate that in normal times there are between 40,000 and 70,000 people volunteering in Leeds each year35 and other estimates include that 14% of adults in Leeds volunteered at least twice in 2018/1936. Throughout the pandemic volunteer rates have fallen with 35% of organisations not active with volunteers by May 2020. However, the picture is mixed with large number of new volunteers engaging, some for the first time, through new schemes being established to support pandemic response37. Restoring and growing previously established volunteering route and redirecting new volunteers into those routes is a shared policy challenge moving forward.
35 State of the Third Sector in Leeds (Forum Central, 2020) 36 Active Lives Adults, November 2018-19 37 Third Sector ResiliEnce in West Yorkshire & Harrogate (wyhpartnership.co.uk)

52
Social connections Good social connections are crucial to health and wellbeing, help to reduce loneliness, protect mental health, and encourage people to be more active in their daily lives. We have an ambition in Leeds for everyone to have good friends. Targeted interventions – like Linking Leeds social prescribing service – try to support better social connection for people across the city to improve health and wellbeing. Our ability to measure social connections is very limited and seeking mechanisms to gain greater reliable insight on this issue should be an intelligence priority moving forward. The national Community Life Survey estimates 66% of people meet up with a family member or friend at least once a week, and 85% communicate by phone or video call. It also estimates that 93% of people have someone they can call if they want to socialise38. However, if we apply those figures to Leeds that leaves around 40,000 adults without a solid social network.
Safe communities Making all our communities safe for everyone remains a central priority. The pandemic has both influenced patterns of crime and disorder, and people’s perception of safety and security. However, the West Yorkshire Police and Crime Commissioner ‘Your View’ survey responses to March 202039 reported that 84% of Leeds respondents felt 'safe' or 'very safe' in their local area, with Leeds feedback was the second most positive within West Yorkshire area. Over recent decades, there has been a fall in overall levels of crime, a trend that looked to be starting to level-off before the pandemic.
Figure 47: Crime rates per quarter for Leeds, January 2018 to March 2021
Source: data.police.uk, 2021
Immediately following Covid-19 there were significant reductions in acquisitive crimes including robbery and burglary, and although they have gradually increased since crime rates remain lower that pre-pandemic levels.
38 DCMS Community Life Survey 2020/21 39 Due to impacts of COVID pandemic, the OPCC survey has been put on hold since the March 2020 update
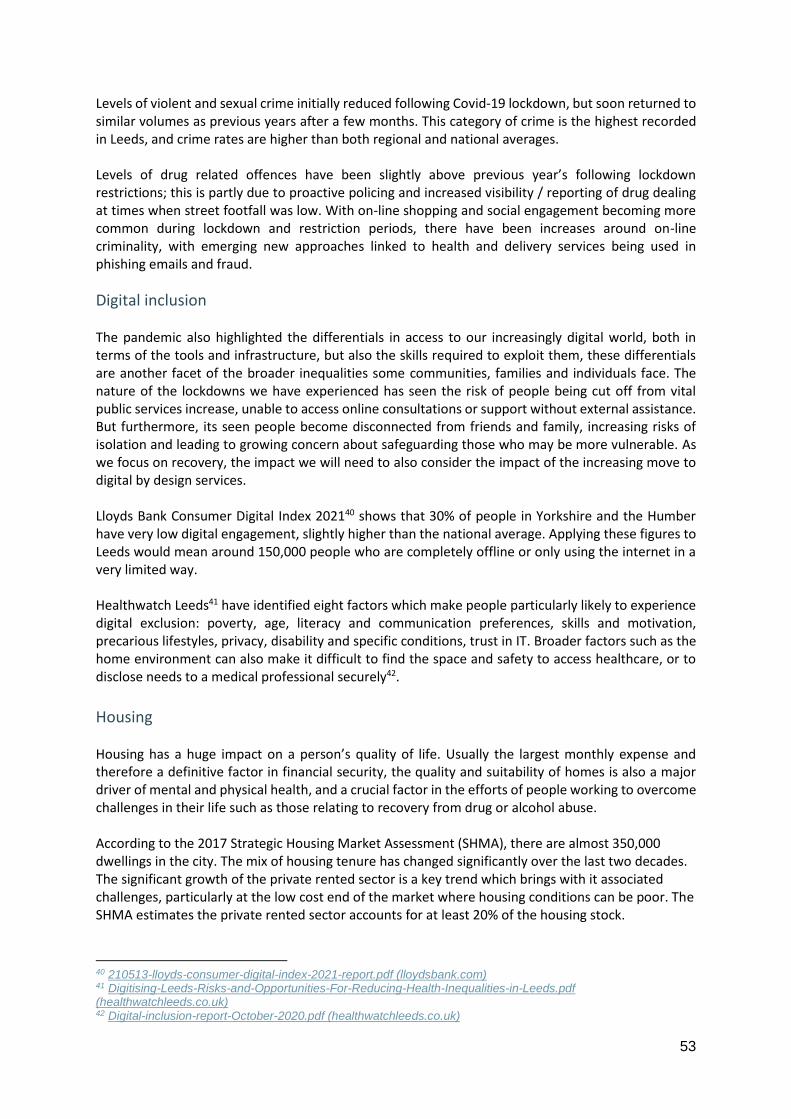
53
Levels of violent and sexual crime initially reduced following Covid-19 lockdown, but soon returned to similar volumes as previous years after a few months. This category of crime is the highest recorded in Leeds, and crime rates are higher than both regional and national averages. Levels of drug related offences have been slightly above previous year’s following lockdown restrictions; this is partly due to proactive policing and increased visibility / reporting of drug dealing at times when street footfall was low. With on-line shopping and social engagement becoming more common during lockdown and restriction periods, there have been increases around on-line criminality, with emerging new approaches linked to health and delivery services being used in phishing emails and fraud.
Digital inclusion The pandemic also highlighted the differentials in access to our increasingly digital world, both in terms of the tools and infrastructure, but also the skills required to exploit them, these differentials are another facet of the broader inequalities some communities, families and individuals face. The nature of the lockdowns we have experienced has seen the risk of people being cut off from vital public services increase, unable to access online consultations or support without external assistance. But furthermore, its seen people become disconnected from friends and family, increasing risks of isolation and leading to growing concern about safeguarding those who may be more vulnerable. As we focus on recovery, the impact we will need to also consider the impact of the increasing move to digital by design services. Lloyds Bank Consumer Digital Index 202140 shows that 30% of people in Yorkshire and the Humber have very low digital engagement, slightly higher than the national average. Applying these figures to Leeds would mean around 150,000 people who are completely offline or only using the internet in a very limited way. Healthwatch Leeds41 have identified eight factors which make people particularly likely to experience digital exclusion: poverty, age, literacy and communication preferences, skills and motivation, precarious lifestyles, privacy, disability and specific conditions, trust in IT. Broader factors such as the home environment can also make it difficult to find the space and safety to access healthcare, or to disclose needs to a medical professional securely42.
Housing Housing has a huge impact on a person’s quality of life. Usually the largest monthly expense and therefore a definitive factor in financial security, the quality and suitability of homes is also a major driver of mental and physical health, and a crucial factor in the efforts of people working to overcome challenges in their life such as those relating to recovery from drug or alcohol abuse. According to the 2017 Strategic Housing Market Assessment (SHMA), there are almost 350,000 dwellings in the city. The mix of housing tenure has changed significantly over the last two decades. The significant growth of the private rented sector is a key trend which brings with it associated challenges, particularly at the low cost end of the market where housing conditions can be poor. The SHMA estimates the private rented sector accounts for at least 20% of the housing stock.
40 210513-lloyds-consumer-digital-index-2021-report.pdf (lloydsbank.com) 41 Digitising-Leeds-Risks-and-Opportunities-For-Reducing-Health-Inequalities-in-Leeds.pdf (healthwatchleeds.co.uk) 42 Digital-inclusion-report-October-2020.pdf (healthwatchleeds.co.uk)

54
The private-rented sector across Leeds is complex. In Harehills and Chapeltown, there is a concentration of private-rented houses with a significant number of transient, often migrant, households. In contrast the private rental market in Headingley, Hyde Park and adjacent areas has traditionally been driven by demand from student households, resulting in considerably higher rents. In the City Centre, the rapid growth in the numbers of apartments developed since 2001 has created a new private rental market attracting yet another range of occupiers. Like most large cities, Leeds has a substantial amount of older housing, which tends to be concentrated in more deprived neighbourhoods. What sets Leeds apart from other places, though, is the large amount of back-to-back housing still in use across the city. Most of the 19,500 back-to-backs in Leeds are in the private-rented sector and were built before 1919. As a result, many of them are in poor condition, particularly in relation to their energy efficiency. The concentration of this type of housing, combined with the significant expansion of the private rented sector has a major impact on large areas of the inner city. The imperative to provide enough suitable housing for the Leeds population has been brought into sharp focus by the Covid-19 pandemic. The city has had success providing emergency access accommodation to 1,018 people either sleeping rough or at risk of doing so through the Everyone In initiative, ensuring there is somewhere safe for them to shelter and self-isolate if necessary. While at this stage only a short-term measure this has been a life-saving intervention and presents a landmark opportunity to re-examine nationally how we support those rough sleeping. Wider pressures on housing have been felt by a majority of people – whether that’s through limited or no access to a garden or outdoor space during lockdown, a lack of suitable indoor space for home workers or children home-schooling, or vulnerability to Covid-19 caused by overcrowded living conditions especially in multi-generational households. Emerging from the pandemic there are early signs of changing demand in the housing market as people who can look to expand their living space following the lockdown experience. The longer-term effects of the pandemic on the housing market remain unclear but will at least in part depend upon wider economic forces and changing workplace practices.
Housing delivery Providing the new homes required in a large and growing city like Leeds is an ongoing challenge. Doing so sustainably and in a way which creates thriving communities even more so. Leeds continues to perform well overall, building a net 3,386 new homes in 2019/20 including 58 units for older people and exceeding the core strategy target for the year. These are positive delivery numbers and despite the pandemic we should remain optimistic about this continuing. The mix of those new properties is important in creating sustainable communities, ensuring families are able to secure the size of property they require. In Leeds this means 80% of homes built should be either 2 (50%) or 3 (30%) bedroom, according to adopted core strategy targets. There continues to be a housing mix challenge in the city with an over provision of 1 bedroom and 4+ bedroom homes and an under provision of 2 bedroom and 3 bedroom homes. This is in part driven by a high proportion of development taking place in the city centre, where 1 and 2 bed apartments are predominantly delivered including as part of student accommodation schemes. However, Figure 48 shows that even when city centre schemes are excluded the overall picture of housing mix remains challenging. In 2019/20 while there was a small reduction after four years of expansion in the growth rate of the city’s largest homes, we still saw completion of 23% fewer 2 bedroom and 19% more 4+ bedroom units than targeted.

55
Figure 48: Housing Mix 2019/20 – proportion of all new housing by beds (excl. city centre schemes)
Source: Policy H4 Implementation Note (Leeds City Council, August 2020)
Affordable housing development There were more affordable homes delivered in Leeds in 2019/20 than in the previous two years and with 439 completions, slightly more than the 434 expected annually. However, the overall target for the year was 1,200 homes as a result of an existing backlog of delivery which will continue to roll forward. Part of this overall shortfall can be explained by the relatively poor contribution of Section 106 affordable units, caused largely by the proportion of student housing schemes within the completions as these do not require affordable housing. It is forecast that once more market housing is delivered, now supported by an adopted Site Allocations Plan, contributions from Section 106 will increase. We are also increasingly seeing examples of sites being delivered by partners with 100% affordable housing and we expect this to continue in future years.

56
Figure 49: Affordable housing units delivered in Leeds from 2012/13 to 2019/20
Source: Reported as part of MHCLG Local Authority Housing Statistics (Leeds City Council, 2021)
Housing costs In most households housing costs are the single largest monthly expenditure and their affordability therefore has a significant impact on household financial security. On average private renters spend the highest proportion of their income on their housing costs, 33% in 2018/19. In the same year that compared to 27% for those in housing association homes, 26% for council tenants and 18% for those buying with a mortgage43. The affordability of housing is of growing importance with evidence suggesting there is a continuing, often growing gap between the income of families and individuals and the cost of housing, both in terms of access to mortgages and the cost of the rented sector. When looking at the affordability of housing for those with earnings in the lowest quartile annually (Figure 50Error! Reference source not found.), we see a long term upward trend in housing costs across Leeds as a multiple of earnings – from a recent low of 5.28x in 2013 to 6.25x in 2020. While the affordability ratio is still well below the national average (skewed by higher housing costs in London and the South East) the gap is narrowing and we also see Leeds gradually diverging from the other West Yorkshire authorities, some of which have seen a broadly flat trend over the same period.
43 Section 1 (publishing.service.gov.uk)

57
Figure 50: Ratio of lower quartile house price to lower quartile gross earnings
Source: House price to workplace-based earnings ratio (ONS, March 2021)
There is a similar picture when we look at overall house prices (Figure 51), with increases in Leeds closely tracking the England average while clearly remaining lower in absolute terms. The other West Yorkshire authorities have seen slower growth in house prices since 2019 and therefore there is a gradually widening gap in affordability across our region.
Figure 51: Average house prices in West Yorkshire and England, year-end 2011 – 2020
Source: Mean house prices for administrative geographies (ONS, June 2021)
In the rental market, housing costs in Leeds are also considerably higher than in our neighbouring authorities. Figure 52 demonstrates that for an average family seeking to rent a two-bedroom property today, they’re facing roughly 23% higher costs than in Wakefield, 25% higher than in Bradford, 30% higher than in Calderdale and 31% higher than in Kirklees.

58
Figure 52: Median monthly rents (2020/21) for two-bedroom properties in West Yorkshire
Source: Private rental market summary statistics in England (ONS, June 2021)
The reasons underpinning this difference in affordability between Leeds and the other West Yorkshire authorities across all housing markets are complex and multi-faceted, but one likely contributor is the under provision of mid-sized properties across the city discussed earlier in this chapter. We had seen a local evidence over many years that the structure of the Leeds housing market can act as a barrier to upward progression for many families, with neighbouring districts such as Wakefield increasingly offering more affordable housing options within easy commute of workplaces in Leeds. We are likely to continue to see migration from Leeds to Wakefield and Bradford in particular along the M62 corridor as a result of these conditions. Longer-term impacts of insufficient affordable housing supply – both for purchase and rent – require further consideration, especially in terms of the impact on younger individuals and families seeking to get onto and then progress up the housing ladder in Leeds.
Policy implications
• The pandemic has highlighted the importance of community assets and personal connections
in building community resilience and ability to respond to challenges, with the worsening
mental health of people of all ages coming to the fore. Future policy will need to account for
ensuring the sustainability of the city’s third sector to support co-design of interventions,
strengthen social infrastructure across the city, and bring people together to guard against
the emerging rises in community tension often driven by national factors. Intergenerational
activities are crucial in achieving this.
• Housing costs are continuing to rise and become unaffordable for low income families,
exacerbated by a scarcity of the mid-sized homes sought by growing families and older people
looking to downsize within their community. This continues to have knock on impacts for
social mobility and risks locking more families into smaller, poorer quality housing at the lower
end of the market with associated health, wellbeing and educational implications.

59
• The spatial concentration of older housing, particularly back-to-backs, much of it in poor
condition, particularly in relation to their energy efficiency, combined with the significant
expansion of the private rented sector has a major impact on large areas of the inner city.
• Leeds’ rich diversity is a strength of the city, but it also reflects the different and changing
needs of parts of the population. Future analysis and policy development should be more
responsive to the circumstances of communities of interest as well as communities of
geography and condition-specific considerations, to support efforts to overcome long-term,
entrenched barriers to good health and wellbeing for everyone in Leeds.

60
Section 3C: Living Well - Climate Change
Headlines
• Climate change remains the single greatest threat to global health and Leeds is not immune
from its impacts.
• Achieving net zero carbon ambitions will be incredibly challenging and efforts should focus on
four fundamental issues for health: minimising air pollution, improving energy efficiency,
promoting healthy and sustainable diets, and prioritising active travel.
• Covid-19 has had a significant impact on all modes of transport – public transport, active
travel, car-usage – initial hopes of revolution are fading but could the pandemic period
signpost to an alternative model?
• There is significant uncertainty regarding future habits and choices – linked in part to
pandemic recovery, home-working and the potential changing geography of employment.
• The fundamental challenges around making a just transition towards a greener, more
sustainable economy and society remain, with future fiscal environment, Government policy
and patterns of consumer choice and behaviour all being key.
We are committed to making Leeds carbon neutral by 2030. We will do this by reducing the council’s carbon footprint and helping other organisations and individuals to do likewise, by reducing pollution and improving air quality, by building sustainable infrastructure and promoting active travel, and by promoting a less wasteful low carbon economy. Climate change can feel like an abstract concept to many people in Leeds, but on the ground its impacts are already being felt with more frequent flooding incidents and an increase in the number of very hot days threatening the wellbeing of citizens at both ends of the age spectrum. We want to be a city which is tackling poverty and inequality, and the negative effects of climate change and poor air quality tend to affect the already disadvantaged most both in Leeds and around the world. The scale of the challenge we face is huge, requiring a long-term global effort which drives technological advances alongside structural change in our economy and society. Large cities like Leeds can play a key role in embracing this change in the context of Covid-19 recovery – creating green jobs and developing more sustainable systems of travel. In doing this, we will focus most on the factors highlighted by Sir Michael Marmot as having the greatest impact on population health and wellbeing: minimising air pollution, building energy efficient homes, promoting sustainable and healthy food, and prioritising active and safe transport44.
Carbon emissions At the heart of our fight against climate change and its impacts is the imperative to limit increases in global average temperature to no more than 1.5 °C. Scientists estimate the world can emit no more than approx. 420 giga (i.e. billion) tonnes of greenhouse gases between 2018 and 2050. Leeds Climate
44 main-report.pdf (instituteofhealthequity.org)

61
Commission has calculated Leeds’s share of this on a per capita basis to be around 42 mega (i.e. million) tonnes – this therefore is the city’s overall science-based ‘carbon budget’. Since 2005 all the UK Core Cities have reduced their overall carbon emissions by around 40%, with Leeds hovering very slightly below the average. On a per capita basis, accounting for population change, Nottingham and Manchester perform most strongly having halved their emissions (50% and 49% respectively). Leeds has performed slightly less well and along with Newcastle has reduced emissions per capita by the least amount, although the city has still achieved a 42% reduction. Leeds Climate Commission estimates this to be a cut from 6.8 mega tonnes to 3.95 mega tonnes.
Figure 53: Reduction in carbon emission for UK Core Cities, 2005 to 2018
Source: Department for Business, Energy and Industrial Strategy
This suggests a much deeper and faster rate of emissions cuts are needed and have produced a roadmap containing five-yearly budgets. This shows a 70% cut relative to 2005 levels will be needed by 2025, rising to a 97% cut by 2040, to achieve a 100% cut by 205045. Strong focus on transport will be needed to achieve this by overcoming the relatively flat progress Figure 54 shows over the last decade.
45 Microsoft Word - Leeds Carbon Roadmap v4.docx (leedsclimate.org.uk)

62
Figure 54: Leeds CO2 savings by type and year, 2005 to 2018
Source: Department for Business, Energy and Industrial Strategy
The council itself, as an anchor institution with a large workforce and broad responsibilities, is a significant contributor to the city’s emissions. Key sources of the council’s emissions include street lighting, buildings and fleet – including the large ‘grey fleet’ as a result of workforce travel. To support the city’s climate ambitions, the council has already acquired the largest local government electric vehicle fleet in the UK, committed to halve the energy required for street lighting by transferring to LED and to replace gas in our city centre buildings with district heat. However, given the scale of the challenge clearly the council acting alone – or even alongside other anchor institutions – won’t be enough. Taking account of existing commitments, and working within the powers and resources currently available, we will not make sufficient progress to move the city to a net zero position by 2030. Figure 55 indicates the relative contributions to emissions of different sectors.
Figure 55: Sectoral contributions to CO2 emissions in Leeds in 2017
Source: Leeds Climate Emergency Update (Leeds City Council, January 2020)

63
Leeds City Council partnered with the World-Wide Fund for Nature (WWF) to better understand the average carbon footprint of residents. Based on data from 2100+ residents, it is estimated that the median carbon footprint of Leeds residents is approximately 10.1 tonnes of carbon dioxide equivalent (CO2e) every year whilst the mean is 11.38 tonnes. Both figures are significantly lower than the WWF’s estimated 13.56 tonnes CO2e average.
Notably, one twentieth of Leeds’ residents have a median annual carbon footprint double that of the average resident. More than 80% of this difference is related to emissions from travel.
Figure 56: Carbon footprint breakdown of residents with an LS postcode, according to WWF data (CO2e)
Source: Leeds Climate Emergency Update (Leeds City Council, January 2020)
Air quality Air pollution is associated with a number of adverse health impacts. It is recognised as the top environmental risk to human health in the UK, and the fourth greatest threat to public health after cancer, heart disease and obesity. It makes us more susceptible to respiratory infections and other illnesses and often most affects the youngest and oldest in society, alongside those with existing heart and lung conditions. Those communities most affected by poor air quality often mirror those averaging the lowest incomes, thereby exacerbating existing health inequalities. The annual health cost to society of the impacts of particulate matter alone in the UK is estimated to be around £16 billion46. It is estimated that up to 36,000 people die early every year as a result of long-term exposure to air pollution. In Leeds, exposure to particulate air pollution is estimated to cause 350 premature deaths annually. Leeds has six designated Air Quality Management Areas (AQMAs) where levels of nitrogen dioxide (NO2) – mainly coming from vehicle emissions – are closely monitored due to historically high levels. Most of the AQMAs are located in communities with higher levels of deprivation according to the IMD, as shown in Figure 57. While long term trends show an ongoing improvement in air quality, Figure 58
46 Abatement cost guidance for valuing changes in air quality (publishing.service.gov.uk)

64
shows that in 2019 there are locations in the city centre, the inner ring road, and within the Pool in Wharfedale AQMA that remain above the annual mean air quality objective for NO2.
Figure 57: Leeds six Air Quality Management Areas compared to IMD national rankings in 2019
Source: Indices of Multiple Deprivation (2019) and Leeds City Council (2021)

65
Figure 58: Trends in NO2 Annual Mean Concentrations at Leeds Air Quality Stations
Source: Air Quality Annual Status Executive Summary (Leeds City Council, 2020)
Aside from NO2, the other main pollutants of concern are particulate matter (PM). Sources of PM which most increase public exposure come from road transport; diesel engines; tyre, brake and road surface wear; and the burning of solid fuel such as coal-based ‘smokeless fuels’ and wood. PM is also emitted from industrial combustion plants and public power generation, and some non-combustion processes such as quarrying. Natural sources can include airborne dust and sea salt from vast distances away. Monitored levels of particulate matter, both PM10 and PM2.5 are well within UK air quality objectives and are close to the more stringent World Health Organisation guideline levels.
66
Figure 59: Trends in PM10 and PM2.5 Annual Mean Concentrations at Leeds Centre AURN and Headingley Kerbside AURN sites
Source: Air Quality Annual Status Executive Summary (Leeds City Council, 2020)
Energy efficiency and fuel poverty Poor energy efficiency increases the demand for fuel, leading to higher household costs and exacerbating the challenge we face to decarbonise the heat network. This in turn increases the likelihood of households falling into fuel poverty, unable to afford the costs of maintaining a warm home. The links between poor housing, low energy efficiency, fuel poverty and ill health are well established. Cold homes exacerbate problems associated with cardiovascular illness and the onset of stroke or heart attacks, while damp and poorly ventilated homes are associated with a range of respiratory and allergic conditions such as bronchitis, pneumonia, and asthma. Cold homes may also impact on conditions such as rheumatism or arthritis and adversely affect people with poor mobility, increasing the risk of falls and other household accidents. Living in a cold, damp and poorly ventilated home affects mental health – compounded by anxiety about high bills and fuel debt – and is likely to negatively impact the educational attainment of children and young people. In 2019, 57,529 Leeds households were considered to be in fuel poverty – 17% of all households and a significant increase from 10% in 2018 and 11% in 2017. Whereas the city had closely tracked the national average in the two previous years, the 2019 figures show fuel poverty notably higher in Leeds than the 13% of households nationally47. The council’s own housing stock, which represents around 16% of the city’s total housing, has an energy efficiency rating of C compare to D for housing overall in Leeds. Using the government’s Standard Assessment Procedure (SAP) methodology, which is based on the energy costs for heating, hot water, ventilation and lighting minus any savings from installed renewable energy systems like
47 Leeds Observatory Data Explorer, Department for Business, Energy and Industrial Strategy, June 2021

67
solar panels, Leeds council housing has a higher average rating than owner occupied, privately rented and registered social landlord housing in the city.
Figure 60: SAP rating by tenure for Leeds households in 2018
Source: Calculated using data from MHCLG (Leeds City Council, 2019)
While council housing in the city performs relatively well, privately rented homes are frequently the least efficient of all. The growth of the private rented sector in Leeds has exacerbated these challenges, particularly at the low-cost end of the market where housing conditions generally can be poor. There remains a significant policy for Leeds about how to improve conditions in the city’s 19,500 back-to-backs built before 1919, most of which are in the low-cost private rented sector.
Food The European Commission’s Joint Research Centre (JRC) estimates more than a third (34%) of all man-made greenhouse gas emissions are generated by food systems48. Yet despite the environmental cost of food production and transportation, increasing numbers of families in Leeds are experiencing food insecurity. While food insecurity in Leeds has been worsening over the last decade, the Covid-19 pandemic has brought this into sharp focus with 63,000 emergency food bags being distributed in the first 6 months of the pandemic. New research from the University of Sheffield suggests that in January 2021 almost 3% of adults in Leeds experienced hunger because they did not have enough to eat. A further 12% of adults struggled to put food on the table, while 8% were worried about having enough food49. Across all three metrics rates of food insecurity were considerably higher in Leeds’ neighbouring authorities and in some other Core Cities, although the nature of Leeds’ geographical boundaries may be masking the comparative severity of the issue in inner city and low-income communities. While strong voluntary and community sector presence, along with the council’s own involvement, means we have a good anecdotal picture of food insecurity and related issues in Leeds, obtaining
48EDGAR-FOOD: the first global food emission inventory | EU Science Hub (europa.eu) 49 New map shows where millions of UK residents struggle to access food | News | The University of Sheffield

68
accurate and reliable data remains challenging. Strengthening the local research and intelligence base on this issue will continue to be a policy priority in the coming years.
Transport Promoting walking, cycling and other forms of sustainable travel has a direct impact on the health and wellbeing of people in Leeds by encouraging healthy active lifestyles, and an indirect impact by reducing the emissions and poor air quality caused by vehicle exhaust fumes. Encouraging more people to leave their car at home more often will be one of the biggest contributors to achieving our net zero ambitions. Leeds’s legacy as ‘motorway city’ casts a long shadow but in more recent years there has been significant investment into active travel infrastructure, Leeds Station and other rail infrastructure, park and ride, and pedestrianisation of large parts of the city centre with more to come. All of this is contributing to a healthier, more liveable and sustainable city. We want to see over-reliance on private cars become a thing of the past as we aim to move people onto the lowest polluting and most sustainable form of transport possible for each journey taken. With 79% of total distance travelled in West Yorkshire being by car, there is more work to do.
Walking and cycling Walking levels by adults in Leeds are relatively high when compared with the UK’s Core Cities. Over the 3-year Sport England ‘active survey’ period 2016-19, Leeds ranked within the top 5 metropolitan authorities for all walking and the top 6 for walking for travel purposes. This is an improvement from the previous three years reflecting a rise in walking across all frequencies for both leisure and travel.
Figure 61: Leeds and Min/Max Core Cities - walking and cycling frequency 2018-19
Source: Department for Transport/Sport England Active Lives Survey 2019
Although Leeds ranks highest in West Yorkshire for cycling by adults it is lower in the Core Cities ranking. 14% of adults cycle at least monthly, while just 3% cycle five or more times per week.
0.0
10.0
20.0
30.0
40.0
50.0
60.0
70.0
Onceper
month
Onceper
week
Threetimesper
week
Fivetimesper
week
Onceper
month
Onceper
week
Threetimesper
week
Fivetimesper
week
Onceper
month
Onceper
week
Threetimesper
week
Fivetimesper
week
Onceper
month
Onceper
week
Threetimesper
week
Fivetimesper
week
Walking for leisure Walking for travel Cycling for leisure Cycling for travel
Core Cities - Min Leeds Core Cities - Max

69
Compared with the previous three-year period, cycling levels have risen slightly, linked to increased cycling for travel, while leisure cycling has remained unchanged.
Public transport As well as providing vital connection for communities and workplaces, public transport can also have great benefits for reducing emissions. Journeys taken by rail and bus not only take cars off the road, they also reduce congestion. As the public transport fleet across the city continues to become greener, with wider use of fully electric vehicles the primary route for this, these benefits will continue to grow. Recovering and then further growing usage of public transport will be a major public policy challenge of the coming months and years, following unprecedented reductions through the Covid-19 pandemic. Figure 62 shows bus and rail usage in the city since March 2019. The severe drop off was due to the first national lockdown, and although usage has risen since, it is still well below pre-Covid levels.
Figure 62: Weekly footfall at Leeds Station and Purchase of MCard and Concessionary Bus Tickets
Source: West Yorkshire Combined Authority, 2021
What’s clear above is that throughout the pandemic we have consistently seen bus usage recover faster than rail usage. While there is as yet no hard evidence to explain the reasons behind this, we might look to the average user of each form of transport and the ability of people to work from home. Bus usage is often driven by necessity for people with lower incomes, and likely less able to work from home, requiring transport to work or education. The relatively higher cost of rail travel dictates the average train user comes from a relatively higher socio-economic background50, and is more likely to have spent the Covid-19 pandemic working from home.
50 Transport and inequality (publishing.service.gov.uk)
-
200,000
400,000
600,000
800,000
1,000,000
1,200,000
1,400,000
1,600,000
1,800,000
2020 2021
Tota
l un
its
per
wee
k
Rail - Leeds Station Footfall Bus - Mcard and Concessionary Tickets

70
Further study of trends as we exit the pandemic will be required to inform future public transport policy discussions.
Access to green space Parks and green spaces play a role in mitigating climate change by directly helping to reduce carbon dioxide in the atmosphere, reduce the effects of extreme weather events, and build more resilient habitats to help sustain species and food production. Access to green space is also well evidenced to be associated with positive mental health outcomes, including reduced levels of depression, anxiety and fatigue at all stages of the life course51. Fields in Trust found that parks and green space save the NHS an estimated £111m per year based solely on reduced GP visits52. However, the benefits are not shared equally as across England low income communities have less available quality public green space with negative health implications for the people who live there. Leeds has 4,000 hectares of green space including 70 public parks (7 major city parks and 63 local community parks). Leeds parks and green spaces are well visited; research by University of Leeds in 2016 found 91% of residents surveyed had visited a park within the preceding year, with an estimated 45 million adult visits to all Leeds parks and green spaces that year53. The main reasons given for visiting a park were closely related to mental and physical health benefits: fresh air, walking, nature and wildlife, to relax and think. Leeds parks are generally seen as very accessible – 96% of people felt their main park is easy or very easy to get to, and 69% visit the park closest to where they live. However, people over 75 or with a disability were significantly less likely to visit a park or green space. Figure 63 shows a generally positive picture in terms of the accessibility of parks and public green space to communities across Leeds, with most of the city being within 500m and longer distances being largely limited to the outermost areas of the Leeds boundary. There are however fewer accessible public green spaces to some of the lowest income inner-city communities, posing a challenge about how green space is contribution the city’s ambition to “improve the health of the poorest fastest”.
51 Improving access to greenspace: 2020 review (publishing.service.gov.uk) 52 Revaluing-Parks-and-Green-Spaces-Summary.pdf (fieldsintrust.org) 53 LEEDS PARKS SURVEY: FULL REPORT

71
Figure 63: Average distance to nearest park, public garden or playing field
Source: Ordnance Survey Open Greenspace
A similar picture emerges when examining access to private gardens. While 85% of properties in Leeds have a garden (96% of houses and 53% of flats), the rates significantly reduce in lower income MSOAs54.
Policy implications
• Leeds has set a very challenging net zero carbon target in recognition of the contribution the
city should make to tackling climate change. While progress has been made, it is clear that to
move towards the target bolder and more wide-ranging interventions would need to be
developed in the coming years, with the local authority, health system and other anchor
organisations carrying responsibility as major contributors to overall emissions.
• Public transport usage reduced to very low levels due to Covid-19 and while it has started to
recover, passenger numbers remain far lower than pre-pandemic. Recovery rates are not
uniform, with rail usage recovery lagging behind bus usage. Further analysis over the coming
months is required to inform future policy decisions, balancing current and future demand for
public transport alongside climate change and the need to reduce use of private cars.
• The analysis highlights areas that might be prioritised in efforts to embrace the just transition
to a green economy and to create green jobs while tackling long standing social challenges
54 Access to gardens and public green space in Great Britain - ONS, April 2020

72
affecting the health and wellbeing of low income families – including reducing fuel poverty by
improving energy efficiency, further enhancing access to green space, and over the longer
term building a more sustainable food system for the city and wider region.

73
Section 4: Working Well - Inclusive Growth
Headlines
• Covid-19 has had obvious impacts on the city’s economy and labour market. The pandemic
exacerbated the inequalities within our communities and had immediate economic
consequences with the rapid expansion of home-working and acute impacts on hospitality,
retail, local consumer services.
• The repercussions of these factors were felt in the first instance by young people and low
earners with knock-on consequences for family debt. Women have also been
disproportionately impacted as the often dominate employment in the sectors hardest hit.
• However, the city has strong foundations from which to recover, based on the economic
growth and expansion over the last two decades with a diverse, knowledge-based economy,
though longer-term concerns regarding low productivity and the nature of recent job growth
remain.
• An estimated 413,000 people work in Leeds, of which around three quarters work in the
private sector, making Leeds one of the top cities nationally in terms of its private sector
workforce. Strong employment growth, pre-pandemic, has maintained the city’s employment
rate above national and regional averages.
• As the economy recovers, Leeds is likely to continue be the main driver of economic growth
for the city-region, with a strong, diverse and knowledge-rich employment base. These
strengths, linked to the city’s universities and teaching hospitals, are major innovation assets
for Leeds. Leeds also performs well in terms of business start-ups, with strong growth in digital
and medical technologies, telecoms and creative industries.
• Despite our high levels of employment and doing relatively well in terms of productivity per
worker, economic output growth has only been mid-table amongst the core cities in recent
years. This could be due to recent employment and output growth being in ‘lower
productivity’ sectors e.g. consumer services.
• There continues to be strong growth in quality jobs associated with digital, health and social
care, and professional and managerial roles.
Economic impact of Covid-19 Covid-19 has had profound and immediate impacts on the city’s economy and labour market. The pandemic has shone a spotlight on the inequalities within our communities. Prior to Covid-19, tackling these inequalities was central to our approach, our approach to recovery is still guided by our ambitions for a strong economy, a compassionate city, and zero carbon, with tackling poverty and inequalities as the overriding priority. The city has strong foundations from which to recover, experiencing economic growth and expansion over the last two decades with a diverse economy, with strengths in key sectors and a concentration of knowledge-based jobs. However, immediately pre-Covid-19, like other core cities, there were some

74
concerns regarding low productivity and that many of the new jobs being created being in relatively low-skilled, low-paid work in consumer services. The pandemic has had some immediate and obvious effects, with restrictions resulting in an overnight adoption of home-working and a severe impact on hospitality, retail, local consumer services. The city centre saw a major reduction in footfall. The consequences of these factors were felt in the first instance by young people and low earners with knock-on consequences for family debt. Women have also been disproportionately impacted as they often dominate employment in the sectors hardest hit. The degree to which these changes on the economy and labour market will be sustained is uncertain. Some believe that the pandemic has simply accelerated changes to patterns and geography of employment that were inevitable, however, there is clearly a latent demand to return to more familiar patterns of employment and leisure, for which Leeds is well-placed to respond. As we move out of restrictions, opportunities to reopen the economy will continue and grow. Although the full legacy of the pandemic will become clearer as we move forward, as set out above, primary concerns focus on the pandemic’s impact on exacerbating inequalities, particularly amongst our most diverse and disadvantaged communities, young people, and women in the labour market.
Employment Latest ONS estimates suggest that 413,000 people work in Leeds, of which around three quarters are employed in the private sector, making Leeds one of the top cities nationally with a working population employed in the private sector. Indeed, Leeds has witnessed very strong private sector growth since 2010, which in turn has maintained the city’s employment rate, with 80% of the working age population in employment, well above regional and core city averages. 55
Figure 64: Employment Rate – 16-64 – Core Cities – Jan 2020 to December 2020
Source: ONS (Annual Population Survey)
This strong employment performance is mirrored in the city’s pre-Covid -19 unemployment rate which was consistently below regional and national rates and the lowest of the core cities. 56
55 Employment Rate – file includes further charts and data for employment rate by gender, age, ethnicity, occupation and industry. 56 Unemployment Rate – file includes further charts and data for unemployment by gender and age.

75
Figure 65: Unemployment Rate - 16-64 - Core Cities (January 2020 – December 2020)
Source: ONS (Annual Population Survey)
Although the official labour market estimates cover the early period of the Covid-19 pandemic, the annual nature of the statistics disguise the effects of the pandemic on employment. Timelier unemployment related claimant counts show claimants in Leeds doubled from 18,000 to 36,000 between March 2020 and April 2021, taking the claimant rate from 3% to 7%.57 Although the claimant rate is only slightly higher than regional and national rates and lower than most core cities, Leeds has experienced higher growth compared to regional and most core city counterparts since Covid-19, perhaps reflecting the harder hit on larger, city economies. The growth in the claimant count, i.e. those in receipt of unemployment-related benefits, appears to have hit the youngest in the labour market most acutely, chiming with wider national analysis and business feedback, which suggests younger people and women in the labour market have been hardest hit by the lockdown. However, the implementation of the furlough scheme might mask some of these impacts on the claimant count (in January 2021, 51,800 employments were still furloughed in Leeds making up 14% of working adults.58).
57 Claimant Count 58 Coronavirus Job Retention Scheme

76
Figure 66: Growth in Claimant Count during the Pandemic by gender and Age (March 2020 to Feb 2021)
Source: DWP (StatXplore)
Leeds has also been perhaps insulated from the worst impacts of lockdown on the labour market, as a relatively high proportion of the city’s workforce have been able to work from home. Figure 67 below draws on work undertaken by the Centre for Cities, suggesting Leeds has had a higher incidence of homeworking and low furlough than many other towns and cities. Although this may be a potential issue if homeworking becomes pre-dominant going forward.
Figure 67: Working from home and furlough rates across UK
Source: Centre for Cities

77
Earnings In many ways the earnings of Leeds workers reflect the relative strength and diversity of the city’s economy. Overall, the average weekly earnings for those working and living in Leeds are above the regional average and close to the national average at £488 per week for the workplace population and £491 per week for the resident population. The gap between workplace and resident earnings is low in Leeds compared to other core cities. While cities like Birmingham, Manchester and Liverpool have higher average earnings for the workplace population compared to Leeds, Leeds has higher earnings for the resident population. Average earnings have been increasing since 2011, with growth for the resident population in Leeds has been higher compared to the workplace population. However, overall, growth in earnings in Leeds appears to have lagged most other core city rates.59 Figure 68: Median weekly pay 2020 – ASHE
Source: ONS (Annual Survey of Households and Earnings)
However, this relatively strong performance in earnings at a city-wide level masks some significant inequalities in the labour market. This is linked to the expansion of relatively low skilled jobs (see below) and flexible employment practices. It is estimated that around 12,000 people are on zero hour contracts in Leeds, in 2011 only 0.5% of employees were on zero hour contracts this has risen to 3% in 2019.60 For some people, the city’s strong employment rate, rather than providing a route out of poverty, has resulted in a continual struggle to get by, despite being in employment. It is estimated that around 74,000 (14%) working age adults across the city are affected by in work poverty61. In addition, an estimated 18% (62,000) of the employed resident population earned less than the Living Foundation’s Living Wage in 2020.62 In terms of the gender pay gap, Leeds pay gap is slightly less than the national and regional averages, tough the gap remains significant.
59 Median earnings 60 Zero hour contracts 61 In work poverty 62 Living Wage

78
Figure 69: Average Weekly Earnings by Gender 2020
Source: ONS (Annual Survey of Households and Earnings)
Skills and occupational change The qualification profile of the city’s workforce is higher than national and regional averages, with 47% achieving NVQ level 4 or equivalent and two-thirds qualified at level 3 or above. This reflects the concentration of professional and managerial occupations in the city. In contrast to our strong knowledge base, 4% have no qualifications lower than regional and national averages.63
Figure 70: Qualifications January 2020 to December 2020
Source: ONS annual population survey
63 Workforce qualifications
£0
£100
£200
£300
£400
£500
£600
Leeds Yorkshire & The Humber Great Britain
Male Female
4% 7% 6%5%
6% 6%10%
11% 10%
14%
18%17%
20%
20%18%
47%37%
43%
0%
10%
20%
30%
40%
50%
60%
70%
80%
90%
100%
Leeds Yorkshire And TheHumber
Great Britain
NVQ4 and above
NVQ3
NVQ2
NVQ1
Other Qualifications
No Qualifications

79
Clearly, the pandemic has had immediate and major effects on the labour market. However, it is the extent to which these effects are a further acceleration of underlying trends that is of interest, where in response, primarily to new technologies, there has been a ‘hollowing-out’ of skilled and semi-skilled occupations, traditionally in the manufacturing sector, but now increasingly across a wider range of sectors. In recent years this has been accompanied by growth in both high skilled, high valued jobs in the knowledge-based sectors, and lower skilled, lower income jobs often in consumer-services (see Figure 71 below).

80
Figure 71: Employment Change in Working Sectors and Occupations between 2010 and 2020
Source: ONS (Annual Population Survey)
That said, the last decade has seen strong employment growth, this has been most marked in professional and technical occupations in the city, higher than regional and national growth, the same also for managerial occupations. Skilled and personal services also increased, while sales, operatives and elementary occupations reduced at a faster rate than regionally and nationally.64 Looking at employment by industrial sector, banking, finance and insurance services have seen growth, recovering from the effects of the 2008 financial crisis. Public sector employment and jobs in other services have also witnessed strong growth, perhaps driven in part by the expansion in the health sector. Even manufacturing saw strong performance.
Business performance – growth, diversity and productivity Leeds is well-established as the main driver of economic growth for the city-region, and has key strengths in financial and business services, advanced manufacturing, health and creative and digital industries, with a strong knowledge-rich employment base. These strengths linked to the city’s universities and teaching hospitals are major innovation assets for Leeds. Leeds has also performed well in terms of business start-ups in recent years, with strong growth in digital and medical technologies, telecoms and creative industries.
64 Occupation change

81
Covid-19 has brought unprecedented changes, accelerating trends around digital transformation, remote working, and the shift from the high street to on-line retail. The extent to which these changes are sustained and develop pose huge questions for Leeds and major cities more broadly, and will need to be a key theme of our analysis. The initial impacts of Covid-19 restrictions were immediate and significant, with home-working, furlough and the changes in consumer patterns resulting in a major drop—off in economic activity in the city centre. Leeds was particularly affected in comparison with our neighbouring economic centres across the city-region, though in-line with other core cities. However, although still early days, economic activity is increasing significantly as restrictions ease, with data suggesting that Leeds’ bounce-back is faster than neighbouring localities. The relative diversity of the Leeds economy has been a key asset in the city’s resilience to economic shocks, with the city being able to retain its manufacturing strength as well as consolidate its position as a major centre for finance and business services, during previous downturns. It is likely that this diversity will be a key factor as we recover from the pandemic. However, as stated above, pre-Covid-19 there were some concerns around slowing growth and low productivity, with a key source of many of new employment being relatively low-skilled, low-paid work in consumer services. Leeds is not alone in these trends, although Leeds does relatively well in terms of productivity per worker (GVA per head), perhaps a reflection of our significant knowledge-based economy, consistently being the strongest performing core city after Bristol. Although it is perhaps more challenging to assess economic performance at a local level, based on available data, the official GVA statistics, suggest our economic output growth has only been mid-table in relation to core cities in recent years, perhaps a hangover from the 2008 financial crisis, since when key sectors particularly in financial and business services have faced prolonged challenges. Figure 72: Annual Growth Rate in nominal gross value added (GVA)
Source: Office of National Statistics
Figure 73 below illustrates the relationship between employment and productivity in England’s core cities, by indexing employment rates and GVA per head. Bristol performs relatively well against both indicators, Leeds benefits from a strong employment rate, whereas Manchester has relatively strong GVA performance.

82
Figure 73: Productivity vs Employment – TO DO: update table with latest GVA/Employment data
Source: Nomis, ONS
Policy implications
• Clearly the most immediate challenge is the work to ensure a strong recovery from the impact
of the pandemic. As we move beyond the immediate response, longer term recovery and
growth against the goals of resetting and renewing the economy. A focus on skills and life-
long learning will be a central element here, not only on young people (vital as they are), but
also on those people who will need to renew their skills as the world of work continues to
change.
• In the longer-term, we will need to build resilience and continue to work with partners and
stakeholders in working towards our aspirations to deliver Inclusive Growth - labour market
accessibility, business innovation and expanding the green economy are all likely to be key
areas.
• More specifically, the pandemic has had some immediate effects, with restrictions resulting
in an overnight adoption of home-working and a severe impact on hospitality, retail, local
consumer services. The city centre saw a major reduction in economic activity, though some
suburbs and satellite towns experienced a mini boom. The consequences of these factors
were broadly twofold: in the first instance young people, women and low earners were more
likely to be furloughed or at risk of unemployment, as they often dominate employment in
the sectors hardest hit; secondly, for a time the economic geography of the city was impacted,
with the combination of restrictions, but most notably home-working changing the patterns
Birmingham
Bristol
Leeds
Liverpool
Manchester
Newcastle Upon TyneNottingham
Sheffield
0
10
20
30
40
50
60
70
80
90
100
0 10 20 30 40 50 60 70 80 90 100
Ind
exed
Gro
ss V
alu
e A
dd
ed (
per
hea
d)
>
Indexed Employment Rate - Working Age >
83
of economic activity. The extent to which two broad factors are sustained as we recover is
uncertain, though we will need to continue to track these issues.

84
Section 5: Ageing Well - Age-Friendly Leeds
Headlines
• The 50+ population has grown by an around 30,000 over the last 20 years, future growth in
the older populations will be fastest amongst the 80+, who are expected to see a 50% increase.
• It is a widely held perception is that our older population live in the less-disadvantaged, outer
areas of the city. However, the largest concentration of the older population is found in our
communities most likely to be experiencing deprivation. Changes in housing choice and
tenure, together with longer-term demographic trends mean this concentration may grow in
future, with potential impacts on service provision.
• The older population is also becoming more diverse, as the wider demographic trends are
increasingly reflected in our older generation. Although perhaps too early to be definitive, the
socio-economic profile of our older population may also be changing, with house-ownership
less dominant, and people working longer over a more varied career pattern. Older people
from diverse ethnicities, cultures and communities of interest who share a particular identity
or experience, can also face specific challenges as their established networks and support
diminish over time.
• At 65 people in Leeds can expect to live half of the rest of their life free of disability or in good
health, and half of it with a disability or in poor health.
• Women from the most affluent parts of the city are set to live 14 years longer than those from
the least affluent, the gap for men is 12 years. Life expectancy rate for both genders are below
regional and national averages.
• There is a link between deprivation and frailty, with the proportion of people living with frailty
within the most deprived communities identified according to IMD almost three times higher
than those who live in the least deprived.
• Older people have been the most impacted in terms of direct health consequences by the
pandemic through deaths, hospitalisations and longer-term health issues. Older people were
also more likely to have to shield during national lockdowns and Covid-19 waves, leading to
both deconditioning and an increase in mental health issues.
• The number of older people in employment has risen over the last 20 years reflecting the
wider trend of an ageing population. This ageing workforce presents both challenges and
opportunities, not least how we capture and exploit the experiences, skills and potential of
older workers.
• Half of all unpaid carers in Leeds are aged 50+, which equates to almost 40,000 unpaid carers.
Women are four times more likely to stop working as a result of their caring responsibilities,
which is likely to have an impact on their income and mental wellbeing.

85
Leeds wants to be a place where people age well: where older people are valued, feel respected and appreciated, and are seen as the assets they are. The opportunities and challenges presented by an ageing population are well-rehearsed, but people in and approaching later life often make a positive contribution to our communities – through the skills and knowledge that they bring, high levels of volunteering, acting formally and informally as community connectors, intergenerational interactions, unpaid caring roles, and through the skills and experience they bring to their workplaces. Equating ONS national data average household expenditure data and household estimates to Leeds, 50+ aged households could contribute £120 million a week to the economy, however, we also know that many people are ageing with multiple long-term health conditions with inequalities disproportionately affecting the most disadvantaged in our city. Inequalities in older age are cumulative and have a significant impact on a person’s health, wellbeing, and independence. This section draws on data currently being collated in the production of Leeds State of Ageing Report, which will be available on the Leeds Observatory when completed. The report aims to provide data and stories about what it is like to grow older in Leeds, to inform debate and shape priorities. Once completed, the report will be used to refresh the Leeds Age-Friendly action plan.
Demography and housing A more comprehensive population overview is set out in Section 1, however, the latest 2019 ONS projections estimate that the population of people aged 50+ in Leeds stands at over 250,0000 or a third of the city’s population. The gender breakdown is generally equal for the age groups, with the exception of the over 70 age groups, where the proportion of females starts to increase. In terms of population growth, the over 50 population has grown by an estimated almost 30,000 between 2001 and 2019, a 12% to 17% increase in each of the 50 plus age groups, much of the city’s population growth has been concentrated in these age groups. In terms of future projections to 2041, the 50-59 population is projected to reduce and there will be little change for the 60-69 population, however the 70+ population is projected to substantially grow, with fastest growth amongst the 80+, which is expected to see a 50% increase.
Figure 74: Leeds Population Change (Past and Forecast) 1991- 2041
Source: Census 1991-2011, ONS Mid Term Population Projections 2019

86
Figure 75 below looks at the distribution of the population by broad age group against the deciles of Index of Multiple Deprivation, with decile 1, being communities likely to be experiencing highest levels of deprivation, and decile 10 the lowest. Although a widely held perception is that our older population live in the less-disadvantaged, outer areas of the city (see below), the largest concentration of the older population is found in decile 1. Given the potential impact on housing choice and mobility outlined below, this concentration may grow in future, with potential impacts on service provision.
Figure 75: Age Profile for each Index of Multiple Deprivation 2019 decile (including 80+)
Source: ONS Mid Term Population Projections 2019/IMD 2019
In terms of diversity, according to analysis based on GP registrations (the population has changed since the 2011 Census) the vast majority of those aged over 65 in Leeds identify as White British (85%), while 12% Black and ethnic minority communities and 3% as Other.65 The 65+ BME population is made up of a large Other White population (40%), which mainly covers European groups. This is followed by the more settled migrant groups such as Indian (14%), Pakistani (11%) and Black Caribbean (6%). The increasing diversity of our population has been focused on younger people (over a third of school-age young people identify as BME, see Section 2) clearly this will feed through the age-profile going forward. Figure 76 maps the 50+ population across the city and shows that is predominantly based in the outer suburbs of Leeds. This is perhaps a function of how the housing market has functioned over the past decades, with a pattern of younger new buyers entering the housing in relatively modest housing and then being able to ‘move up the housing ladder’, resulting in the majority of the 50+ households, being owner/occupiers, often in the outer areas. The extent to which this pattern of housing tenure, and subsequent influence on the geographic age-profile of our population, will continue is uncertain. The shortage of affordable housing and wider growth in house-prices, the expansion of the private rented sector, and limited opportunities for downsizing of existing homeowners within their communities are all factors likely to influence future patterns of housing tenure. Overall, the vast majority of our older people live in mainstream housing, rather than specialist housing, such as a retirement community or sheltered accommodation.
65 Leeds core data: Public Health 2020

87
Figure 76: Distribution of 50+ aged population, 2019
Source: ONS Mid-Term Population Projections, 2019
Healthy ageing Section 3 provides an overview of Health and Wellbeing in the city, however, there are clearly specific issues affecting our older age group and the services they require, with people living longer, but disability free life expectancy decreasing, and the overall proportion of people in the older population growing.
Life expectancy At 65, on average, people in Leeds can expect to live half of the rest of their life free of disability or in good health, and half of it with a disability or in poor health. Section 3 examined patterns of life expectancy by gender and geography, with some stark findings, women from the most affluent parts of the city are set to live 14 years longer than those from the least affluent, the gap for men is 12 years. Life expectancy rate for both genders are below regional and national averages.
Physical health conditions Again Section 3 assesses progress against a wide range of indicators. The challenges facing the older age groups in the city , largely mirror those of the wider population, reaffirming the health-wealth gap that risks becoming wider in the wake of Covid-19, with a continued focus required on prevention and support for those with health conditions in those communities experiencing poverty.

88
Frailty There is also clear link between deprivation and frailty. The proportion of people living with frailty within the most deprived decile according to IMD is almost three times higher (22%) than those who live in the least deprived decile (8%)66. In addition to this, the average age of people with frailty gradually increases from the most to least deprived areas. People from Black, Asian and Minority Ethnic backgrounds in deprived areas become frail, on average, 11 years younger than those people from a white background in the least deprived areas67. Leeds has the highest number of admissions due to falls compared to other cities in the region, and one of the highest rates. The rate of admissions due to falls has generally reduced since 2010, however the numbers have stayed stable since 2012/13.
Mental health Over 20% of older people (65+) are identified as having a common mental health illness (CMHI) in Leeds, with higher numbers amongst females than males68, these rates are similar to other core cities according to Public Health England data. It is widely accepted that the pandemic has had a significant impact on people’s mental health, however, PHE data suggests that on average, the mental health and wellbeing of older age groups appear to have been less affected so far during the pandemic, with the impact most acute amongst young people. More broadly, older people aged 60+ have tended to report better mental health and wellbeing during the pandemic. However, these differences in the population’s mental health were present before the pandemic.
The impact of Covid-19 Undoubtedly older people have been the most significantly impacted in terms of direct health consequences by the pandemic through deaths, hospitalisations and longer-term health issues. Older people were also more likely to have to shield during national lockdowns and Covid-19 waves.
66 Leeds Data Model, NHS Leeds CCG 2021 67 Leeds Data Model, NHS Leeds CCG 2021 68 PH Intelligence Team Data, 2021

89
Figure 77 below highlights the age differentiation of the health impact of Covid 19 at the peak of the pandemic.
Figure 77: Covid-19 health impacts by age group, Oct-Dec 2020
Source: PHI 2021
However, there have also been economic and employment impacts, according to the ONS Labour Force Survey and local business intelligence employees aged 50+ were more likely to report working fewer hours than usual (including none), than those aged under 50 years, with those aged 65 years and over the most likely to say they had worked reduced hours during the pandemic. According to national HMRC data, over a quarter of those furloughed are aged 50+, with a third of older workers on furlough thinking there is a 50% chance or higher that they will lose their job when the scheme ends.
Active, included and respected
Loneliness, engagement and mobility are often particularly issues for our older people. Keeping
active, connected to family and friends and being valued contributors to their community are all key
factors in promoting health and wellbeing.
Active
In terms of physical activity, according to analysis undertaken to support the Get Set Leeds initiative,
65+ year olds self-reported the highest levels of physical activity per week (4.03 days compared to
3.64 days in 45 – 64 year olds); despite 65+ having the lowest levels of self-belief that they can be
active and the lowest levels of motivation to be active.
Older citizens also have the highest rates of volunteering (peaking for 65-74 year olds). There are an
estimated 40,000 over aged 55+ in Leeds who have volunteered at least once in the last 12 months.

90
Included Older people feel more safe where they live, a greater sense of belongingness to their neighbourhoods and are more likely to feel that people from different backgrounds get on and that that they have someone to rely on if they have a serious problem69. However, nationally, older people with a long-term condition and those who ‘find it difficult to get by’ are less likely to feel connected to their community70 .
The increasing diversity of our older population going forward may also need consideration. People
from diverse ethnicities, cultures and communities of interest often have well established identities,
social networks and support frameworks, from places of worship, to clubs and social networks. These
mechanisms can diminish as younger generations become more assimilated, and as a result,
individuals can become more isolated. The ageing Irish immigrant population is an example of how
this can play out in the city.
Loneliness
In terms of social isolation, only a small number of older people surveyed in Leeds in the year to
November 2020 said they often feel lonely. But only around 1 in 4 people age 75+ said they never felt
lonely – as did almost 1 in 3 people age 55-74. These are both lower than the national average.71
Loneliness is higher in the communities more likely to experience disadvantage.
Figure 78: Loneliness by age group, Leeds 2020
Source: Active Lives Survey, 2020
Mobility and accessibility The ability to travel is crucial in maintaining independence and staying connected. How older people travel is affected by a variety of factors ranging from the travel options where they live to how safe and accessible places are to their health and deprivation levels.
69 Understanding Society 2014/15, ONS 70 The Ageing Better NatCen Panel Homes and Communities Study, 2020 71 Active Lives Survey, 2020

91
Data for drawn from concessionary bus passes show some inequalities in Leeds. Around two thirds of
people aged 60+ own a concessionary travel pass72. People aged 60+ living in the city’s low income
communities are twice as likely to use their concessionary fare pass than those in the more affluent
areas. However, it has been estimated that greater proportions of those who live in the most
disadvantaged areas of Leeds do not claim a pass that they are entitled to.
Data from WYCA’s West Yorkshire Transport Survey shows that people aged 65+ are less likely to have
access to a frequent bus within 400m compared to younger age groups. Only 8% of people age 65+
in West Yorkshire live within 400m of a frequent bus. This may be particularly important for women –
who are more likely to have mobility issues than men.
Ease of access to essential services, like health services and groceries, becomes increasingly important
as people get older. In Leeds, the average travel time by foot or public transport to a food store is 8
minutes, to the nearest hospital is 33 minutes, and to the nearest GP is 11 minutes.73
Figure 79: Average travel time to GP by foot or public transport by LSOA
Source: Health & Social Care Information Centre/Dept of Transport
72 WYCA, Concessionary Fares Data, 2021. 73 https://www.gov.uk/government/statistical-data-sets/journey-time-statistics-data-tables-jts#journey-times-to-key-services-jts01

92
Employment and Learning
Labour market In Leeds, there are an estimated 121,400 people aged 50+ in employment making up 26% of the workforce74. This equates to half of all people aged 50+ that are in employment. The proportion of older people in employment has risen over the last 20 years reflecting the wider trend of an ageing population, locally and nationally. This ageing workforce presents both challenges and opportunities, not least how we capture and exploit the experience, skills and potential of older workers. The increase in older workers, masks the large number of people who are still falling out of work prematurely. According to the Centre for Ageing Better, regularly identified labour market barriers include ageism in recruitment, lack of flexibility from employers, insufficient support for their health conditions and managing caring responsibilities. However, as the population continues to age, and many people remain economically active for longer, there will be an increasing need to refresh and develop skills and learning, to reflect the changing nature of work. Although there is limited data on levels of lifelong learning amongst older workers, older people aged over 65 are four fifths less likely to be learning than adults aged under 2475. Clearly there is a challenge and opportunity for employers and training providers to respond.
Caring and carers According to the latest Leeds Carers Health Needs Assessment, half of all unpaid carers in Leeds are aged 50+, which would equate to almost 40,000 unpaid carers. One fifth of all carers are aged 65+ and one third are aged 50-64. As this latter group are of pre-retirement age it may be that a number of those aged 50-64 are managing their caring role alongside employment responsibilities, which could place them under additional stress and pressure, and negatively impact on their own health and wellbeing. According to Carers UK, women are four times more likely to stop working as a result of their caring responsibilities, which is likely to have an impact on their income and mental wellbeing Covid-19 has meant that more people than ever are providing unpaid care and are doing so for longer periods of time. The suspension of services such as day clubs and lunch clubs, has meant carers have little chance of a break, even for a few hours per day. The closure of leisure centres and community clubs meant opportunities for social interactions and activities that improve health and wellbeing were more limited. During the pandemic carers were fearful of allowing outside help/carers to enter the home. These impacts will be seen amongst older carers maybe caring for a spouse in their own home or those who provide care to older people:
Policy implications
• The city’s population is ageing, with the 80+ age group growing fastest. The older population
is also becoming more diverse, as the wider demographic trends are increasingly reflected in
our older generation. Although perhaps too early to be definitive, the socio-economic profile
74 Office for National Statistics (2020a), Labour Force Survey. https://www.ons.gov.uk/surveys/informationforhouseholdsandindividuals/householdandindividualsurveys/labourforcesurvey 75Learning and Work Institute (2019), Adult Participation in Learning Survey 2019.

93
of our older population may also be changing, with house-ownership less dominant, and
people working longer over a more varied career pattern. Future service provision will need
to take account of these factors.
• The pandemic highlighted the deep-rooted inequalities in health and wellbeing outcomes.
These inequalities are also reflected in how we age, with significant variations in life
expectancy and healthy life-expectancy across the city. We also know that many older people
are more likely to have multiple long-term conditions with socio-economic inequalities being
a key influencing factor. The changing nature of the demography of older people highlighted
above may increasingly influence these trends going forward.
• Older people make up an increasing proportion of the workforce, presenting both challenges
and opportunities, not least how we capture and exploit the experience, skills and potential
of older workers. As the working population continues to age, there will be an increasing need
to refresh and develop skills and learning, to reflect the changing nature of work.
• Half of all unpaid carers in Leeds are aged 50+, with an increasing number managing their
caring role alongside employment responsibilities, which could place them under additional
stress and pressure, and negatively impact on their own health and wellbeing. The pressure
on services, exacerbated by Covid-19, has meant that more people than ever are providing
unpaid care and/or volunteering and are doing so for longer periods of time, indeed these
carers/volunteers are increasingly vital in supporting service provision.

94
Section 6: Implications of the Analysis This section brings together the policy implications drawn from the thematic analysis, it also attempts to identify and link common themes to inform priorities and subsequent strategies and interventions, but also seek to inform a more consolidated and collaborative response. A response that is set against a more intense ’perfect storm’ of increasing challenges and resulting service demands, combined with continued pressure on resources, together with raised expectations from service consumers as restrictions ease. Running through all these implications is the requirement to continue to strengthen our collaborative approach, underpinned by joint working, working with our communities and increased co-design.
A Changing City: Population Trends
• The city’s population has continued to become more diverse, in terms of age, countries of
origin and ethnicity. There is a more work to do in understanding and responding to the
relationship between ethnicity, deprivation, social mobility and health and wellbeing.
• The city’s population is ageing, with the 80+ age group growing fastest. The older population
is also becoming more diverse, as the wider demographic trends are increasingly reflected in
our older generation. Although perhaps too early to be definitive, the socio-economic profile
of our older population may also be changing, with house-ownership less dominant, and
people working longer over a more varied career pattern. Future Age-Friendly Leeds work as
well as other service provision will need to take account of these factors.
• In terms of young people, the birth-rate ‘bulge’ of the last decade has fallen back, beginning to be reflected in a fall in demand for school reception places. However, the ‘bulge’ cohorts are now beginning to go through secondary school, with significant mid-term implications for post-16 education and skills support and routes of entry into the labour market. All this against the backdrop of the economic impact of the pandemic, that has been acutely felt by young people.
• It is too soon to assess any full impact of exiting the EU on patterns of immigration and/or on some existing communities. However, early indications suggest that economic immigration from the EU has slowed, with some evidence of skills and labour shortages feeding through to the local economy and potential longer-term implications for the inclusive growth agenda.
Starting Well - Child-Friendly Leeds
• Covid-19 has had a profound impact on children and young people, with the disruption to
their education and concerns regarding safeguarding and disengagement, particularly the
most vulnerable. However, it is perhaps the mental health of our young people that is of
greatest concern. Although on Leeds rates on indicators like child inpatient admissions for
mental health conditions are below national averages, they have risen more sharply in the city
in recent years. Responding to the mental health challenges increasingly facing young people
will be a key challenge going forward.
• Closing the educational attainment gap for the children and young people most likely to be
experiencing poverty and disadvantage remains a significant challenge, particularly in helping
them realise their full potential and promoting social mobility. Building positive engagement

95
with education for young people and their families from the outset and strengthening
pathways to continued education, skills development and employment opportunities are all
likely to be needed.
• Linked to the point above, child poverty is at the root of many poor outcomes for children and
young people including education, health and wellbeing and even routes into care, and factors
influencing the scale and severity of child poverty in the city are broad-based. Strengthening
linkages between interventions and strategies aimed at young people and our wider approach
to inclusive growth will be vital in working to realise the full potential of our young people.
Living Well – Health and Wellbeing
• The relationship between poverty and inequality, and poor health and wellbeing outcomes is
well understood. The pandemic has exacerbated this negative correlation. Loosening the
relationship will need to continue to be a primary focus of our combined efforts, from
prevention and promotion/enabling of more healthy living, to tackling wider determinants
such as employment, education, housing and the environment, and improving access to
health and care.
• The proportion of people, experiencing mental health issues increased during the pandemic,
with some groups particularly affected such as: young adults and women; shielding older
adults; adults with pre-existing mental health conditions, and Black, Asian and ethnic minority
adults. This trend is set against a backdrop of an increasing recognition of wider mental health
challenges, including loneliness and social isolation. Clearly it will be important to continue to
focus on reducing mental health inequalities, improving mental health across all ages, and
working to promote flexibility, integration and responsiveness in service provision.
• A common theme, across all sections of this report, is stronger integration of strategies and
interventions aimed at both addressing key challenges, but also better realising opportunities.
This is particularly true in promoting health and wellbeing, where those factors, often
described as key determinants, influence options, choices and patterns of behaviour, which
in turn shape health and wellbeing outcomes. Building on the collaborative strength of our
Covid-19 response will be vital here, both between agencies and the third sector, but also
within communities.
Living Well – Thriving Communities
• The pandemic has highlighted the importance of community assets and personal connections
in building community resilience and ability to respond to challenges, with the worsening
mental health of people of all ages coming to the fore. Future policy will need to account for
ensuring the sustainability of the city’s third sector as a key anchor to support co-design of
interventions, strengthen social infrastructure across the city, and bring people together to
guard against the emerging rises in community tension often driven by national factors.
Intergenerational activities are crucial in achieving this.
• Housing costs are continuing to rise and become unaffordable for low income families,
exacerbated by a scarcity of the mid-sized homes sought by growing families and older people
looking to downsize within their community. This continues to have knock on impacts for

96
social mobility and risks locking more families into smaller, poorer quality housing at the lower
end of the market with associated health, wellbeing and educational implications.
• The spatial concentration of older housing, particularly back-to-backs, much of it in poor
condition, particularly in relation to their energy efficiency, combined with the significant
expansion of the private rented sector has a major impact on large areas of the inner city.
• Leeds’ rich diversity is a strength of the city, but it also reflects the different and changing
needs of parts of the population. Future analysis and policy development should be more
responsive to the circumstances of communities of interest as well as communities of
geography and condition-specific considerations, to support efforts to overcome long-term,
entrenched barriers to good health and wellbeing for everyone in Leeds.
Living Well - Climate Change
• Leeds has set a very challenging net zero carbon target in recognition of the contribution the
city should make to tackling climate change. While progress has been made, it is clear that to
move towards the target bolder and more wide-ranging interventions would need to be
developed in the coming years, with the local authority, health system and other anchor
organisations carrying responsibility as major contributors to overall emissions.
• Public transport usage reduced to very low levels due to Covid-19 and while it has started to
recover, passenger numbers remain far lower than pre-pandemic. Recovery rates are not
uniform, with rail usage recovery lagging behind bus usage. Further analysis over the coming
months is required to inform future policy decisions, balancing current and future demand for
public transport alongside climate change and the need to reduce use of private cars.
• The analysis highlights areas that might be prioritised in efforts to embrace the just transition
to a green economy and to create green jobs while tackling long standing social challenges
affecting the health and wellbeing of low income families – including reducing fuel poverty by
improving energy efficiency, further enhancing access to green space, and over the longer
term building a more sustainable food system for the city and wider region.
Working Well - Inclusive Growth
• Clearly the most immediate challenge is the work to ensure a strong recovery from the impact
of the pandemic. As we move beyond the immediate response, longer term recovery and
growth against the goals of resetting and renewing the economy. A focus on skills and life-
long learning will be a central element here, not only on young people (vital as they are), but
also on those people who will need to renew their skills as the world of work continues to
change.
• In the longer-term, we will need to build resilience and continue to work with partners and
stakeholders in working towards our aspirations to deliver Inclusive Growth - labour market
accessibility, business innovation and expanding the green economy are all likely to be key
areas.

97
• More specifically, the pandemic has had some immediate effects, with restrictions resulting
in an overnight adoption of home-working and a severe impact on hospitality, retail, local
consumer services. The city centre saw a major reduction in economic activity, though some
suburbs and satellite towns experienced a mini boom. The consequences of these factors
were broadly twofold: in the first instance young people, women and low earners were more
likely to be furloughed or at risk of unemployment, as they often dominate employment in
the sectors hardest hit; secondly, for a time the economic geography of the city was impacted,
with the combination of restrictions, but most notably home-working changing the patterns
of economic activity. The extent to which two broad factors are sustained as we recover is
uncertain, though we will need to continue to track these issues.
Ageing Well - Age-Friendly Leeds
• The city’s population is ageing, with the 80+ age group growing fastest. The older population
is also becoming more diverse, as the wider demographic trends are increasingly reflected in
our older generation. Although perhaps too early to be definitive, the socio-economic profile
of our older population may also be changing, with house-ownership less dominant, and
people working longer over a more varied career pattern. Future service provision will need
to take account of these factors.
• The pandemic highlighted the deep-rooted inequalities in health and wellbeing outcomes.
These inequalities are also reflected in how we age, with significant variations in life
expectancy and healthy life-expectancy across the city. We also know that many older people
are more likely to have multiple long-term conditions with socio-economic inequalities being
a key influencing factor. The changing nature of the demography of older people highlighted
above may increasingly influence these trends going forward.
• Older people make up an increasing proportion of the workforce, presenting both challenges
and opportunities, not least how we capture and exploit the experience, skills and potential
of older workers. As the working population continues to age, there will be an increasing need
to refresh and develop skills and learning, to reflect the changing nature of work.
• Half of all unpaid carers in Leeds are aged 50+, with an increasing number managing their
caring role alongside employment responsibilities, which could place them under additional
stress and pressure, and negatively impact on their own health and wellbeing. The pressure
on services, exacerbated by Covid-19, has meant that more people than ever are providing
unpaid care and/or volunteering and are doing so for longer periods of time, indeed these
carers/volunteers are increasingly vital in supporting service provision.